1
2
3
4
5
6
7
8
9
10
11
12
13
14
15
16
17
18
19
20
21
22
23
24
25
26
27
28
29
30
31
32
33
34
35
36
37
38
39
40
41
42
43
44
45
46
47
48
49
50
51
52
53
54
55
56
57
58
59
60
61
62
63
64
65
66
67
68
69
70
71
72
73
74
75
76
77
78
79
80
81
82
83
84
85
86
87
88
89
90
91
92
93
94
95
96
97
98
99
100
101
102
103
104
105
106
107
108
109
110
111
112
113
114
115
116
117
118
119
120
121
122
123
124
125
126
127
128
129
130
131
132
133
134
135
136
137
138
139
140
141
142
143
144
145
146
147
148
149
150
151
152
153
154
155
156
157
158
159
160
161
162
163
164
165
166
167
168
169
170
171
172
173
174
175
176
177
178
179
180
181
182
183
184
185
186
187
188
189
190
191
192
193
194
195
196
197
198
199
200
201
202
203
204
205
206
207
208
209
210
211
212
213
214
215
216
217
218
219
220
221
222
223
224
225
226
227
228
229
230
231
232
233
234
235
236
237
238
239
240
241
242
243
244
245
246
247
248
249
250
251
252
253
254
255
256
257
258
259
260
261
262
263
264
265
266
267
268
269
270
271
272
273
274
275
276
277
278
279
280
281
282
283
284
285
286
287
288
289
290
291
292
293
294
295
296
297
298
299
300
301
302
303
304
305
306
307
308
309
310
311
312
313
314
315
316
317
318
319
320
321
322
323
324
325
326
327
328
329
330
331
332
333
334
335
336
337
338
339
340
341
342
343
344
345
346
347
348
349
350
351
352
353
354
355
356
357
358
359
360
361
362
363
364
365
366
367
368
369
370
371
372
373
374
375
376
377
378
379
380
381
382
383
384
385
386
387
388
389
390
391
392
393
394
395
396
397
398
399
400
401
402
403
404
405
406
407
408
409
410
411
412
413
414
415
416
417
418
419
420
421
422
423
424
425
426
427
428
429
430
431
432
433
434
435
436
437
438
439
440
441
442
443
444
445
446
447
448
449
450
451
452
453
454
455
456
457
458
459
460
461
462
463
464
465
466
467
468
469
470
471
472
473
474
475
476
477
478
479
480
481
482
483
484
485
486
487
488
489
490
491
492
493
494
495
496
497
498
499
500
501
502
503
504
505
506
507
508
509
510
511
512
513
514
515
516
517
518
519
520
521
522
523
524
525
526
527
528
529
530
|
<!--
title: "statsd.plugin"
description: "The Netdata Agent is a fully-featured statsd server that collects metrics from any custom application and visualizes them in real-time."
custom_edit_url: https://github.com/netdata/netdata/edit/master/collectors/statsd.plugin/README.md
-->
# statsd.plugin
statsd is a system to collect data from any application. Applications are sending metrics to it, usually via non-blocking UDP communication, and statsd servers collect these metrics, perform a few simple calculations on them and push them to backend time-series databases.
There is a [plethora of client libraries](https://github.com/etsy/statsd/wiki#client-implementations) for embedding statsd metrics to any application framework. This makes statsd quite popular for custom application metrics.
Netdata is a fully featured statsd server. It can collect statsd formatted metrics, visualize them on its dashboards, stream them to other Netdata servers or archive them to backend time-series databases.
Netdata statsd is inside Netdata (an internal plugin, running inside the Netdata daemon), it is configured via `netdata.conf` and by-default listens on standard statsd ports (tcp and udp 8125 - yes, Netdata statsd server supports both tcp and udp at the same time).
Since statsd is embedded in Netdata, it means you now have a statsd server embedded on all your servers. So, the application can send its metrics to `localhost:8125`. This provides a distributed statsd implementation.
Netdata statsd is fast. It can collect more than **1.200.000 metrics per second** on modern hardware, more than **200Mbps of sustained statsd traffic**, using 1 CPU core (yes, it is single threaded - actually double-threaded, one thread collects metrics, another one updates the charts from the collected data).
## Metrics supported by Netdata
Netdata fully supports the statsd protocol. All statsd client libraries can be used with Netdata too.
- **Gauges**
The application sends `name:value|g`, where `value` is any **decimal/fractional** number, statsd reports the latest value collected and the number of times it was updated (events).
The application may increment or decrement a previous value, by setting the first character of the value to `+` or `-` (so, the only way to set a gauge to an absolute negative value, is to first set it to zero).
Sampling rate is supported (check below).
When a gauge is not collected and the setting is not to show gaps on the charts (the default), the last value will be shown, until a data collection event changes it.
- **Counters** and **Meters**
The application sends `name:value|c`, `name:value|C` or `name:value|m`, where `value` is a positive or negative **integer** number of events occurred, statsd reports the **rate** and the number of times it was updated (events).
`:value` can be omitted and statsd will assume it is `1`. `|c`, `|C` and `|m` can be omitted an statsd will assume it is `|m`. So, the application may send just `name` and statsd will parse it as `name:1|m`.
For counters use `|c` (etsy/statsd compatible) or `|C` (brubeck compatible), for meters use `|m`.
Sampling rate is supported (check below).
When a counter or meter is not collected and the setting is not to show gaps on the charts (the default), zero will be shown, until a data collection event changes it.
- **Timers** and **Histograms**
The application sends `name:value|ms` or `name:value|h`, where `value` is any **decimal/fractional** number, statsd reports **min**, **max**, **average**, **sum**, **95th percentile**, **median** and **standard deviation** and the total number of times it was updated (events).
For timers use `|ms`, or histograms use `|h`. The only difference between the two, is the `units` of the charts (timers report milliseconds).
Sampling rate is supported (check below).
When a timer or histogram is not collected and the setting is not to show gaps on the charts (the default), zero will be shown, until a data collection event changes it.
- **Sets**
The application sends `name:value|s`, where `value` is anything (**number or text**, leading and trailing spaces are removed), statsd reports the number of unique values sent and the number of times it was updated (events).
Sampling rate is **not** supported for Sets. `value` is always considered text.
When a set is not collected and the setting is not to show gaps on the charts (the default), zero will be shown, until a data collection event changes it.
#### Sampling Rates
The application may append `|@sampling_rate`, where `sampling_rate` is a number from `0.0` to `1.0`, to have statsd extrapolate the value, to predict to total for the whole period. So, if the application reports to statsd a value for 1/10th of the time, it can append `|@0.1` to the metrics it sends to statsd.
#### Overlapping metrics
Netdata's statsd server maintains different indexes for each of the types supported. This means the same metric `name` may exist under different types concurrently.
#### Multiple metrics per packet
Netdata accepts multiple metrics per packet if each is terminated with `\n`.
#### TCP packets
Netdata listens for both TCP and UDP packets. For TCP though, is it important to always append `\n` on each metric. Netdata uses this to detect if a metric is split into multiple TCP packets. On disconnect, even the remaining (non terminated with `\n`) buffer, is processed.
#### UDP packets
When sending multiple packets over UDP, it is important not to exceed the network MTU (usually 1500 bytes minus a few bytes for the headers). Netdata will accept UDP packets up to 9000 bytes, but the underlying network will not exceed MTU.
## configuration
This is the statsd configuration at `/etc/netdata/netdata.conf`:
```
[statsd]
# enabled = yes
# decimal detail = 1000
# update every (flushInterval) = 1
# udp messages to process at once = 10
# create private charts for metrics matching = *
# max private charts allowed = 200
# max private charts hard limit = 1000
# private charts memory mode = save
# private charts history = 3996
# histograms and timers percentile (percentThreshold) = 95.00000
# add dimension for number of events received = yes
# gaps on gauges (deleteGauges) = no
# gaps on counters (deleteCounters) = no
# gaps on meters (deleteMeters) = no
# gaps on sets (deleteSets) = no
# gaps on histograms (deleteHistograms) = no
# gaps on timers (deleteTimers) = no
# listen backlog = 4096
# default port = 8125
# bind to = udp:localhost:8125 tcp:localhost:8125
```
### statsd main config options
- `enabled = yes|no`
controls if statsd will be enabled for this Netdata. The default is enabled.
- `default port = 8125`
controls the port statsd will use. This is the default, since the next line, allows defining ports too.
- `bind to = udp:localhost tcp:localhost`
is a space separated list of IPs and ports to listen to. The format is `PROTOCOL:IP:PORT` - if `PORT` is omitted, the `default port` will be used. If `IP` is IPv6, it needs to be enclosed in `[]`. `IP` can also be `*` (to listen on all IPs) or even a hostname.
- `update every (flushInterval) = 1` seconds, controls the frequency statsd will push the collected metrics to Netdata charts.
- `decimal detail = 1000` controls the number of fractional digits in gauges and histograms. Netdata collects metrics using signed 64 bit integers and their fractional detail is controlled using multipliers and divisors. This setting is used to multiply all collected values to convert them to integers and is also set as the divisors, so that the final data will be a floating point number with this fractional detail (1000 = X.0 - X.999, 10000 = X.0 - X.9999, etc).
The rest of the settings are discussed below.
## statsd charts
Netdata can visualize statsd collected metrics in 2 ways:
1. Each metric gets its own **private chart**. This is the default and does not require any configuration (although there are a few options to tweak).
2. **Synthetic charts** can be created, combining multiple metrics, independently of their metric types. For this type of charts, special configuration is required, to define the chart title, type, units, its dimensions, etc.
### private metric charts
Private charts are controlled with `create private charts for metrics matching = *`. This setting accepts a space separated list of simple patterns (use `*` as wildcard, prepend a pattern with `!` for a negative match, the order of patterns is important).
So to render charts for all `myapp.*` metrics, except `myapp.*.badmetric`, use:
```
create private charts for metrics matching = !myapp.*.badmetric myapp.*
```
The default is to render private charts for all metrics.
The `memory mode` of the round robin database and the `history` of private metric charts are controlled with `private charts memory mode` and `private charts history`. The defaults for both settings is to use the global Netdata settings. So, you need to edit them only when you want statsd to use different settings compared to the global ones.
If you have thousands of metrics, each with its own private chart, you may notice that your web browser becomes slow when you view the Netdata dashboard (this is a web browser issue we need to address at the Netdata UI). So, Netdata has a protection to stop creating charts when `max private charts allowed = 200` (soft limit) is reached.
The metrics above this soft limit are still processed by Netdata and will be available to be sent to backend time-series databases, up to `max private charts hard limit = 1000`. So, between 200 and 1000 charts, Netdata will still generate charts, but they will automatically be created with `memory mode = none` (Netdata will not maintain a database for them). These metrics will be sent to backend time series databases, if the backend configuration is set to `as collected`.
Metrics above the hard limit are still collected, but they can only be used in synthetic charts (once a metric is added to chart, it will be sent to backend servers too).
Example private charts (automatically generated without any configuration):
#### counters
- Scope: **count the events of something** (e.g. number of file downloads)
- Format: `name:INTEGER|c` or `name:INTEGER|C` or `name|c`
- statsd increments the counter by the `INTEGER` number supplied (positive, or negative).

#### gauges
- Scope: **report the value of something** (e.g. cache memory used by the application server)
- Format: `name:FLOAT|g`
- statsd remembers the last value supplied, and can increment or decrement the latest value if `FLOAT` begins with `+` or `-`.

#### histograms
- Scope: **statistics on a size of events** (e.g. statistics on the sizes of files downloaded)
- Format: `name:FLOAT|h`
- statsd maintains a list of all the values supplied and provides statistics on them.

The same chart with `sum` unselected, to show the detail of the dimensions supported:

#### meters
This is identical to `counter`.
- Scope: **count the events of something** (e.g. number of file downloads)
- Format: `name:INTEGER|m` or `name|m` or just `name`
- statsd increments the counter by the `INTEGER` number supplied (positive, or negative).

#### sets
- Scope: **count the unique occurrences of something** (e.g. unique filenames downloaded, or unique users that downloaded files)
- Format: `name:TEXT|s`
- statsd maintains a unique index of all values supplied, and reports the unique entries in it.

#### timers
- Scope: **statistics on the duration of events** (e.g. statistics for the duration of file downloads)
- Format: `name:FLOAT|ms`
- statsd maintains a list of all the values supplied and provides statistics on them.

The same chart with the `sum` unselected:

### synthetic statsd charts
Use synthetic charts to create dedicated sections on the dashboard to render the charts, with control over the main
menu, the submenus, the charts, the dimensions on each chart, and more.
Synthetic charts are organized in
- **applications** (i.e. entries at the main menu of the Netdata dashboard)
- **charts for each application** (grouped in families - i.e. submenus at the dashboard menu)
- **statsd metrics for each chart** (i.e. dimensions of the charts)
For each application you need to create a `.conf` file in `/etc/netdata/statsd.d`.
So, to create the statsd application `myapp`, create the file `/etc/netdata/statsd.d/myapp.conf`, with this content:
```
[app]
name = myapp
metrics = myapp.*
private charts = no
gaps when not collected = no
memory mode = ram
history = 60
[dictionary]
m1 = metric1
m2 = metric2
# replace 'mychart' with the chart id
# the chart will be named: myapp.mychart
[mychart]
name = mychart
title = my chart title
family = my family
context = chart.context
units = tests/s
priority = 91000
type = area
dimension = myapp.metric1 m1
dimension = myapp.metric2 m2
```
Using the above configuration `myapp` should get its own section on the dashboard, having one chart with 2 dimensions.
`[app]` starts a new application definition. The supported settings in this section are:
- `name` defines the name of the app.
- `metrics` is a Netdata simple pattern (space separated patterns, using `*` for wildcard, possibly starting with `!` for negative match). This pattern should match all the possible statsd metrics that will be participating in the application `myapp`.
- `private charts = yes|no`, enables or disables private charts for the metrics matched.
- `gaps when not collected = yes|no`, enables or disables gaps on the charts of the application, when metrics are not collected.
- `memory mode` sets the memory mode for all charts of the application. The default is the global default for Netdata (not the global default for statsd private charts).
- `history` sets the size of the round robin database for this application. The default is the global default for Netdata (not the global default for statsd private charts).
`[dictionary]` defines name-value associations. These are used to renaming metrics, when added to synthetic charts. Metric names are also defined at each `dimension` line. However, using the dictionary dimension names can be declared globally, for each app and is the only way to rename dimensions when using patterns. Of course the dictionary can be empty or missing.
Then, add any number of charts. Each chart should start with `[id]`. The chart will be called `app_name.id`. `family` controls the submenu on the dashboard. `context` controls the alarm templates. `priority` controls the ordering of the charts on the dashboard. The rest of the settings are informational.
Add any number of metrics to a chart, using `dimension` lines. These lines accept 5 space separated parameters:
1. the metric name, as it is collected (it has to be matched by the `metrics =` pattern of the app)
2. the dimension name, as it should be shown on the chart
3. an optional selector (type) of the value to shown (see below)
4. an optional multiplier
5. an optional divider
6. optional flags, space separated and enclosed in quotes. All the external plugins `DIMENSION` flags can be used. Currently the only usable flag is `hidden`, to add the dimension, but not show it on the dashboard. This is usually needed to have the values available for percentage calculation, or use them in alarms.
So, the format is this:
```
dimension = [pattern] METRIC NAME TYPE MULTIPLIER DIVIDER OPTIONS
```
`pattern` is a keyword. When set, `METRIC` is expected to be a Netdata simple pattern that will be used to match all the statsd metrics to be added to the chart. So, `pattern` automatically matches any number of statsd metrics, all of which will be added as separate chart dimensions.
`TYPE`, `MULTIPLIER`, `DIVIDER` and `OPTIONS` are optional.
`TYPE` can be:
- `events` to show the number of events received by statsd for this metric
- `last` to show the last value, as calculated at the flush interval of the metric (the default)
Then for histograms and timers the following types are also supported:
- `min`, show the minimum value
- `max`, show the maximum value
- `sum`, show the sum of all values
- `average` (same as `last`)
- `percentile`, show the 95th percentile (or any other percentile, as configured at statsd global config)
- `median`, show the median of all values (i.e. sort all values and get the middle value)
- `stddev`, show the standard deviation of the values
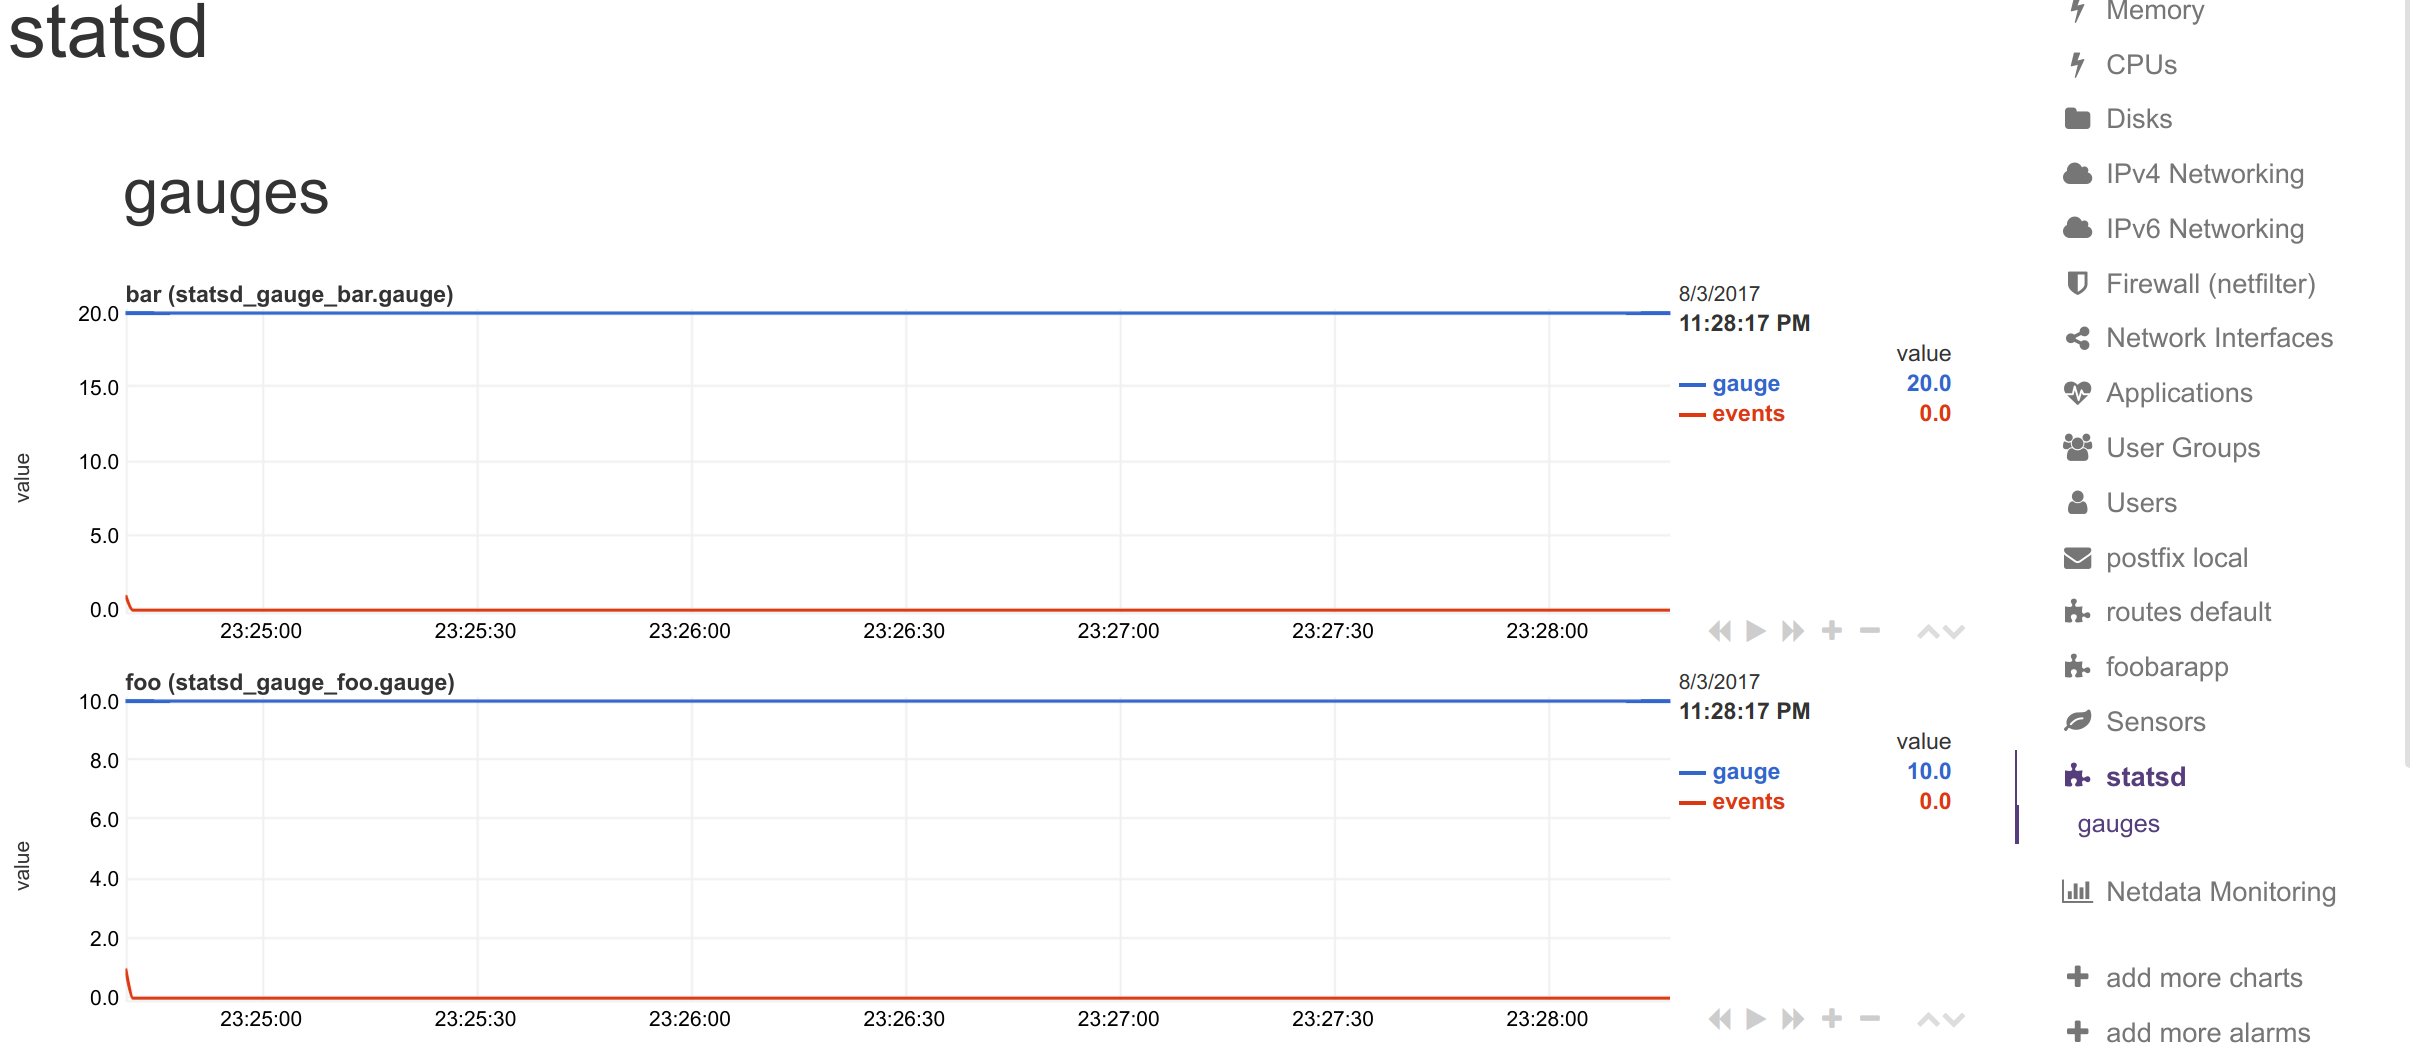
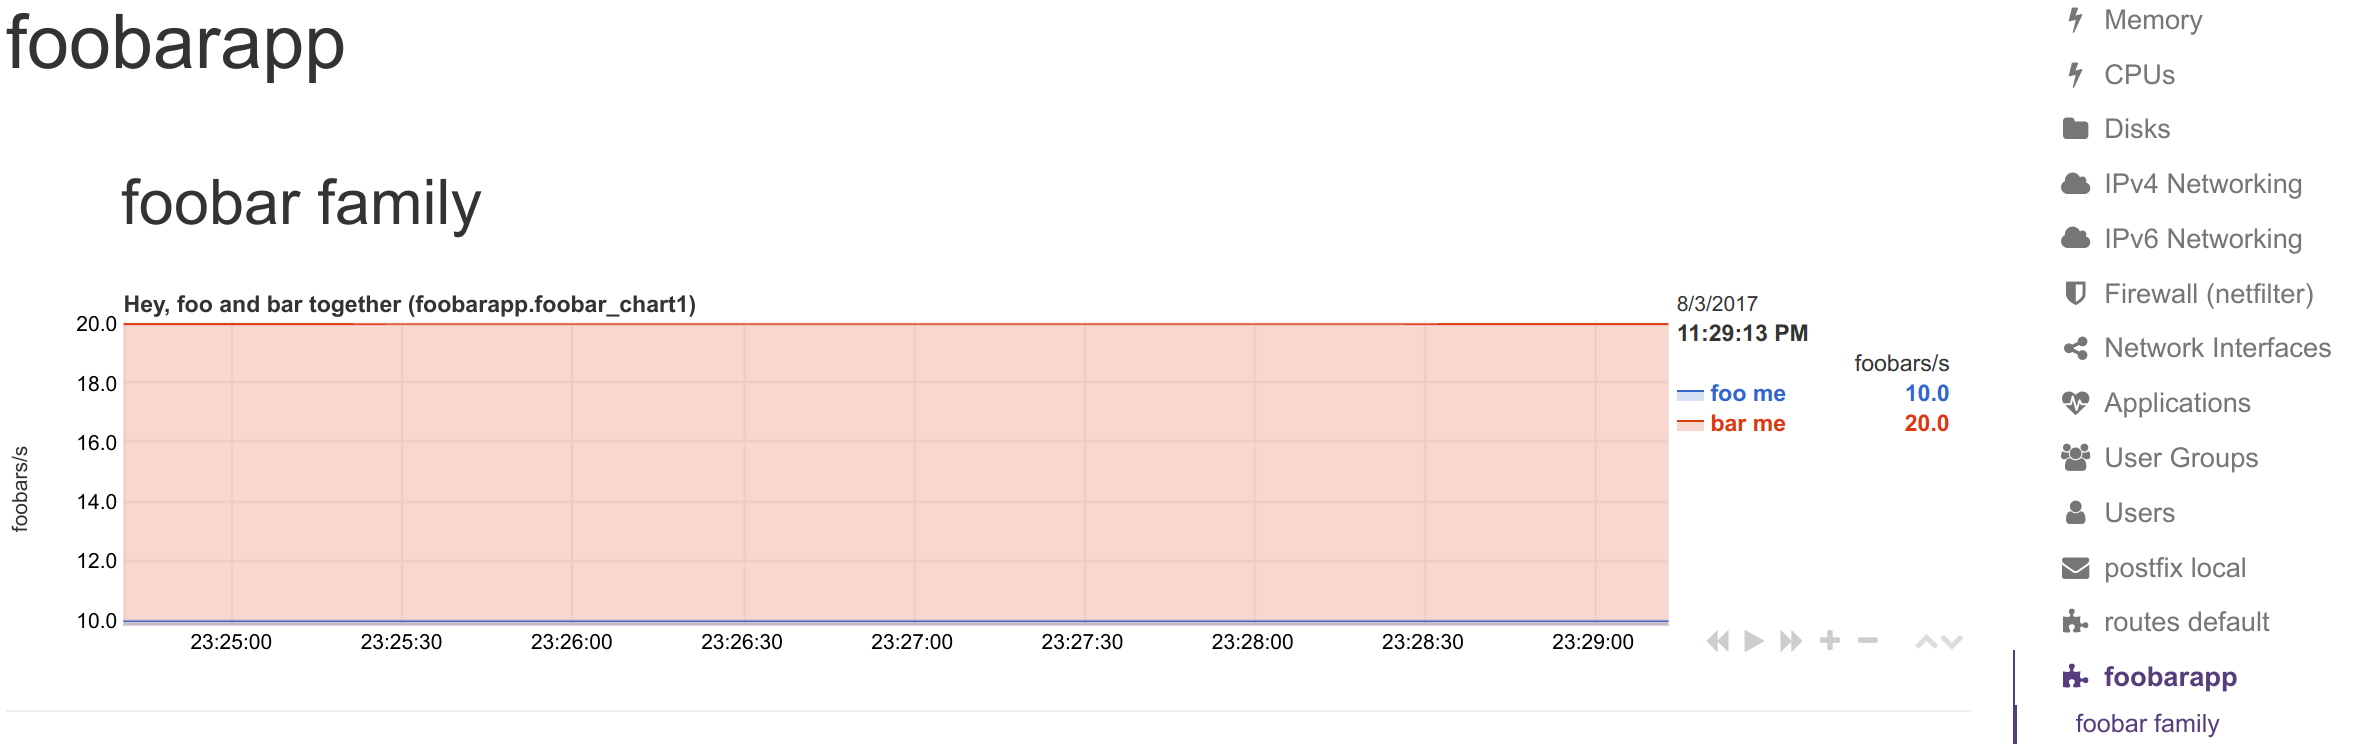
#### example synthetic charts
statsd metrics: `foo` and `bar`.
Contents of file `/etc/netdata/stats.d/foobar.conf`:
```
[app]
name = foobarapp
metrics = foo bar
private charts = yes
[foobar_chart1]
title = Hey, foo and bar together
family = foobar_family
context = foobarapp.foobars
units = foobars
type = area
dimension = foo 'foo me' last 1 1
dimension = bar 'bar me' last 1 1
```
I sent to statsd: `foo:10|g` and `bar:20|g`.
I got these private charts:
and this synthetic chart:
#### dictionary to name dimensions
The `[dictionary]` section accepts any number of `name = value` pairs.
Netdata uses this dictionary as follows:
1. When a `dimension` has a non-empty `NAME`, that name is looked up at the dictionary.
2. If the above lookup gives nothing, or the `dimension` has an empty `NAME`, the original statsd metric name is looked up at the dictionary.
3. If any of the above succeeds, Netdata uses the `value` of the dictionary, to set the name of the dimension. The dimensions will have as ID the original statsd metric name, and as name, the dictionary value.
Use the dictionary in 2 ways:
1. set `dimension = myapp.metric1 ''` and have at the dictionary `myapp.metric1 = metric1 name`
2. set `dimension = myapp.metric1 'm1'` and have at the dictionary `m1 = metric1 name`
In both cases, the dimension will be added with ID `myapp.metric1` and will be named `metric1 name`. So, in alarms use either of the 2 as `${myapp.metric1}` or `${metric1 name}`.
> keep in mind that if you add multiple times the same statsd metric to a chart, Netdata will append `TYPE` to the dimension ID, so `myapp.metric1` will be added as `myapp.metric1_last` or `myapp.metric1_events`, etc. If you add multiple times the same metric with the same `TYPE` to a chart, Netdata will also append an incremental counter to the dimension ID, i.e. `myapp.metric1_last1`, `myapp.metric1_last2`, etc.
#### dimension patterns
Netdata allows adding multiple dimensions to a chart, by matching the statsd metrics with a Netdata simple pattern.
Assume we have an API that provides statsd metrics for each response code per method it supports, like these:
```
myapp.api.get.200
myapp.api.get.400
myapp.api.get.500
myapp.api.del.200
myapp.api.del.400
myapp.api.del.500
myapp.api.post.200
myapp.api.post.400
myapp.api.post.500
myapp.api.all.200
myapp.api.all.400
myapp.api.all.500
```
To add all response codes of `myapp.api.get` to a chart use this:
```
[api_get_responses]
...
dimension = pattern 'myapp.api.get.* '' last 1 1
```
The above will add dimension named `200`, `400` and `500` (yes, Netdata extracts the wildcarded part of the metric name - so the dimensions will be named with whatever the `*` matched). Rename the dimensions with this:
```
[dictionary]
get.200 = 200 ok
get.400 = 400 bad request
get.500 = 500 cannot connect to db
[api_get_responses]
...
dimension = pattern 'myapp.api.get.* 'get.' last 1 1
```
Note that we added a `NAME` to the dimension line with `get.`. This is prefixed to the wildcarded part of the metric name, to compose the key for looking up the dictionary. So `500` became `get.500` which was looked up to the dictionary to find value `500 cannot connect to db`. This way we can have different dimension names, for each of the API methods (i.e. `get.500 = 500 cannot connect to db` while `post.500 = 500 cannot write to disk`).
To add all API methods to a chart, do this:
```
[ok_by_method]
...
dimension = pattern 'myapp.api.*.200 '' last 1 1
```
The above will add `get`, `post`, `del` and `all` to the chart.
If `all` is not wanted (a `stacked` chart does not need the `all` dimension, since the sum of the dimensions provides the total), the line should be:
```
[ok_by_method]
...
dimension = pattern '!myapp.api.all.* myapp.api.*.200 '' last 1 1
```
With the above, all methods except `all` will be added to the chart.
To automatically rename the methods, use this:
```
[dictionary]
method.get = GET
method.post = ADD
method.del = DELETE
[ok_by_method]
...
dimension = pattern '!myapp.api.all.* myapp.api.*.200 'method.' last 1 1
```
Using the above, the dimensions will be added as `GET`, `ADD` and `DELETE`.
## interpolation
~~If you send just one value to statsd, you will notice that the chart is created but no value is shown. The reason is that Netdata interpolates all values at second boundaries. For incremental values (`counters` and `meters` in statsd terminology), if you send 10 at 00:00:00.500, 20 at 00:00:01.500 and 30 at 00:00:02.500, Netdata will show 15 at 00:00:01 and 25 at 00:00:02.~~
~~This interpolation is automatic and global in Netdata for all charts, for incremental values. This means that for the chart to start showing values you need to send 2 values across 2 flush intervals.~~
~~(although this is required for incremental values, Netdata allows mixing incremental and absolute values on the same charts, so this little limitation [i.e. 2 values to start visualization], is applied on all Netdata dimensions).~~
(statsd metrics do not lose their first data collection due to interpolation anymore - fixed with [PR #2411](https://github.com/netdata/netdata/pull/2411))
## sending statsd metrics from shell scripts
Send/update statsd metrics from shell scripts to visualize automated jobs you run on your servers using the Netdata
Agent.
The command you need to run is:
```sh
echo "NAME:VALUE|TYPE" | nc -u --send-only localhost 8125
```
Where:
- `NAME` is the metric name
- `VALUE` is the value for that metric (**gauges** `|g`, **timers** `|ms` and **histograms** `|h` accept decimal/fractional numbers, **counters** `|c` and **meters** `|m` accept integers, **sets** `|s` accept anything)
- `TYPE` is one of `g`, `ms`, `h`, `c`, `m`, `s` to select the metric type.
So, to set `metric1` as gauge to value `10`, use:
```sh
echo "metric1:10|g" | nc -u --send-only localhost 8125
```
To increment `metric2` by `10`, as a counter, use:
```sh
echo "metric2:10|c" | nc -u --send-only localhost 8125
```
You can send multiple metrics like this:
```sh
# send multiple metrics via UDP
printf "metric1:10|g\nmetric2:10|c\n" | nc -u --send-only localhost 8125
```
Remember, for UDP communication each packet should not exceed the MTU. So, if you plan to push too many metrics at once, prefer TCP communication:
```sh
# send multiple metrics via TCP
printf "metric1:10|g\nmetric2:10|c\n" | nc --send-only localhost 8125
```
You can also use this little function to take care of all the details:
```sh
#!/usr/bin/env bash
STATSD_HOST="localhost"
STATSD_PORT="8125"
statsd() {
local udp="-u" all="${*}"
# if the string length of all parameters given is above 1000, use TCP
[ "${#all}" -gt 1000 ] && udp=
while [ ! -z "${1}" ]
do
printf "${1}\n"
shift
done | nc ${udp} --send-only ${STATSD_HOST} ${STATSD_PORT} || return 1
return 0
}
```
You can use it like this:
```sh
# first, source it in your script
source statsd.sh
# then, at any point:
statsd "metric1:10|g" "metric2:10|c" ...
```
The function is smart enough to call `nc` just once and pass all the metrics to it. It will also automatically switch to TCP if the metrics to send are above 1000 bytes.
[](<>)
|
