blob: 13608a8a8ce7dfceddc0a958ae47f04ad250b65b (
plain)
1
2
3
4
5
6
7
8
9
10
11
12
13
14
15
16
17
18
19
20
21
22
23
24
25
26
27
28
29
30
31
32
33
34
35
36
37
38
39
40
41
42
43
44
45
46
47
48
49
50
51
52
53
54
55
56
57
58
59
60
61
62
63
64
65
66
67
68
69
70
71
72
73
74
75
76
77
|
<!--
title: "K6 load test monitoring with Netdata"
custom_edit_url: "https://github.com/netdata/netdata/edit/master/collectors/statsd.plugin/k6.md"
sidebar_label: "K6 Load Testing"
learn_status: "Published"
learn_rel_path: "Integrations/Monitor/apps"
-->
# K6 load test collector
Monitors the impact of load testing experiments performed with [K6](https://k6.io/).
You can read more about the metrics that K6 sends in the [K6 documentation](https://k6.io/docs/using-k6/metrics/).
## Requirements
- When running the k6 experiment, specify a [StatsD output](https://k6.io/docs/results-visualization/statsd/).
- Tip: K6 currently supports tags only with [datadog output](https://k6.io/docs/results-visualization/datadog/), which is in essence StatsD. Netdata can be used with both.
## Metrics
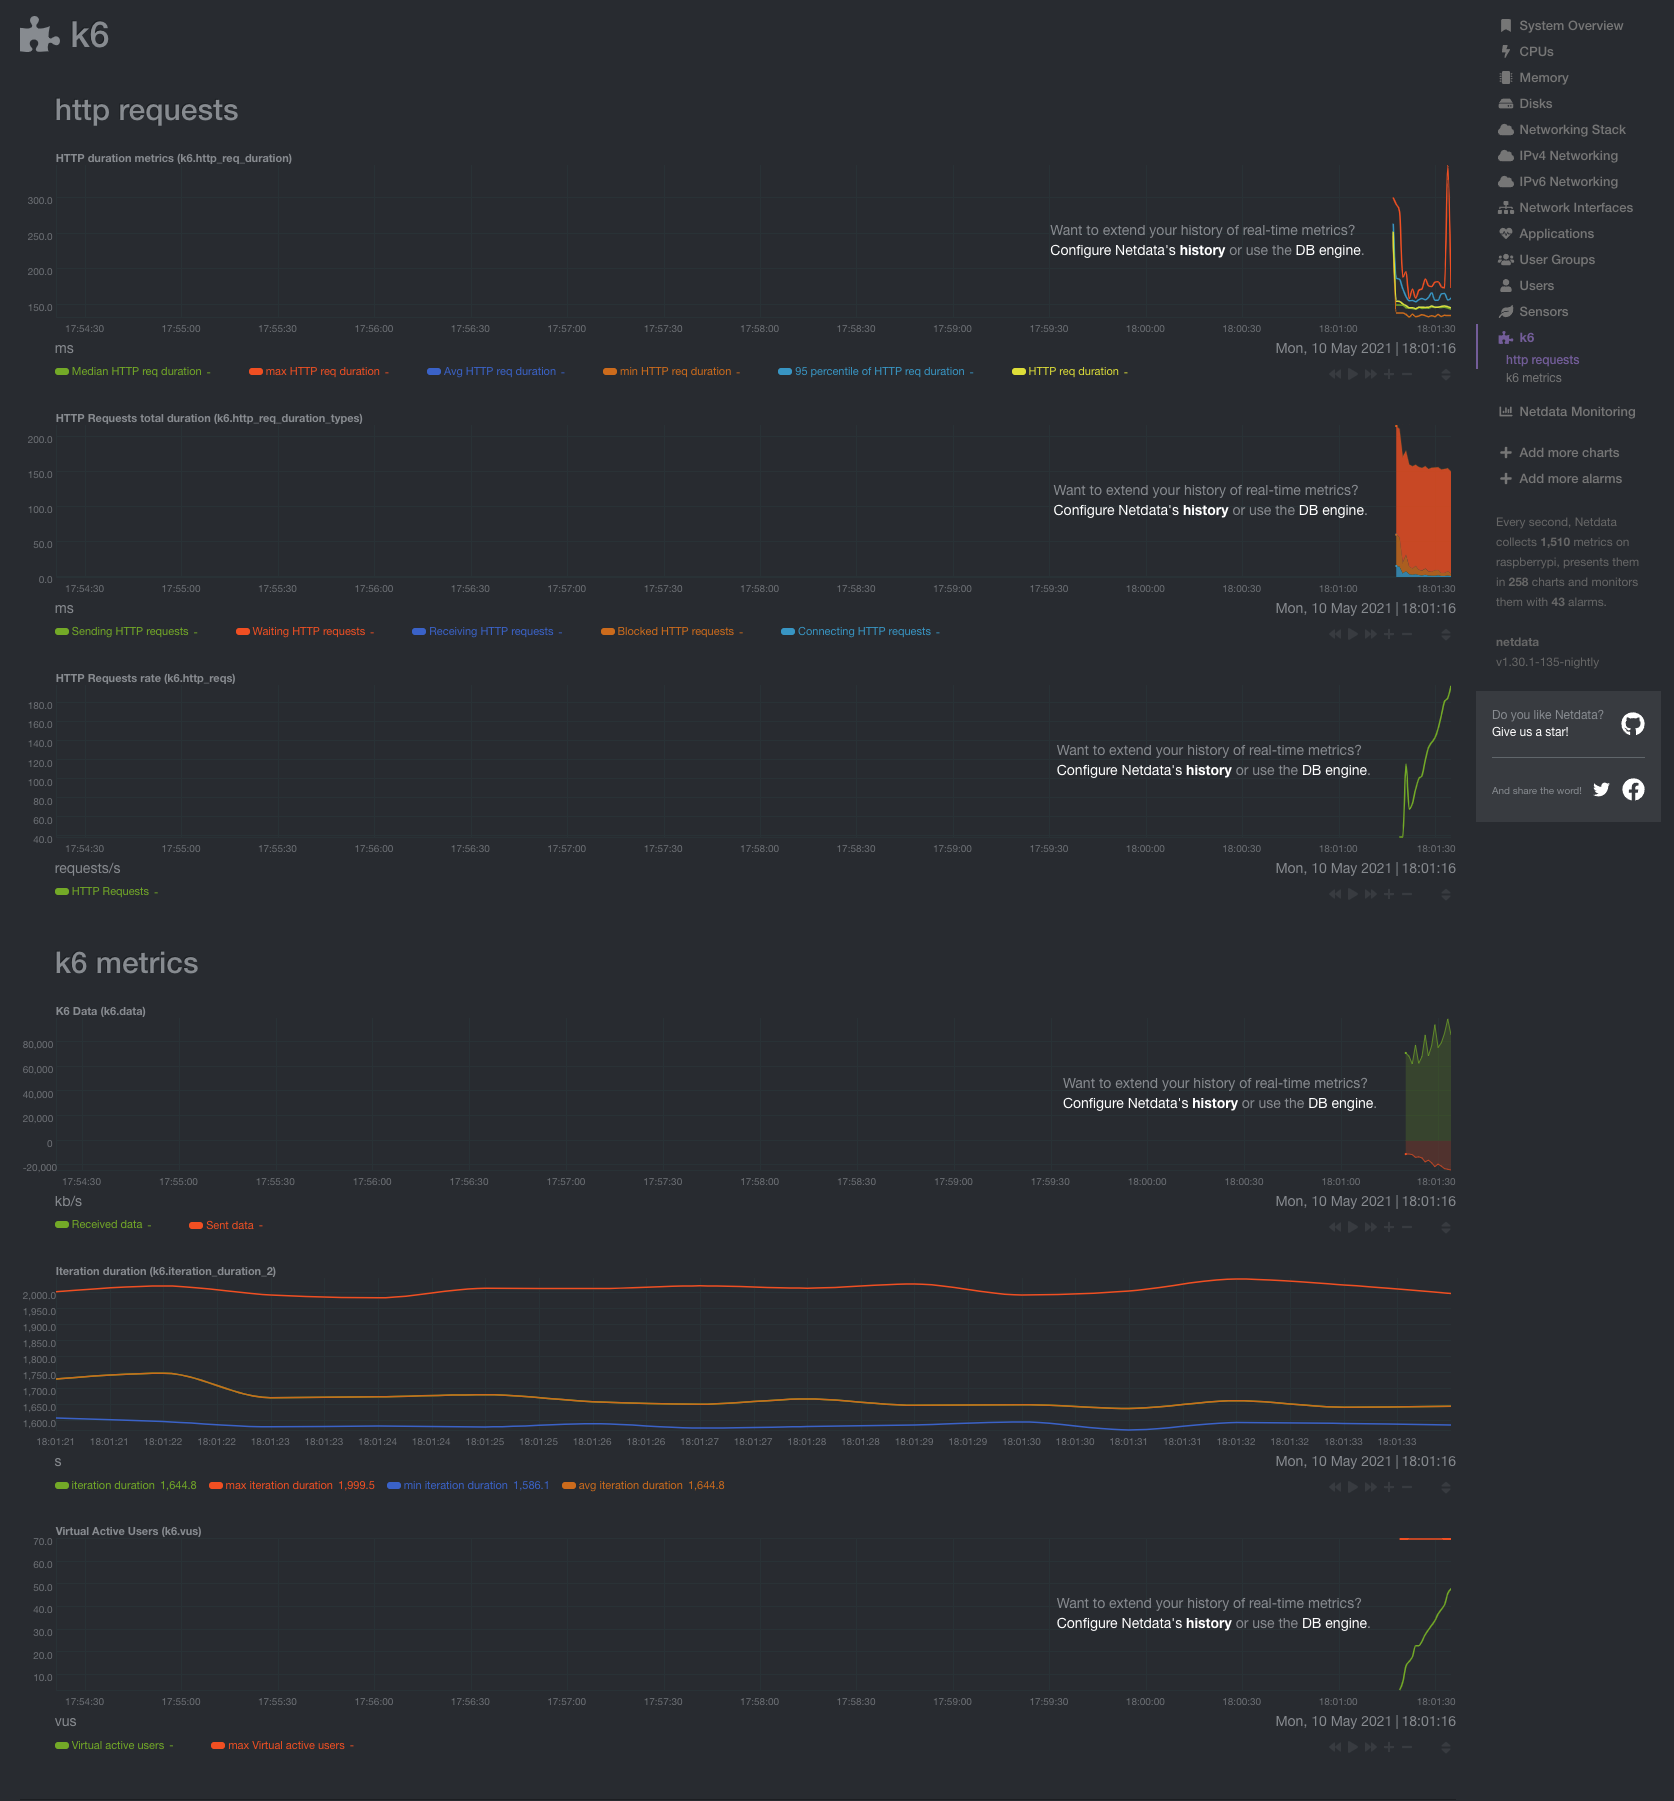
### HTTP Requests
Number of HTTP requests that K6 generates, per second.
### Failed HTTP Requests
Number of failed HTTP requests that K6 generates, per second.
### Virtual Active Users
Current number of active virtual users.
### Iteration Duration
The time it took K6 to complete one full iteration of the main function.
### Dropped Iterations
The number of iterations that could not be started either due to lack of Virtual Users or lack of time.
### Data
The amount of data received and sent.
### TTP Requests total duration
The total duration it took for a round-trip of an HTTP request. It includes:
- Blocked HTTP requests: time spent blocked before initiating the request
- Connecting HTTP requests: time spent establishing TCP connection to the remote host
- Sending HTTP requests: time spent sending data to the remote host
- Receiving HTTP requests: time spent receiving data from the remote host
- Waiting HTTP requests: time spent waiting for response from the remote host
### HTTP duration metrics
Different metrics on the HTTP request as defined by K6. The HTTP request duration is defined by K6 as: `HTTP sending request` + `HTTP receiving request` + `HTTP waiting request`.
Metrics:
- Median
- Average
- Max
- Min
- 95th percentile
- absolute (the value as it is, without any computation)
## Configuration
The collector is preconfigured and defined in `statsd.plugin/k6.conf`.
Due to being a StatsD collector, you only need to define the configuration file and then send data to Netdata using the StatsD protocol.
If Netdata is running on the same machine as K6, no further configuration is required. Otherwise, you will have to [point K6](https://k6.io/docs/results-visualization/statsd/) to your node and make sure that the K6 process can reach Netdata.
The default namespace that is used in the configuration is `k6`. If you change it in K6, you will have to change it as well in the configuration file `k6.conf`.
|
