1
2
3
4
5
6
7
8
9
10
11
12
13
14
15
16
17
18
19
20
21
22
23
24
25
26
27
28
29
30
31
32
33
34
35
36
37
38
39
40
41
42
43
44
45
46
47
48
49
50
51
52
53
54
55
56
57
58
59
60
61
62
63
64
65
66
67
68
69
70
71
72
73
74
75
76
77
78
79
80
81
82
83
84
85
86
87
88
89
90
91
92
93
94
95
96
97
98
99
100
101
102
103
104
105
106
107
108
109
110
111
112
113
114
115
116
117
118
119
120
121
122
123
124
125
126
127
128
129
130
131
132
133
134
135
136
137
138
139
140
141
142
143
144
145
146
147
148
149
150
151
152
153
154
155
156
157
158
159
160
161
162
163
164
165
166
167
168
169
170
171
172
173
174
175
176
177
178
179
180
181
182
183
184
185
186
187
188
189
190
191
192
193
194
195
196
197
198
199
|
# Netdata for IoT

> New to netdata? Check its demo: **[https://my-netdata.io/](https://my-netdata.io/)**
>
> [](https://registry.my-netdata.io/#netdata_registry) [](https://registry.my-netdata.io/#netdata_registry) [](https://registry.my-netdata.io/#netdata_registry)
>
> [](https://registry.my-netdata.io/#netdata_registry) [](https://registry.my-netdata.io/#netdata_registry) [](https://registry.my-netdata.io/#netdata_registry)
---
netdata is a **very efficient** server performance monitoring solution. When running in server hardware, it can collect thousands of system and application metrics **per second** with just 1% CPU utilization of a single core. Its web server responds to most data requests in about **half a millisecond** making its web dashboards spontaneous, amazingly fast!
netdata can also be a very efficient real-time monitoring solution for **IoT devices** (RPIs, routers, media players, wifi access points, industrial controllers and sensors of all kinds). Netdata will generally run everywhere a Linux kernel runs (and it is glibc and [musl-libc](https://www.musl-libc.org/) friendly).
You can use it as both a data collection agent (where you pull data using its API), for embedding its charts on other web pages / consoles, but also for accessing it directly with your browser to view its dashboard.
The netdata web API already provides **reduce** functions allowing it to report **average** and **max** for any timeframe. It can also respond in many formats including JSON, JSONP, CSV, HTML. Its API is also a **google charts** provider so it can directly be used by google sheets, google charts, google widgets.

Although netdata has been significantly optimized to lower the CPU and RAM resources it consumes, the plethora of data collection plugins may be inappropriate for weak IoT devices.
> keep in mind that netdata on RPi 2 and 3 does not require any tuning. The default settings will be good. The following tunables apply only when running netdata on RPi 1 or other very weak IoT devices.
Here are a few tricks to control the resources consumed by netdata:
## 1. Disable External plugins
External plugins can consume more system resources than the netdata server. Disable the ones you don't need.
Edit `/etc/netdata/netdata.conf`, find the `[plugins]` section:
```
[plugins]
proc = yes
tc = no
idlejitter = no
cgroups = no
checks = no
apps = no
charts.d = no
node.d = no
plugins directory = /usr/libexec/netdata/plugins.d
enable running new plugins = no
check for new plugins every = 60
```
In detail:
plugin|description
:---:|:---------
`proc`|the internal plugin used to monitor the system. Normally, you don't want to disable this. You can disable individual functions of it at the next section.
`tc`|monitoring network interfaces QoS (tc classes)
`idlejitter`|internal plugin (written in C) that attempts show if the systems starved for CPU. Disabling it will eliminate a thread.
`cgroups`|monitoring linux containers. Most probably you are not going to need it. This will also eliminate another thread.
`checks`|a debugging plugin, which is disabled by default.
`apps`|a plugin that monitors system processes. It is very complex and heavy (heavier than the netdata daemon), so if you don't need to monitor the process tree, you can disable it.
`charts.d`|BASH plugins (squid, nginx, mysql, etc). This is again a heavy plugin.
`node.d`|node.js plugin, currently used for SNMP data collection and monitoring named (the name server).
For most IoT devices, you can disable all plugins except `proc`. For `proc` there is another section that controls which functions of it you need. Check the next section.
---
## 2. Disable internal plugins
In this section you can select which modules of the `proc` plugin you need. All these are run in a single thread, one after another. Still, each one needs some RAM and consumes some CPU cycles.
```
[plugin:proc]
# /proc/net/dev = yes # network interfaces
# /proc/diskstats = yes # disks
# /proc/net/snmp = yes # generic IPv4
# /proc/net/snmp6 = yes # generic IPv6
# /proc/net/netstat = yes # TCP and UDP
# /proc/net/stat/conntrack = yes # firewall
# /proc/net/ip_vs/stats = yes # IP load balancer
# /proc/net/stat/synproxy = yes # Anti-DDoS
# /proc/stat = yes # CPU, context switches
# /proc/meminfo = yes # Memory
# /proc/vmstat = yes # Memory operations
# /proc/net/rpc/nfsd = yes # NFS Server
# /proc/sys/kernel/random/entropy_avail = yes # Cryptography
# /proc/interrupts = yes # Interrupts
# /proc/softirqs = yes # SoftIRQs
# /proc/loadavg = yes # Load Average
# /sys/kernel/mm/ksm = yes # Memory deduper
# netdata server resources = yes # netdata charts
```
---
## 3. Disable logs
Normally, you will not need them. To disable them, set:
```
[global]
debug log = none
error log = none
access log = none
```
---
## 4. Set memory mode to RAM
Setting the memory mode to `ram` will disable loading and saving the round robin database. This will not affect anything while running netdata, but it might be required if you have very limited storage available.
```
[global]
memory mode = ram
```
---
## 5. CPU utilization
If after disabling the plugins you don't need, netdata still uses a lot of CPU without any clients accessing the dashboard, try lowering its data collection frequency. Going from "once per second" to "once every two seconds" will not have a significant difference on the user experience, but it will cut the CPU resources required **in half**.
To set the update frequency, edit `/etc/netdata/netdata.conf` and set:
```
[global]
update every = 2
```
You may have to increase this to 5 or 10 if the CPU of the device is weak.
Keep in mind this will also force dashboard chart refreshes to happen at the same rate. So increasing this number actually lowers data collection frequency but also lowers dashboard chart refreshes frequency.
This is a dashboard on a device with `[global].update every = 5` (this device is a media player and is now playing a movie):

---
## 6. Lower memory requirements
You can set the default size of the round robin database for all charts, using:
```
[global]
history = 600
```
The units for history is `[global].update every` seconds. So if `[global].update every = 6` and `[global].history = 600`, you will have an hour of data ( 6 x 600 = 3.600 ), which will store 600 points per dimension, one every 6 seconds.
Check also [[Memory Requirements]] for directions on calculating the size of the round robin database.
---
## 7. Disable gzip compression of responses
Gzip compression of the web responses is using more CPU that the rest of netdata. You can lower the compression level or disable gzip compression completely. You can disable it, like this:
```
[web]
enable gzip compression = no
```
To lower the compression level, do this:
```
[web]
enable gzip compression = yes
gzip compression level = 1
```
---
Finally, if no web server is installed on your device, you can use port tcp/80 for netdata:
```
[global]
port = 80
```
---
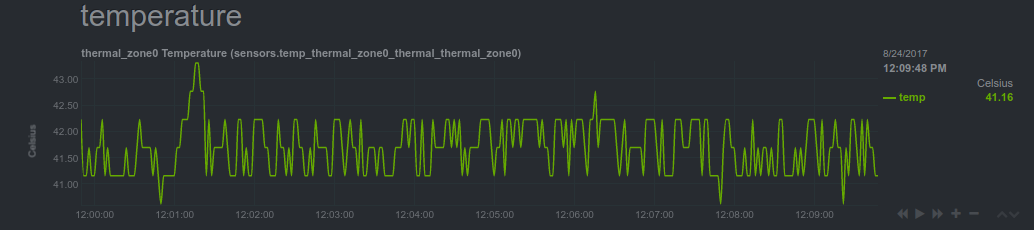
## 8. Monitoring RPi temperature
The python version of the sensors plugin uses `lm-sensors`. Unfortunately the temperature reading of RPi are not supported by `lm-sensors`.
netdata also has a bash version of the sensors plugin that can read RPi temperatures. It is disabled by default to avoid the conflicts with the python version.
To enable it, edit `/etc/netdata/charts.d.conf` and uncomment this line:
```sh
sensors=force
```
Then restart netdata. You will get this:
|
