blob: 1035b682e87c74b561c81e7de6c6e9c357e4d235 (
plain)
1
2
3
4
5
6
7
8
9
10
11
12
13
14
15
16
17
18
19
20
21
22
23
24
25
26
27
28
29
30
31
32
33
34
35
36
37
38
39
40
41
42
43
44
45
46
47
48
49
50
51
52
53
54
55
56
57
58
59
60
61
62
63
64
65
66
67
68
69
70
71
72
73
74
75
76
|
---
title: "View active alerts"
description: >-
"Track the health of your infrastructure in one place by taking advantage of the powerful health monitoring
watchdog running on every node."
type: "how-to"
custom_edit_url: "https://github.com/netdata/netdata/blob/master/docs/cloud/alerts-notifications/view-active-alerts.mdx"
sidebar_label: "View active alerts"
learn_status: "Published"
learn_topic_type: "Tasks"
learn_rel_path: "Operations/Alerts"
---
Netdata Cloud receives information about active alerts on individual nodes in your infrastructure and updates the
interface based on those status changes.
Netdata Cloud doesn't produce alerts itself but rather receives and aggregates alerts from each node in your
infrastructure based on their configuration. Every node comes with hundreds of pre-configured alerts that have been
tested by Netdata's community of DevOps engineers and SREs, but you may want to customize existing alerts or create new
ones entirely.
Read our doc on [health alerts](https://github.com/netdata/netdata/blob/master/docs/monitor/configure-alarms.md) to
learn how to tweak existing alerts or create new
health entities based on the specific needs of your infrastructure. By taking charge of alert configuration, you'll
ensure Netdata Cloud always delivers the most relevant alerts about the well-being of your nodes.
## View all active alerts
The [Alerts Smartboard](https://github.com/netdata/netdata/blob/master/docs/cloud/alerts-notifications/smartboard.mdx)
provides a high-level interface for viewing the number of critical or warning alerts and where they are in your
infrastructure.
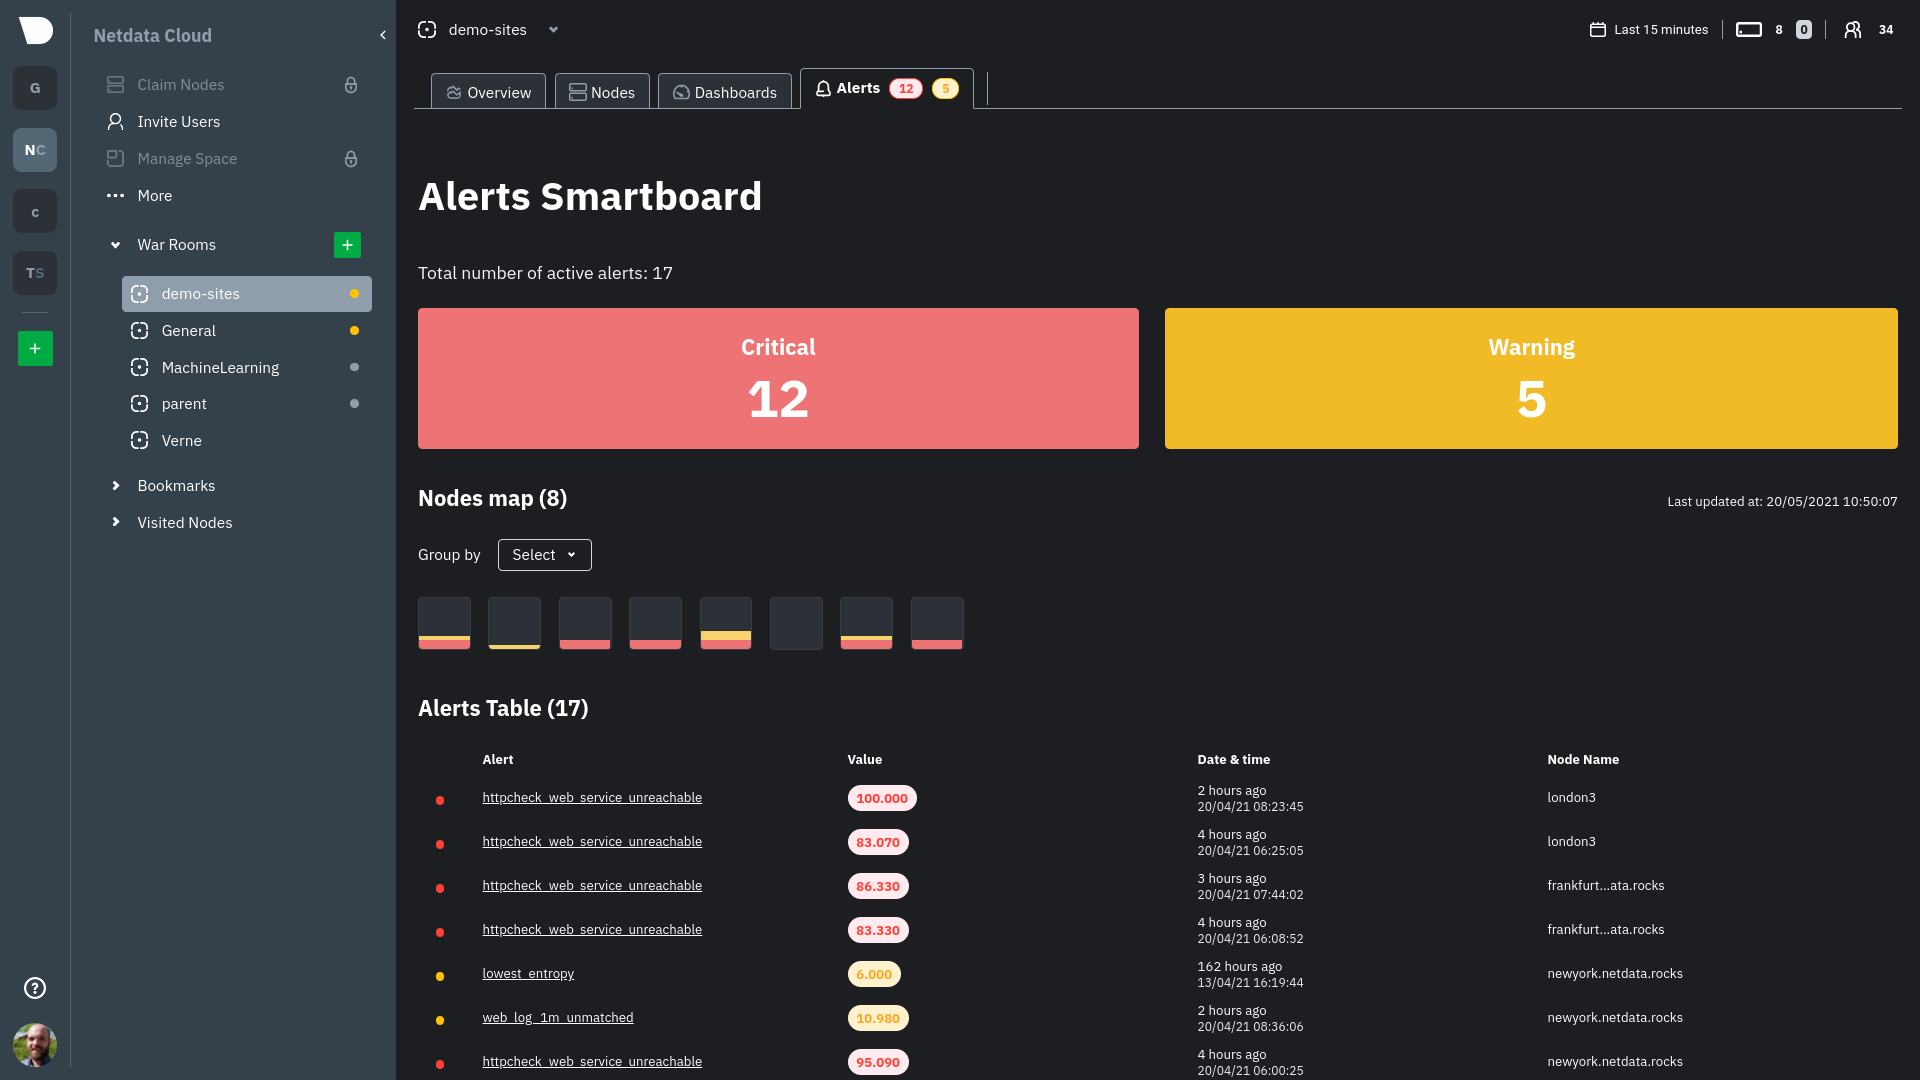
Click on the **Alerts** tab in any War Room to open the Smartboard. Alternatively, click on any of the alert badges in
the [Nodes view](https://github.com/netdata/netdata/blob/master/docs/cloud/visualize/nodes.md) to jump to the Alerts
Smartboard.
From here, filter active alerts using the **critical** or **warning** boxes, or hover over a box in
the [nodes map](https://github.com/netdata/netdata/blob/master/docs/cloud/alerts-notifications/smartboard.mdx#nodes-map)
to see a
popup node-specific alert information.
## View alerts in context with charts
If you click on any of the alerts, either in a nodes map popup or the alerts table, Netdata Cloud navigates you to the
single-node dashboard and scrolls to the relevant chart. Netdata Cloud also draws a highlight and the value at the
moment your node triggered this alert.
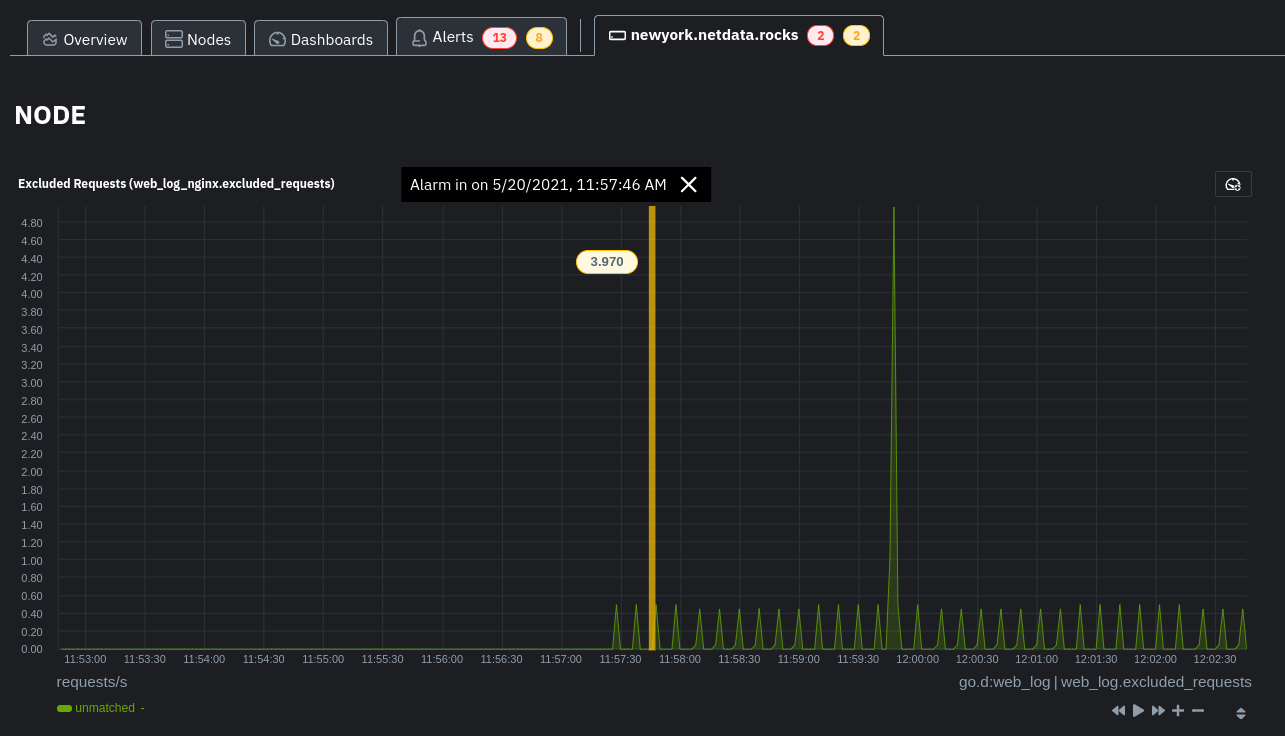
You can
then [select this area](https://github.com/netdata/netdata/blob/master/docs/dashboard/interact-charts.mdx#select)
with `Alt/⌘ + mouse selection` to highlight the alerted timeframe while you explore other charts for root cause
analysis.
Or, select the area and
run [Metric Correlations](https://github.com/netdata/netdata/blob/master/docs/cloud/insights/metric-correlations.md) to
filter the single-node
dashboard to only those charts most likely to be connected to the alert.
## What's next?
Learn more about the features of the Smartboard in
its [reference](https://github.com/netdata/netdata/blob/master/docs/cloud/alerts-notifications/smartboard.mdx)
doc. To stay notified of active alerts,
enable [centralized alert notifications](https://github.com/netdata/netdata/blob/master/docs/cloud/alerts-notifications/notifications.mdx)
from Netdata Cloud.
If you're through with setting up alerts, it might be time
to [invite your team](https://github.com/netdata/netdata/blob/master/docs/cloud/manage/invite-your-team.md).
Check out our recommendations on organizing and
using [Spaces](https://github.com/netdata/netdata/blob/master/docs/cloud/spaces.md) and
[War Rooms](https://github.com/netdata/netdata/blob/master/docs/cloud/war-rooms.md) to streamline your processes once
you find an alert in Netdata Cloud.
|
