1
2
3
4
5
6
7
8
9
10
11
12
13
14
15
16
17
18
19
20
21
22
23
24
25
26
27
28
29
30
31
32
33
34
35
36
37
38
39
40
41
42
43
44
45
46
47
48
49
50
51
52
53
54
55
56
57
58
59
60
61
62
63
64
65
66
67
68
69
70
71
72
73
74
75
76
77
78
79
80
81
82
83
84
85
86
87
88
89
90
91
92
93
94
95
96
97
98
99
100
101
102
103
104
105
106
107
108
109
110
111
112
113
114
115
116
117
118
119
120
121
122
|
---
title: "Build new dashboards"
description: >-
"Design new dashboards that target your infrastructure's unique needs and share them with your team for
targeted visual anomaly detection or incident response."
custom_edit_url: "https://github.com/netdata/netdata/blob/master/docs/cloud/visualize/dashboards.md"
sidebar_label: "Build new dashboards"
learn_status: "Published"
learn_topic_type: "Tasks"
learn_rel_path: "Operations/Visualizations"
---
With Netdata Cloud, you can build new dashboards that target your infrastructure's unique needs. Put key metrics from
any number of distributed systems in one place for a bird's eye view of your infrastructure.
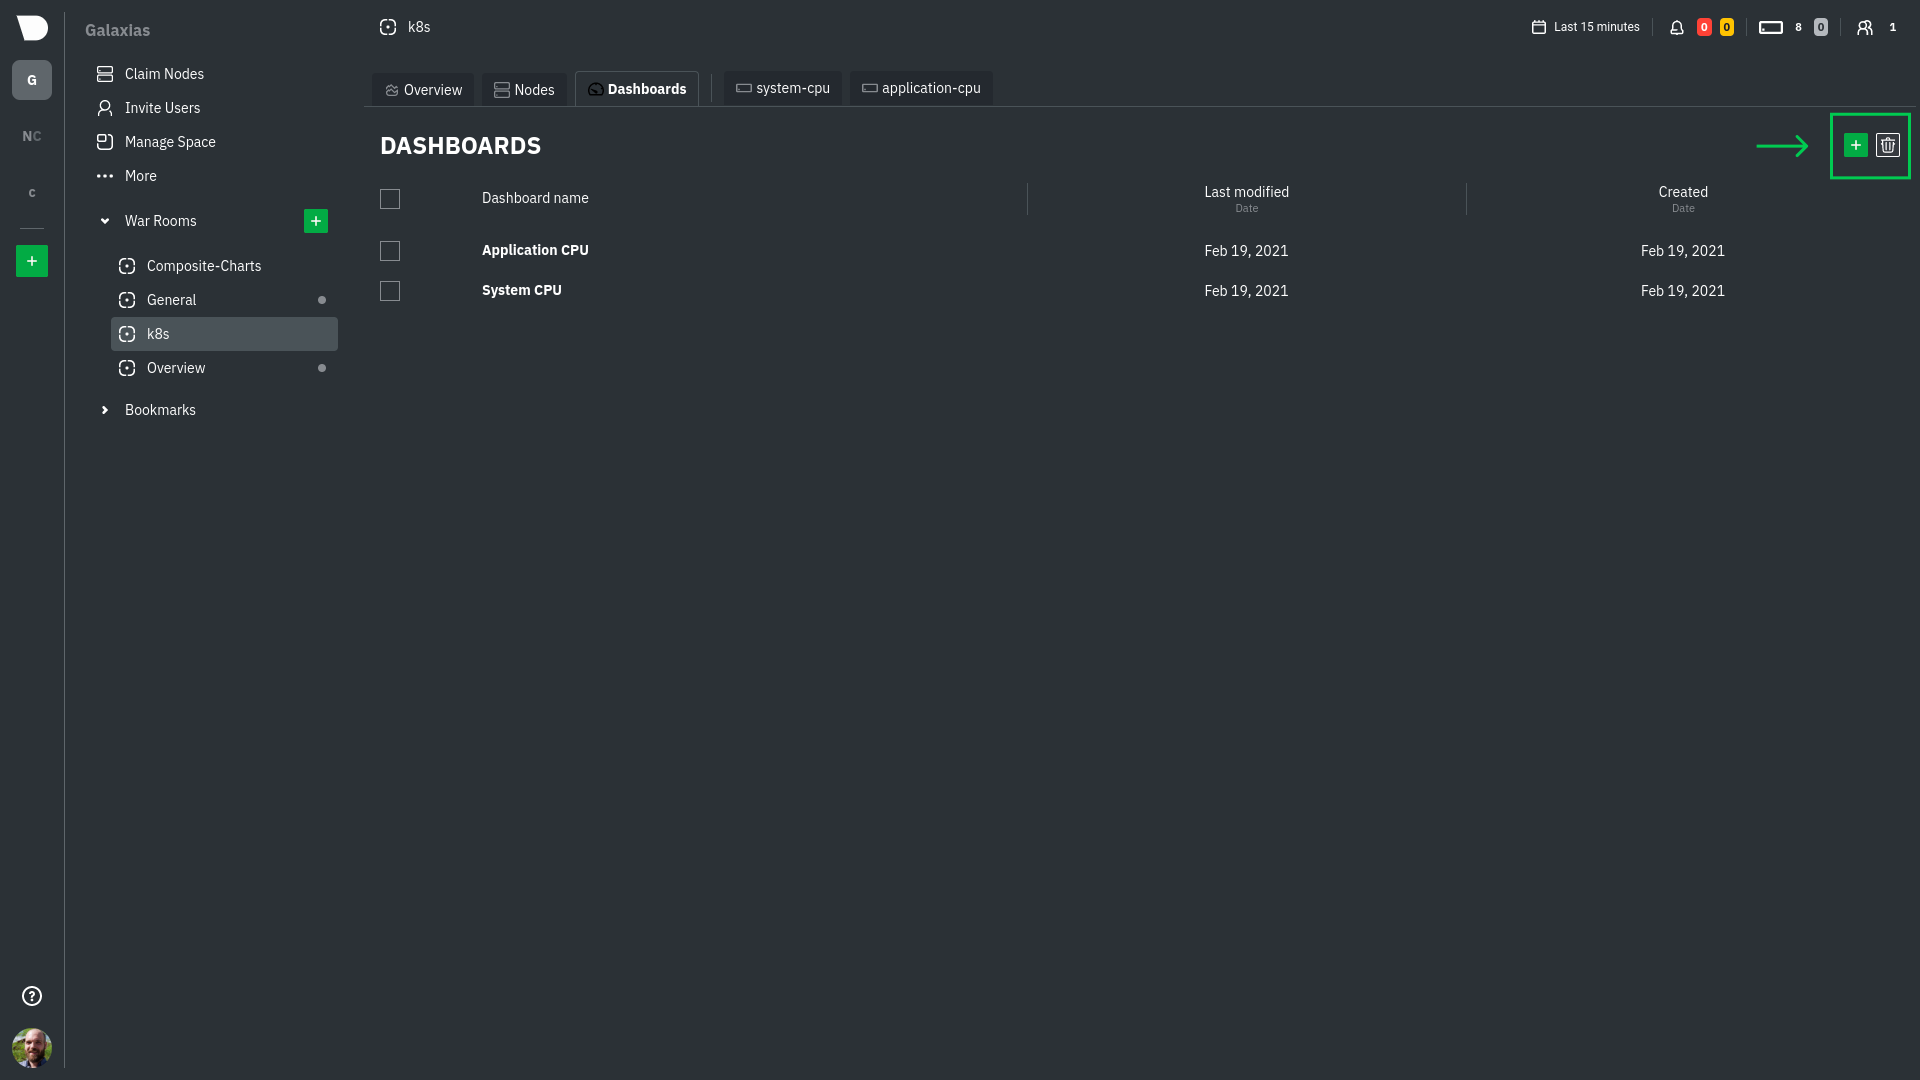
Click on the **Dashboards** tab in any War Room to get started.
## Create your first dashboard
From the Dashboards tab, click on the **+** button.
In the modal, give your new dashboard a name, and click **+ Add**.
Click the **Add Chart** button to add your first chart card. From the dropdown, select either *All Nodes** or a specific
node. If you select **All Nodes**, you will add a [composite chart](/docs/cloud/visualize/overview#composite-charts) to
your new dashboard. Next, select the context. You'll see a preview of the chart before you finish adding it.
The **Add Text** button creates a new card with user-defined text, which you can use to describe or document a
particular dashboard's meaning and purpose.
Be sure to click the **Save** button any time you make changes to your dashboard.

## Using your dashboard
Dashboards are designed to be interactive and flexible so you can design them to your exact needs. Dashboards are made
of any number of **cards**, which can contain charts or text.
### Chart cards
Click the **Add Chart** button to add your first chart card. From the dropdown, select either *All Nodes** or a specific
node. If you select **All Nodes**, you will add a [composite chart](/docs/cloud/visualize/overview#composite-charts) to
your new dashboard. Next, select the context. You'll see a preview of the chart before you finish adding it.
The charts you add to any dashboard are fully interactive, just like the charts in an Agent dashboard or a single node's
dashboard in Cloud. Zoom in and out, highlight timeframes, and more. See our
[Agent dashboard docs](https://learn.netdata.cloud/docs/agent/web#using-charts) for all the shortcuts.
Charts also synchronize as you interact with them, even across contexts _or_ nodes.
### Text cards
The **Add Text** button creates a new card with user-defined text. When you create a new text card or edit an existing
one, select/highlight characters or words to open a modal to make them **bold**, _italic_, or <ins>underlined</ins>. You
can also create a link.
### Move cards
To move any card, click and hold on the top of the card, then drag it to a new location. A red placeholder indicates the
new location. Once you release your mouse, other charts re-sort to the grid system automatically.
### Resize cards
To resize any card on a dashboard, click on the bottom-right corner and drag to the card's new size. Other cards re-sort
to the grid system automatically.
## Jump to single-node dashboards
Quickly jump to any node's dashboard by clicking the 3-dot icon in the corner of any card to open a menu. Hit the **Go
to Chart** item.
You'll land directly on that chart of interest, but you can now scroll up and down to correlate your findings with other
charts. Of course, you can continue to zoom, highlight, and pan through time just as you're used to with Agent
dashboards.
## Pin dashboards
Click on the **Pin** button in any dashboard to put those charts into a separate panel at the bottom of the screen. You
can now navigate through Netdata Cloud freely, individual Cloud dashboards, the Nodes view, different War Rooms, or even
different Spaces, and have those valuable metrics follow you.
Pinning dashboards helps you correlate potentially related charts across your infrastructure, no matter how you
organized your Spaces and War Rooms, and helps you discover root causes faster.
## Manage your dashboards
To see dashboards associated with the current War Room, click **Dashboards** tab in any War Room. You can select
dashboards and delete them using the 🗑️ icon.
### Update/save a dashboard
If you've made changes to a dashboard, such as adding or moving cards, the **Save** button is enabled. Click it to save
your most recent changes. Any other members of the War Room will be able to see these changes the next time they load
this dashboard.
If multiple users attempt to make concurrent changes to the same dashboard, the second user who hits Save will be
prompted to either overwrite the dashboard or reload to see the most recent changes.
### Remove an individual card
Click on the 3-dot icon in the corner of any card to open a menu. Click the **Remove Card** item to remove the card.
### Delete a dashboard
Delete any dashboard by navigating to it and clicking the **Delete** button. This will remove this entry from the
dropdown for every member of this War Room.
### Minimum browser viewport
Because of the visual complexity of individual charts, dashboards require a minimum browser viewport of 800px.
## What's next?
Once you've designed a dashboard or two, make sure
to [invite your team](https://github.com/netdata/netdata/blob/master/docs/cloud/manage/invite-your-team.md) if
you haven't already. You can add these new users to the same War Room to let them see the same dashboards without any
effort.
|
