1
2
3
4
5
6
7
8
9
10
11
12
13
14
15
16
17
18
19
20
21
22
23
24
25
26
27
28
29
30
31
32
33
34
35
36
37
38
39
40
41
42
43
44
45
46
47
48
49
50
51
52
53
54
55
56
57
58
59
60
61
62
63
64
65
66
67
68
69
70
71
72
73
74
75
76
77
78
79
80
81
82
83
84
85
86
87
88
89
90
91
92
93
94
95
96
97
98
99
100
101
102
103
104
105
106
107
108
109
110
111
112
113
114
115
116
117
118
119
120
121
122
123
124
125
126
127
128
129
130
131
132
133
134
135
136
137
138
139
140
141
142
143
144
145
146
147
148
149
150
151
152
153
154
155
156
157
158
159
160
161
162
163
164
165
166
167
168
169
170
171
172
173
174
175
176
177
178
179
180
181
182
183
184
185
186
187
188
189
190
191
192
193
194
195
196
197
198
199
200
201
202
203
204
205
206
207
208
209
210
211
212
213
214
215
216
217
218
219
220
221
222
223
224
225
226
227
228
229
230
231
232
233
234
235
236
237
238
239
240
241
242
243
244
245
246
247
248
249
250
251
252
253
254
255
256
257
258
259
260
261
262
263
264
265
266
267
268
269
270
271
272
273
274
275
276
277
278
|
<!--
title: "Monitor a Kubernetes (k8s) cluster with Netdata"
description: "Use Netdata's helmchart, service discovery plugin, and Kubelet/kube-proxy collectors for real-time visibility into your Kubernetes cluster."
image: /img/seo/guides/monitor/kubernetes-k8s-netdata.png
custom_edit_url: https://github.com/netdata/netdata/edit/master/docs/guides/monitor/kubernetes-k8s-netdata.md
-->
# Monitor a Kubernetes cluster with Netdata
While Kubernetes (k8s) might simplify the way you deploy, scale, and load-balance your applications, not all clusters
come with "batteries included" when it comes to monitoring. Doubly so for a monitoring stack that helps you actively
troubleshoot issues with your cluster.
Some k8s providers, like GKE (Google Kubernetes Engine), do deploy clusters bundled with monitoring capabilities, such
as Google Stackdriver Monitoring. However, these pre-configured solutions might not offer the depth of metrics,
customization, or integration with your preferred alerting methods.
Without this visibility, it's like you built an entire house and _then_ smashed your way through the finished walls to
add windows.
At Netdata, we're working to build Kubernetes monitoring tools that add visibility without complexity while also helping
you actively troubleshoot anomalies or outages. Better yet, this toolkit includes a few complementary collectors that
let you monitor the many layers of a Kubernetes cluster entirely for free.
We already have a few complementary tools and collectors for monitoring the many layers of a Kubernetes cluster,
_entirely for free_. These methods work together to help you troubleshoot performance or availability issues across
your k8s infrastructure.
- A [Helm chart](https://github.com/netdata/helmchart), which bootstraps a Netdata Agent pod on every node in your
cluster, plus an additional parent pod for storing metrics and managing alarm notifications.
- A [service discovery plugin](https://github.com/netdata/agent-service-discovery), which discovers and creates
configuration files for [compatible
applications](https://github.com/netdata/helmchart#service-discovery-and-supported-services) and any endpoints
covered by our [generic Prometheus
collector](https://learn.netdata.cloud/docs/agent/collectors/go.d.plugin/modules/prometheus). With these
configuration files, Netdata collects metrics from any compatible applications as they run _inside_ of a pod.
Service discovery happens without manual intervention as pods are created, destroyed, or moved between nodes.
- A [Kubelet collector](https://learn.netdata.cloud/docs/agent/collectors/go.d.plugin/modules/k8s_kubelet), which runs
on each node in a k8s cluster to monitor the number of pods/containers, the volume of operations on each container,
and more.
- A [kube-proxy collector](https://learn.netdata.cloud/docs/agent/collectors/go.d.plugin/modules/k8s_kubeproxy), which
also runs on each node and monitors latency and the volume of HTTP requests to the proxy.
- A [cgroups collector](/collectors/cgroups.plugin/README.md), which collects CPU, memory, and bandwidth metrics for
each container running on your k8s cluster.
By following this guide, you'll learn how to discover, explore, and take away insights from each of these layers in your
Kubernetes cluster. Let's get started.
## Prerequisites
To follow this guide, you need:
- A working cluster running Kubernetes v1.9 or newer.
- The [kubectl](https://kubernetes.io/docs/reference/kubectl/overview/) command line tool, within [one minor version
difference](https://kubernetes.io/docs/tasks/tools/install-kubectl/#before-you-begin) of your cluster, on an
administrative system.
- The [Helm package manager](https://helm.sh/) v3.0.0 or newer on the same administrative system.
**You need to install the Netdata Helm chart on your cluster** before you proceed. See our [Kubernetes installation
process](/packaging/installer/methods/kubernetes.md) for details.
This guide uses a 3-node cluster, running on Digital Ocean, as an example. This cluster runs CockroachDB, Redis, and
Apache, which we'll use as examples of how to monitor a Kubernetes cluster with Netdata.
```bash
kubectl get nodes
NAME STATUS ROLES AGE VERSION
pool-0z7557lfb-3fnbf Ready <none> 51m v1.17.5
pool-0z7557lfb-3fnbx Ready <none> 51m v1.17.5
pool-0z7557lfb-3fnby Ready <none> 51m v1.17.5
kubectl get pods
NAME READY STATUS RESTARTS AGE
cockroachdb-0 1/1 Running 0 44h
cockroachdb-1 1/1 Running 0 44h
cockroachdb-2 1/1 Running 1 44h
cockroachdb-init-q7mp6 0/1 Completed 0 44h
httpd-6f6cb96d77-4zlc9 1/1 Running 0 2m47s
httpd-6f6cb96d77-d9gs6 1/1 Running 0 2m47s
httpd-6f6cb96d77-xtpwn 1/1 Running 0 11m
netdata-child-5p2m9 2/2 Running 0 42h
netdata-child-92qvf 2/2 Running 0 42h
netdata-child-djc6w 2/2 Running 0 42h
netdata-parent-0 1/1 Running 0 42h
redis-6bb94d4689-6nn6v 1/1 Running 0 73s
redis-6bb94d4689-c2fk2 1/1 Running 0 73s
redis-6bb94d4689-tjcz5 1/1 Running 0 88s
```
## Explore Netdata's Kubernetes charts
The Helm chart installs and enables everything you need for visibility into your k8s cluster, including the service
discovery plugin, Kubelet collector, kube-proxy collector, and cgroups collector.
To get started, open your browser and navigate to your cluster's Netdata dashboard. See our [Kubernetes installation
instructions](/packaging/installer/methods/kubernetes.md) for how to access the dashboard based on your cluster's
configuration.
You'll see metrics from the parent pod as soon as you navigate to the dashboard:
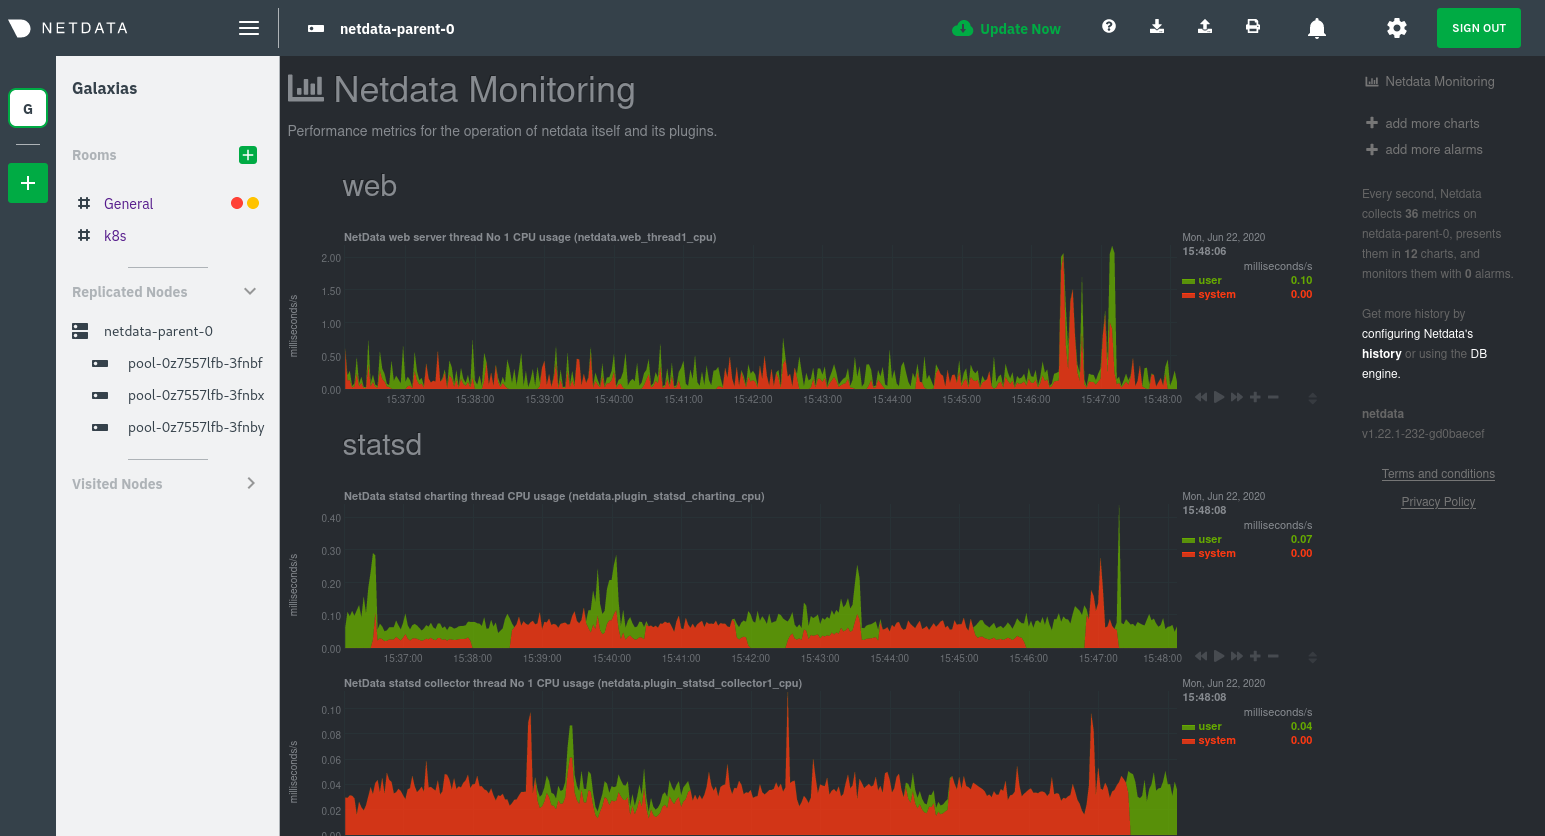
Remember that the parent pod is responsible for storing metrics from all the child pods and sending alarms.
Take note of the **Replicated Nodes** menu, which shows not only the parent pod, but also the three child pods. This
example cluster has three child pods, but the number of child pods depends entirely on the number of nodes in your
cluster.
You'll use the links in the **Replicated Nodes** menu to navigate between the various pods in your cluster. Let's do
that now to explore the pod-level Kubernetes monitoring Netdata delivers.
### Pods
Click on any of the nodes under **netdata-parent-0**. Netdata redirects you to a separate instance of the Netdata
dashboard, run by the Netdata child pod, which visualizes thousands of metrics from that node.
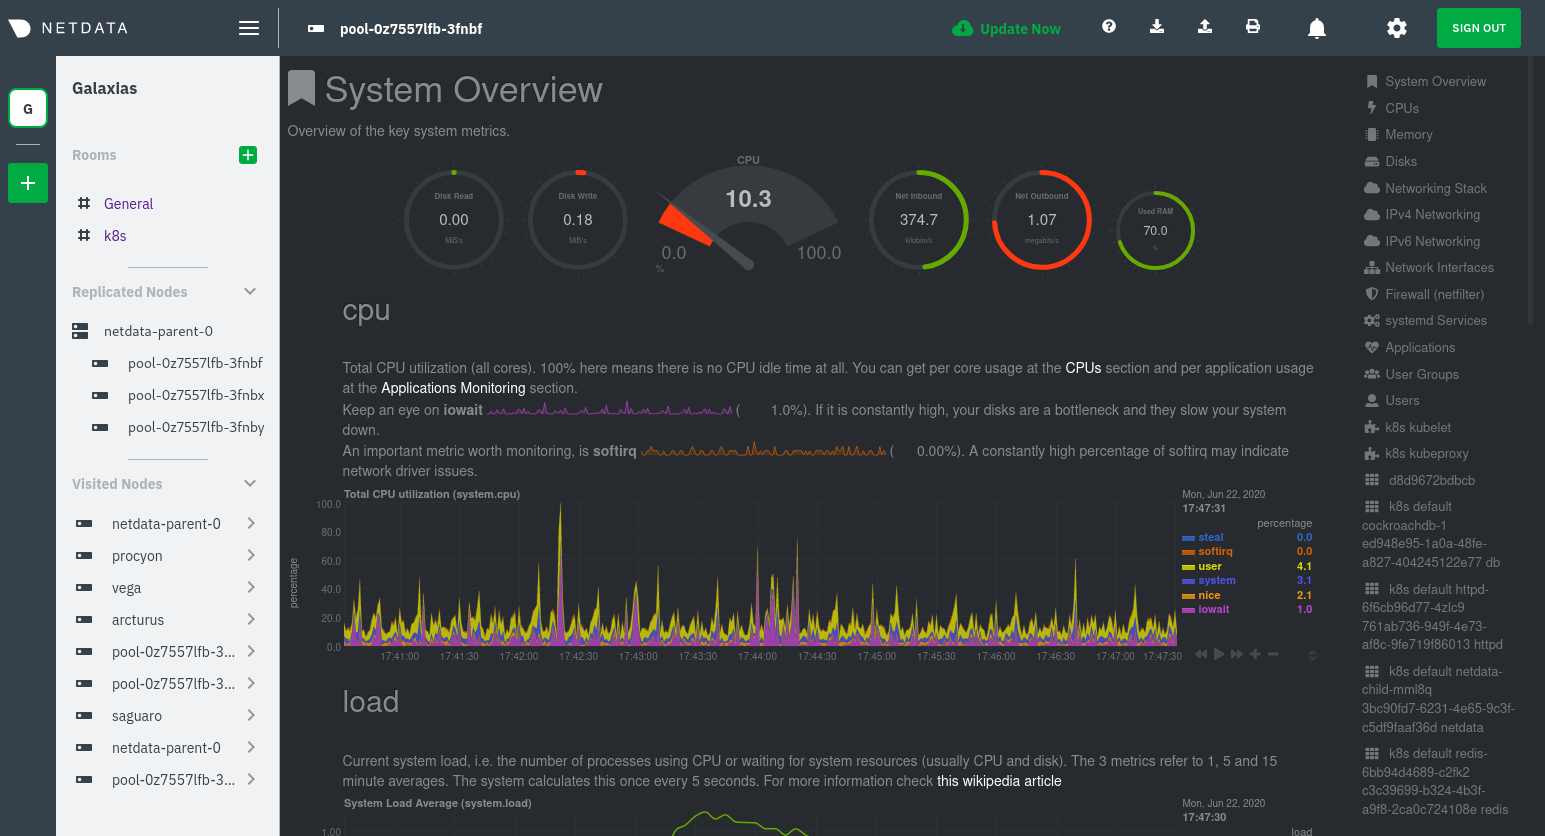
From this dashboard, you can see all the familiar charts showing the health and performance of an individual node, just
like you would if you installed Netdata on a single physical system. Explore CPU, memory, bandwidth, networking, and
more.
You can use the menus on the right-hand side of the dashboard to navigate between different sections of charts and
metrics.
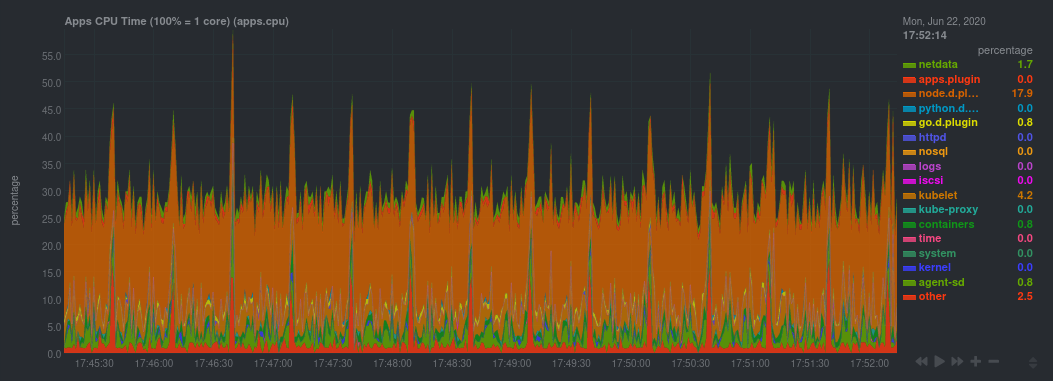
For example, click on the **Applications** section to view per-application metrics, collected by
[apps.plugin](/collectors/apps.plugin/README.md). The first chart you see is **Apps CPU Time (100% = 1 core)
(apps.cpu)**, which shows the CPU utilization of various applications running on the node. You shouldn't be surprised to
find Netdata processes (`netdata`, `sd-agent`, and more) alongside Kubernetes processes (`kubelet`, `kube-proxy`, and
`containers`).
Beneath the **Applications** section, you'll begin to see sections for **k8s kubelet**, **k8s kubeproxy**, and long
strings that start with **k8s**, which are sections for metrics collected by
[`cgroups.plugin`](/collectors/cgroups.plugin/README.md). Let's skip over those for now and head further down to see
Netdata's service discovery in action.
### Service discovery (services running inside of pods)
Thanks to Netdata's service discovery feature, you monitor containerized applications running in k8s pods with zero
configuration or manual intervention. Service discovery is like a watchdog for created or deleted pods, recognizing the
service they run based on the image name and port and immediately attempting to apply a logical default configuration.
Service configuration supports [popular
applications](https://github.com/netdata/helmchart#service-discovery-and-supported-services), plus any endpoints covered
by our [generic Prometheus collector](https://learn.netdata.cloud/docs/agent/collectors/go.d.plugin/modules/prometheus),
which are automatically added or removed from Netdata as soon as the pods are created or destroyed.
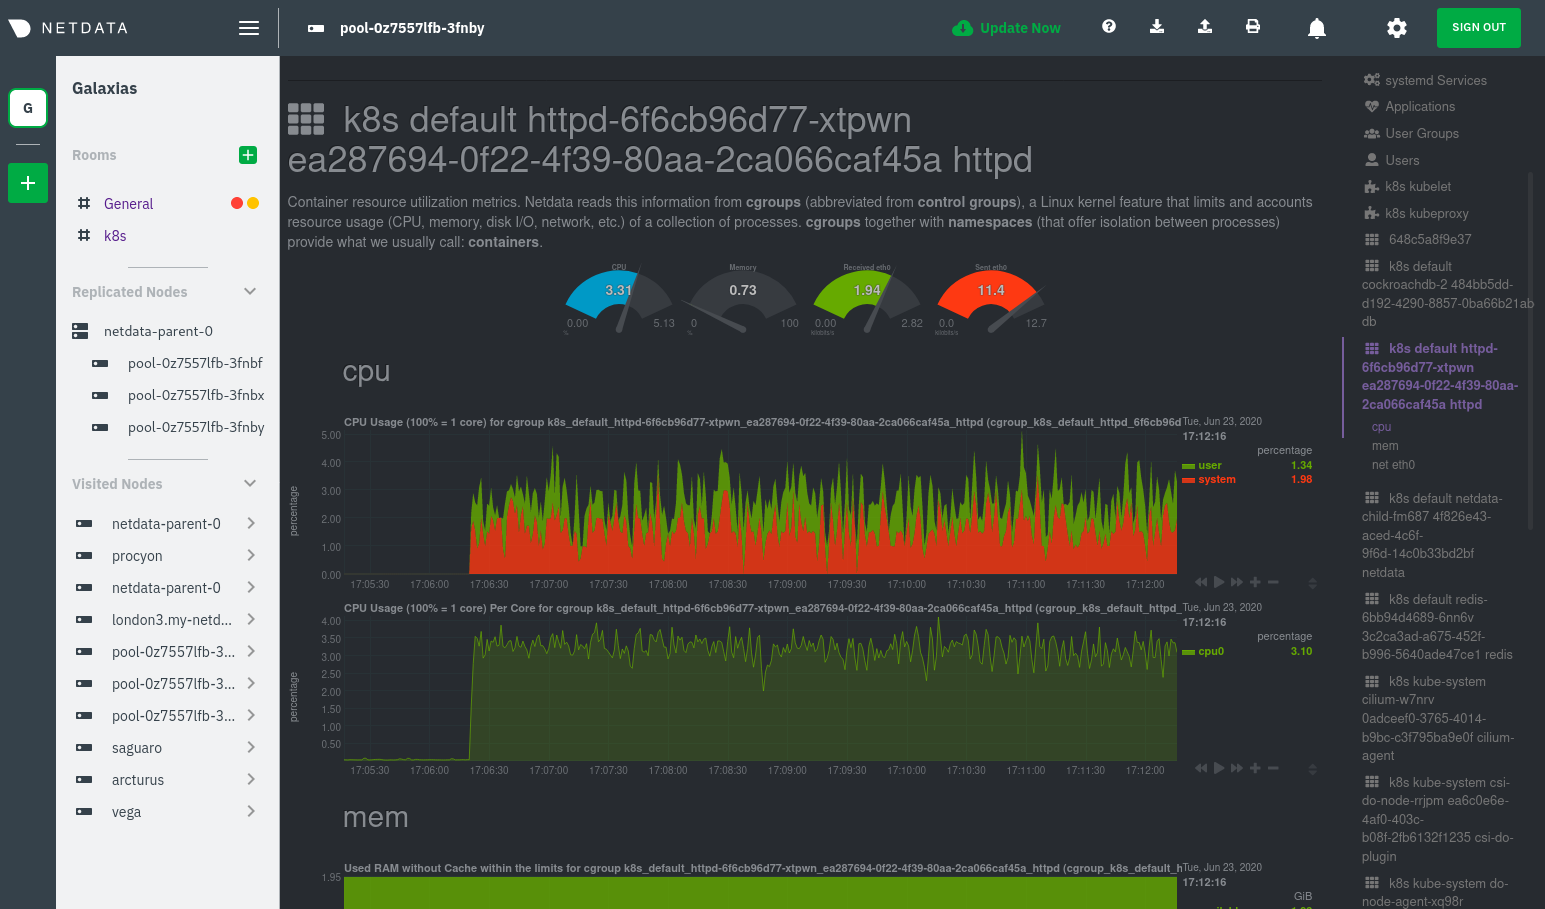
You can find these service discovery sections near the bottom of the menu. The names for these sections follow a
pattern: the name of the detected service, followed by a string of the module name, pod TUID, service type, port
protocol, and port number. See the graphic below to help you identify service discovery sections.
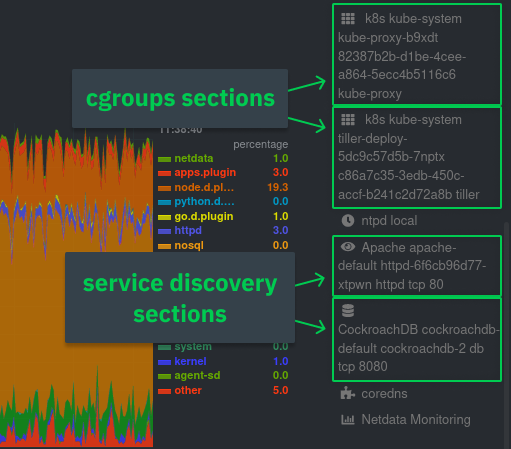
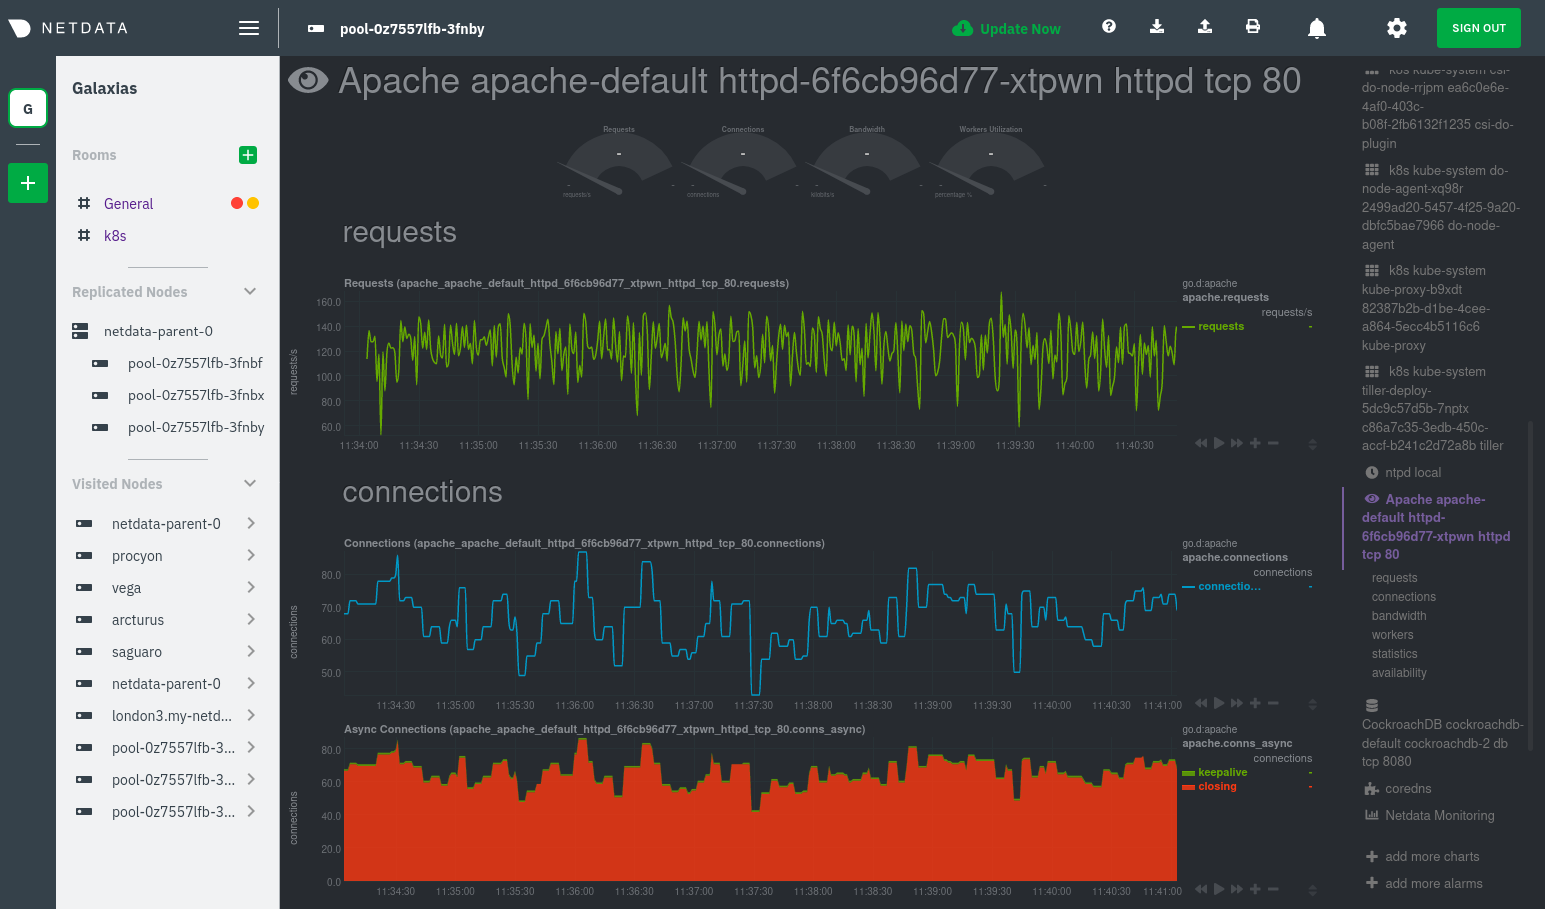
For example, the first service discovery section shows metrics for a pod running an Apache web server running on port 80
in a pod named `httpd-6f6cb96d77-xtpwn`.
> If you don't see any service discovery sections, it's either because your services are not compatible with service
> discovery or you changed their default configuration, such as the listening port. See the [list of supported
> services](https://github.com/netdata/helmchart#service-discovery-and-supported-services) for details about whether
> your installed services are compatible with service discovery, or read the [configuration
> instructions](/packaging/installer/methods/kubernetes.md#configure-service-discovery) to change how it discovers the
> supported services.
Click on any of these service discovery sections to see metrics from that particular service. For example, click on the
**Apache apache-default httpd-6f6cb96d77-xtpwn httpd tcp 80** section brings you to a series of charts populated by the
[Apache collector](https://learn.netdata.cloud/docs/agent/collectors/go.d.plugin/modules/apache) itself.
With service discovery, you can now see valuable metrics like requests, bandwidth, workers, and more for this pod.
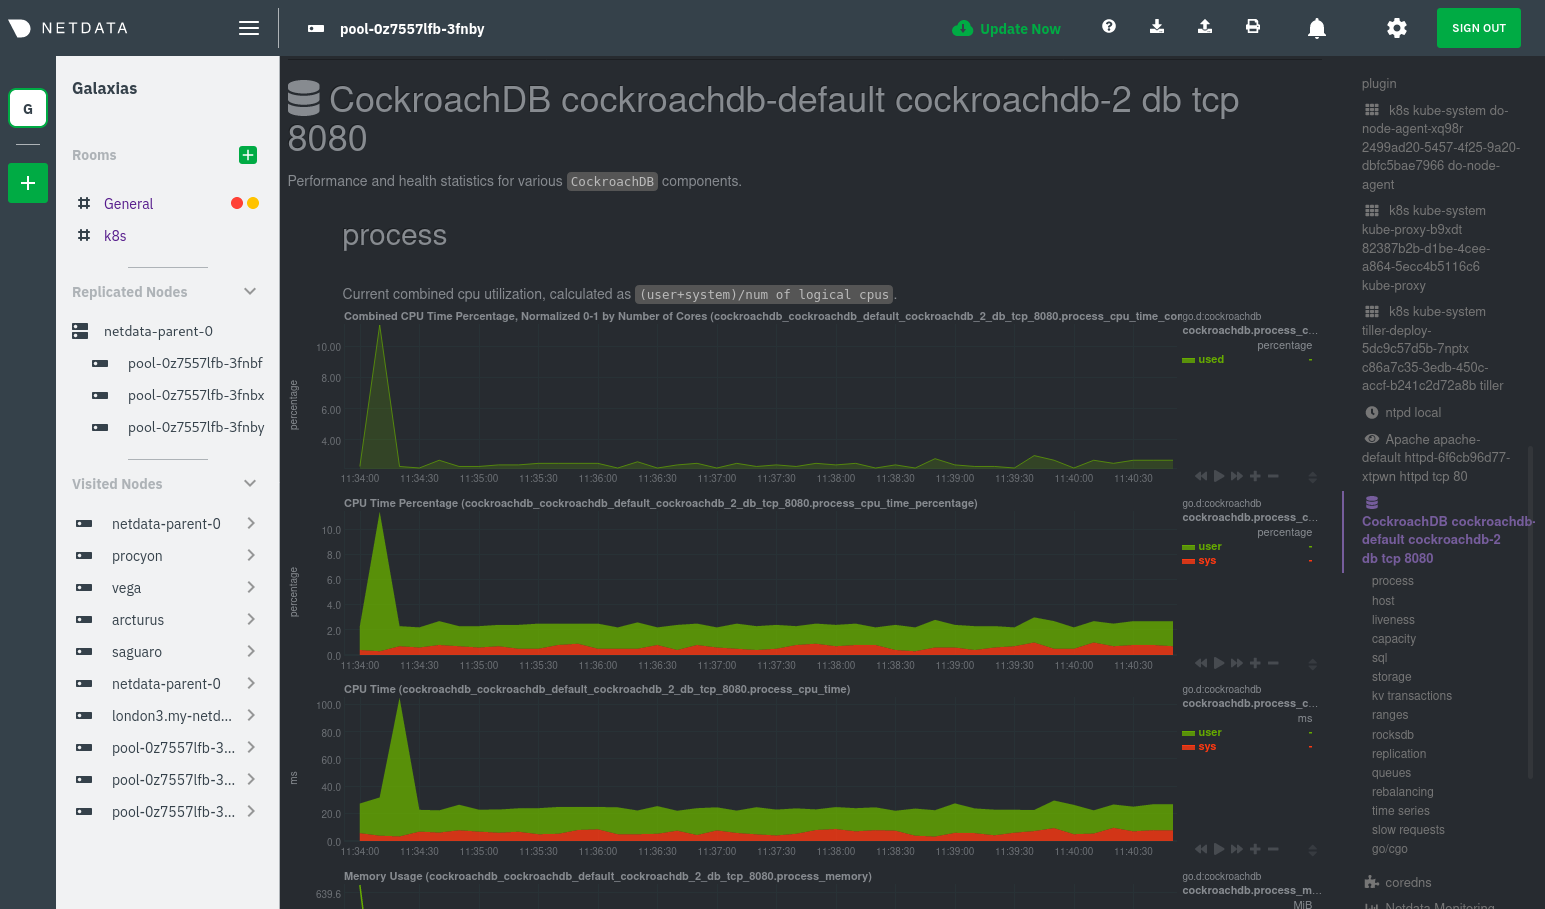
The same goes for metrics coming from the CockroachDB pod running on this same node.
Service discovery helps you monitor the health of specific applications running on your Kubernetes cluster, which in
turn gives you a complete resource when troubleshooting your infrastructure's health and performance.
### Kubelet
Let's head back up the menu to the **k8s kubelet** section. Kubelet is an agent that runs on every node in a cluster. It
receives a set of PodSpecs from the Kubernetes Control Plane and ensures the pods described there are both running and
healthy. Think of it as a manager for the various pods on that node.
Monitoring each node's Kubelet can be invaluable when diagnosing issues with your Kubernetes cluster. For example, you
can see when the volume of running containers/pods has dropped.
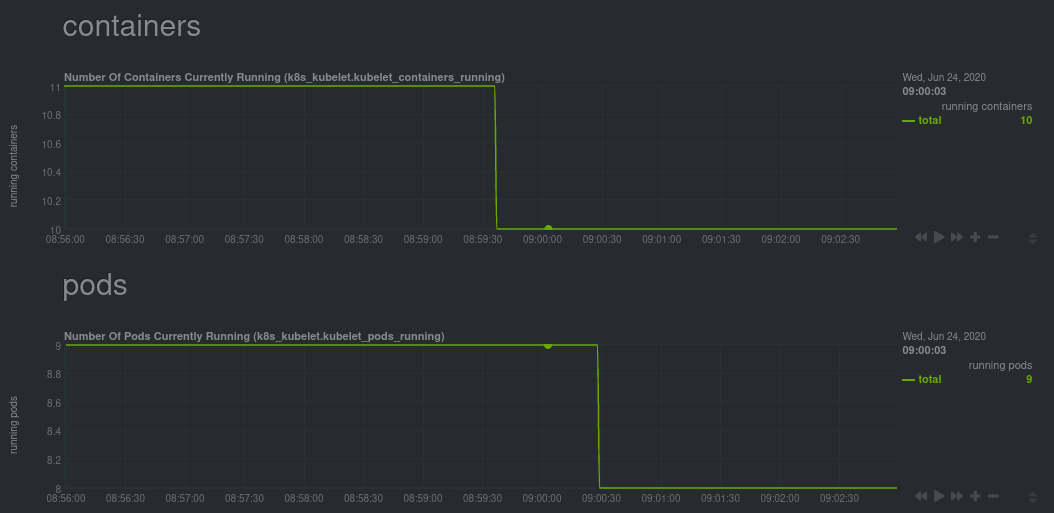
This drop might signal a fault or crash in a particular Kubernetes service or deployment (see `kubectl get services` or
`kubectl get deployments` for more details). If the number of pods increases, it may be because of something more
benign, like another member of your team scaling up a service with `kubectl scale`.
You can also view charts for the Kubelet API server, the volume of runtime/Docker operations by type,
configuration-related errors, and the actual vs. desired numbers of volumes, plus a lot more.
Kubelet metrics are collected and visualized thanks to the [kubelet
collector](https://learn.netdata.cloud/docs/agent/collectors/go.d.plugin/modules/k8s_kubelet), which is enabled with
zero configuration on most Kubernetes clusters with standard configurations.
### kube-proxy
Scroll down into the **k8s kubeproxy** section to see metrics about the network proxy that runs on each node in your
Kubernetes cluster. kube-proxy allows for pods to communicate with each other and accept sessions from outside your
cluster.
With Netdata, you can monitor how often your k8s proxies are syncing proxy rules between nodes. Dramatic changes in
these figures could indicate an anomaly in your cluster that's worthy of further investigation.
kube-proxy metrics are collected and visualized thanks to the [kube-proxy
collector](https://learn.netdata.cloud/docs/agent/collectors/go.d.plugin/modules/k8s_kubeproxy), which is enabled with
zero configuration on most Kubernetes clusters with standard configurations.
### Containers
We can finally talk about the final piece of Kubernetes monitoring: containers. Each Kubernetes pod is a set of one or
more cooperating containers, sharing the same namespace, all of which are resourced and tracked by the cgroups feature
of the Linux kernel. Netdata automatically detects and monitors each running container by interfacing with the cgroups
feature itself.
You can find these sections beneath **Users**, **k8s kubelet**, and **k8s kubeproxy**. Below, a number of containers
devoted to running services like CockroachDB, Apache, Redis, and more.
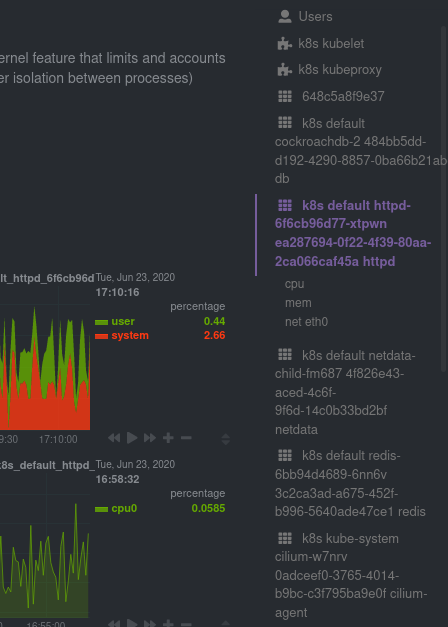
Let's look at the section devoted to the container that runs the Apache pod named `httpd-6f6cb96d77-xtpwn`, as described
in the previous part on [service discovery](#service-discovery-services-running-inside-of-pods).
At first glance, these sections might seem redundant. You might ask, "Why do I need both a service discovery section
_and_ a container section? It's just one pod, after all!"
The difference is that while the service discovery section shows _Apache_ metrics, the equivalent cgroups section shows
that container's CPU, memory, and bandwidth usage. You can use the two sections in conjunction to monitor the health and
performance of your pods and the services they run.
For example, let's say you get an alarm notification from `netdata-parent-0` saying the
`ea287694-0f22-4f39-80aa-2ca066caf45a` container (also known as the `httpd-6f6cb96d77-xtpwn` pod) is using 99% of its
available RAM. You can then hop over to the **Apache apache-default httpd-6f6cb96d77-xtpwn httpd tcp 80** section to
further investigate why Apache is using an unexpected amount of RAM.
All container metrics, whether they're managed by Kubernetes or the Docker service directly, are collected by the
[cgroups collector](/collectors/cgroups.plugin/README.md). Because this collector integrates with the cgroups Linux
kernel feature itself, monitoring containers requires zero configuration on most Kubernetes clusters.
## What's next?
After following this guide, you should have a more comprehensive understanding of how to monitor your Kubernetes cluster
with Netdata. With this setup, you can monitor the health and performance of all your nodes, pods, services, and k8s
agents. Pre-configured alarms will tell you when something goes awry, and this setup gives you every per-second metric
you need to make informed decisions about your cluster.
The best part of monitoring a Kubernetes cluster with Netdata is that you don't have to worry about constantly running
complex `kubectl` commands to see hundreds of highly granular metrics from your nodes. And forget about using `kubectl
exec -it pod bash` to start up a shell on a pod to find and diagnose an issue with any given pod on your cluster.
And with service discovery, all your compatible pods will automatically appear and disappear as they scale up, move, or
scale down across your cluster.
To monitor your Kubernetes cluster with Netdata, start by [installing the Helm
chart](/packaging/installer/methods/kubernetes.md) if you haven't already. The Netdata Agent is open source and entirely
free for every cluster and every organization, whether you have 10 or 10,000 pods. A few minutes and one `helm install`
later and you'll have started on the path of building an effective platform for troubleshooting the next performance or
availability issue on your Kubernetes cluster.
[](<>)
|
