1
2
3
4
5
6
7
8
9
10
11
12
13
14
15
16
17
18
19
20
21
22
23
24
25
26
27
28
29
30
31
32
33
34
35
36
37
38
39
40
41
42
43
44
45
46
47
48
49
50
51
52
53
54
55
56
57
58
59
60
61
62
63
64
65
66
67
68
69
70
71
72
73
74
75
76
77
78
79
80
81
82
83
84
85
86
87
88
89
90
91
92
93
94
95
96
97
98
99
100
101
102
103
104
105
106
107
108
109
110
111
112
113
114
115
116
117
118
119
120
121
122
123
124
125
126
127
128
129
130
131
132
133
134
135
136
137
138
139
140
141
142
143
144
145
146
147
148
149
150
151
152
153
154
155
156
157
158
159
160
161
162
|
<!--
title: "Monitor Pi-hole (and a Raspberry Pi) with Netdata"
description: "Monitor Pi-hole metrics, plus Raspberry Pi system metrics, in minutes and completely for free with Netdata's open-source monitoring agent."
image: /img/seo/guides/monitor/netdata-pi-hole-raspberry-pi.png
custom_edit_url: https://github.com/netdata/netdata/edit/master/docs/guides/monitor/pi-hole-raspberry-pi.md
-->
import { OneLineInstallWget } from '@site/src/components/OneLineInstall/'
# Monitor Pi-hole (and a Raspberry Pi) with Netdata
Between intrusive ads, invasive trackers, and vicious malware, many techies and homelab enthusiasts are advancing their
networks' security and speed with a tiny computer and a powerful piece of software: [Pi-hole](https://pi-hole.net/).
Pi-hole is a DNS sinkhole that prevents unwanted content from even reaching devices on your home network. It blocks ads
and malware at the network, instead of using extensions/add-ons for individual browsers, so you'll stop seeing ads in
some of the most intrusive places, like your smart TV. Pi-hole can even [improve your network's speed and reduce
bandwidth](https://discourse.pi-hole.net/t/will-pi-hole-slow-down-my-network/2048).
Most Pi-hole users run it on a [Raspberry Pi](https://www.raspberrypi.org/products/raspberry-pi-4-model-b/) (hence the
name), a credit card-sized, super-capable computer that costs about $35.
And to keep tabs on how both Pi-hole and the Raspberry Pi are working to protect your network, you can use the
open-source [Netdata monitoring agent](https://github.com/netdata/netdata).
To get started, all you need is a [Raspberry Pi](https://www.raspberrypi.org/products/raspberry-pi-4-model-b/) with
Raspbian installed. This guide uses a Raspberry Pi 4 Model B and Raspbian GNU/Linux 10 (buster). This guide assumes
you're connecting to a Raspberry Pi remotely over SSH, but you could also complete all these steps on the system
directly using a keyboard, mouse, and monitor.
## Why monitor Pi-hole and a Raspberry Pi with Netdata?
Netdata helps you monitor and troubleshoot all kinds of devices and the applications they run, including IoT devices
like the Raspberry Pi and applications like Pi-hole.
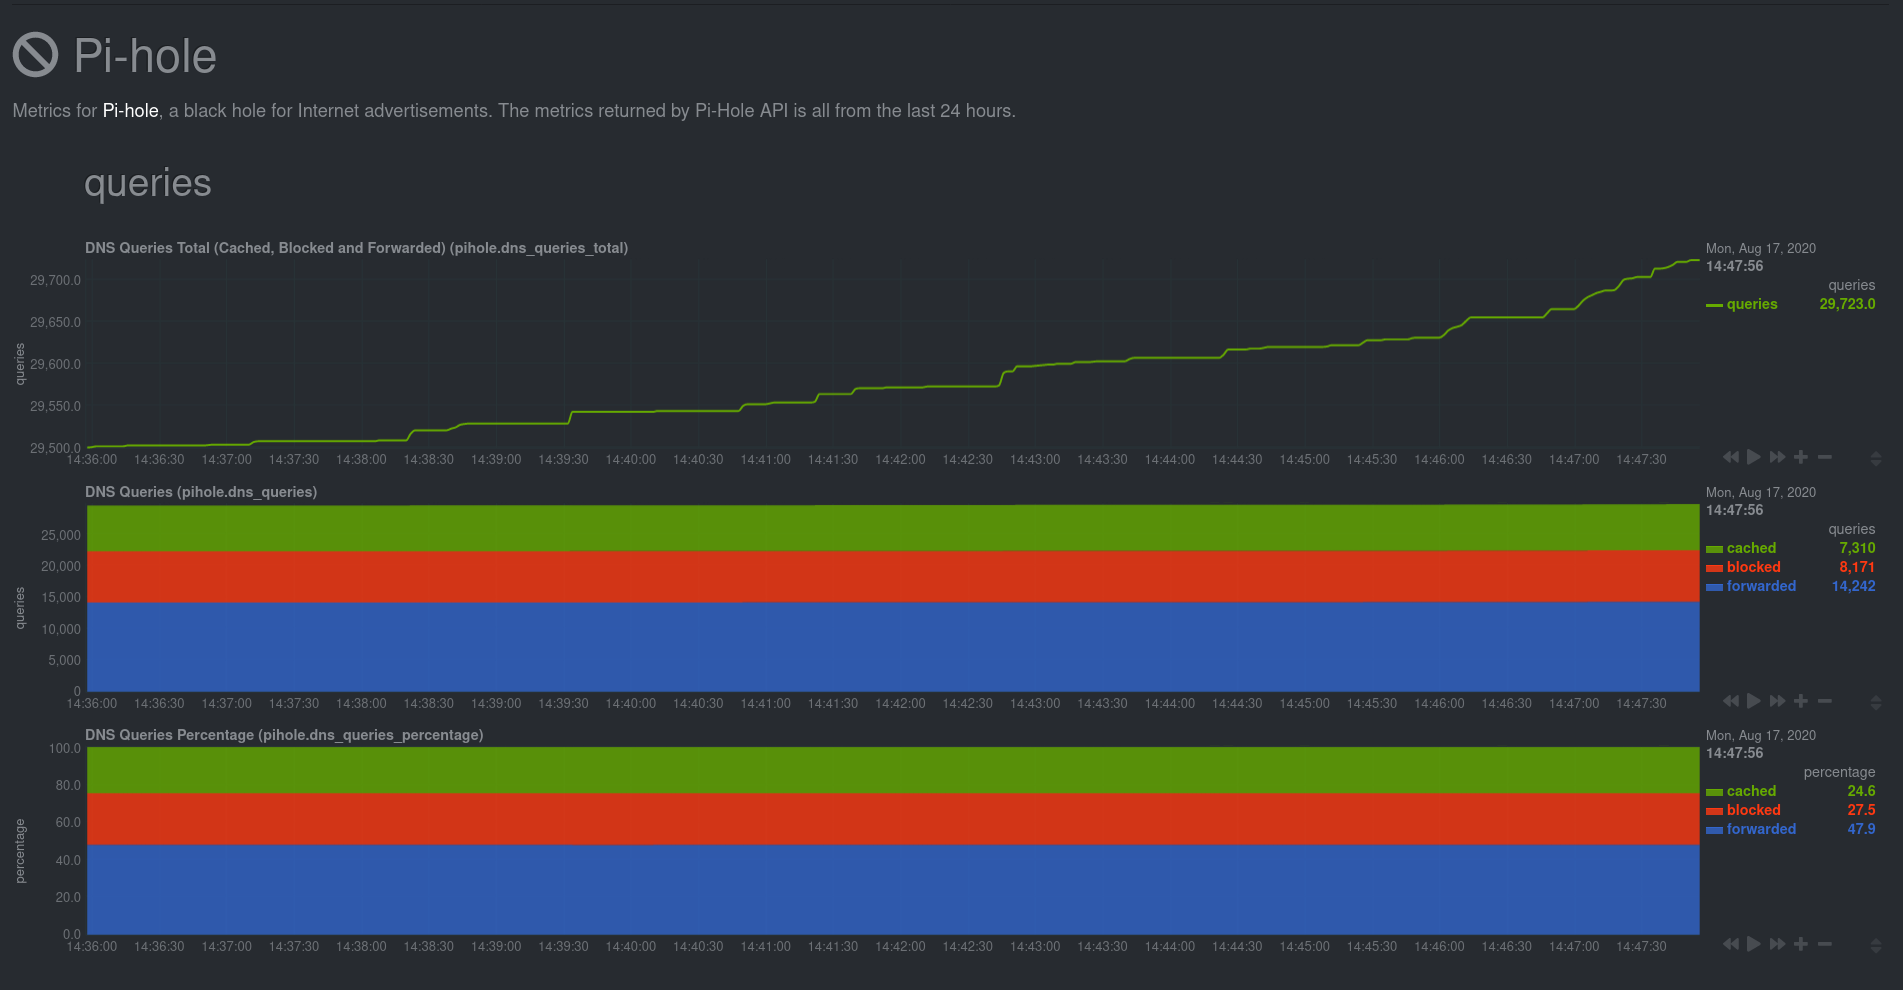
After a two-minute installation and with zero configuration, you'll be able to see all of Pi-hole's metrics, including
the volume of queries, connected clients, DNS queries per type, top clients, top blocked domains, and more.
With Netdata installed, you can also monitor system metrics and any other applications you might be running. By default,
Netdata collects metrics on CPU usage, disk IO, bandwidth, per-application resource usage, and a ton more. With the
Raspberry Pi used for this guide, Netdata automatically collects about 1,500 metrics every second!
## Install Netdata
Let's start by installing Netdata first so that it can start collecting system metrics as soon as possible for the most
possible historic data.
> ⚠️ Don't install Netdata using `apt` and the default package available in Raspbian. The Netdata team does not maintain
> this package, and can't guarantee it works properly.
On Raspberry Pis running Raspbian, the best way to install Netdata is our one-line kickstart script. This script asks
you to install dependencies, then compiles Netdata from source via [GitHub](https://github.com/netdata/netdata).
<OneLineInstallWget/>
Once installed on a Raspberry Pi 4 with no accessories, Netdata starts collecting roughly 1,500 metrics every second and
populates its dashboard with more than 250 charts.
Open your browser of choice and navigate to `http://NODE:19999/`, replacing `NODE` with the IP address of your Raspberry
Pi. Not sure what that IP is? Try running `hostname -I | awk '{print $1}'` from the Pi itself.
You'll see Netdata's dashboard and a few hundred real-time,
[interactive](https://learn.netdata.cloud/guides/step-by-step/step-02#interact-with-charts) charts. Feel free to
explore, but let's turn our attention to installing Pi-hole.
## Install Pi-Hole
Like Netdata, Pi-hole has a one-line script for simple installation. From your Raspberry Pi, run the following:
```bash
curl -sSL https://install.pi-hole.net | bash
```
The installer will help you set up Pi-hole based on the topology of your network. Once finished, you should set up your
devices—or your router for system-wide sinkhole protection—to [use Pi-hole as their DNS
service](https://discourse.pi-hole.net/t/how-do-i-configure-my-devices-to-use-pi-hole-as-their-dns-server/245). You've
finished setting up Pi-hole at this point.
As far as configuring Netdata to monitor Pi-hole metrics, there's nothing you actually need to do. Netdata's [Pi-hole
collector](https://github.com/netdata/go.d.plugin/blob/master/modules/pihole/README.md) will autodetect the new service
running on your Raspberry Pi and immediately start collecting metrics every second.
Restart Netdata with `sudo systemctl restart netdata`, which will then recognize that Pi-hole is running and start a
per-second collection job. When you refresh your Netdata dashboard or load it up again in a new tab, you'll see a new
entry in the menu for **Pi-hole** metrics.
## Use Netdata to explore and monitor your Raspberry Pi and Pi-hole
By the time you've reached this point in the guide, Netdata has already collected a ton of valuable data about your
Raspberry Pi, Pi-hole, and any other apps/services you might be running. Even a few minutes of collecting 1,500 metrics
per second adds up quickly.
You can now use Netdata's synchronized charts to zoom, highlight, scrub through time, and discern how an anomaly in one
part of your system might affect another.

If you're completely new to Netdata, look at our [step-by-step guide](https://github.com/netdata/netdata/blob/master/docs/guides/step-by-step/step-00.md) for a
walkthrough of all its features. For a more expedited tour, see the [get started guide](https://github.com/netdata/netdata/blob/master/docs/get-started.mdx).
### Enable temperature sensor monitoring
You need to manually enable Netdata's built-in [temperature sensor
collector](https://github.com/netdata/netdata/blob/master/collectors/charts.d.plugin/sensors/README.md) to start collecting metrics.
> Netdata uses a few plugins to manage its [collectors](https://github.com/netdata/netdata/blob/master/collectors/REFERENCE.md), each using a different language: Go,
> Python, Node.js, and Bash. While our Go collectors are undergoing the most active development, we still support the
> other languages. In this case, you need to enable a temperature sensor collector that's written in Bash.
First, open the `charts.d.conf` file for editing. You should always use the `edit-config` script to edit Netdata's
configuration files, as it ensures your settings persist across updates to the Netdata Agent.
```bash
cd /etc/netdata
sudo ./edit-config charts.d.conf
```
Uncomment the `sensors=force` line and save the file. Restart Netdata with `sudo systemctl restart netdata` to enable
Raspberry Pi temperature sensor monitoring.
### Storing historical metrics on your Raspberry Pi
By default, Netdata allocates 256 MiB in disk space to store historical metrics inside the [database
engine](https://github.com/netdata/netdata/blob/master/database/engine/README.md). On the Raspberry Pi used for this guide, Netdata collects 1,500 metrics every
second, which equates to storing 3.5 days worth of historical metrics.
You can increase this allocation by editing `netdata.conf` and increasing the `dbengine multihost disk space` setting to
more than 256.
```yaml
[global]
dbengine multihost disk space = 512
```
Use our [database sizing
calculator](https://github.com/netdata/netdata/blob/master/docs/store/change-metrics-storage.md#calculate-the-system-resources-ram-disk-space-needed-to-store-metrics)
and [guide on storing historical metrics](https://github.com/netdata/netdata/blob/master/docs/guides/longer-metrics-storage.md) to help you determine the right
setting for your Raspberry Pi.
## What's next?
Now that you're monitoring Pi-hole and your Raspberry Pi with Netdata, you can extend its capabilities even further, or
configure Netdata to more specific goals.
Most importantly, you can always install additional services and instantly collect metrics from many of them with our
[300+ integrations](https://github.com/netdata/netdata/blob/master/collectors/COLLECTORS.md).
- [Optimize performance](https://github.com/netdata/netdata/blob/master/docs/guides/configure/performance.md) using tweaks developed for IoT devices.
- [Stream Raspberry Pi metrics](https://github.com/netdata/netdata/blob/master/streaming/README.md) to a parent host for easy access or longer-term storage.
- [Tweak alarms](https://github.com/netdata/netdata/blob/master/health/QUICKSTART.md) for either Pi-hole or the health of your Raspberry Pi.
- [Export metrics to external databases](https://github.com/netdata/netdata/blob/master/exporting/README.md) with the exporting engine.
Or, head over to [our guides](https://learn.netdata.cloud/guides/) for even more experiments and insights into
troubleshooting the health of your systems and services.
If you have any questions about using Netdata to monitor your Raspberry Pi, Pi-hole, or any other applications, head on
over to our [community forum](https://community.netdata.cloud/).
|
