1
2
3
4
5
6
7
8
9
10
11
12
13
14
15
16
17
18
19
20
21
22
23
24
25
26
27
28
29
30
31
32
33
34
35
36
37
38
39
40
41
42
43
44
45
46
47
48
49
50
51
52
53
54
55
56
57
58
59
60
61
62
63
64
65
66
67
68
69
70
71
72
73
74
75
76
77
78
79
80
81
82
83
84
85
86
87
88
89
90
91
92
93
94
95
96
|
# Anomaly detection for RPi monitoring
Learn how to use a low-overhead machine learning algorithm alongside Netdata to detect anomalous metrics on a Raspberry Pi.
We love IoT and edge at Netdata, we also love machine learning. Even better if we can combine the two to ease the pain
of monitoring increasingly complex systems.
We recently explored what might be involved in enabling our Python-based [anomalies
collector](https://github.com/netdata/netdata/blob/master/collectors/python.d.plugin/anomalies/README.md) on a Raspberry Pi. To our delight, it's actually quite
straightforward!
Read on to learn all the steps and enable unsupervised anomaly detection on your on Raspberry Pi(s).
> Spoiler: It's just a couple of extra commands that will make you feel like a pro.
## What you need to get started
- A Raspberry Pi running Raspbian, which we'll call a _node_.
- The [open-source Netdata](https://github.com/netdata/netdata) monitoring agent. If you don't have it installed on your
node yet, [get started now](https://github.com/netdata/netdata/blob/master/packaging/installer/README.md).
## Install dependencies
First make sure Netdata is using Python 3 when it runs Python-based data collectors.
Next, open `netdata.conf` using [`edit-config`](https://github.com/netdata/netdata/blob/master/docs/configure/nodes.md#use-edit-config-to-edit-configuration-files)
from within the [Netdata config directory](https://github.com/netdata/netdata/blob/master/docs/configure/nodes.md#the-netdata-config-directory). Scroll down to the
`[plugin:python.d]` section to pass in the `-ppython3` command option.
```conf
[plugin:python.d]
# update every = 1
command options = -ppython3
```
Next, install some of the underlying libraries used by the Python packages the collector depends upon.
```bash
sudo apt install llvm-9 libatlas3-base libgfortran5 libatlas-base-dev
```
Now you're ready to install the Python packages used by the collector itself. First, become the `netdata` user.
```bash
sudo su -s /bin/bash netdata
```
Then pass in the location to find `llvm` as an environment variable for `pip3`.
```bash
LLVM_CONFIG=llvm-config-9 pip3 install --user llvmlite numpy==1.20.1 netdata-pandas==0.0.38 numba==0.50.1 scikit-learn==0.23.2 pyod==0.8.3
```
## Enable the anomalies collector
Now you're ready to enable the collector and [restart Netdata](https://github.com/netdata/netdata/blob/master/docs/configure/start-stop-restart.md).
```bash
sudo ./edit-config python.d.conf
# restart netdata
sudo systemctl restart netdata
```
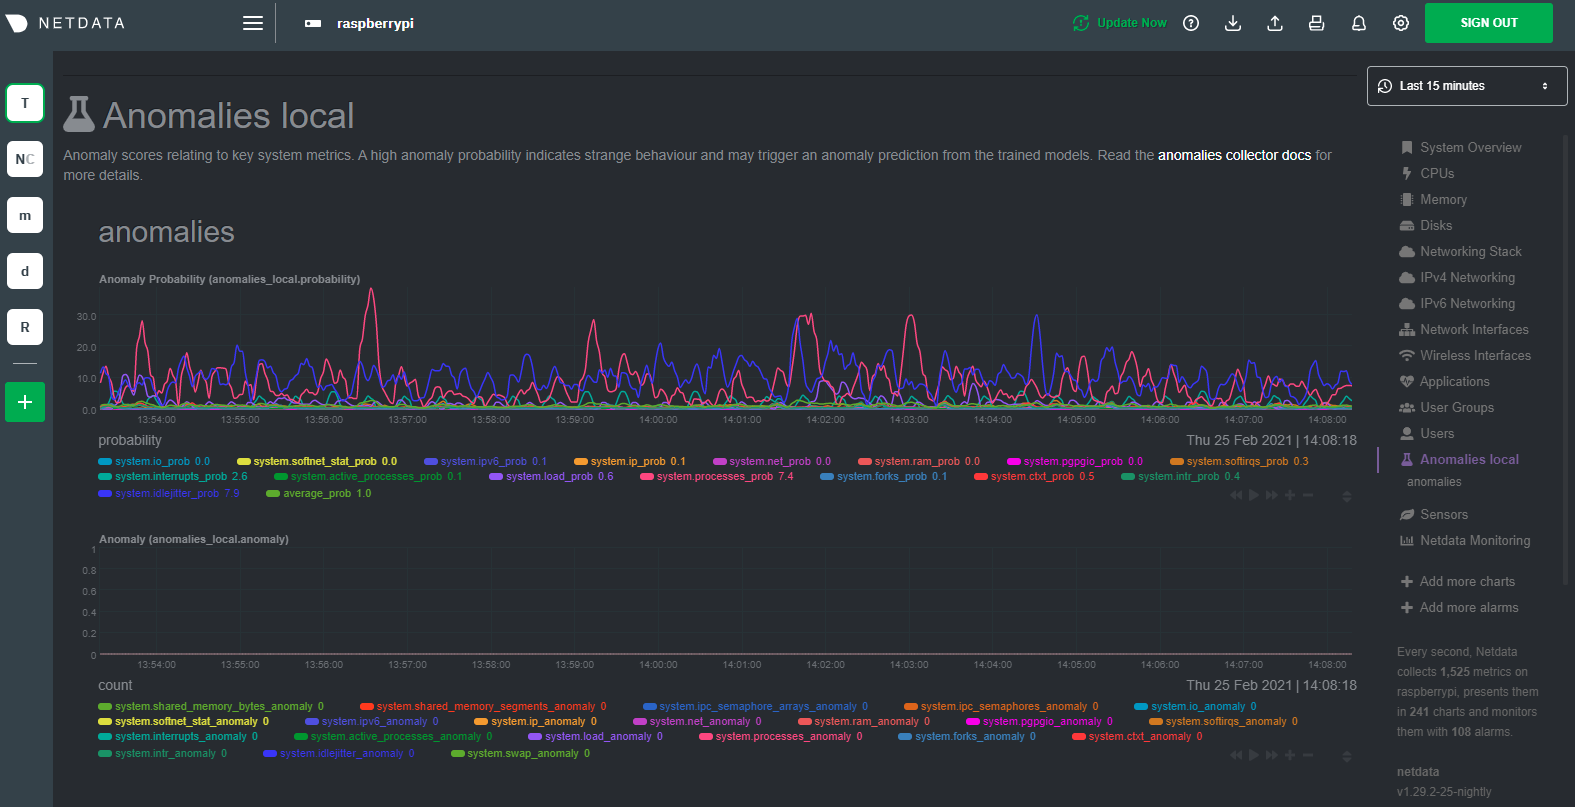
And that should be it! Wait a minute or two, refresh your Netdata dashboard, you should see the default anomalies
charts under the **Anomalies** section in the dashboard's menu.
## Overhead on system
Of course one of the most important considerations when trying to do anomaly detection at the edge (as opposed to in a
centralized cloud somewhere) is the resource utilization impact of running a monitoring tool.
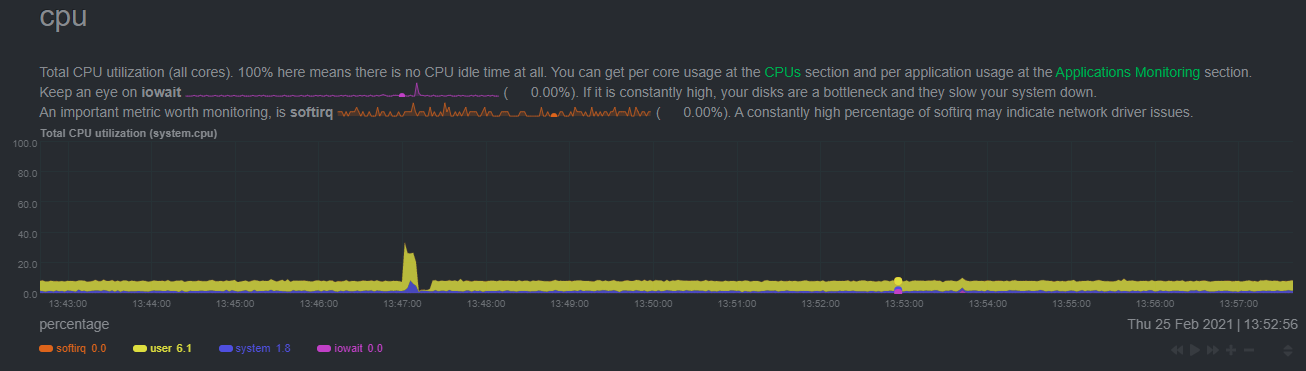
With the default configuration, the anomalies collector uses about 6.5% of CPU at each run. During the retraining step,
CPU utilization jumps to between 20-30% for a few seconds, but you can [configure
retraining](https://github.com/netdata/netdata/blob/master/collectors/python.d.plugin/anomalies/README.md#configuration) to happen less often if you wish.
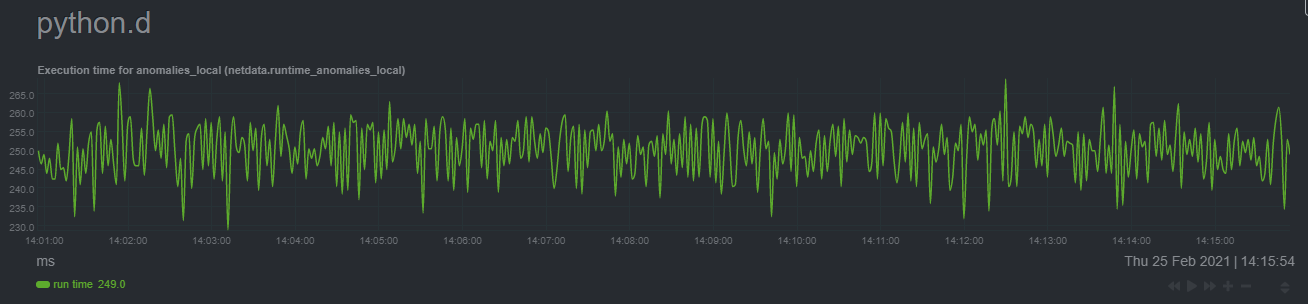
In terms of the runtime of the collector, it was averaging around 250ms during each prediction step, jumping to about
8-10 seconds during a retraining step. This jump equates only to a small gap in the anomaly charts for a few seconds.
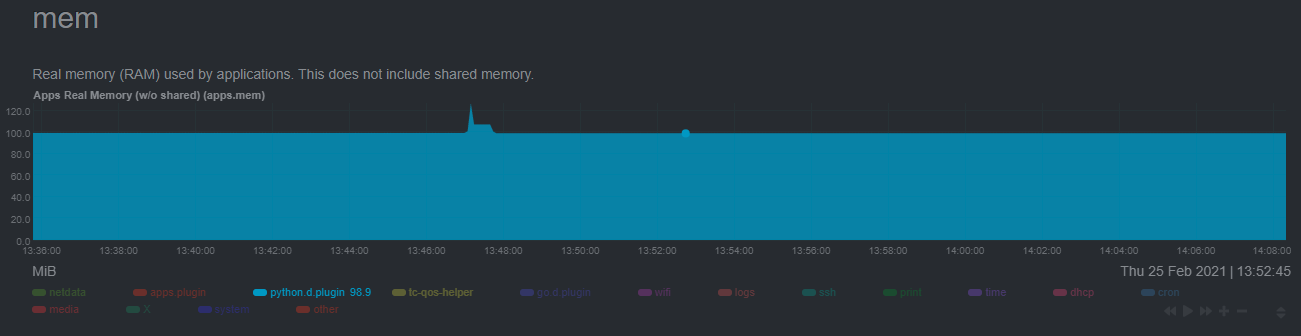
The last consideration then is the amount of RAM the collector needs to store both the models and some of the data
during training. By default, the anomalies collector, along with all other running Python-based collectors, uses about
100MB of system memory.
|
