1
2
3
4
5
6
7
8
9
10
11
12
13
14
15
16
17
18
19
20
21
22
23
24
25
26
27
28
29
30
31
32
33
34
35
36
37
38
39
40
41
42
43
44
45
46
47
48
49
50
51
52
53
54
55
56
57
58
59
60
61
62
63
64
65
66
67
68
69
70
71
72
73
74
75
76
77
78
79
80
81
82
83
84
85
86
87
88
89
90
91
92
93
94
95
96
97
98
99
100
101
102
103
104
105
106
107
108
109
110
111
112
113
114
115
116
117
118
119
120
121
122
123
124
125
126
127
128
129
130
131
132
133
134
135
136
137
138
139
140
141
142
143
144
145
146
147
148
149
150
151
152
153
154
155
156
157
158
159
160
161
162
163
164
165
166
167
168
169
170
171
172
173
174
175
176
177
178
179
180
181
182
183
184
185
186
187
188
189
190
191
192
193
194
195
196
197
198
199
200
201
202
203
204
205
206
207
208
209
210
211
212
213
214
215
216
217
218
219
220
221
222
223
224
225
226
227
228
229
230
231
232
233
234
235
236
237
238
239
240
241
242
243
244
245
246
247
248
249
250
251
252
253
254
255
256
257
258
259
260
261
262
263
264
265
266
267
268
269
270
271
272
273
274
275
276
277
278
279
280
281
282
283
284
285
286
287
288
289
290
291
292
293
294
295
296
297
298
299
300
301
302
303
304
305
306
307
308
309
310
311
312
313
314
315
316
317
318
319
320
321
322
323
324
325
326
327
328
329
330
331
332
333
334
335
336
337
338
339
340
341
342
343
344
345
346
347
348
349
|
<!--
title: "Step 5. Health monitoring alarms and notifications"
custom_edit_url: https://github.com/netdata/netdata/edit/master/docs/guides/step-by-step/step-05.md
-->
# Step 5. Health monitoring alarms and notifications
In the fifth step of the Netdata guide, we're introducing you to one of our core features: **health monitoring**.
To accurately monitor the health of your systems and applications, you need to know _immediately_ when there's something
strange going on. Netdata's alarm and notification systems are essential to keeping you informed.
Netdata comes with hundreds of pre-configured alarms that don't require configuration. They were designed by our
community of system administrators to cover the most important parts of production systems, so, in many cases, you won't
need to edit them.
Luckily, Netdata's alarm and notification system are incredibly adaptable to your infrastructure's unique needs.
## What you'll learn in this step
We'll talk about Netdata's default configuration, and then you'll learn how to do the following:
- [Tune Netdata's pre-configured alarms](#tune-netdatas-pre-configured-alarms)
- [Write your first health entity](#write-your-first-health-entity)
- [Enable Netdata's notification systems](#enable-netdatas-notification-systems)
## Tune Netdata's pre-configured alarms
First, let's tune an alarm that came pre-configured with your Netdata installation.
The first chart you see on any Netdata dashboard is the `system.cpu` chart, which shows the system's CPU utilization
across all cores. To figure out which file you need to edit to tune this alarm, click the **Alarms** button at the top
of the dashboard, click on the **All** tab, and find the **system - cpu** alarm entity.
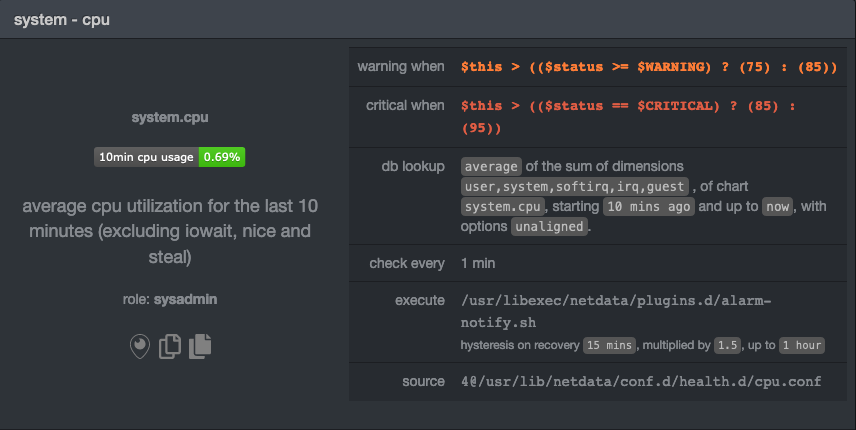
Look at the `source` row in the table. This means the `system.cpu` chart sources its health alarms from
`4@/usr/lib/netdata/conf.d/health.d/cpu.conf`. To tune these alarms, you'll need to edit the alarm file at
`health.d/cpu.conf`. Go to your [Netdata config directory](step-04.md#find-your-netdataconf-file) and use the
`edit-config` script.
```bash
sudo ./edit-config health.d/cpu.conf
```
The first **health entity** in that file looks like this:
```yaml
template: 10min_cpu_usage
on: system.cpu
os: linux
hosts: *
lookup: average -10m unaligned of user,system,softirq,irq,guest
units: %
every: 1m
warn: $this > (($status >= $WARNING) ? (75) : (85))
crit: $this > (($status == $CRITICAL) ? (85) : (95))
delay: down 15m multiplier 1.5 max 1h
info: average cpu utilization for the last 10 minutes (excluding iowait, nice and steal)
to: sysadmin
```
Let's say you want to tune this alarm to trigger warning and critical alarms at a lower CPU utilization. You can change
the `warn` and `crit` lines to the values of your choosing. For example:
```yaml
warn: $this > (($status >= $WARNING) ? (60) : (75))
crit: $this > (($status == $CRITICAL) ? (75) : (85))
```
You _can_ restart Netdata with `sudo systemctl restart netdata`, to enable your tune, but you can also reload _only_ the
health monitoring component using one of the available [methods](https://github.com/netdata/netdata/blob/master/health/QUICKSTART.md#reload-health-configuration).
You can also tune any other aspect of the default alarms. To better understand how each line in a health entity works,
read our [health documentation](https://github.com/netdata/netdata/blob/master/health/README.md).
### Silence an individual alarm
Many Netdata users don't need all the default alarms enabled. Instead of disabling any given alarm, or even _all_
alarms, you can silence individual alarms by changing one line in a given health entity. Let's look at that
`health/cpu.conf` file again.
```yaml
template: 10min_cpu_usage
on: system.cpu
os: linux
hosts: *
lookup: average -10m unaligned of user,system,softirq,irq,guest
units: %
every: 1m
warn: $this > (($status >= $WARNING) ? (75) : (85))
crit: $this > (($status == $CRITICAL) ? (85) : (95))
delay: down 15m multiplier 1.5 max 1h
info: average cpu utilization for the last 10 minutes (excluding iowait, nice and steal)
to: sysadmin
```
To silence this alarm, change `sysadmin` to `silent`.
```yaml
to: silent
```
Use `netdatacli reload-health` to reload your health configuration. You can add `to: silent` to any alarm you'd rather not
bother you with notifications.
## Write your first health entity
The best way to understand how health entities work is building your own and experimenting with the options. To start,
let's build a health entity that triggers an alarm when system RAM usage goes above 80%.
We will first create a new file inside of the `health.d/` directory. We'll name our file
`example.conf` for now.
```bash
./edit-config health.d/example.conf
```
The first line in a health entity will be `alarm:`. This is how you name your entity. You can give it any name you
choose, but the only symbols allowed are `.` and `_`. Let's call the alarm `ram_usage`.
```yaml
alarm: ram_usage
```
> You'll see some funky indentation in the lines coming up. Don't worry about it too much! Indentation is not important
> to how Netdata processes entities, and it will make sense when you're done.
Next, you need to specify which chart this entity listens via the `on:` line. You're declaring that you want this alarm
to check metrics on the `system.ram` chart.
```yaml
on: system.ram
```
Now comes the `lookup`. This line specifies what metrics the alarm is looking for, what duration of time it's looking
at, and how to process the metrics into a more usable format.
```yaml
lookup: average -1m percentage of used
```
Let's take a moment to break this line down.
- `average`: Calculate the average of all the metrics collected.
- `-1m`: Use metrics from 1 minute ago until now to calculate that average.
- `percentage`: Clarify that you want to calculate a percentage of RAM usage.
- `of used`: Specify which dimension (`used`) on the `system.ram` chart you want to monitor with this entity.
In other words, you're taking 1 minute's worth of metrics from the `used` dimension on the `system.ram` chart,
calculating their average, and returning it as a percentage.
You can move on to the `units` line, which lets Netdata know that we're working with a percentage and not an absolute
unit.
```yaml
units: %
```
Next, the `every` line tells Netdata how often to perform the calculation you specified in the `lookup` line. For
certain alarms, you might want to use a shorter duration, which you can specify using values like `10s`.
```yaml
every: 1m
```
We'll put the next two lines—`warn` and `crit`—together. In these lines, you declare at which percentage you want to
trigger a warning or critical alarm. Notice the variable `$this`, which is the value calculated by the `lookup` line.
These lines will trigger a warning if that average RAM usage goes above 80%, and a critical alert if it's above 90%.
```yaml
warn: $this > 80
crit: $this > 90
```
> ❗ Most default Netdata alarms come with more complicated `warn` and `crit` lines. You may have noticed the line `warn:
> $this > (($status >= $WARNING) ? (75) : (85))` in one of the health entity examples above, which is an example of
> using the [conditional operator for hysteresis](https://github.com/netdata/netdata/blob/master/health/REFERENCE.md#special-use-of-the-conditional-operator).
> Hysteresis is used to keep Netdata from triggering a ton of alerts if the metric being tracked quickly goes above and
> then falls below the threshold. For this very simple example, we'll skip hysteresis, but recommend implementing it in
> your future health entities.
Finish off with the `info` line, which creates a description of the alarm that will then appear in any
[notification](#enable-netdatas-notification-systems) you set up. This line is optional, but it has value—think of it as
documentation for a health entity!
```yaml
info: The percentage of RAM being used by the system.
```
Here's what the entity looks like in full. Now you can see why we indented the lines, too.
```yaml
alarm: ram_usage
on: system.ram
lookup: average -1m percentage of used
units: %
every: 1m
warn: $this > 80
crit: $this > 90
info: The percentage of RAM being used by the system.
```
What about what it looks like on the Netdata dashboard?
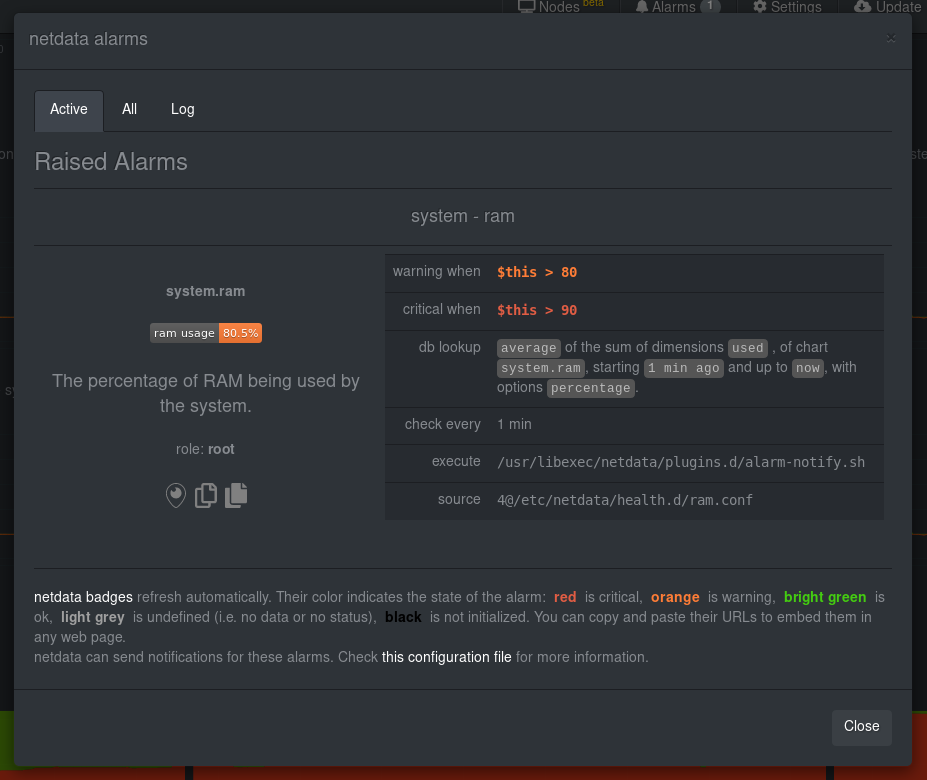
If you'd like to try this alarm on your system, you can install a small program called
[stress](http://manpages.ubuntu.com/manpages/disco/en/man1/stress.1.html) to create a synthetic load. Use the command
below, and change the `8G` value to a number that's appropriate for the amount of RAM on your system.
```bash
stress -m 1 --vm-bytes 8G --vm-keep
```
Netdata is capable of understanding much more complicated entities. To better understand how they work, read the [health
documentation](https://github.com/netdata/netdata/blob/master/health/README.md), look at some [examples](https://github.com/netdata/netdata/blob/master/health/REFERENCE.md#example-alarms), and open the files
containing the default entities on your system.
## Enable Netdata's notification systems
Health alarms, while great on their own, are pretty useless without some way of you knowing they've been triggered.
That's why Netdata comes with a notification system that supports more than a dozen services, such as email, Slack,
Discord, PagerDuty, Twilio, Amazon SNS, and much more.
To see all the supported systems, visit our [notifications documentation](https://github.com/netdata/netdata/blob/master/health/notifications/README.md).
We'll cover email and Slack notifications here, but with this knowledge you should be able to enable any other type of
notifications instead of or in addition to these.
### Email notifications
To use email notifications, you need `sendmail` or an equivalent installed on your system. Linux systems use `sendmail`
or similar programs to, unsurprisingly, send emails to any inbox.
> Learn more about `sendmail` via its [documentation](http://www.postfix.org/sendmail.1.html).
Edit the `health_alarm_notify.conf` file, which resides in your Netdata directory.
```bash
sudo ./edit-config health_alarm_notify.conf
```
Look for the following lines:
```conf
# if a role recipient is not configured, an email will be send to:
DEFAULT_RECIPIENT_EMAIL="root"
# to receive only critical alarms, set it to "root|critical"
```
Change the value of `DEFAULT_RECIPIENT_EMAIL` to the email address at which you'd like to receive notifications.
```conf
# if a role recipient is not configured, an email will be sent to:
DEFAULT_RECIPIENT_EMAIL="me@example.com"
# to receive only critical alarms, set it to "root|critical"
```
Test email notifications system by first becoming the Netdata user and then asking Netdata to send a test alarm:
```bash
sudo su -s /bin/bash netdata
/usr/libexec/netdata/plugins.d/alarm-notify.sh test
```
You should see output similar to this:
```bash
# SENDING TEST WARNING ALARM TO ROLE: sysadmin
2019-10-17 18:23:38: alarm-notify.sh: INFO: sent email notification for: hostname test.chart.test_alarm is WARNING to 'me@example.com'
# OK
# SENDING TEST CRITICAL ALARM TO ROLE: sysadmin
2019-10-17 18:23:38: alarm-notify.sh: INFO: sent email notification for: hostname test.chart.test_alarm is CRITICAL to 'me@example.com'
# OK
# SENDING TEST CLEAR ALARM TO ROLE: sysadmin
2019-10-17 18:23:39: alarm-notify.sh: INFO: sent email notification for: hostname test.chart.test_alarm is CLEAR to 'me@example.com'
# OK
```
... and you should get three separate emails, one for each test alarm, in your inbox! (Be sure to check your spam
folder.)
## Enable Slack notifications
If you're one of the many who spend their workday getting pinged with GIFs by your colleagues, why not add Netdata
notifications to the mix? It's a great way to immediately see, collaborate around, and respond to anomalies in your
infrastructure.
To get Slack notifications working, you first need to add an [incoming
webhook](https://slack.com/apps/A0F7XDUAZ-incoming-webhooks) to the channel of your choice. Click the green **Add to
Slack** button, choose the channel, and click the **Add Incoming WebHooks Integration** button.
On the following page, you'll receive a **Webhook URL**. That's what you'll need to configure Netdata, so keep it handy.
Time to dive back into your `health_alarm_notify.conf` file:
```bash
sudo ./edit-config health_alarm_notify.conf
```
Look for the `SLACK_WEBHOOK_URL=" "` line and add the incoming webhook URL you got from Slack:
```conf
SLACK_WEBHOOK_URL="https://hooks.slack.com/services/XXXXXXXXX/XXXXXXXXX/XXXXXXXXXXXX"
```
A few lines down, edit the `DEFAULT_RECIPIENT_SLACK` line to contain a single hash `#` character. This instructs Netdata
to send a notification to the channel you configured with the incoming webhook.
```conf
DEFAULT_RECIPIENT_SLACK="#"
```
Time to test the notifications again!
```bash
sudo su -s /bin/bash netdata
/usr/libexec/netdata/plugins.d/alarm-notify.sh test
```
You should receive three notifications in your Slack channel.
Congratulations! You're set up with two awesome ways to get notified about any change in the health of your systems or
applications.
To further configure your email or Slack notification setup, or to enable other notification systems, check out the
following documentation:
- [Email notifications](https://github.com/netdata/netdata/blob/master/health/notifications/email/README.md)
- [Slack notifications](https://github.com/netdata/netdata/blob/master/health/notifications/slack/README.md)
- [Netdata's notification system](https://github.com/netdata/netdata/blob/master/health/notifications/README.md)
## What's next?
In this step, you learned the fundamentals of Netdata's health monitoring tools: alarms and notifications. You should be
able to tune default alarms, silence them, and understand some of the basics of writing health entities. And, if you so
chose, you'll now have both email and Slack notifications enabled.
You're coming along quick!
Next up, we're going to cover how Netdata collects its metrics, and how you can get Netdata to collect real-time metrics
from hundreds of services with almost no configuration on your part. Onward!
[Next: Collect metrics from more services and apps →](step-06.md)
|
