1
2
3
4
5
6
7
8
9
10
11
12
13
14
15
16
17
18
19
20
21
22
23
24
25
26
27
28
29
30
31
32
33
34
35
36
37
38
39
40
41
42
43
44
45
46
47
48
49
50
51
52
53
54
55
56
57
58
59
60
61
62
63
64
65
66
67
68
69
70
71
72
73
74
75
76
77
78
79
80
81
82
83
84
85
86
87
88
89
90
91
92
93
94
95
96
97
98
99
100
101
102
103
104
105
106
107
108
109
110
111
112
113
114
115
116
117
118
119
120
121
122
123
124
125
126
127
128
129
130
131
132
133
134
135
136
137
138
139
140
141
142
143
144
145
146
147
148
149
150
151
152
153
154
155
156
157
158
159
160
161
162
163
164
165
166
167
168
169
170
171
172
173
174
175
176
177
178
179
180
181
182
183
184
185
186
187
188
189
190
191
192
193
194
195
196
197
198
199
200
201
202
203
204
205
206
207
208
209
210
211
212
213
214
215
216
217
218
219
220
221
222
223
224
225
226
227
228
229
230
231
232
233
234
235
236
237
238
239
240
241
242
243
244
245
246
247
248
249
250
251
252
253
254
255
256
257
258
259
260
261
262
263
264
265
266
267
268
269
270
271
272
273
274
275
276
277
278
279
280
281
282
283
284
285
286
287
288
289
290
291
292
293
294
295
296
297
298
299
300
301
302
303
304
305
306
307
308
309
310
311
312
313
314
315
316
317
318
319
320
321
322
323
324
325
326
327
328
329
330
331
332
333
334
335
336
337
338
339
340
341
342
343
344
345
346
347
348
349
350
351
352
353
354
355
356
357
358
359
360
361
362
363
364
365
366
367
368
369
370
371
372
373
374
375
376
377
378
379
380
381
382
383
384
385
386
387
388
389
390
391
392
393
394
395
|
<!--
title: "Step 8. Build your first custom dashboard"
custom_edit_url: https://github.com/netdata/netdata/edit/master/docs/guides/step-by-step/step-08.md
-->
# Step 8. Build your first custom dashboard
In previous steps of the guide, you have learned how several sections of the Netdata dashboard worked.
This step will show you how to set up a custom dashboard to fit your unique needs. If nothing else, Netdata is really,
really flexible. 🤸
## What you'll learn in this step
In this step of the Netdata guide, you'll learn:
- [Why you might want a custom dashboard](#why-should-i-create-a-custom-dashboard)
- [How to create and prepare your `custom-dashboard.html` file](#create-and-prepare-your-custom-dashboardhtml-file)
- [Where to add `dashboard.js` to your custom dashboard file](#add-dashboardjs-to-your-custom-dashboard-file)
- [How to add basic styling](#add-some-basic-styling)
- [How to add charts of different types, shapes, and sizes](#creating-your-dashboards-charts)
Let's get on with it!
## Why should I create a custom dashboard?
Because it's cool!
But there are way more reasons than that, most of which will prove more valuable to you.
You could use custom dashboards to aggregate real-time data from multiple Netdata agents in one place. Or, you could put
all the charts with metrics collected from your custom application via `statsd` and perform application performance
monitoring from a single dashboard. You could even use a custom dashboard and a standalone web server to create an
enriched public status page for your service, and give your users something fun to look at while they're waiting for the
503 errors to clear up!
Netdata's custom dashboarding capability is meant to be as flexible as your ideas. We hope you can take these
fundamental ideas and turn them into something amazing.
## Create and prepare your `custom-dashboard.html` file
By default, Netdata stores its web server files at `/usr/share/netdata/web`. As with finding the location of your
`netdata.conf` file, you can double-check this location by loading up `http://HOST:19999/netdata.conf` in your browser
and finding the value of the `web files directory` option.
To create your custom dashboard, create a file at `/usr/share/netdata/web/custom-dashboard.html` and copy in the
following:
```html
<!DOCTYPE html>
<html lang="en">
<head>
<title>My custom dashboard</title>
<meta http-equiv="Content-Type" content="text/html; charset=utf-8" />
<meta charset="utf-8">
<meta http-equiv="X-UA-Compatible" content="IE=edge,chrome=1">
<meta name="viewport" content="width=device-width, initial-scale=1">
<meta name="apple-mobile-web-app-capable" content="yes">
<meta name="apple-mobile-web-app-status-bar-style" content="black-translucent">
<!-- Add dashboard.js here! -->
</head>
<body>
<main class="container">
<h1>My custom dashboard</h1>
<!-- Add charts here! -->
</main>
</body>
</html>
```
Try visiting `http://HOST:19999/custom-dashboard.html` in your browser.
If you get a blank page with this text: `Access to file is not permitted: /usr/share/netdata/web/custom-dashboard.html`.
You can fix this error by changing the dashboard file's permissions to make it owned by the `netdata` user.
```bash
sudo chown netdata:netdata /usr/share/netdata/web/custom-dashboard.html
```
Reload your browser, and you should see a blank page with the title: **Your custom dashboard**!
## Add `dashboard.js` to your custom dashboard file
You need to include the `dashboard.js` file of a Netdata agent to add Netdata charts. Add the following to the `<head>`
of your custom dashboard page and change `HOST` according to your setup.
```html
<!-- Add dashboard.js here! -->
<script type="text/javascript" src="http://HOST:19999/dashboard.js"></script>
```
When you add `dashboard.js` to any web page, it loads several JavaScript and CSS files to create and style charts. It
also scans the page for elements that define charts, builds them, and refreshes with new metrics.
> If you enabled SSL on your Netdata dashboard already, you'll need to use `https://` to grab the `dashboard.js` file.
## Add some basic styling
While not necessary, let's add some basic styling to make our dashboard look a little nicer. We're putting some
basic CSS into a `<style>` tag inside of the page's `<head>` element.
```html
<!-- Add dashboard.js here! -->
<script type="text/javascript" src="http://HOST:19999/dashboard.js"></script>
<style>
.wrap {
max-width: 1280px;
margin: 0 auto;
}
h1 {
margin-bottom: 30px;
text-align: center;
}
.charts {
display: flex;
flex-flow: row wrap;
justify-content: space-around;
}
</style>
</head>
```
## Creating your dashboard's charts
Time to create a chart!
You need to create a `<div>` for each new chart. Each `<div>` element accepts a few `data-` attributes, some of which
are required and some of which are optional.
Let's cover a few important ones. And while we do it, we'll create a custom dashboard that shows a few CPU-related
charts on a single page.
### The chart unique ID (required)
You need to specify the unique ID of a chart to show it on your custom dashboard. If you forgot how to find the unique
ID, head back over to [step 2](https://github.com/netdata/netdata/blob/master/docs/guides/step-by-step/step-02.md#understand-charts-dimensions-families-and-contexts)
for a re-introduction.
You can then put this unique ID into a `<div>` element with the `data-netdata` attribute. Put this in the `<body>` of
your custom dashboard file beneath the helpful comment.
```html
<body>
<main class="wrap">
<h1>My custom dashboard</h1>
<div class="charts">
<!-- Add charts here! -->
<div data-netdata="system.cpu"></div>
</div>
</main>
</body>
```
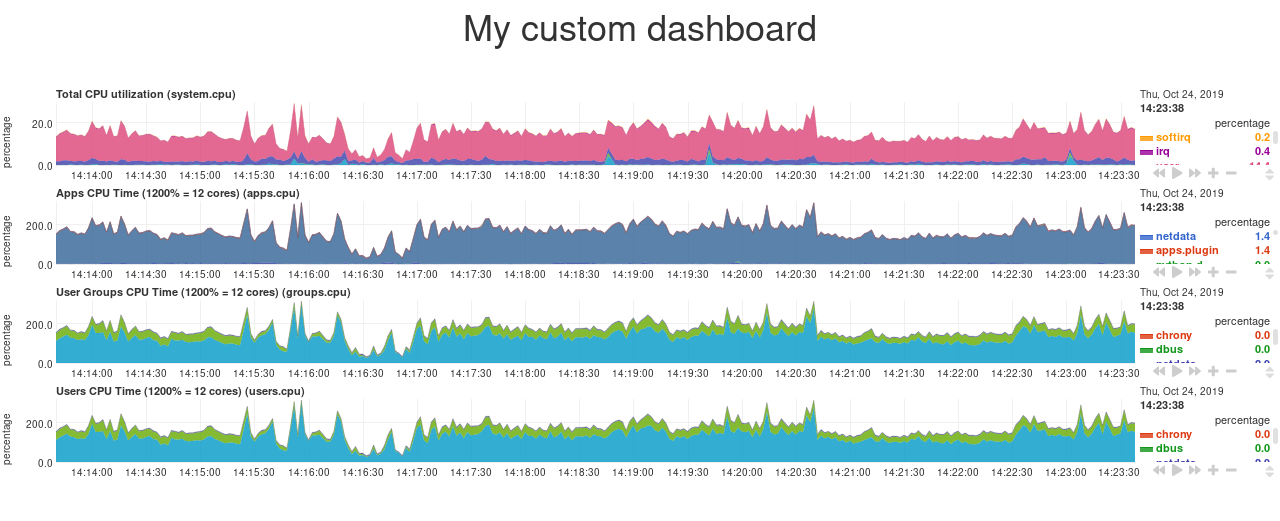
Reload the page, and you should see a real-time `system.cpu` chart!
... and a whole lot of white space. Let's fix that by adding a few more charts.
```html
<!-- Add charts here! -->
<div data-netdata="system.cpu"></div>
<div data-netdata="apps.cpu"></div>
<div data-netdata="groups.cpu"></div>
<div data-netdata="users.cpu"></div>
```
### Set chart duration
By default, these charts visualize 10 minutes of Netdata metrics. Let's get a little more granular on this dashboard. To
do so, add a new `data-after=""` attribute to each chart.
`data-after` takes a _relative_ number of seconds from _now_. So, by putting `-300` as the value, you're asking the
custom dashboard to display the _last 5 minutes_ (`5m * 60s = 300s`) of data.
```html
<!-- Add charts here! -->
<div data-netdata="system.cpu"
data-after="-300">
</div>
<div data-netdata="apps.cpu"
data-after="-300">
</div>
<div data-netdata="groups.cpu"
data-after="-300">
</div>
<div data-netdata="users.cpu"
data-after="-300">
</div>
```
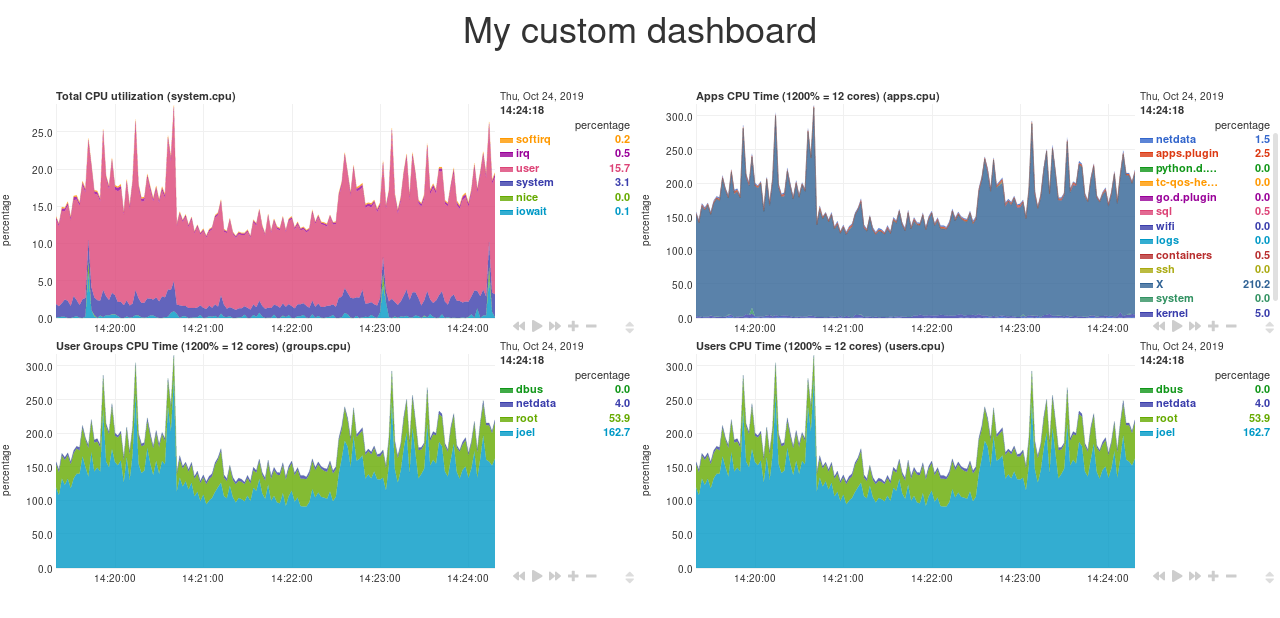
### Set chart size
You can set the size of any chart using the `data-height=""` and `data-width=""` attributes. These attributes can be
anything CSS accepts for width and height (e.g. percentages, pixels, em/rem, calc, and so on).
Let's make the charts a little taller and allow them to fit side-by-side for a more compact view. Add
`data-height="200px"` and `data-width="50%"` to each chart.
```html
<div data-netdata="system.cpu"
data-after="-300"
data-height="250px"
data-width="50%"></div>
<div data-netdata="apps.cpu"
data-after="-300"
data-height="250px"
data-width="50%"></div>
<div data-netdata="groups.cpu"
data-after="-300"
data-height="250px"
data-width="50%"></div>
<div data-netdata="users.cpu"
data-after="-300"
data-height="250px"
data-width="50%"></div>
```
Now we're getting somewhere!
## Final touches
While we already have a perfectly workable dashboard, let's add some final touches to make it a little more pleasant on
the eyes.
First, add some extra CSS to create some vertical whitespace between the top and bottom row of charts.
```html
<style>
...
.charts > div {
margin-bottom: 6rem;
}
</style>
```
To create horizontal whitespace, change the value of `data-width="50%"` to `data-width="calc(50% - 2rem)"`.
```html
<div data-netdata="system.cpu"
data-after="-300"
data-height="250px"
data-width="calc(50% - 2rem)"></div>
<div data-netdata="apps.cpu"
data-after="-300"
data-height="250px"
data-width="calc(50% - 2rem)"></div>
<div data-netdata="groups.cpu"
data-after="-300"
data-height="250px"
data-width="calc(50% - 2rem)"></div>
<div data-netdata="users.cpu"
data-after="-300"
data-height="250px"
data-width="calc(50% - 2rem)"></div>
```
Told you the `data-width` and `data-height` attributes can take any CSS values!
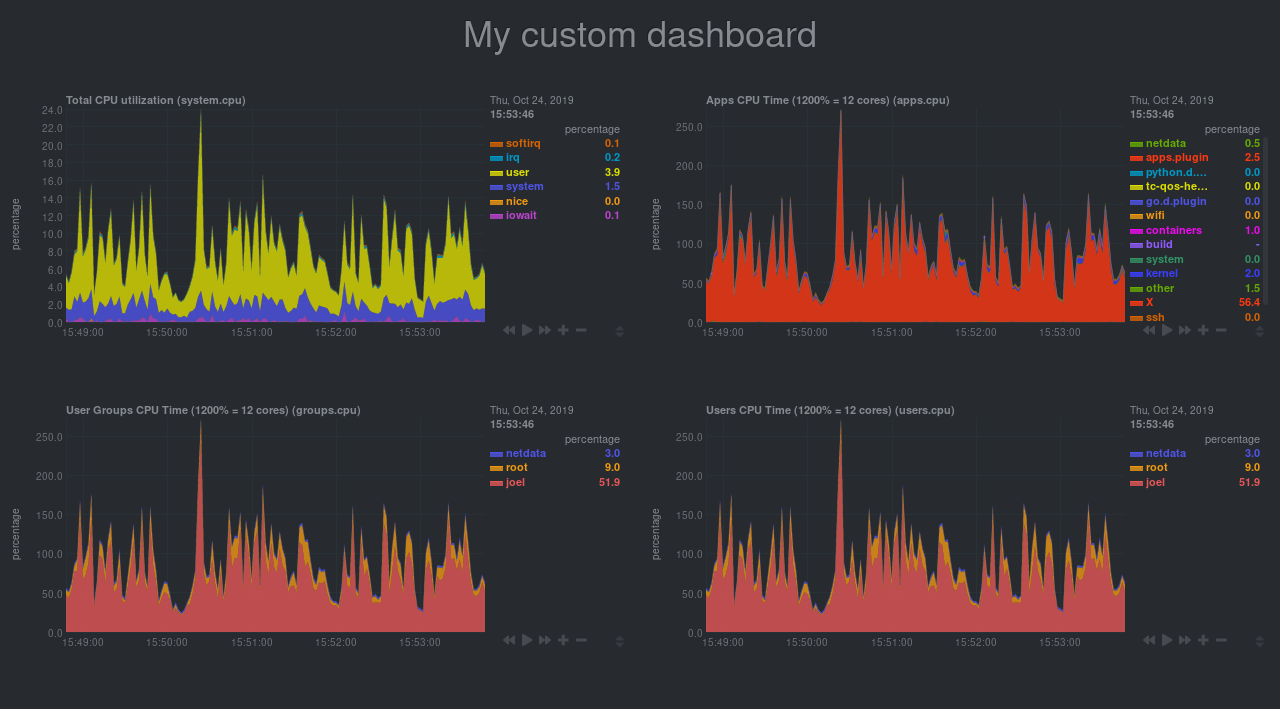
Prefer a dark theme? Add this to your `<head>` _above_ where you added `dashboard.js`:
```html
<script>
var netdataTheme = 'slate';
</script>
<!-- Add dashboard.js here! -->
<script type="text/javascript" src="https://HOST/dashboard.js"></script>
```
Refresh the dashboard to give your eyes a break from all that blue light!
## The final `custom-dashboard.html`
In case you got lost along the way, here's the final version of the `custom-dashboard.html` file:
```html
<!DOCTYPE html>
<html lang="en">
<head>
<title>My custom dashboard</title>
<meta http-equiv="Content-Type" content="text/html; charset=utf-8" />
<meta charset="utf-8">
<meta http-equiv="X-UA-Compatible" content="IE=edge,chrome=1">
<meta name="viewport" content="width=device-width, initial-scale=1">
<meta name="apple-mobile-web-app-capable" content="yes">
<meta name="apple-mobile-web-app-status-bar-style" content="black-translucent">
<script>
var netdataTheme = 'slate';
</script>
<!-- Add dashboard.js here! -->
<script type="text/javascript" src="http://localhost:19999/dashboard.js"></script>
<style>
.wrap {
max-width: 1280px;
margin: 0 auto;
}
h1 {
margin-bottom: 30px;
text-align: center;
}
.charts {
display: flex;
flex-flow: row wrap;
justify-content: space-around;
}
.charts > div {
margin-bottom: 6rem;
position: relative;
}
</style>
</head>
<body>
<main class="wrap">
<h1>My custom dashboard</h1>
<div class="charts">
<!-- Add charts here! -->
<div data-netdata="system.cpu"
data-after="-300"
data-height="250px"
data-width="calc(50% - 2rem)"></div>
<div data-netdata="apps.cpu"
data-after="-300"
data-height="250px"
data-width="calc(50% - 2rem)"></div>
<div data-netdata="groups.cpu"
data-after="-300"
data-height="250px"
data-width="calc(50% - 2rem)"></div>
<div data-netdata="users.cpu"
data-after="-300"
data-height="250px"
data-width="calc(50% - 2rem)"></div>
</div>
</main>
</body>
</html>
```
## What's next?
In this guide, you learned the fundamentals of building a custom Netdata dashboard. You should now be able to add more
charts to your `custom-dashboard.html`, change the charts that are already there, and size them according to your needs.
Of course, the custom dashboarding features covered here are just the beginning. Be sure to read up on our [custom
dashboard documentation](https://github.com/netdata/netdata/blob/master/web/gui/custom/README.md) for details on how you can use other chart libraries, pull metrics
from multiple Netdata agents, and choose which dimensions a given chart shows.
Next, you'll learn how to store long-term historical metrics in Netdata!
[Next: Long-term metrics storage →](https://github.com/netdata/netdata/blob/master/docs/guides/step-by-step/step-09.md)
|
