1
2
3
4
5
6
7
8
9
10
11
12
13
14
15
16
17
18
19
20
21
22
23
24
25
26
27
28
29
30
31
32
33
34
35
36
37
38
39
40
41
42
43
44
45
46
47
48
49
50
51
52
53
54
55
56
57
58
59
60
61
62
63
64
65
66
67
68
69
70
71
72
73
74
75
76
77
78
79
80
81
82
83
84
85
86
87
88
89
90
91
92
93
94
95
96
97
98
99
100
101
102
103
104
105
106
107
108
109
110
111
112
113
114
115
116
117
118
119
120
121
122
123
124
125
126
127
128
129
130
131
132
133
134
135
136
137
138
139
140
141
142
143
144
145
146
147
148
149
150
151
152
153
154
155
156
157
158
159
160
161
162
163
164
165
166
167
168
169
170
171
172
173
174
175
176
177
178
179
180
181
182
183
184
185
186
187
188
189
190
191
192
193
194
195
196
197
198
199
200
201
202
203
204
205
206
|
# Using the Nodes View
## Introduction
As of v1.15.0 of Netdata, and in conjunction with our announcement post about the [future of Netdata](https://blog.netdata.cloud/posts/netdata-cloud-announcement/), we have enabled an entirely new way to view your infrastructure using the open-source Netdata agent in conjunction with Netdata Cloud: the **Nodes View**.
This view, powered by Netdata Cloud, provides an aggregated view of the Netdata agents that you have associated with your Netdata Cloud account. The main benefit of Nodes View is seeing the health of your infrastructure from a single interface, especially if you have many systems running Netdata. With Nodes View, you can monitor the health status of your nodes via active alarms and view a subset of real-time performance metrics the agent is collecting every second.
!!! attention "Nodes View is beta software!"
The Nodes View is currently in beta, so all typical warnings about beta software apply. You may come across bugs or inconsistencies.
```
The current version of Nodes uses the API available on each Netdata agent to check for new alarms and the machine's overall health/availability. In the future, we will offer both polling via the API and real-time streaming of health status/metrics.
```
## The Nodes View
To access the Nodes View, you must first be signed in to Netdata Cloud. To register for an account, or sign in to an existing account, visit our [signing in guide](signing-in.md) for details.
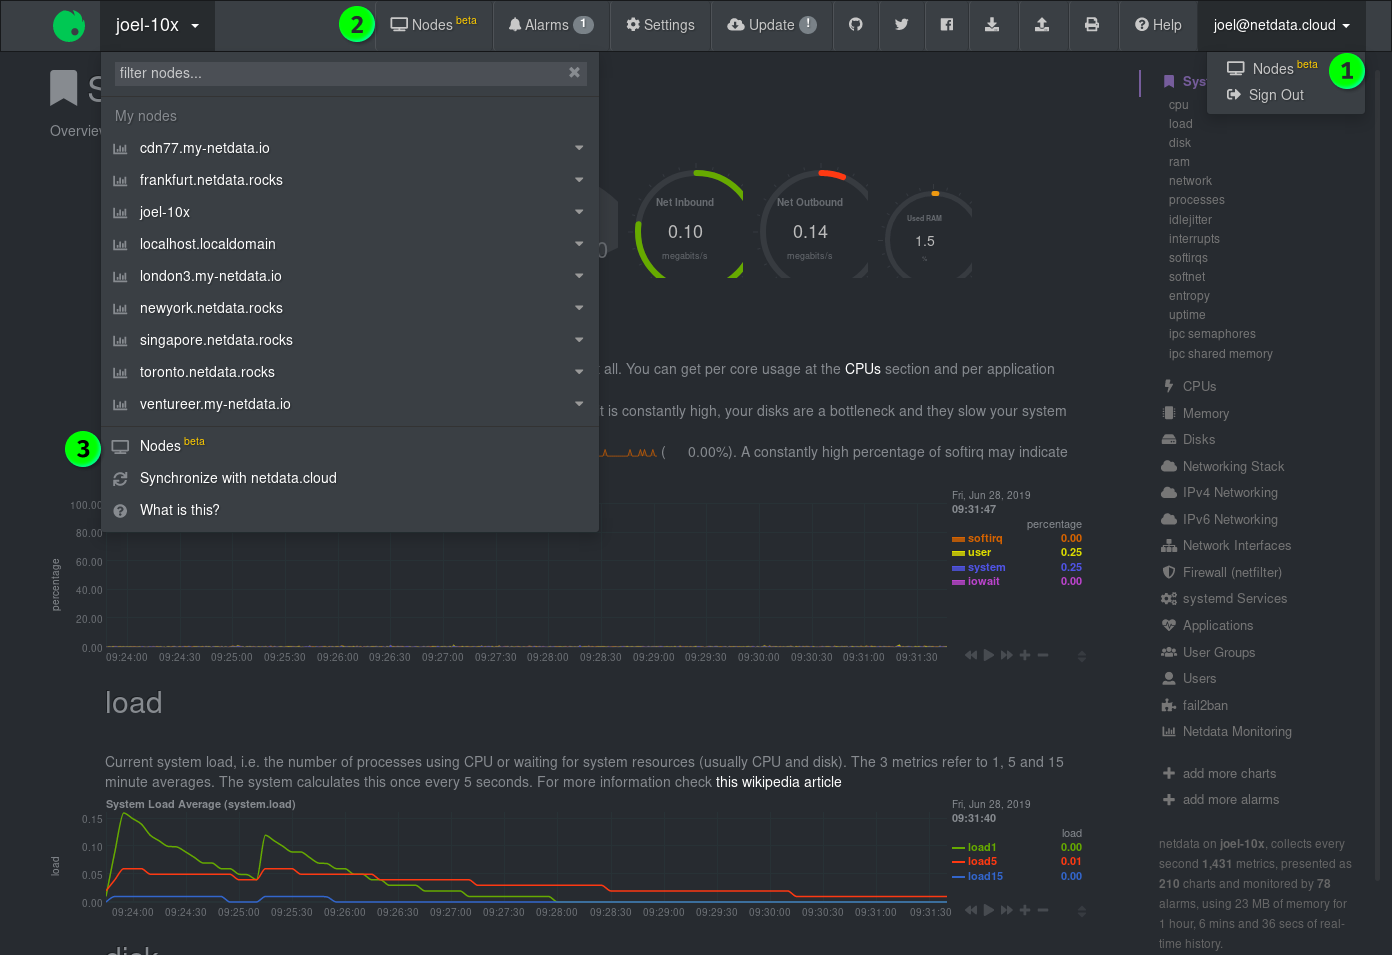
Once you're signed in to Netdata Cloud, clicking on any of the **Nodes Beta** buttons in the node's web dashboard will lead you to the Nodes View. Find one (`1`) in the dropdown menu in the upper-right corner, a second (`2`) in the top navigation bar, and a third (`3`) in the dropdown menu in the top-left corner of the Netdata dashboard.
### Nodes
The primary component of the Nodes View is a list of all the nodes with Netdata agents you have associated with your Netdata Cloud account via the Netdata Cloud registry.
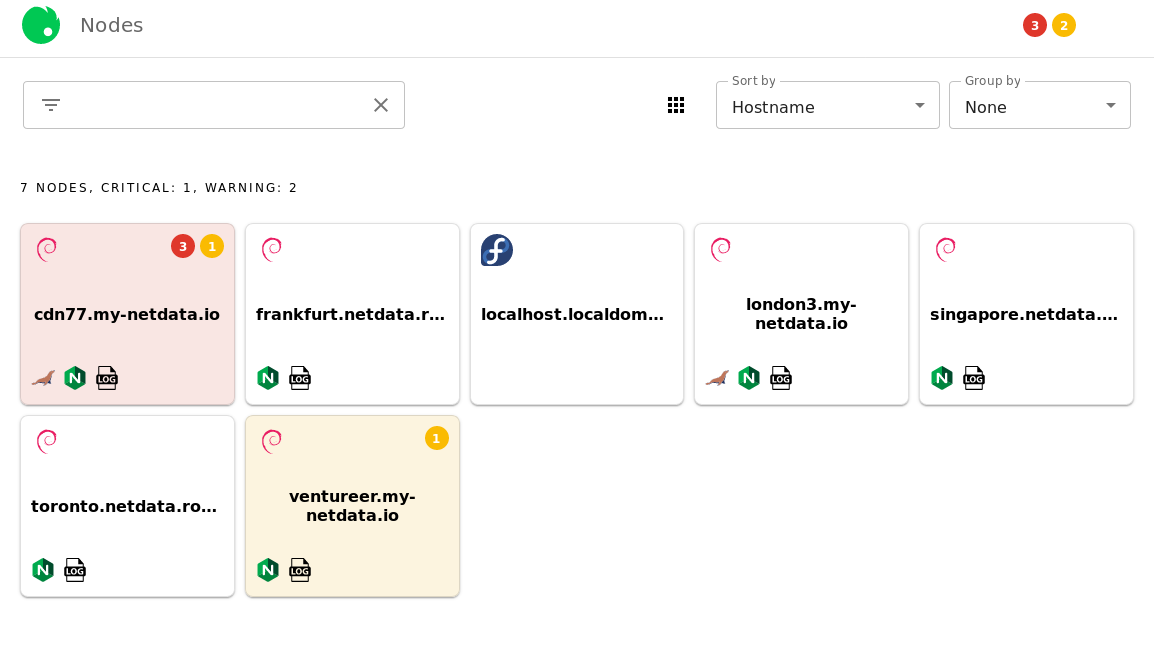
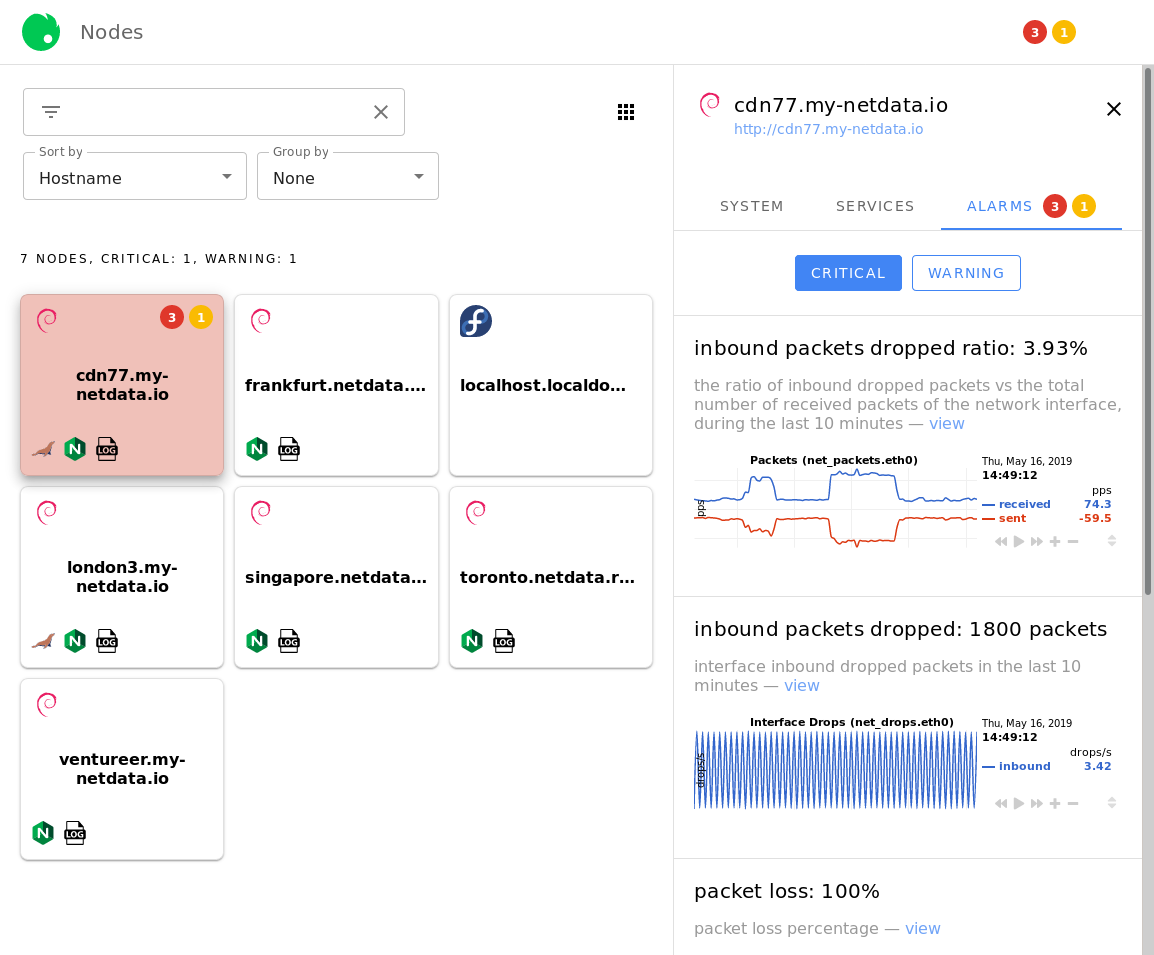
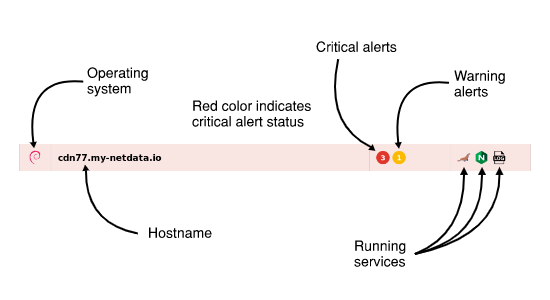
Depending on which [view mode](#view-modes) you're using, Nodes View will present you with information about that node, such as its hostname, operating system, warnings/critical alerts, and any [supported services](#Services-available-in-the-Nodes-View) that are running on that node. Here is an example of the **full** view mode:
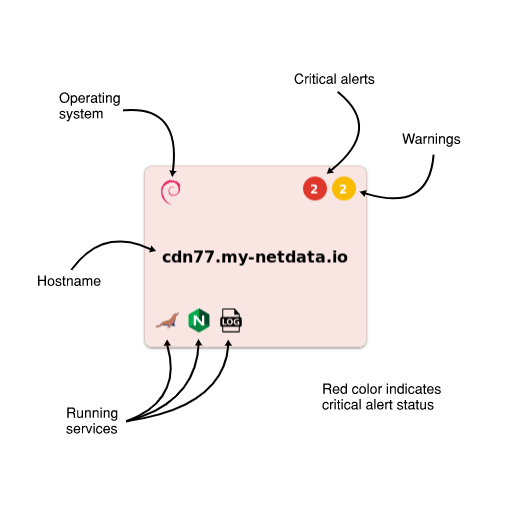
The background color of each Node entry is an indication of its health status:
| Health status | Background color |
| ------------- | ------------------------------------------------------------------------------------------------- |
| **White** | Normal status, no alarms |
| **Yellow** | 1 or more active warnings |
| **Red** | 1 or more active critical alerts |
| **Grey** | Node is unreachable (server unreachable [due to network conditions], server down, or changed URL) |
### Node overview
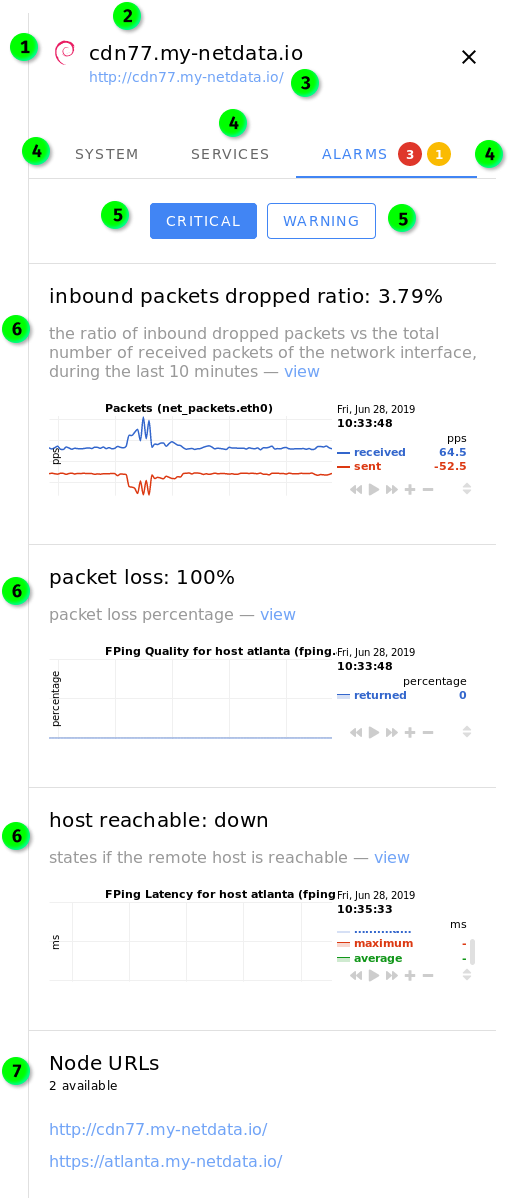
When you click on any of the Nodes, an overview sidebar will appear on the right-hand side of the Nodes View.
This overview contains the following:
- An icon (`1`) representing the operating system installed on that machine
- The hostname (`2`) of the machine
- A link (`3`) to the URL at which the web dashboard is available
- Three tabs (`4`) for **System** metrics, **Services** metrics, and **Alarms**
- A number of selectors (`5`) to choose which metrics/alarms are shown in the overview
- **System** tab: _Overview_, _Disks_, and _Network_ selectors
- **Services** tab: _Databases_, _Web_, and _Messaging_ selectors
- **Alarms** tab: _Critical_ and _Warning_ selectors
- The visualizations and/or alarms (`6`) supported under the chosen tab and selector
- Any other available URLS (`7`) associated with that node under the **Node URLs** header.
By default, clicking on a Node will display the sidebar with the **System** tab enabled. If there are warnings or alarms active for that Node, the **Alarms** tab will be displayed by default.
**The visualizations in the overview sidebar are live!** As with all of Netdata's visualizations, you can scrub forward and backward in time, zoom, pause, and pinpoint anomalies down to the second.
#### System tab
The **System** tab has three sections: *Overview*, *Disks*, and *Network*.
_Overview_ displays visualizations for `CPU`, `System Load Average` `Disk I/O`, `System RAM`, `System Swap`, `Physical Network Interfaces Aggregated Bandwidth`, and the URL of the node.
_Disks_ displays visualizations for `Disk Utilization Time`, and `Disk Space Usage` for every available disk.
_Network_ displays visualizations for `Bandwidth` for every available networking device.
#### Services tab
The **Services** tab will show visualizations for any [supported services](#Services-available-in-the-Nodes-View) that are running on that node. Three selectors are available: _Databases_, _Web_, and _Messaging_. If there are no services under any of these categories, the selector will not be clickable.
#### Alarms tab
The **Alarms** tab contains two selectors: _Critical_ and _Warning_. If there are no alarms under either of these categories, the selector will not be clickable.
Both of these tabs will display alarms information when available, along with the relevant visualization with metrics from your Netdata agent. The `view` link redirects you to the web dashboard for the selected node and automatically shows the appropriate visualization and timeframe.
### Filtering field
The search field will be useful for Netdata Cloud users with dozens or hundreds of Nodes. You can filter for the hostname of the Node you're interested in, the operating system it's running, or even for the services installed.
The filtering field will offer you autocomplete suggestions. For example, the options available after typing `ng` into the filtering field:
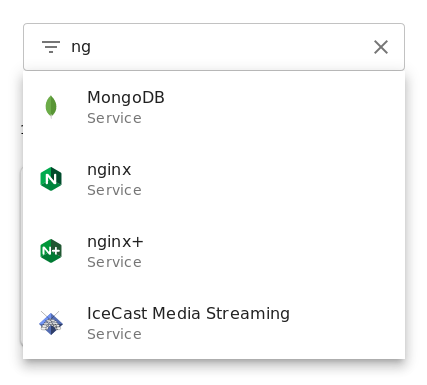
If you select multiple filters, results will display according to an `OR` operator.
### View modes
To the right of the filtering field is three functions that will help you organize your Visited Nodes according to your preferences.

The view mode button lets you switch between three view modes:
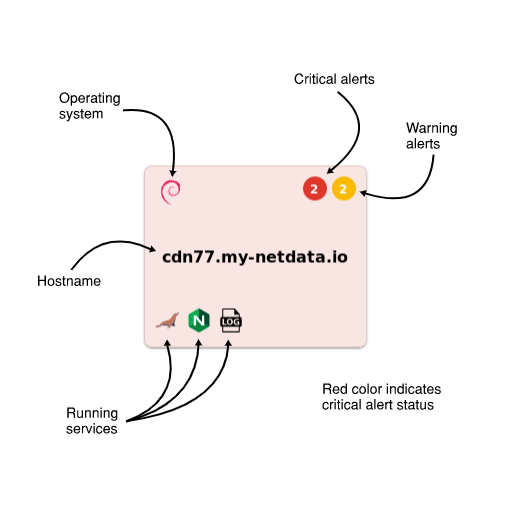
- **Full** mode, which displays the following information in a large squares for each connected Node:
- Operating system
- Critical/warning alerts in two separate indicators
- Hostname
- Icons for [supported services](#services-available-in-the-nodes-view)
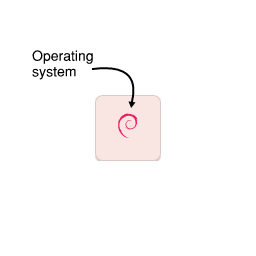
- **Compact** mode, which displays the following information in small squares for each connected Node:
- Operating system
- **Detailed** mode, which displays the following information in large horizontal rectangles for each connected Node:
- Operating system
- Critical/warning alerts in two separate indicators
- Hostname
- Icons for [supported services](#services-available-in-the-nodes-view)
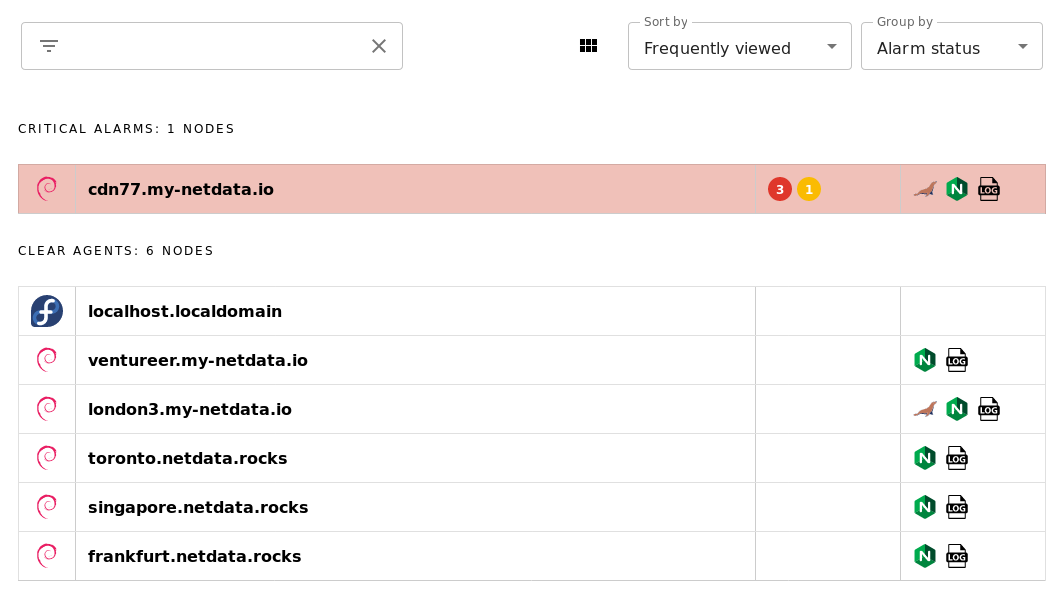
## Sorting, and grouping
The **Sort by** dropdown allows you to choose between sorting _alphabetically by hostname_, most _recently-viewed_ nodes, and most _frequently-view_ nodes.
The **Group by** dropdown lets you switch between _alarm status_, _running services_, or _online status_.
For example, the following screenshot represents the Nodes list with the following options: _detailed list_, _frequently visited_, and _alarm status_.
Play around with the options until you find a setup that works for you.
## Adding more agents to the Nodes View
There is currently only one way to associate additional Netdata nodes with your Netdata Cloud account. You must visit the web dashboard for each node and click the **Sign in** button and complete the [sign in process](signing-in.md#signing-in-to-your-netdata-cloud-account).
!!! note ""
We are aware that the process of registering each node individually is cumbersome for those who want to implement Netdata Cloud's features across a large infrastructure.
```
Please view [this comment on issue #6318](https://github.com/netdata/netdata/issues/6318#issuecomment-504106329) for how we plan on improving the process for adding additional nodes to your Netdata Cloud account.
```
## Services available in the Nodes View
The following tables elaborate on which services will appear in the Nodes View. Alerts from [other collectors](../../collectors/README.md), when entered an alarm status, will show up in the _Alarms_ tab despite not appearing
### Databases
These services will appear under the _Databases_ selector beneath the _Services_ tab.
| Service | Collectors | Context #1 | Context #2 | Context #3 |
|--- |--- |--- |--- |--- |
| MySQL | `python.d.plugin:mysql`, `go.d.plugin:mysql` | `mysql.queries` | `mysql.net` | `mysql.connections` |
| MariaDB | `python.d.plugin:mysql`, `go.d.plugin:mysql` | `mysql.queries` | `mysql.net` | `mysql.connections` |
| Oracle Database | `python.d.plugin:oracledb` | `oracledb.session_count` | `oracledb.physical_disk_read_writes ` | `oracledb.tablespace_usage_in_percent` |
| PostgreSQL | `python.d.plugin:postgres` | `postgres.checkpointer` | `postgres.archive_wal` | `postgres.db_size` |
| MongoDB | `python.d.plugin:mongodb` | `mongodb.active_clients` | `mongodb.read_operations` | `mongodb.write_operations` |
| ElasticSearch | `python.d.plugin:elasticsearch` | `elastic.search_performance_total` | `elastic.index_performance_total` | `elastic.index_segments_memory` |
| CouchDB | `python.d.plugin:couchdb` | `couchdb.activity` | `couchdb.response_codes` | |
| Proxy SQL | `python.d.plugin:proxysql` | `proxysql.questions` | `proxysql.pool_status` | `proxysql.pool_overall_net` |
| Redis | `python.d.plugin:redis` | `redis.operations` | `redis.net` | `redis.connections` |
| MemCached | `python.d.plugin:memcached` | `memcached.cache` | `memcached.net` | `memcached.connections` |
| RethinkDB | `python.d.plugin:rethinkdbs` | `rethinkdb.cluster_queries` | `rethinkdb.cluster_clients_active` | `rethinkdb.cluster_connected_servers` |
| Solr | `go.d.plugin:solr` | `solr.search_requests` | `solr.update_requests` | |
### Web services
These services will appear under the _Web_ selector beneath the _Services_ tab. These also include proxies, load balancers (LB), and streaming services.
| Service | Collectors | Context #1 | Context #2 | Context #3 |
|--- |--- |--- |--- |--- |
| Apache | `python.d.plugin:apache`, `go.d.plugin:apache` | `apache.requests` | `apache.connections` | `apache.net ` |
| nginx | `python.d.plugin:nginx`, `go.d.plugin:nginx` | `nginx.requests` | `nginx.connections` | |
| nginx+ | `python.d.plugin:nginx_plus` | `nginx_plus.requests_total` | `nginx_plus.connections_statistics` | |
| lighthttpd | `python.d.plugin:lighttpd`, `go.d.plugin:lighttpd` | `lighttpd.requests` | `lighttpd.net` | |
| lighthttpd2 | `go.d.plugin:lighttpd2` | `lighttpd2.requests` | `lighttpd2.traffic` | |
| LiteSpeed | `python.d.plugin:litespeed` | `litespeed.requests` | `litespeed.requests_processing` | |
| Tomcat | `python.d.plugin:tomcat` | `tomcat.accesses` | `tomcat.processing_time` | `tomcat.bandwidth` |
| PHP FPM | `python.d.plugin:phpfm` | `phpfpm.performance` | `phpfpm.requests` | `phpfpm.connections` |
| HAproxy | `python.d.plugin:haproxy` | `haproxy_f.scur` | `haproxy_f.bin` | `haproxy_f.bout` |
| Squid | `python.d.plugin:squid` | `squid.clients_requests` | `squid.clients_net` | |
| Traefik | `python.d.plugin:traefik` | `traefik.response_codes` | | |
| Varnish | `python.d.plugin:varnish` | `varnish.session_connection` | `varnish.client_requests` | |
| IPVS | `proc.plugin:/proc/net/ip_vs_stats` | `ipvs.sockets` | `ipvs.packets` | |
| Web Log | `python.d.plugin:web_log`, `go.d.plugin:web_log` | `web_log.response_codes` | `web_log.bandwidth` | |
| IPFS | `python.d.plugin:ipfs` | `ipfs.bandwidth` | `ipfs.peers` | |
| IceCast Media Streaming | `python.d.plugin:icecast` | `icecast.listeners` | | |
| RetroShare | `python.d.plugin:retroshare` | `retroshare.bandwidth` | `retroshare.peers` | |
| HTTP Check | `python.d.plugin:httpcheck`, `go.d.plugin:httpcheck` | `httpcheck.responsetime` | `httpcheck.status` | |
| x509 Check | `go.d.plugin:x509check` | `x509check.time_until_expiration` | | |
### Messaging
These services will appear under the _Messaging_ selector beneath the _Services_ tab.
| Service | Collectors | Context #1 | Context #2 | Context #3 |
| --- | --- | --- | --- | --- |
| RabbitMQ | `python.d.plugin:rabbitmq`, `go.d.plugin:rabbitmq` | `rabbitmq.queued_messages` | `rabbitmq.erlang_run_queue` |
| Beanstalkd | `python.d.plugin:beanstalk` | `beanstalk.total_jobs_rate` | `beanstalk.connections_rate` | `beanstalk.current_tubes` |
|
