1
2
3
4
5
6
7
8
9
10
11
12
13
14
15
16
17
18
19
20
21
22
23
24
25
26
27
28
29
30
31
32
33
34
35
36
37
38
39
40
41
42
43
44
45
46
47
48
49
50
51
52
53
54
55
56
57
58
59
60
61
62
63
64
65
66
67
68
69
70
71
72
73
74
75
76
|
<!--
title: "What is Netdata?"
description: "Netdata is distributed, real-time performance and health monitoring for systems and applications on a single node or an entire infrastructure."
custom_edit_url: https://github.com/netdata/netdata/edit/master/docs/overview/what-is-netdata.md
-->
# What is Netdata?
Netdata helps sysadmins, SREs, DevOps engineers, and IT professionals collect all possible metrics from systems and
applications, visualize these metrics in real-time, and troubleshoot complex performance problems.
Netdata's solution uses two components, the Netdata Agent and Netdata Cloud, to deliver real-time performance and health
monitoring for both single nodes and entire infrastructure.
## Netdata Agent
Netdata's distributed monitoring Agent collects thousands of metrics from systems, hardware, and applications with zero
configuration. It runs permanently on all your physical/virtual servers, containers, cloud deployments, and edge/IoT
devices.
You can [install](/docs/get/README.md#install-the-netdata-agent) Netdata on most Linux distributions (Ubuntu, Debian,
CentOS, and more), container/microservice platforms (Kubernetes clusters, Docker), and many other operating systems
(FreeBSD, macOS), with no `sudo` required.
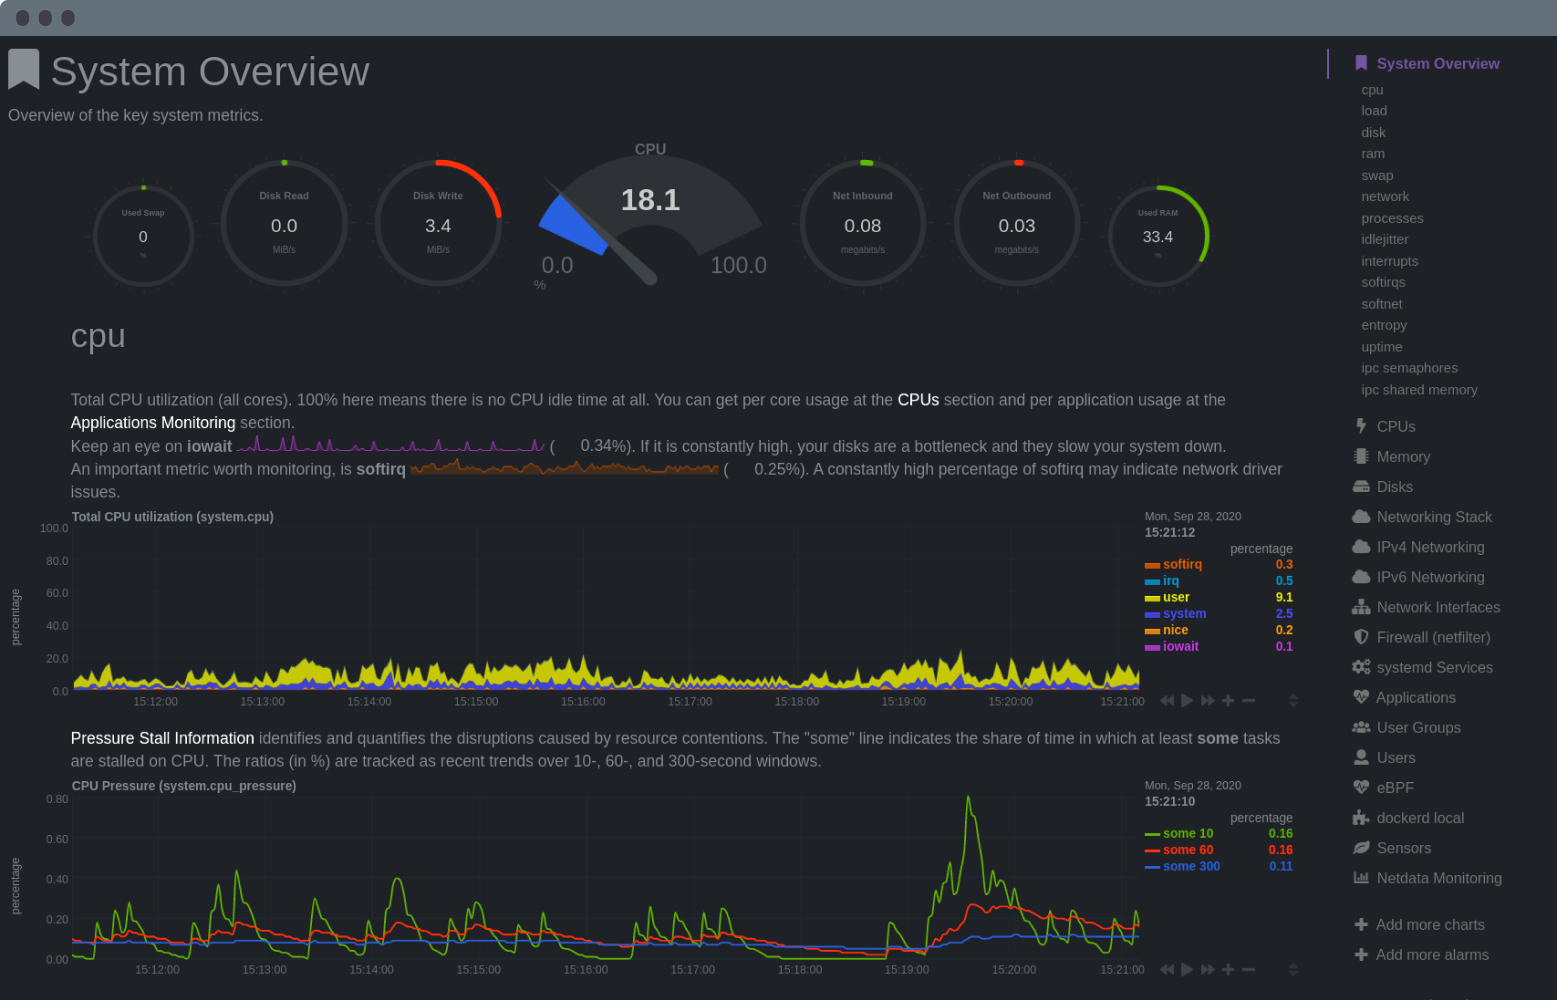
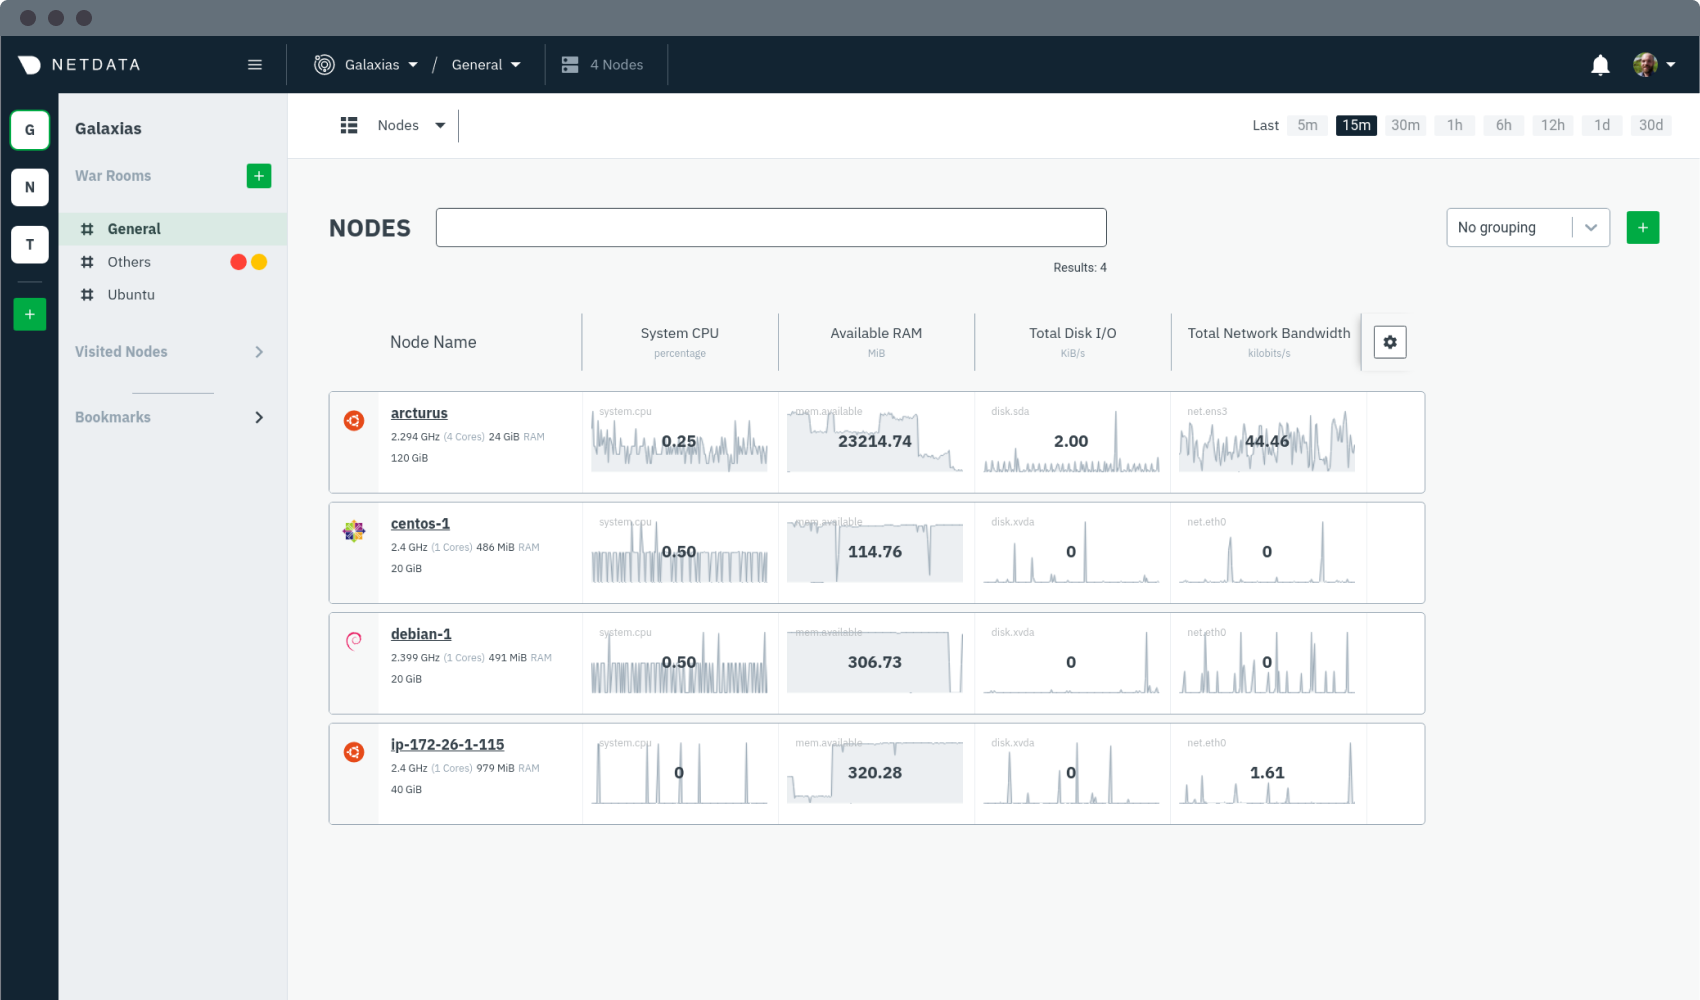
## Netdata Cloud
Netdata Cloud is a web application that gives you real-time visibility for your entire infrastructure. With Netdata
Cloud, you can view key metrics, insightful charts, and active alarms from all your nodes in a single web interface.
When an anomaly strikes, seamlessly navigate to any node to troubleshoot and discover the root cause with the familiar
Netdata dashboard.
**[Netdata Cloud is
free](https://learn.netdata.cloud/docs/cloud/faq-glossary#how-much-does-netdata-cost-how-and-why-is-it-free)**! You can
add an entire infrastructure of nodes, invite all your colleagues, and visualize any number of metrics, charts, and
alarms entirely for free.
While Netdata Cloud offers a centralized method of monitoring your Agents, your metrics data is not stored or
centralized in any way. Metrics data remains with your nodes and is only streamed to your browser, through Cloud, when
you're viewing the Netdata Cloud interface.
## What you can do with Netdata
Netdata is designed to be both simple to use and flexible for every monitoring, visualization, and troubleshooting use
case:
- **Collect**: Netdata collects all available metrics from your system and applications with 300+ collectors,
Kubernetes service discovery, and in-depth container monitoring, all while using only 1% CPU and a few MB of RAM. It
even collects metrics from Windows machines.
- **Visualize**: The dashboard meaningfully presents charts to help you understand the relationships between your
hardware, operating system, running apps/services, and the rest of your infrastructure. Add nodes to Netdata Cloud
for a complete view of your infrastructure from a single pane of glass.
- **Monitor**: Netdata's health watchdog uses hundreds of preconfigured alarms to notify you via Slack, email,
PagerDuty and more when an anomaly strikes. Customize with dynamic thresholds, hysteresis, alarm templates, and
role-based notifications.
- **Troubleshoot**: 1s granularity helps you detect analyze anomalies other monitoring platforms might have missed.
Interactive visualizations reduce your reliance on the console, and historical metrics help you trace issues back to
their root cause.
- **Store**: Netdata's efficient database engine efficiently stores per-second metrics for days, weeks, or even
months. Every distributed node stores metrics locally, simplifying deployment, slashing costs, and enriching
Netdata's interactive dashboards.
- **Export**: Integrate per-second metrics with other time-series databases like Graphite, Prometheus, InfluxDB,
TimescaleDB, and more with Netdata's interoperable and extensible core.
- **Stream**: Aggregate metrics from any number of distributed nodes in one place for in-depth analysis, including
ephemeral nodes in a Kubernetes cluster.
## What's next?
Learn more about [why you should use Netdata](/docs/overview/why-netdata.md), or [how Netdata works with your existing
monitoring stack](/docs/overview/netdata-monitoring-stack.md).
[](<>)
|
