1
2
3
4
5
6
7
8
9
10
11
12
13
14
15
16
17
18
19
20
21
22
23
24
25
26
27
28
29
30
31
32
33
34
35
36
37
38
39
40
41
42
43
44
45
46
47
48
49
50
51
52
53
54
55
56
57
58
59
60
61
62
63
64
65
66
67
68
69
|
<!--
title: "Create new dashboards"
description: "Create new dashboards in Netdata Cloud, with any number of metrics from any node on your infrastructure, for targeted troubleshooting."
custom_edit_url: https://github.com/netdata/netdata/edit/master/docs/visualize/create-dashboards.md
-->
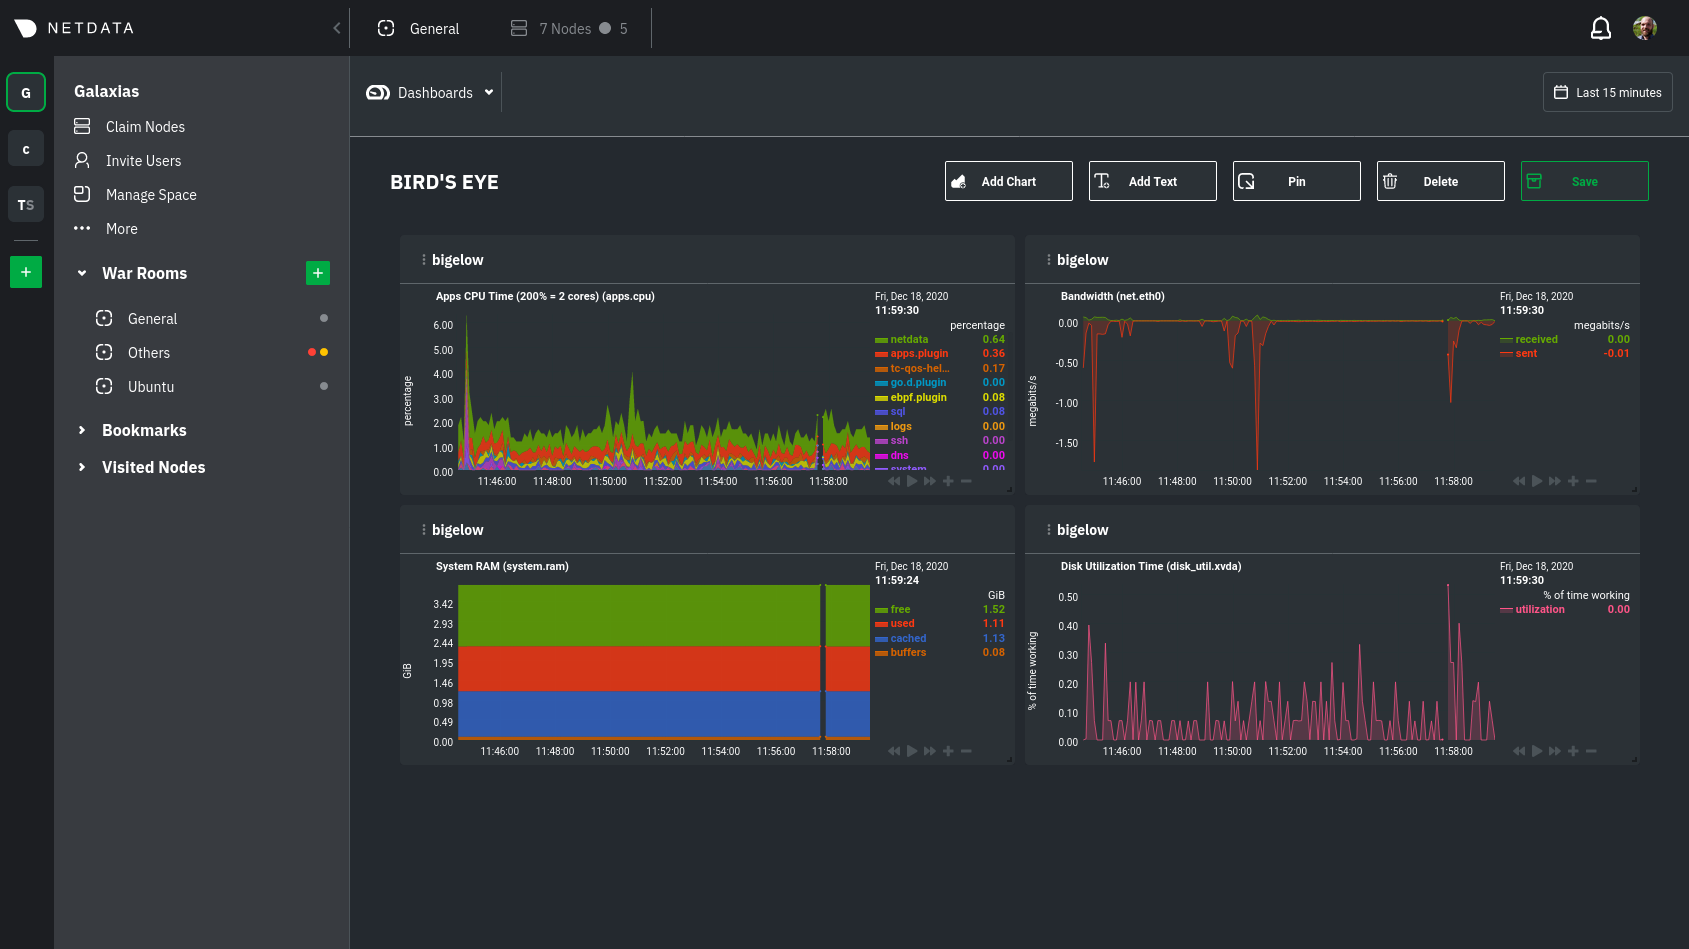
# Create new dashboards
With Netdata Cloud, you can build new dashboards that put key metrics from any number of distributed systems in one
place for a bird's eye view of your infrastructure. You can create more meaningful visualizations for troubleshooting or
keep a watchful eye on your infrastructure's most meaningful metrics without moving from node to node.
In the War Room you want to monitor with this dashboard, click on your War Room's dropdown, then click on the green **+
Add** button next to **Dashboards**. In the panel, give your new dashboard a name, and click **+ Add**.
Click the **Add Chart** button to add your first chart card. From the dropdown, select the node you want to add the
chart from, then the context. Netdata Cloud shows you a preview of the chart before you finish adding it.
The **Add Text** button creates a new card with user-defined text, which you can use to describe or document a
particular dashboard's meaning and purpose. Enrich the dashboards you create with documentation or procedures on how to
respond
Charts in dashboards
are [fully interactive](https://github.com/netdata/netdata/blob/master/docs/visualize/interact-dashboards-charts.md) and
synchronized. You can
pan through time, zoom, highlight specific timeframes, and more.
Move any card by clicking on their top panel and dragging them to a new location. Other cards re-sort to the grid system
automatically. You can also resize any card by grabbing the bottom-right corner and dragging it to its new size.
Hit the **Save** button to finalize your dashboard. Any other member of the War Room can now access it and make changes.
## Jump to single-node Cloud dashboards
While dashboards help you associate essential charts from distributed nodes on a single pane of glass, you might need
more detail when troubleshooting an issue. Quickly jump to any node's dashboard by clicking the 3-dot icon in the corner
of any card to open a menu. Hit the **Go to Chart** item.
Netdata Cloud takes you to the same chart on that node's dashboard. You can now navigate all that node's metrics and
[interact with charts](https://github.com/netdata/netdata/blob/master/docs/visualize/interact-dashboards-charts.md) to
further investigate anomalies or troubleshoot
complex performance problems.
When viewing a single-node Cloud dashboard, you can also click on the add to dashboard icon <img
src="https://user-images.githubusercontent.com/1153921/87587846-827fdb00-c697-11ea-9f31-aed0b8c6afba.png" alt="Dashboard
icon" class="image-inline" /> to quickly add that chart to a new or existing dashboard. You might find this useful when
investigating an anomaly and want to quickly populate a dashboard with potentially correlated metrics.
## Pin dashboards and navigate through Netdata Cloud
Click on the **Pin** button in any dashboard to put those charts into a separate panel at the bottom of the screen. You
can now navigate through Netdata Cloud freely, individual Cloud dashboards, the Nodes view, different War Rooms, or even
different Spaces, and have those valuable metrics follow you.
Pinning dashboards helps you correlate potentially related charts across your infrastructure and discover root causes
faster.
## What's next?
While it's useful to see real-time metrics on flexible dashboards, you need ways to know precisely when an anomaly
strikes. Every Netdata Agent comes with a health watchdog that
uses [alarms](https://github.com/netdata/netdata/blob/master/docs/monitor/configure-alarms.md) and
[notifications](https://github.com/netdata/netdata/blob/master/docs/monitor/enable-notifications.md) to notify you of
issues seconds after they strike.
|
