1
2
3
4
5
6
7
8
9
10
11
12
13
14
15
16
17
18
19
20
21
22
23
24
25
26
27
28
29
30
31
32
33
34
35
36
37
38
39
40
41
42
43
44
45
46
47
48
49
50
51
52
53
54
55
56
57
58
59
60
61
62
63
64
65
66
67
68
69
70
71
72
73
74
75
76
77
78
79
80
81
82
83
84
85
86
87
88
89
90
91
92
93
94
95
96
97
98
99
100
101
102
103
104
105
106
107
108
109
110
111
112
113
114
115
116
117
118
119
120
121
122
123
124
125
126
127
128
129
130
131
132
133
134
135
136
137
138
139
140
141
142
143
144
145
146
147
148
149
150
151
152
153
154
155
156
157
158
159
160
161
162
163
164
165
166
167
168
169
170
171
172
173
174
175
176
177
178
179
180
181
182
183
184
185
186
187
188
189
190
191
192
193
194
195
196
197
198
199
200
201
202
203
204
205
206
207
208
209
210
211
212
213
214
215
216
217
218
219
220
221
222
223
224
225
226
227
228
229
230
231
232
233
234
235
236
237
238
239
240
241
242
243
244
245
246
247
248
249
250
251
252
253
254
255
256
257
258
259
260
261
262
263
264
265
266
267
268
269
270
271
272
273
274
275
276
277
278
279
280
281
282
283
284
285
286
287
288
289
290
291
292
293
294
295
296
297
298
299
300
301
302
303
304
305
306
307
308
309
310
311
312
313
314
315
316
317
318
319
320
321
322
323
324
325
326
327
328
329
330
331
332
333
334
335
336
337
338
339
340
341
342
343
344
345
346
347
348
349
350
351
352
353
354
355
356
357
358
359
360
361
362
363
364
365
366
367
368
369
370
371
372
373
374
375
376
377
378
379
380
381
382
383
384
385
386
387
388
389
390
391
392
393
394
395
396
397
398
399
400
401
402
403
404
405
406
407
408
409
410
411
412
413
414
415
416
417
418
419
420
421
422
423
424
425
426
427
428
429
430
431
432
433
434
435
436
437
438
439
440
441
442
443
444
445
446
447
448
449
450
451
452
453
454
455
456
457
458
459
460
461
462
463
464
465
466
467
468
469
470
471
472
473
474
475
476
477
478
479
480
481
482
483
484
485
486
487
488
489
490
491
492
493
494
495
496
497
498
499
500
501
502
503
504
505
506
507
508
509
510
511
512
513
514
515
516
517
518
519
520
521
522
523
524
525
526
527
528
529
530
531
532
533
534
535
536
537
538
539
540
541
542
543
544
545
546
547
548
549
550
551
552
553
554
555
556
557
558
559
560
561
562
563
564
565
566
567
568
569
570
571
572
573
574
575
576
577
578
579
580
581
582
583
584
585
586
587
588
589
590
591
592
593
594
595
596
597
598
599
600
601
602
603
604
605
606
607
|
<!--
title: "Custom dashboards"
description: "Build custom dashboards with key metrics from one or more nodes running the Netdata Agent and host them anywhere."
custom_edit_url: "https://github.com/netdata/netdata/edit/master/web/gui/custom/README.md"
sidebar_label: "Custom dashboards"
learn_status: "Published"
learn_topic_type: "Tasks"
learn_rel_path: "Operations"
-->
# Custom dashboards
You can:
- create your own dashboards using simple HTML (no javascript is required for
basic dashboards)
- utilize any or all of the available chart libraries, on the same dashboard
- use data from one or more Netdata servers, on the same dashboard
- host your dashboard HTML page on any web server, anywhere
You can also add Netdata charts to existing web pages.
Check this **[very simple working example of a custom dashboard](http://netdata.firehol.org/demo.html)**.
You should also look at the [custom dashboard
template](https://my-netdata.io/dashboard.html), which contains samples of all
supported charts. The code is [here](http://netdata.firehol.org/dashboard.html).
If you plan to put the dashboard on TV, check out
[tv.html](http://netdata.firehol.org/tv.html). Here's is a screenshot of it,
monitoring two servers on the same page:

## Web directory
All of the mentioned examples are available on your local Netdata installation
(e.g. `http://myhost:19999/dashboard.html`). The default web root directory with
the HTML and JS code is `/usr/share/netdata/web`. The main dashboard is also in
that directory and called `index.html`.\
Note: index.html has a different syntax. Don't use it as a template for simple
custom dashboards.
> Some operating systems will use `/opt/netdata/usr/share/netdata/web` as the web directory. If you're not sure where
> yours is, navigate to `http://NODE:19999/netdata.conf` in your browser, replacing `NODE` with the IP address or hostname
> of your node, and find the `# web files directory = ` setting. The value listed is the web directory for your system.
## Example empty dashboard
If you need to create a new dashboard on an empty page, we suggest the following
header:
```html
<!DOCTYPE html>
<html lang="en">
<head>
<title>Your dashboard</title>
<meta http-equiv="Content-Type" content="text/html; charset=utf-8" />
<meta charset="utf-8">
<meta http-equiv="X-UA-Compatible" content="IE=edge,chrome=1">
<meta name="viewport" content="width=device-width, initial-scale=1">
<meta name="apple-mobile-web-app-capable" content="yes">
<meta name="apple-mobile-web-app-status-bar-style" content="black-translucent">
<!-- here we will add dashboard.js -->
</head>
<body>
<!-- here we will add charts -->
</body>
</html>
```
## dashboard.js
To add Netdata charts to any web page (dedicated to Netdata or not), you need to
include the `/dashboard.js` file of a Netdata server.
For example, if your Netdata server listens at `http://box:19999/`, you will
need to add the following to the `head` section of your web page:
```html
<script type="text/javascript" src="http://box:19999/dashboard.js"></script>
```
### What does dashboard.js do?
`dashboard.js` will automatically load the following:
1. `dashboard.css`, required for the Netdata charts
2. `jquery.min.js`, (only if jQuery is not already loaded for this web page)
3. `bootstrap.min.js` (only if Bootstrap is not already loaded) and
`bootstrap.min.css`.
You can disable this by adding the following before loading `dashboard.js`:
```html
<script>var netdataNoBootstrap = true;</script>
```
4. `jquery.nanoscroller.min.js`, required for the scrollbar of the chart
legends.
5. `bootstrap-toggle.min.js` and `bootstrap-toggle.min.css`, required for the
settings toggle buttons.
6. `font-awesome.min.css`, for icons.
When `dashboard.js` loads will scan the page for elements that define charts
(see below) and immediately start refreshing them. Keep in mind more javascript
modules may be loaded (every chart library is a different javascript file, that
is loaded on first use).
### Prevent dashboard.js from starting chart refreshes
If your web page is not static and you plan to add charts using JavaScript, you
can tell `dashboard.js` not to start processing charts immediately after loaded,
by adding this fragment before loading it:
```html
<script>var netdataDontStart = true;</script>
```
The above, will inform the `dashboard.js` to load everything, but not process the web page until you tell it to.
You can tell it to start processing the page, by running this javascript code:
```js
NETDATA.start();
```
Be careful not to call the `NETDATA.start()` multiple times. Each call to this
function will spawn a new thread that will start refreshing the charts.
If, after calling `NETDATA.start()` you need to update the page (or even get
your javascript code synchronized with `dashboard.js`), you can call (after you
loaded `dashboard.js`):
```js
NETDATA.pause(function() {
// ok, it is paused
// update the DOM as you wish
// and then call this to let the charts refresh:
NETDATA.unpause();
});
```
### The default Netdata server
`dashboard.js` will attempt to auto-detect the URL of the Netdata server it is
loaded from, and set this server as the default Netdata server for all charts.
If you need to set any other URL as the default Netdata server for all charts
that do not specify a Netdata server, add this before loading `dashboard.js`:
```html
<script type="text/javascript">var netdataServer = "http://your.netdata.server:19999";</script>
```
## Adding charts
To add charts, you need to add a `div` for each of them. Each of these `div`
elements accept a few `data-` attributes:
### The chart unique ID
The unique ID of a chart is shown at the title of the chart of the default
Netdata dashboard. You can also find all the charts available at your Netdata
server with this URL: `http://your.netdata.server:19999/api/v1/charts`
([example](http://netdata.firehol.org/api/v1/charts)).
To specify the unique id, use this:
```html
<div data-netdata="unique.id"></div>
```
The above is enough for adding a chart. It most probably have the wrong visual
settings though. Keep reading...
### The duration of the chart
You can specify the duration of the chart (how much time of data it will show)
using:
```html
<div data-netdata="unique.id"
data-after="AFTER_SECONDS"
data-before="BEFORE_SECONDS"
></div>
```
`AFTER_SECONDS` and `BEFORE_SECONDS` are numbers representing a time-frame in
seconds.
The can be either:
- **absolute** unix timestamps (in javascript terms, they are `new
Date().getTime() / 1000`. Using absolute timestamps you can have a chart
showing always the same time-frame.
- **relative** number of seconds to now. To show the last 10 minutes of data,
`AFTER_SECONDS` must be `-600` (relative to now) and `BEFORE_SECONDS` must
be `0` (meaning: now). If you want the chart to auto-refresh the current
values, you need to specify **relative** values.
### Chart sizes
You can set the size of the chart using this:
```html
<div data-netdata="unique.id"
data-width="WIDTH"
data-height="HEIGHT"
></div>
```
`WIDTH` and `HEIGHT` can be anything CSS accepts for width and height (e.g.
percentages, pixels, etc). Keep in mind that for certain chart libraries,
`dashboard.js` may apply an aspect ratio to these.
If you want `dashboard.js` to permanently remember (browser local storage) the
dimensions of the chart (the user may resize it), you can add: `data-id="
SETTINGS_ID"`, where `SETTINGS_ID` is anything that will be common for this
chart across user sessions.
### Netdata server
Each chart can get data from a different Netdata server. You can specify the Netdata server to use for each chart using:
```html
<div data-netdata="unique.id"
data-host="http://another.netdata.server:19999/"
></div>
```
If you have ephemeral monitoring setup ([More info here](https://github.com/netdata/netdata/blob/master/streaming/README.md#monitoring-ephemeral-nodes)) and have no
direct access to the nodes dashboards, you can use the following:
```html
<div data-netdata="unique.id"
data-host="http://yournetdata.server:19999/host/reported-hostname"
></div>
```
### Chart library
Netdata supports a number of chart libraries. The default chart library is
`dygraph`, but you can set a different chart library per chart using
`data-chart-library`:
```html
<div data-netdata="unique.id"
data-chart-library="gauge"
></div>
```
Each chart library has a number of specific settings. To learn more about them,
you should investigate the documentation of the given chart library, or visit
the appropriate JavaScript file that defines the library's options. These files
are concatenated into the monolithic `dashboard.js` for deployment.
- [Dygraph](https://github.com/netdata/netdata/blob/5b57fc441c40959514c4e2d0863be2e6a417e352/web/gui/dashboard.js#L2034)
- [d3](https://github.com/netdata/netdata/blob/5b57fc441c40959514c4e2d0863be2e6a417e352/web/gui/dashboard.js#L4095)
- [d3pie](https://github.com/netdata/netdata/blob/5b57fc441c40959514c4e2d0863be2e6a417e352/web/gui/dashboard.js#L3753)
- [Gauge.js](https://github.com/netdata/netdata/blob/5b57fc441c40959514c4e2d0863be2e6a417e352/web/gui/dashboard.js#L3065)
- [Google Charts](https://github.com/netdata/netdata/blob/5b57fc441c40959514c4e2d0863be2e6a417e352/web/gui/dashboard.js#L2936)
- [EasyPieChart](https://github.com/netdata/netdata/blob/5b57fc441c40959514c4e2d0863be2e6a417e352/web/gui/dashboard.js#L3531)
- [Peity](https://github.com/netdata/netdata/blob/5b57fc441c40959514c4e2d0863be2e6a417e352/web/gui/dashboard.js#L4137)
- [Sparkline](https://github.com/netdata/netdata/blob/5b57fc441c40959514c4e2d0863be2e6a417e352/web/gui/dashboard.js#L2779)
- [Text-only](https://github.com/netdata/netdata/blob/5b57fc441c40959514c4e2d0863be2e6a417e352/web/gui/dashboard.js#L4200)
### Data points
For the time-frame requested, `dashboard.js` will use the chart dimensions and
the settings of the chart library to find out how many data points it can show.
For example, most line chart libraries are using 3 pixels per data point. If the
chart shows 10 minutes of data (600 seconds), its update frequency is 1 second,
and the chart width is 1800 pixels, then `dashboard.js` will request from the
Netdata server: 10 minutes of data, represented in 600 points, and the chart
will be refreshed per second. If the user resizes the window so that the chart
becomes 600 pixels wide, then `dashboard.js` will request the same 10 minutes of
data, represented in 200 points and the chart will be refreshed once every 3
seconds.
If you need the chart to show a fixed number of points, you can set the `data-points` option. Replace `DATA_POINTS` with the number of points you need:
```html
<div data-netdata="unique.id"
data-points="DATA_POINTS"
></div>
```
You can also overwrite the pixels-per-point per chart using this:
```html
<div data-netdata="unique.id"
data-pixels-per-point="PIXELS_PER_POINT"
></div>
```
Where `PIXELS_PER_POINT` is the number of pixels each data point should occupy.
### Data grouping method
Netdata supports **average** (the default), **sum** and **max** grouping
methods. The grouping method is used when the Netdata server is requested to
return fewer points for a time-frame, compared to the number of points
available.
You can give it per chart, using:
```html
<div data-netdata="unique.id"
data-method="max"
></div>
```
### Changing rates
Netdata can change the rate of charts on the fly. So a charts that shows values
**per second** can be turned to **per minute** (or any other, e.g. **per 10
seconds**), with this:
```html
<div data-netdata="unique.id"
data-method="average"
data-gtime="60"
data-units="per minute"
></div>
```
The above will provide the average rate per minute (60 seconds). Use 60 for
`/minute`, 3600 for `/hour`, 86400 for `/day` (provided you have that many
data).
- The `data-gtime` setting does not change the units of the chart. You have to
change them yourself with `data-units`.
- This works only for `data-method="average"`.
- Netdata may aggregate multiple points to satisfy the `data-points` setting.
For example, you request `per minute` but the requested number of points to
be returned are not enough to report every single minute. In this case
Netdata will sum the `per second` raw data of the database to find the `per
minute` for every single minute and then **average** them to find the
**average per minute rate of every X minutes**. So, it works as if the data
collection frequency was per minute.
### Selecting dimensions
By default, `dashboard.js` will show all the dimensions of the chart. You can
select specific dimensions using this:
```html
<div data-netdata="unique.id"
data-dimensions="dimension1,dimension2,dimension3,..."
></div>
```
Netdata supports coma (`,`) or pipe (`|`) separated [simple
patterns](https://github.com/netdata/netdata/blob/master/libnetdata/simple_pattern/README.md) for dimensions. By default it
searches for both dimension IDs and dimension NAMEs. You can control the target
of the match with: `data-append-options="match-ids"` or
`data-append-options="match-names"`. Spaces in `data-dimensions=""` are matched
in the dimension names and IDs.
### Chart title
You can overwrite the title of the chart using this:
```html
<div data-netdata="unique.id"
data-title="my super chart"
></div>
```
### Chart units
You can overwrite the units of measurement of the dimensions of the chart, using
this:
```html
<div data-netdata="unique.id"
data-units="words/second"
></div>
```
### Chart colors
`dashboard.js` has an internal palette of colors for the dimensions of the
charts. You can prepend colors to it (so that your will be used first) using
this:
```html
<div data-netdata="unique.id"
data-colors="#AABBCC #DDEEFF ..."
></div>
```
### Extracting dimension values
`dashboard.js` can update the selected values of the chart at elements you
specify. For example, let's assume we have a chart that measures the bandwidth
of eth0, with 2 dimensions `in` and `out`. You can use this:
```html
<div data-netdata="net.eth0"
data-show-value-of-in-at="eth0_in_value"
data-show-value-of-out-at="eth0_out_value"
></div>
My eth0 interface, is receiving <span id="eth0_in_value"></span>
and transmitting <span id="eth0_out_value"></span>.
```
### Hiding the legend of a chart
On charts that by default have a legend managed by `dashboard.js` you can remove
it, using this:
```html
<div data-netdata="unique.id"
data-legend="no"
></div>
```
### API options
You can append Netdata **[REST API v1](https://github.com/netdata/netdata/blob/master/web/api/README.md)** data options, using this:
```html
<div data-netdata="unique.id"
data-append-options="absolute,percentage"
></div>
```
A few useful options are:
- `absolute` to show all values are absolute (i.e. turn negative dimensions to
positive)
- `percentage` to express the values as a percentage of the chart total (so,
the values of the dimensions are added, and the sum of them if expressed as
a percentage of the sum of all dimensions)
- `unaligned` to prevent Netdata from aligning the charts (e.g. when
requesting 60 seconds aggregation per point, Netdata returns chart data
aligned to XX:XX:00 to XX:XX:59 - similarly for hours, days, etc - the
`unaligned` option disables this feature)
- `match-ids` or `match-names` is used to control what `data-dimensions=` will
match.
### Chart library performance
`dashboard.js` measures the performance of the chart library when it renders the
charts. You can specify an element ID you want this information to be
visualized, using this:
```html
<div data-netdata="unique.id"
data-dt-element-name="measurement1"
></div>
refreshed in <span id="measurement1"></span> milliseconds!
```
### Syncing charts y-range
If you give the same `data-common-max="NAME"` to 2+ charts, then all of them
will share the same max value of their y-range. If one spikes, all of them will
be aligned to have the same scale. This is done for the cpu interrupts and and
cpu softnet charts at the dashboard and also for the `gauge` and `easypiecharts`
of the Netdata home page.
```html
<div data-netdata="chart1"
data-common-max="chart-group-1"
></div>
<div data-netdata="chart2"
data-common-max="chart-group-1"
></div>
```
The same functionality exists for `data-common-min`.
### Syncing chart units
Netdata dashboards support auto-scaling of units. So, `MB` can become `KB`,
`GB`, etc dynamically, based on the value to be shown.
Giving the same `NAME` with `data-common-units= "NAME"`, 2+ charts can be forced
to always have the same units.
```html
<div data-netdata="chart1"
data-common-units="chart-group-1"
></div>
<div data-netdata="chart2"
data-common-units="chart-group-1"
></div>
```
### Setting desired units
Charts can be scaled to specific units with `data-desired-units=" UNITS"`. If
the dashboard can convert the units to the desired one, it will do.
```html
<div data-netdata="chart1"
data-desired-units="GB"
></div>
```
## Chart library settings
### Dygraph
You can set the min and max values of the y-axis using
`data-dygraph-valuerange=" [MIN, MAX] "`.
### EasyPieChart
#### Value range
You can set the max value of the chart using the following snippet:
```html
<div data-netdata="unique.id"
data-chart-library="easypiechart"
data-easypiechart-max-value="40"
></div>
```
Be aware that values that exceed the max value will get expanded (e.g. "41" is
still 100%). Similar for the minimum:
```html
<div data-netdata="unique.id"
data-chart-library="easypiechart"
data-easypiechart-min-value="20"
></div>
```
If you specify both minimum and maximum, the rendering behavior changes. Instead
of displaying the `value` based from zero, it is now based on the range that is
provided by the snippet:
```html
<div data-netdata="unique.id"
data-chart-library="easypiechart"
data-easypiechart-min-value="20"
data-easypiechart-max-value="40"
></div>
```
In the first example, a value of `30`, without specifying the minimum, fills the chart bar to '75 %` (100% / 40 * 30). However, in this example the range is now `20` (40 - 20 = 20). The value `30` will fill the chart to ** '50 %`**, since it's in the middle between 20 and 40.
This scenario is useful if you have metrics that change only within a specific range, e.g. temperatures that are very unlikely to fall out of range. In these cases it is more useful to have the chart render the values between the given min and max, to better highlight the changes within them.
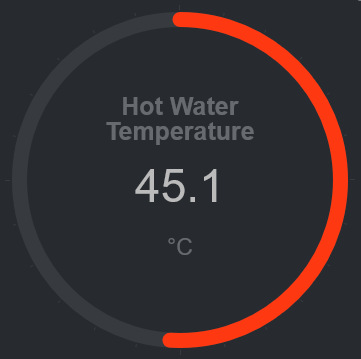
#### Negative values
EasyPieCharts can render negative values with the following flag:
```html
<div data-netdata="unique.id"
data-chart-library="easypiechart"
data-override-options="signed"
></div>
```
Negative values are rendered counter-clockwise.
#### Full example with EasyPieChart
This is a chart that displays the hotwater temperature in the given range of 40
to 50.
```html
<div data-netdata="acme_system.hotwater.hotwatertemp"
data-title="Hot Water Temperature"
data-decimal-digits="1"
data-chart-library="easypiechart"
data-colors="#FE3912"
data-width="55%"
data-height="50%"
data-points="1200"
data-after="-1200"
data-dimensions="actual"
data-units="°C"
data-easypiechart-max-value="50"
data-easypiechart-min-value="40"
data-common-max="netdata-hotwater-max"
data-common-min="netdata-hotwater-min"
></div>
```
|
