
diff options
Diffstat (limited to 'src/jaegertracing/opentelemetry-cpp/examples/prometheus/README.md')
| -rw-r--r-- | src/jaegertracing/opentelemetry-cpp/examples/prometheus/README.md | 208 |
1 files changed, 208 insertions, 0 deletions
diff --git a/src/jaegertracing/opentelemetry-cpp/examples/prometheus/README.md b/src/jaegertracing/opentelemetry-cpp/examples/prometheus/README.md new file mode 100644 index 000000000..d7e284a0e --- /dev/null +++ b/src/jaegertracing/opentelemetry-cpp/examples/prometheus/README.md @@ -0,0 +1,208 @@ +# Getting Started with Prometheus and Grafana + +- [Export metrics from the application](#export-metrics-from-the-application) + - [Check results in the browser](#check-results-in-the-browser) +- [Collect metrics using Prometheus](#collect-metrics-using-prometheus) + - [Configuration](#configuration) + - [Start Prometheus](#start-prometheus) + - [View results in Prometheus](#view-results-in-prometheus) +- [Explore metrics using Grafana](#explore-metrics-using-grafana) +- [Learn more](#learn-more) + +## Export metrics from the application + +It is highly recommended to go over the [ostream-metrics](../metrics_simple/README.md) +doc before following along this document. + +Run the application with: + +```sh +bazel run //examples/prometheus:prometheus_example +``` + +The main difference between the [ostream-metrics](../metrics_simple/README.md) +example with this one is that the line below is replaced: + +```cpp +std::unique_ptr<metric_sdk::MetricExporter> exporter{ + new exportermetrics::OStreamMetricExporter}; + +``` + +with + +```cpp +std::unique_ptr<metrics_sdk::MetricExporter> exporter{ + new metrics_exporter::PrometheusExporter(opts)}; +``` + +OpenTelemetry `PrometheusExporter` will export +data via the endpoint defined by +`metrics_exporter::PrometheusExporterOptions::url`, +which is `http://localhost:9464/` by default. + +```mermaid +graph LR + +subgraph SDK + MeterProvider + MetricReader[PeriodicExportingMetricReader] + PrometheusExporter["PrometheusExporter<br/>(http://localhost:9464/)"] +end + +subgraph API + Instrument["Meter(#quot;prometheus_metric_example#quot;, #quot;1.0#quot;)<br/>Histogram(#quot;prometheus_metric_example_histogram#quot;)"] +end + +Instrument --> | Measurements | MeterProvider + +MeterProvider --> | Metrics | MetricReader --> | Pull | PrometheusExporter +``` + +Also, for our learning purpose, we use a while-loop to keep recoring random +values until the program stops. + +```cpp +while (true) +{ + double val = (rand() % 700) + 1.1; + std::map<std::string, std::string> labels = get_random_attr(); + auto labelkv = opentelemetry::common::KeyValueIterableView<decltype(labels)>{labels}; + histogram_counter->Record(val, labelkv, context); + std::this_thread::sleep_for(std::chrono::milliseconds(50)); +} +``` + +### Check results in the browser + +Start the application and keep it running. Now we should be able to see the +metrics at [http://localhost:9464/metrics](http://localhost:9464/metrics) from a +web browser: + +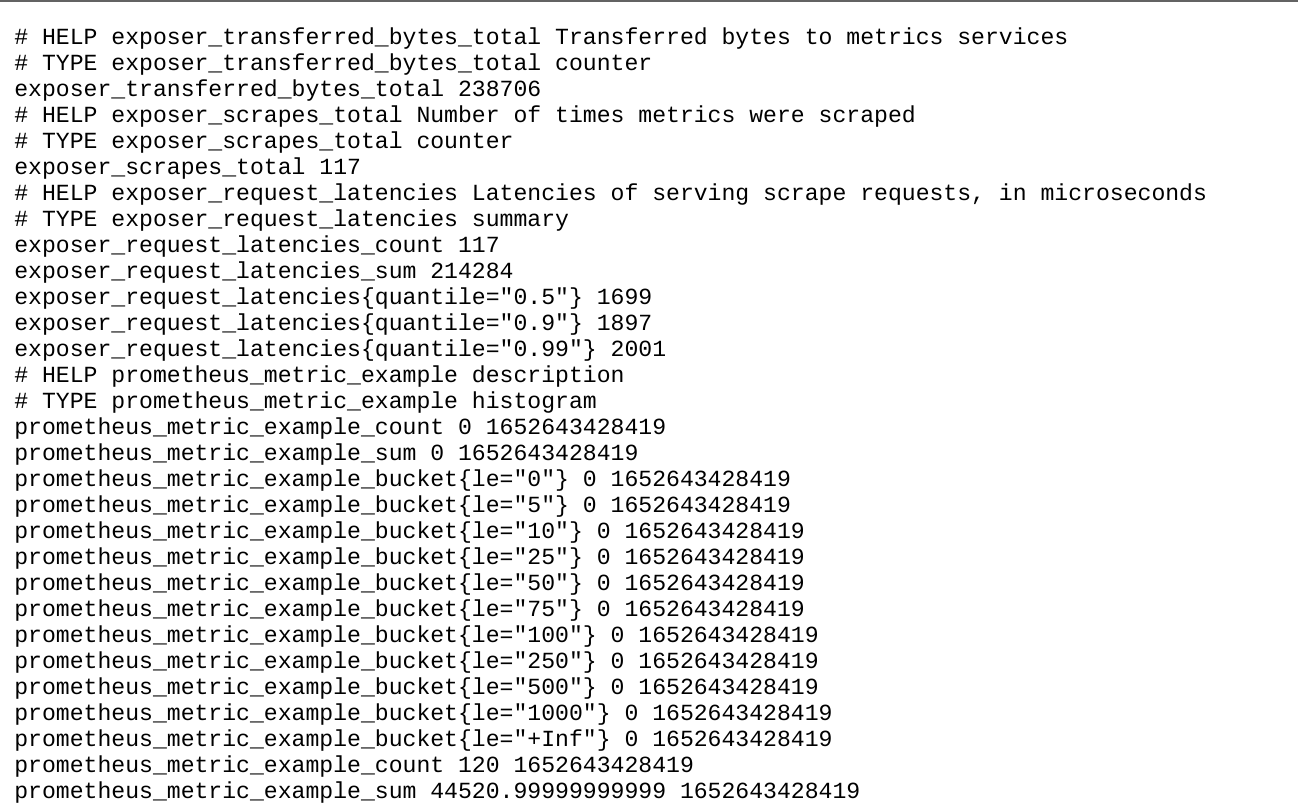 + +Now, we understand how we can configure `PrometheusExporter` to export metrics. +Next, we are going to learn about how to use Prometheus to collect the metrics. + +## Collect metrics using Prometheus + +Follow the [first steps](https://prometheus.io/docs/introduction/first_steps/) +to download the [latest release](https://prometheus.io/download/) of Prometheus. +It is also possible to use `prom/prometheus` docker image. + +### Configuration + +After downloading, extract it to a local location that's easy to +access. We will find the default Prometheus configuration YAML file in the +folder, named `prometheus.yml`. + +```yaml +global: + scrape_interval: 5s + scrape_timeout: 2s + evaluation_interval: 5s +alerting: + alertmanagers: + - follow_redirects: true + scheme: http + timeout: 5s + api_version: v2 + static_configs: + - targets: [localhost:9464] +scrape_configs: + - job_name: otel + static_configs: + - targets: ['localhost:9464'] +``` + +### Start Prometheus + +Follow the instructions from +[starting-prometheus](https://prometheus.io/docs/introduction/first_steps/#starting-prometheus) +to start the Prometheus server and verify it has been started successfully. + +Please note that we will need pass in `prometheus.yml` file as the argument +or mount as volume: + +```console +./prometheus --config.file=prometheus.yml +# OR: +docker run -p 9090:9090 -v $(pwd):/etc/prometheus --network="host" prom/prometheus +``` + +### View results in Prometheus + +To use the graphical interface for viewing our metrics with Prometheus, navigate +to [http://localhost:9090/graph](http://localhost:9090/graph), +and type `prometheus_metric_example_bucket` in the expression bar of the UI; +finally, click the execute button. + +We should be able to see the following chart from the browser: + +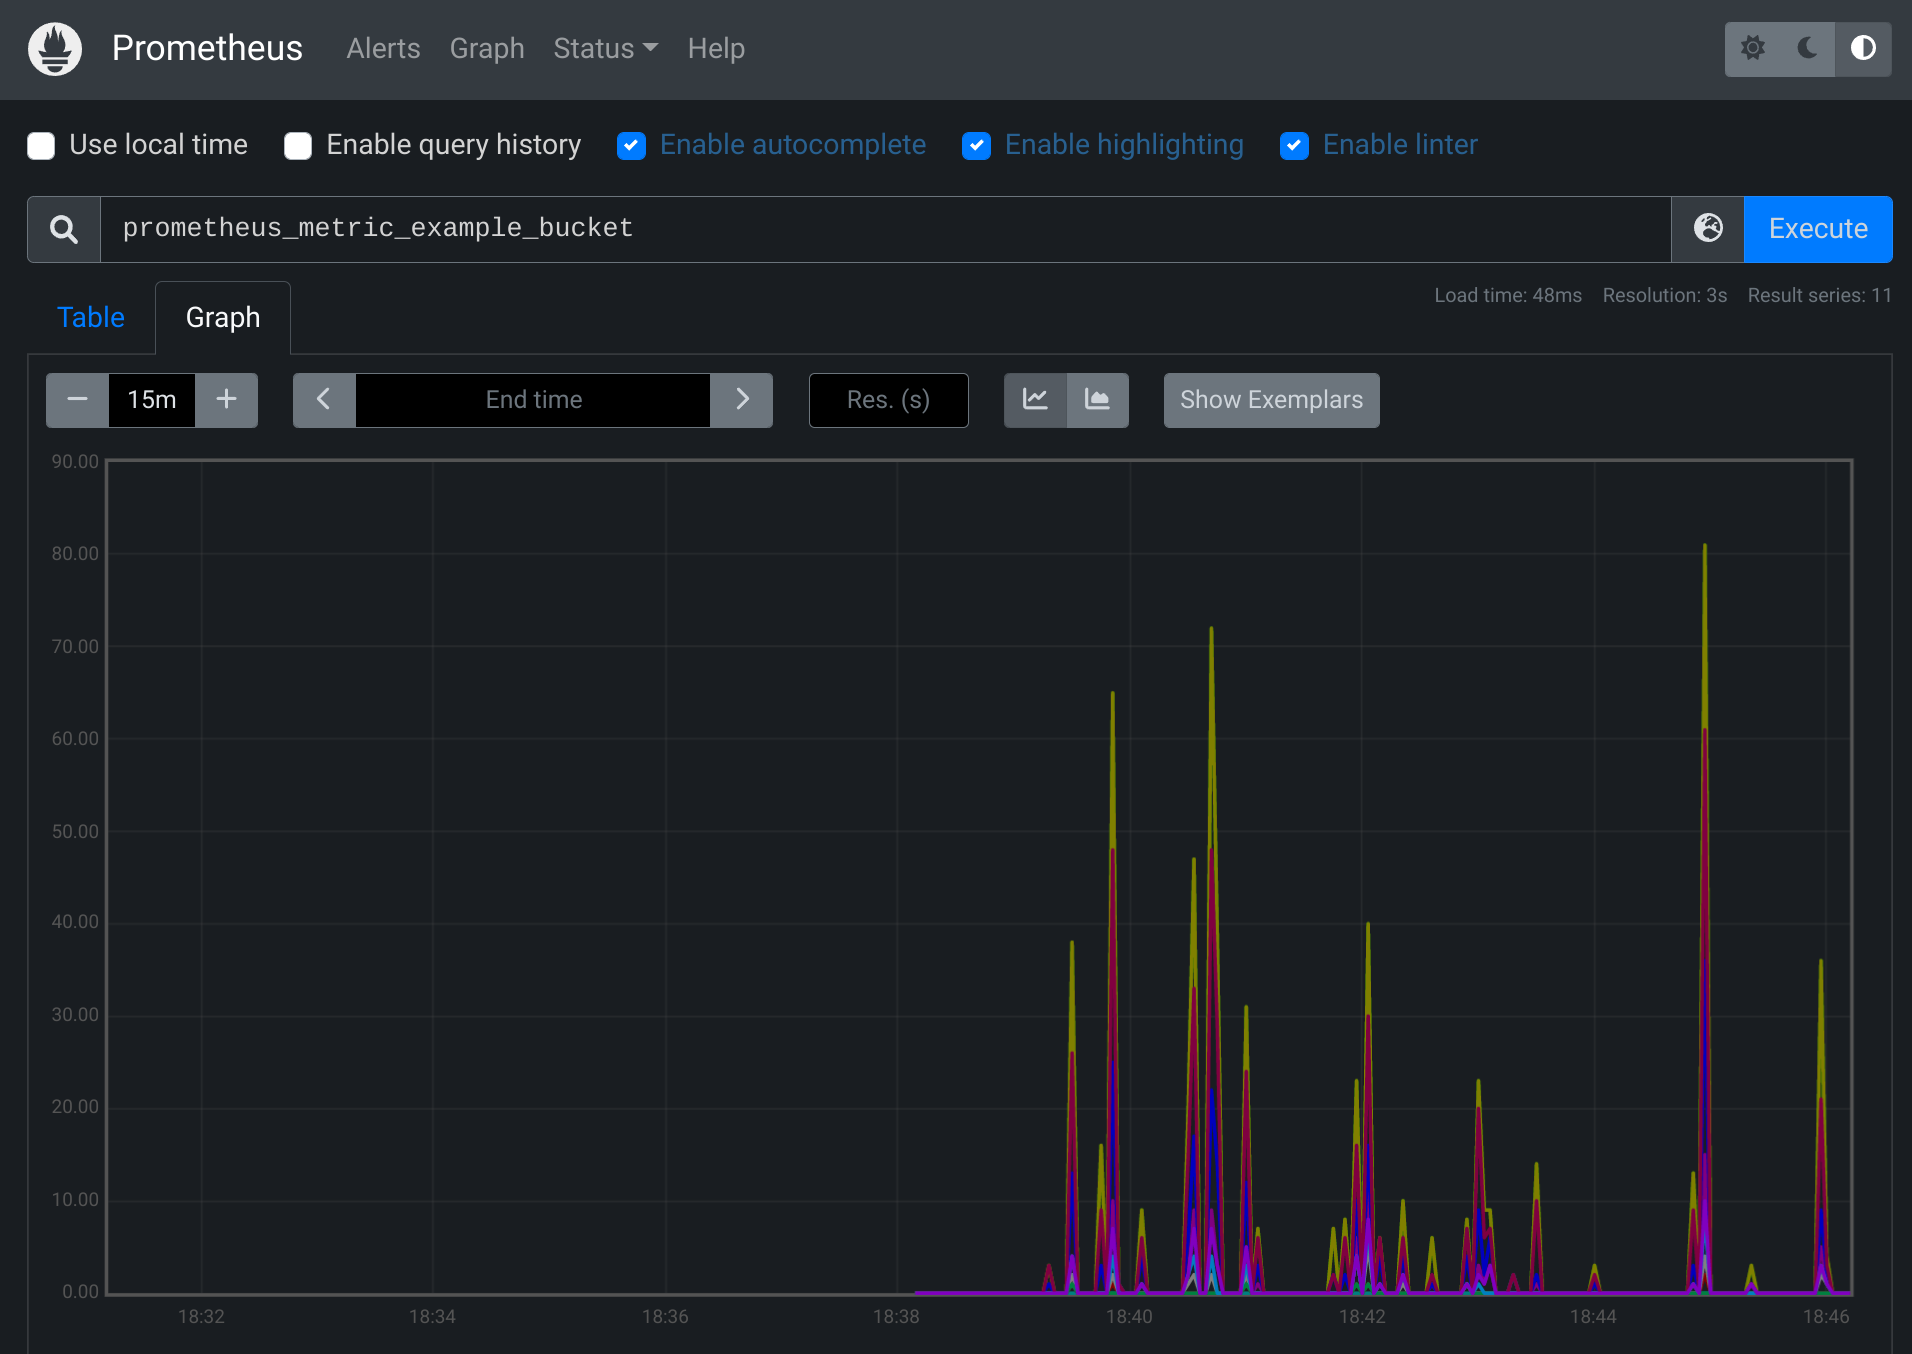 + +From the legend, we can see that the `instance` name and the `job` name are the +values we have set in `prometheus.yml`. + +Congratulations! + +Now we know how to configure Prometheus server and deploy OpenTelemetry +`PrometheusExporter` to export our metrics. Next, we are going to explore a tool +called Grafana, which has powerful visualizations for the metrics. + +## Explore metrics using Grafana + +[Install Grafana](https://grafana.com/docs/grafana/latest/installation/). + +Start the standalone Grafana server (`grafana-server.exe` or +`./bin/grafana-server`, depending on the operating system). Then, use the +browser to navigate to [http://localhost:3000/](http://localhost:3000/). +It is also possible to run `grafana/grafana` container: + +```sh +docker run -d -p 3000:3000 --network="host" grafana/grafana +``` + +Follow the instructions in the Grafana getting started +[doc](https://grafana.com/docs/grafana/latest/getting-started/getting-started/#step-2-log-in) +to log in. + +After successfully logging in, click on the Configuration icon +on the panel at the left hand side, and click on Prometheus. +Type in the default endpoint of Prometheus as suggested by the UI +as the value for the URI. + +```console +http://localhost:9090 +``` + +Then, click on the Explore icon on the left panel of +the website - we should be able to write some queries to explore our metrics +now! + +Feel free to find some handy PromQL +[here](https://promlabs.com/promql-cheat-sheet/). + +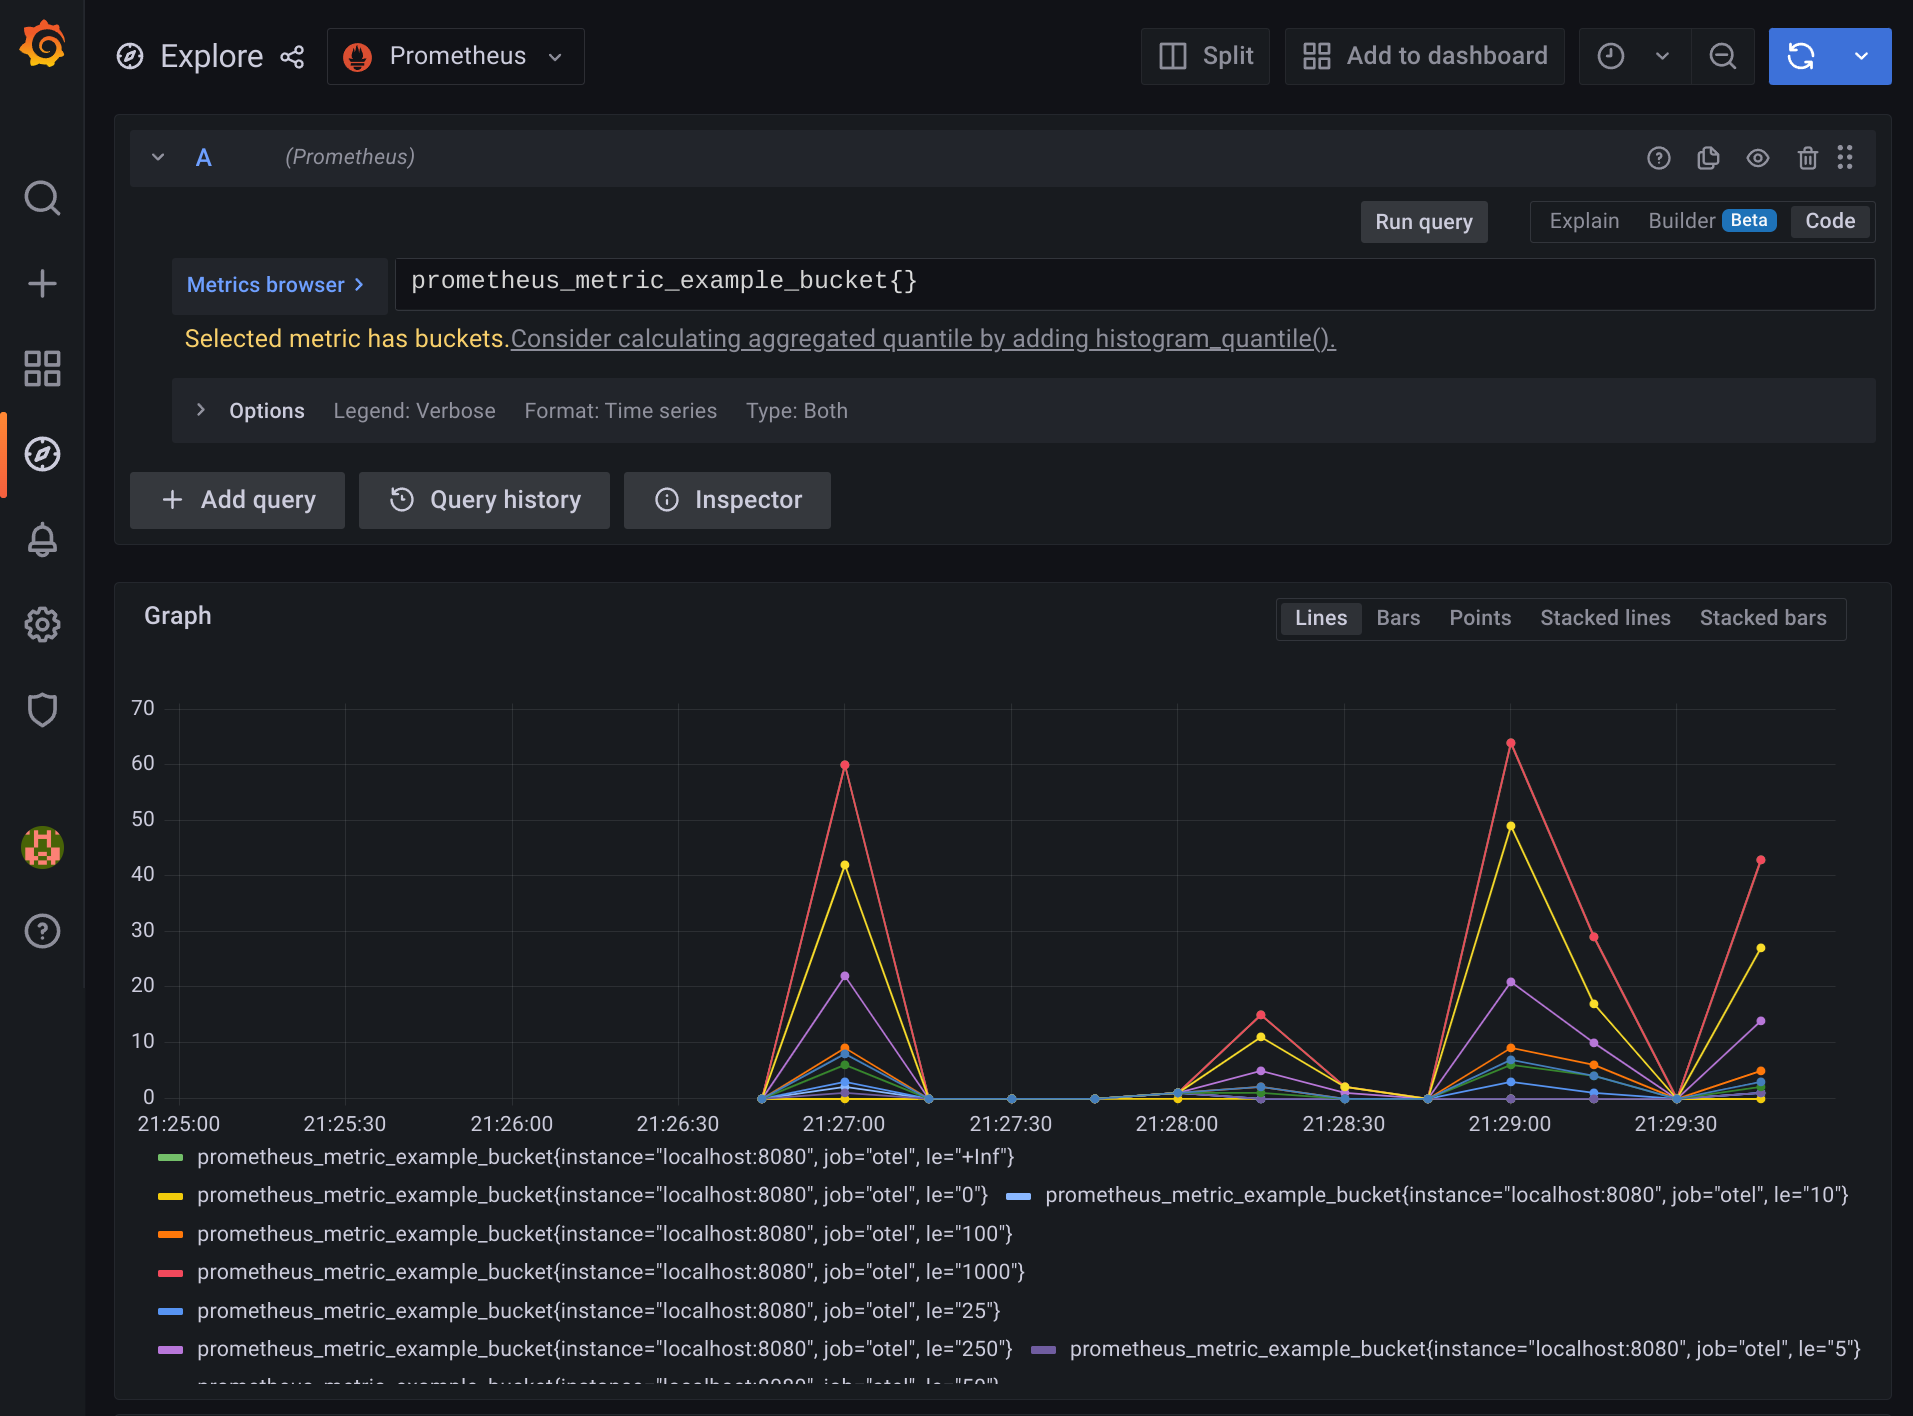 + +```mermaid +graph TD + +subgraph Prometheus + PrometheusScraper + PrometheusDatabase +end + +PrometheusExporter["PrometheusExporter<br/>(listening at #quot;http://localhost:9464/#quot;)"] -->|HTTP GET| PrometheusScraper{{"Prometheus scraper<br/>(polling #quot;http://localhost:9464/metrics#quot; every 5 seconds)"}} +PrometheusScraper --> PrometheusDatabase[("Prometheus TSDB (time series database)")] +PrometheusDatabase -->|http://localhost:9090/graph| PrometheusUI["Browser<br/>(Prometheus Dashboard)"] +PrometheusDatabase -->|http://localhost:9090/api/| Grafana[Grafana Server] +Grafana -->|http://localhost:3000/dashboard| GrafanaUI["Browser<br/>(Grafana Dashboard)"] +``` + +## Learn more + +- [What is Prometheus?](https://prometheus.io/docs/introduction/overview/) +- [Grafana support for + Prometheus](https://prometheus.io/docs/visualization/grafana/#creating-a-prometheus-graph) |