1
2
3
4
5
6
7
8
9
10
11
12
13
14
15
16
17
18
19
20
21
22
23
24
25
26
27
28
29
30
31
32
33
34
35
36
37
38
39
40
41
42
43
44
45
46
47
48
49
50
51
52
53
54
55
56
57
58
59
60
61
62
63
64
65
66
67
68
69
70
71
72
73
74
75
76
77
78
79
80
81
82
83
84
85
86
87
88
89
90
91
92
93
94
95
96
97
98
99
100
101
102
103
104
105
106
107
108
109
110
111
112
113
114
115
116
117
118
119
120
121
122
123
124
125
126
127
128
129
130
131
132
133
134
135
136
137
138
139
140
141
142
143
144
145
146
147
148
149
150
151
152
153
154
155
156
157
158
159
160
161
162
163
164
165
166
167
168
169
170
171
172
173
174
175
176
177
178
179
180
181
182
183
184
185
186
187
188
189
190
191
192
193
194
195
196
197
198
199
200
201
202
203
204
205
206
207
208
|
# Getting Started with Prometheus and Grafana
- [Export metrics from the application](#export-metrics-from-the-application)
- [Check results in the browser](#check-results-in-the-browser)
- [Collect metrics using Prometheus](#collect-metrics-using-prometheus)
- [Configuration](#configuration)
- [Start Prometheus](#start-prometheus)
- [View results in Prometheus](#view-results-in-prometheus)
- [Explore metrics using Grafana](#explore-metrics-using-grafana)
- [Learn more](#learn-more)
## Export metrics from the application
It is highly recommended to go over the [ostream-metrics](../metrics_simple/README.md)
doc before following along this document.
Run the application with:
```sh
bazel run //examples/prometheus:prometheus_example
```
The main difference between the [ostream-metrics](../metrics_simple/README.md)
example with this one is that the line below is replaced:
```cpp
std::unique_ptr<metric_sdk::MetricExporter> exporter{
new exportermetrics::OStreamMetricExporter};
```
with
```cpp
std::unique_ptr<metrics_sdk::MetricExporter> exporter{
new metrics_exporter::PrometheusExporter(opts)};
```
OpenTelemetry `PrometheusExporter` will export
data via the endpoint defined by
`metrics_exporter::PrometheusExporterOptions::url`,
which is `http://localhost:9464/` by default.
```mermaid
graph LR
subgraph SDK
MeterProvider
MetricReader[PeriodicExportingMetricReader]
PrometheusExporter["PrometheusExporter<br/>(http://localhost:9464/)"]
end
subgraph API
Instrument["Meter(#quot;prometheus_metric_example#quot;, #quot;1.0#quot;)<br/>Histogram(#quot;prometheus_metric_example_histogram#quot;)"]
end
Instrument --> | Measurements | MeterProvider
MeterProvider --> | Metrics | MetricReader --> | Pull | PrometheusExporter
```
Also, for our learning purpose, we use a while-loop to keep recoring random
values until the program stops.
```cpp
while (true)
{
double val = (rand() % 700) + 1.1;
std::map<std::string, std::string> labels = get_random_attr();
auto labelkv = opentelemetry::common::KeyValueIterableView<decltype(labels)>{labels};
histogram_counter->Record(val, labelkv, context);
std::this_thread::sleep_for(std::chrono::milliseconds(50));
}
```
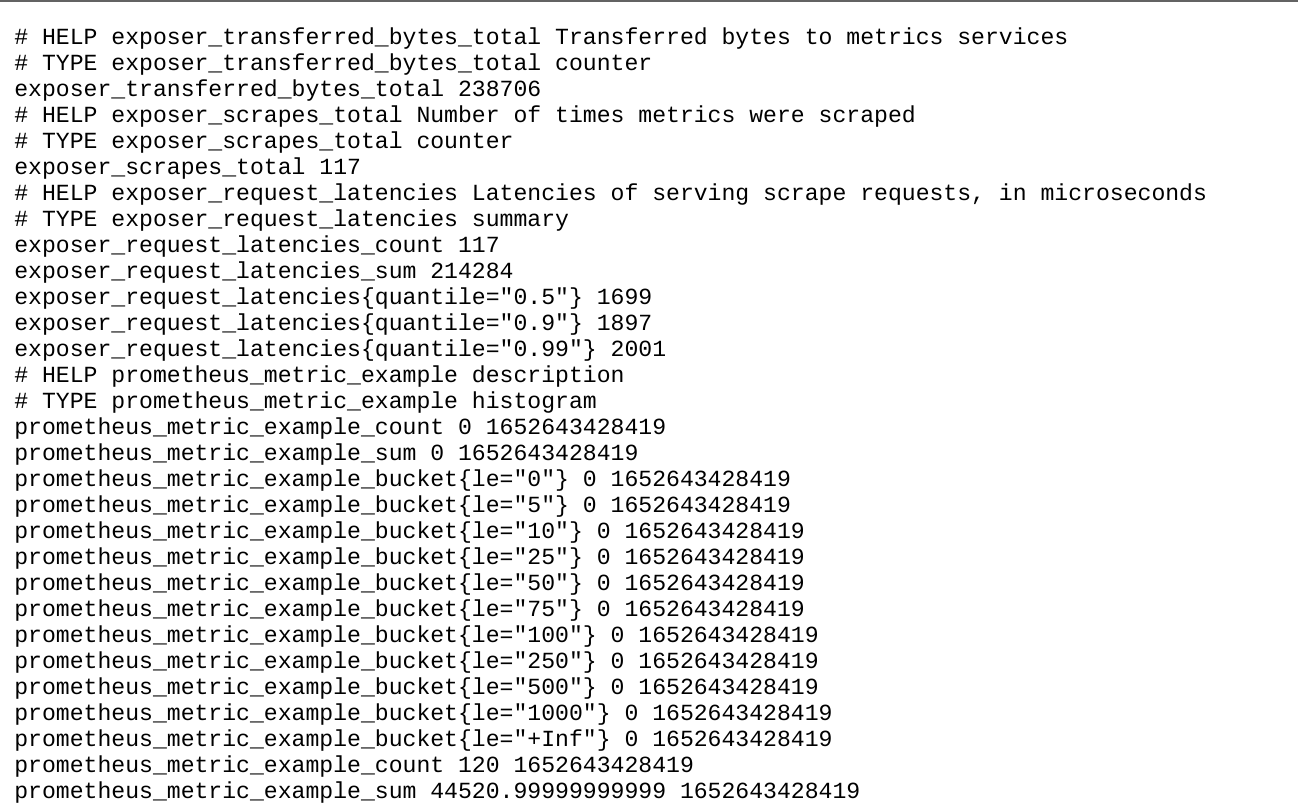
### Check results in the browser
Start the application and keep it running. Now we should be able to see the
metrics at [http://localhost:9464/metrics](http://localhost:9464/metrics) from a
web browser:
Now, we understand how we can configure `PrometheusExporter` to export metrics.
Next, we are going to learn about how to use Prometheus to collect the metrics.
## Collect metrics using Prometheus
Follow the [first steps](https://prometheus.io/docs/introduction/first_steps/)
to download the [latest release](https://prometheus.io/download/) of Prometheus.
It is also possible to use `prom/prometheus` docker image.
### Configuration
After downloading, extract it to a local location that's easy to
access. We will find the default Prometheus configuration YAML file in the
folder, named `prometheus.yml`.
```yaml
global:
scrape_interval: 5s
scrape_timeout: 2s
evaluation_interval: 5s
alerting:
alertmanagers:
- follow_redirects: true
scheme: http
timeout: 5s
api_version: v2
static_configs:
- targets: [localhost:9464]
scrape_configs:
- job_name: otel
static_configs:
- targets: ['localhost:9464']
```
### Start Prometheus
Follow the instructions from
[starting-prometheus](https://prometheus.io/docs/introduction/first_steps/#starting-prometheus)
to start the Prometheus server and verify it has been started successfully.
Please note that we will need pass in `prometheus.yml` file as the argument
or mount as volume:
```console
./prometheus --config.file=prometheus.yml
# OR:
docker run -p 9090:9090 -v $(pwd):/etc/prometheus --network="host" prom/prometheus
```
### View results in Prometheus
To use the graphical interface for viewing our metrics with Prometheus, navigate
to [http://localhost:9090/graph](http://localhost:9090/graph),
and type `prometheus_metric_example_bucket` in the expression bar of the UI;
finally, click the execute button.
We should be able to see the following chart from the browser:
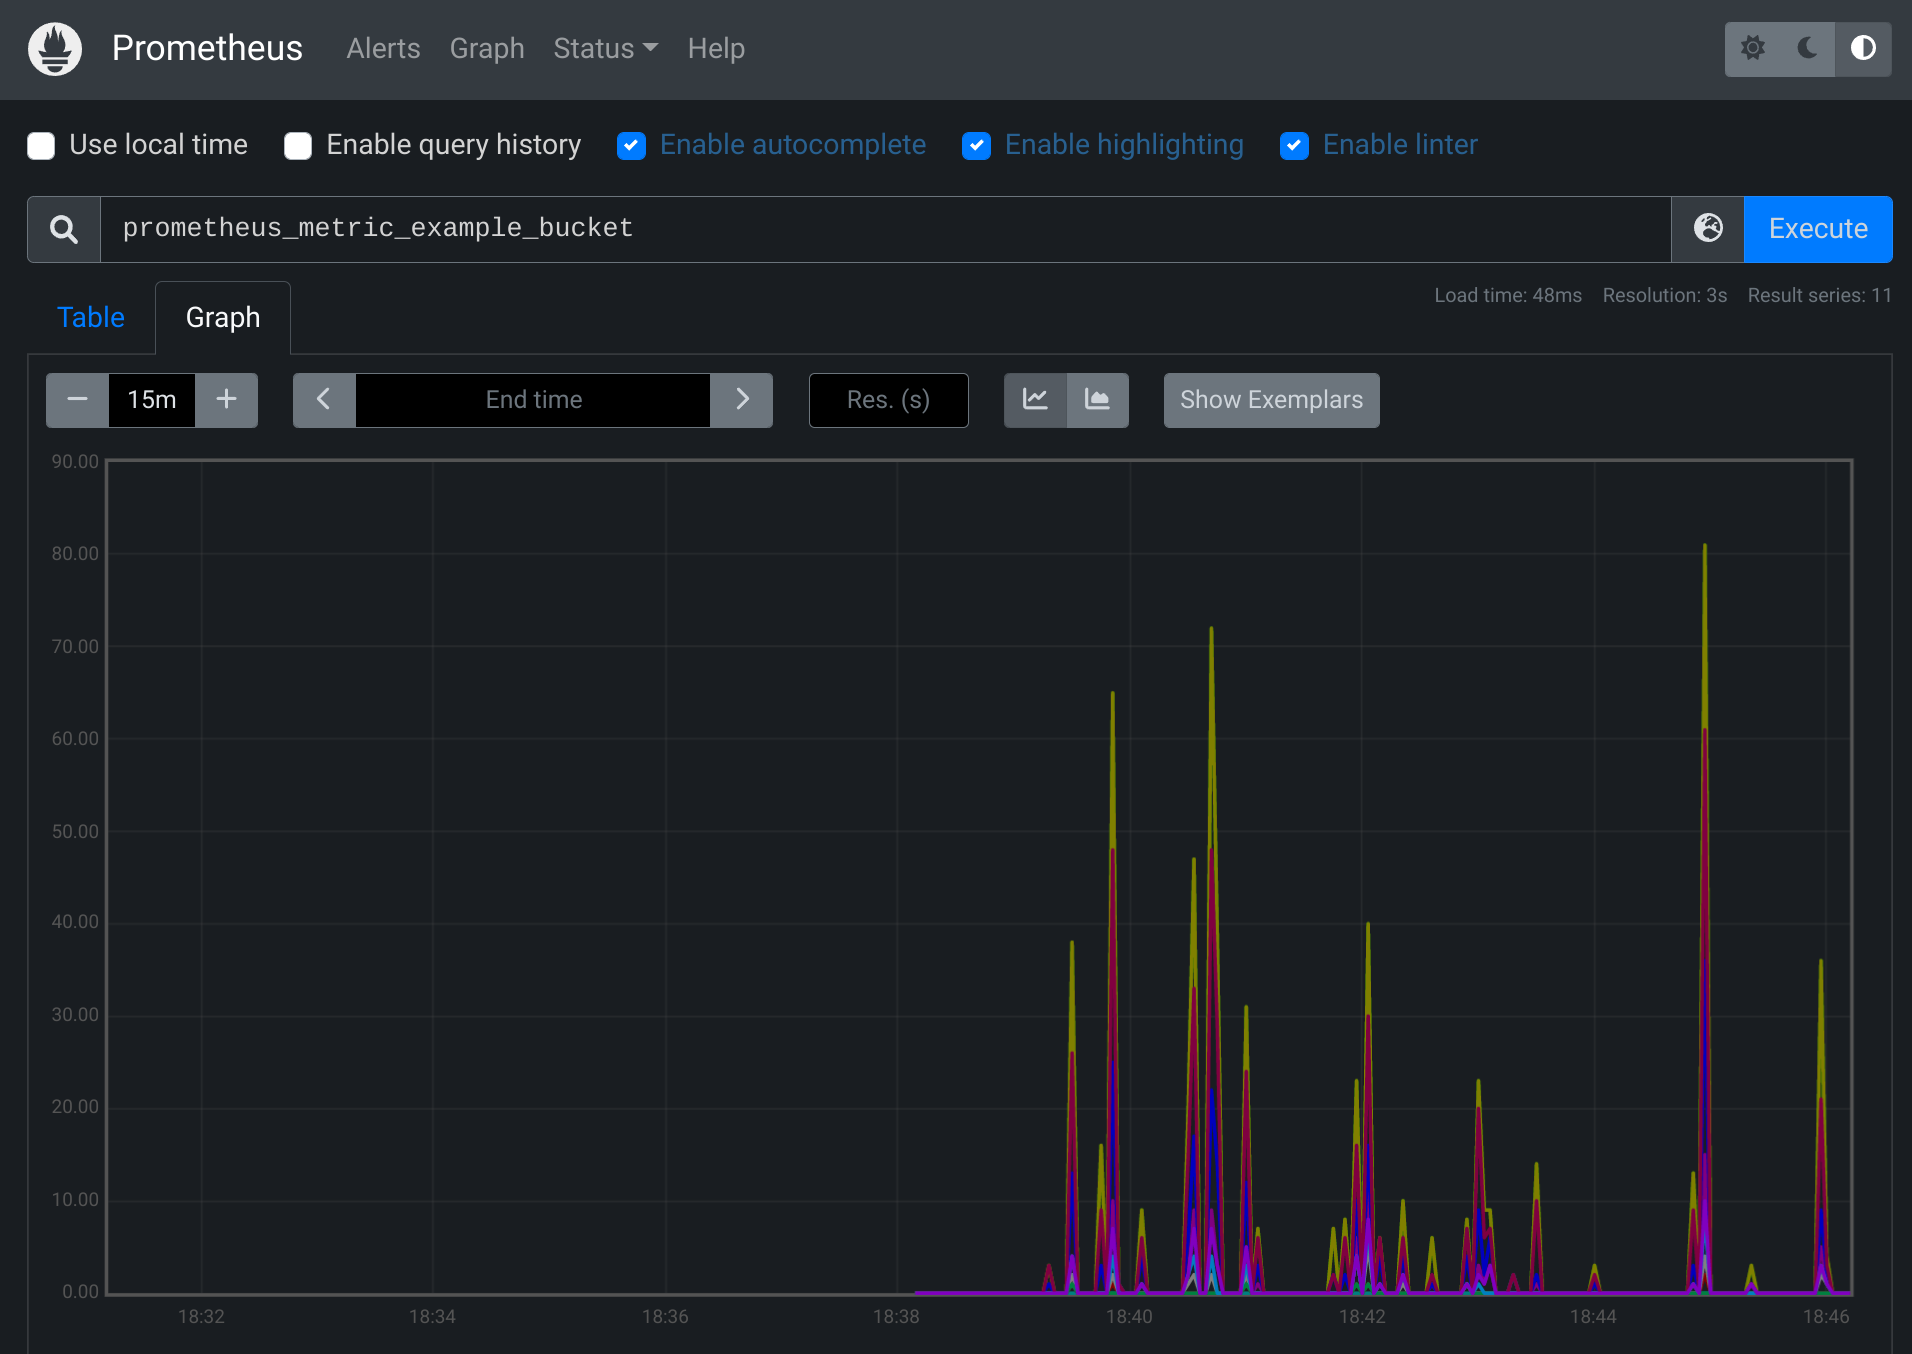
From the legend, we can see that the `instance` name and the `job` name are the
values we have set in `prometheus.yml`.
Congratulations!
Now we know how to configure Prometheus server and deploy OpenTelemetry
`PrometheusExporter` to export our metrics. Next, we are going to explore a tool
called Grafana, which has powerful visualizations for the metrics.
## Explore metrics using Grafana
[Install Grafana](https://grafana.com/docs/grafana/latest/installation/).
Start the standalone Grafana server (`grafana-server.exe` or
`./bin/grafana-server`, depending on the operating system). Then, use the
browser to navigate to [http://localhost:3000/](http://localhost:3000/).
It is also possible to run `grafana/grafana` container:
```sh
docker run -d -p 3000:3000 --network="host" grafana/grafana
```
Follow the instructions in the Grafana getting started
[doc](https://grafana.com/docs/grafana/latest/getting-started/getting-started/#step-2-log-in)
to log in.
After successfully logging in, click on the Configuration icon
on the panel at the left hand side, and click on Prometheus.
Type in the default endpoint of Prometheus as suggested by the UI
as the value for the URI.
```console
http://localhost:9090
```
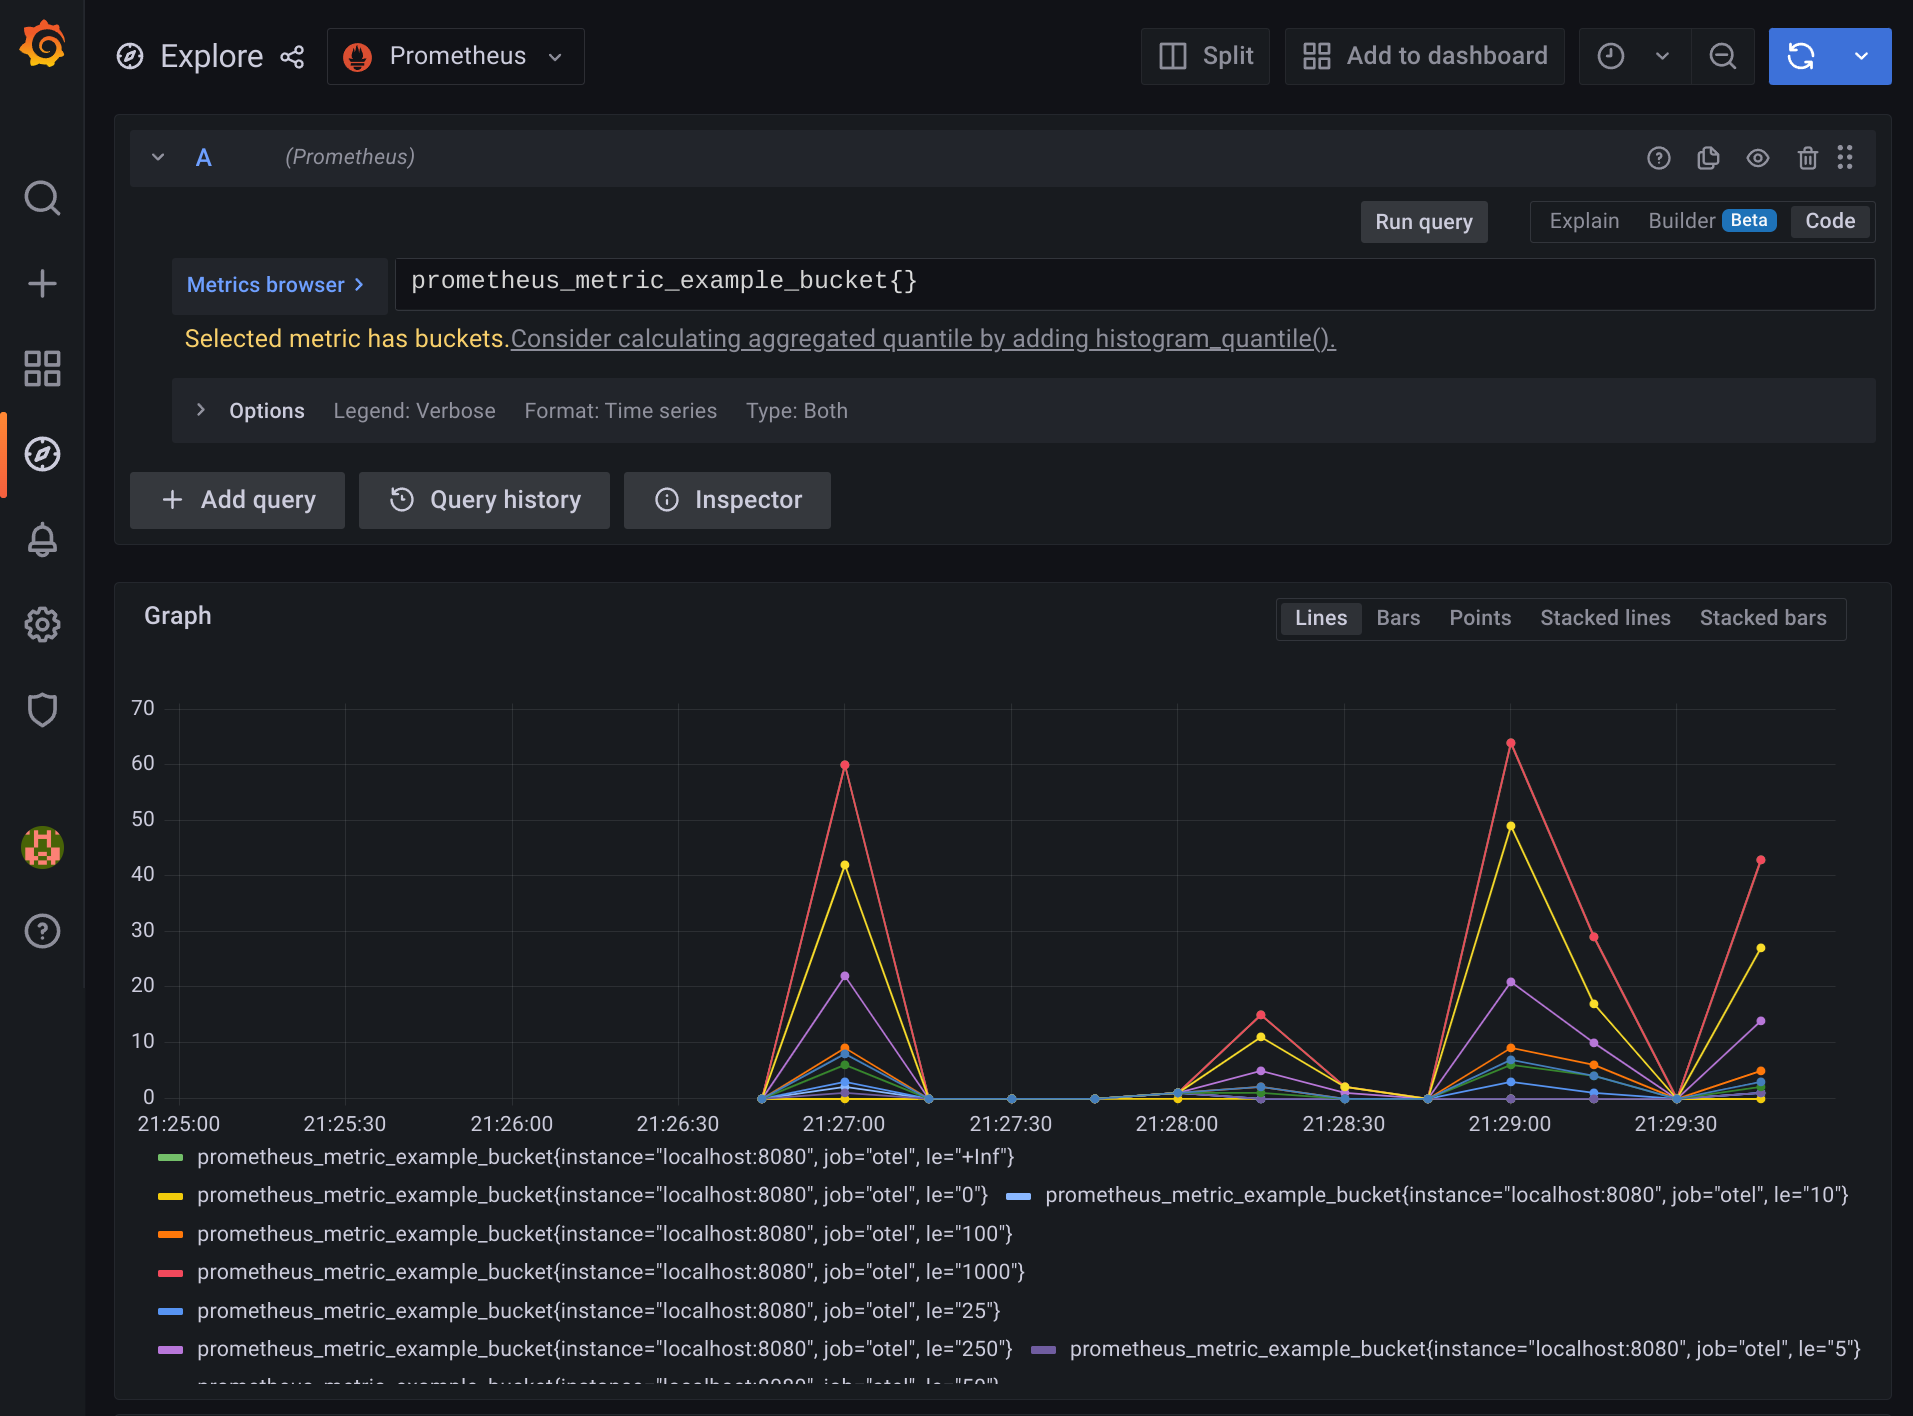
Then, click on the Explore icon on the left panel of
the website - we should be able to write some queries to explore our metrics
now!
Feel free to find some handy PromQL
[here](https://promlabs.com/promql-cheat-sheet/).
```mermaid
graph TD
subgraph Prometheus
PrometheusScraper
PrometheusDatabase
end
PrometheusExporter["PrometheusExporter<br/>(listening at #quot;http://localhost:9464/#quot;)"] -->|HTTP GET| PrometheusScraper{{"Prometheus scraper<br/>(polling #quot;http://localhost:9464/metrics#quot; every 5 seconds)"}}
PrometheusScraper --> PrometheusDatabase[("Prometheus TSDB (time series database)")]
PrometheusDatabase -->|http://localhost:9090/graph| PrometheusUI["Browser<br/>(Prometheus Dashboard)"]
PrometheusDatabase -->|http://localhost:9090/api/| Grafana[Grafana Server]
Grafana -->|http://localhost:3000/dashboard| GrafanaUI["Browser<br/>(Grafana Dashboard)"]
```
## Learn more
- [What is Prometheus?](https://prometheus.io/docs/introduction/overview/)
- [Grafana support for
Prometheus](https://prometheus.io/docs/visualization/grafana/#creating-a-prometheus-graph)
|
