
diff options
| author | Daniel Baumann <daniel.baumann@progress-linux.org> | 2024-04-19 02:57:58 +0000 |
|---|---|---|
| committer | Daniel Baumann <daniel.baumann@progress-linux.org> | 2024-04-19 02:57:58 +0000 |
| commit | be1c7e50e1e8809ea56f2c9d472eccd8ffd73a97 (patch) | |
| tree | 9754ff1ca740f6346cf8483ec915d4054bc5da2d /docs/guides/monitor | |
| parent | Initial commit. (diff) | |
| download | netdata-upstream.tar.xz netdata-upstream.zip | |
Adding upstream version 1.44.3.upstream/1.44.3upstream
Signed-off-by: Daniel Baumann <daniel.baumann@progress-linux.org>
Diffstat (limited to 'docs/guides/monitor')
| -rw-r--r-- | docs/guides/monitor/anomaly-detection.md | 76 | ||||
| -rw-r--r-- | docs/guides/monitor/kubernetes-k8s-netdata.md | 246 | ||||
| -rw-r--r-- | docs/guides/monitor/lamp-stack.md | 238 | ||||
| -rw-r--r-- | docs/guides/monitor/pi-hole-raspberry-pi.md | 142 | ||||
| -rw-r--r-- | docs/guides/monitor/process.md | 270 | ||||
| -rw-r--r-- | docs/guides/monitor/raspberry-pi-anomaly-detection.md | 96 |
6 files changed, 1068 insertions, 0 deletions
diff --git a/docs/guides/monitor/anomaly-detection.md b/docs/guides/monitor/anomaly-detection.md new file mode 100644 index 00000000..c0a00ef3 --- /dev/null +++ b/docs/guides/monitor/anomaly-detection.md @@ -0,0 +1,76 @@ +<!-- +title: "Machine learning (ML) powered anomaly detection" +sidebar_label: "Machine learning (ML) powered anomaly detection" +description: "Detect anomalies in any system, container, or application in your infrastructure with machine learning and the open-source Netdata Agent." +image: /img/seo/guides/monitor/anomaly-detection.png +custom_edit_url: https://github.com/netdata/netdata/edit/master/docs/guides/monitor/anomaly-detection.md +learn_status: "Published" +learn_rel_path: "Operations" +--> + +# Machine learning (ML) powered anomaly detection + + +## Overview + +As of [`v1.32.0`](https://github.com/netdata/netdata/releases/tag/v1.32.0), Netdata comes with some ML powered [anomaly detection](https://en.wikipedia.org/wiki/Anomaly_detection) capabilities built into it and available to use out of the box, with zero configuration required (ML was enabled by default in `v1.35.0-29-nightly` in [this PR](https://github.com/netdata/netdata/pull/13158), previously it required a one line config change). + +This means that in addition to collecting raw value metrics, the Netdata agent will also produce an [`anomaly-bit`](https://github.com/netdata/netdata/blob/master/ml/README.md#anomaly-bit---100--anomalous-0--normal) every second which will be `100` when recent raw metric values are considered anomalous by Netdata and `0` when they look normal. Once we aggregate beyond one second intervals this aggregated `anomaly-bit` becomes an ["anomaly rate"](https://github.com/netdata/netdata/blob/master/ml/README.md#anomaly-rate---averageanomaly-bit). + +To be as concrete as possible, the below api call shows how to access the raw anomaly bit of the `system.cpu` chart from the [london.my-netdata.io](https://london.my-netdata.io) Netdata demo server. Passing `options=anomaly-bit` returns the anomaly bit instead of the raw metric value. + +``` +https://london.my-netdata.io/api/v1/data?chart=system.cpu&options=anomaly-bit +``` + +If we aggregate the above to just 1 point by adding `points=1` we get an "[Anomaly Rate](https://github.com/netdata/netdata/blob/master/ml/README.md#anomaly-rate---averageanomaly-bit)": + +``` +https://london.my-netdata.io/api/v1/data?chart=system.cpu&options=anomaly-bit&points=1 +``` + +The fundamentals of Netdata's anomaly detection approach and implementation are covered in lots more detail in the [agent ML documentation](https://github.com/netdata/netdata/blob/master/ml/README.md). + +This guide will explain how to get started using these ML based anomaly detection capabilities within Netdata. + +## Anomaly Advisor + +The [Anomaly Advisor](https://github.com/netdata/netdata/blob/master/docs/cloud/insights/anomaly-advisor.md) is the flagship anomaly detection feature within Netdata. In the "Anomalies" tab of Netdata you will see an overall "Anomaly Rate" chart that aggregates node level anomaly rate for all nodes in a space. The aim of this chart is to make it easy to quickly spot periods of time where the overall "[node anomaly rate](https://github.com/netdata/netdata/blob/master/ml/README.md#node-anomaly-rate)" is elevated in some unusual way and for what node or nodes this relates to. + +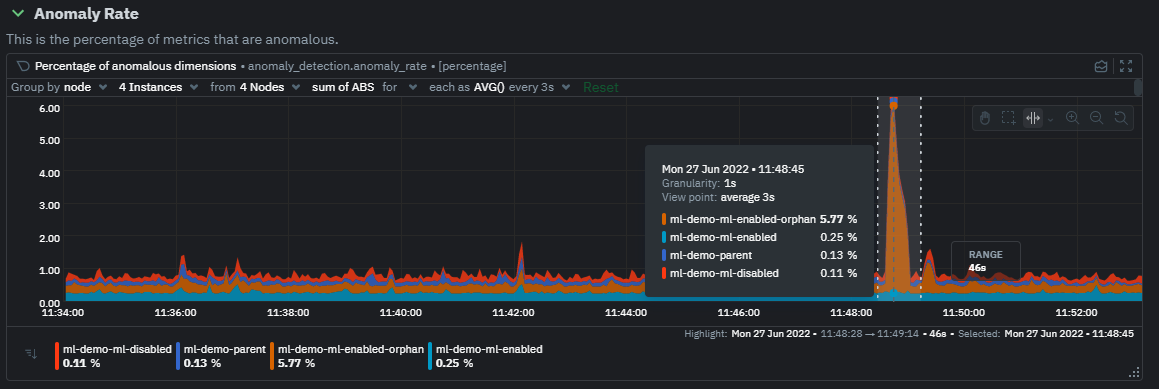 + +Once an area on the Anomaly Rate chart is highlighted netdata will append a "heatmap" to the bottom of the screen that shows which metrics were more anomalous in the highlighted timeframe. Each row in the heatmap consists of an anomaly rate sparkline graph that can be expanded to reveal the raw underlying metric chart for that dimension. + +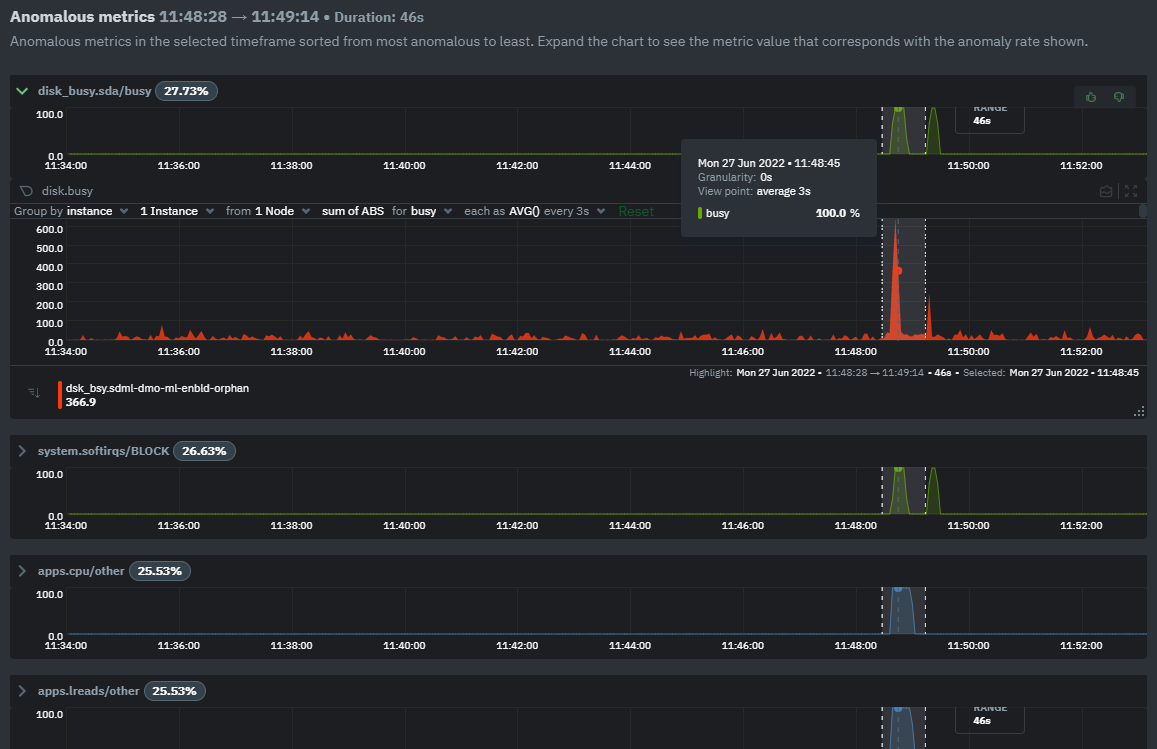 + +## Embedded Anomaly Rate Charts + +Charts in both the [Overview](https://github.com/netdata/netdata/blob/master/docs/cloud/visualize/overview.md) and [single node dashboard](https://github.com/netdata/netdata/blob/master/docs/cloud/visualize/overview.md#jump-to-single-node-dashboards) tabs also expose the underlying anomaly rates for each dimension so users can easily see if the raw metrics are considered anomalous or not by Netdata. + +Pressing the anomalies icon (next to the information icon in the chart header) will expand the anomaly rate chart to make it easy to see how the anomaly rate for any individual dimension corresponds to the raw underlying data. In the example below we can see that the spike in `system.pgpgio|in` corresponded in the anomaly rate for that dimension jumping to 100% for a small period of time until the spike passed. + +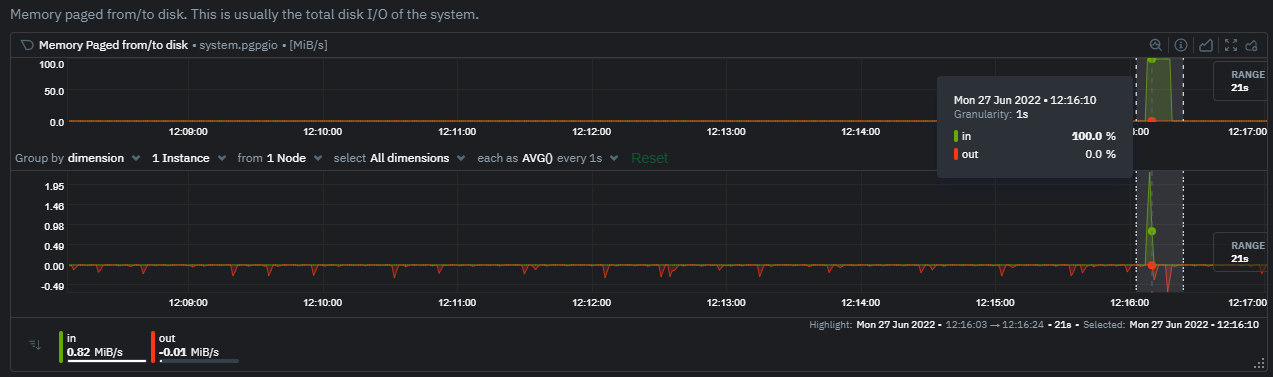 + +## Anomaly Rate Based Alerts + +It is possible to use the `anomaly-bit` when defining traditional Alerts within netdata. The `anomaly-bit` is just another `options` parameter that can be passed as part of an [alert line lookup](https://github.com/netdata/netdata/blob/master/docs/configure/start-stop-restart.md#alert-line-lookup). + +You can see some example ML based alert configurations below: + +- [Anomaly rate based CPU dimensions alert](https://github.com/netdata/netdata/blob/master/health/REFERENCE.md#example-8---anomaly-rate-based-cpu-dimensions-alert) +- [Anomaly rate based CPU chart alert](https://github.com/netdata/netdata/blob/master/health/REFERENCE.md#example-9---anomaly-rate-based-cpu-chart-alert) +- [Anomaly rate based node level alert](https://github.com/netdata/netdata/blob/master/health/REFERENCE.md#example-10---anomaly-rate-based-node-level-alert) +- More examples in the [`/health/health.d/ml.conf`](https://github.com/netdata/netdata/blob/master/health/health.d/ml.conf) file that ships with the agent. + +## Learn More + +Check out the resources below to learn more about how Netdata is approaching ML: + +- [Agent ML documentation](https://github.com/netdata/netdata/blob/master/ml/README.md). +- [Anomaly Advisor documentation](https://github.com/netdata/netdata/blob/master/docs/cloud/insights/anomaly-advisor.md). +- [Metric Correlations documentation](https://github.com/netdata/netdata/blob/master/docs/cloud/insights/metric-correlations.md). +- Anomaly Advisor [launch blog post](https://www.netdata.cloud/blog/introducing-anomaly-advisor-unsupervised-anomaly-detection-in-netdata/). +- Netdata Approach to ML [blog post](https://www.netdata.cloud/blog/our-approach-to-machine-learning/). +- `areal/ml` related [GitHub Discussions](https://github.com/netdata/netdata/discussions?discussions_q=label%3Aarea%2Fml). +- Netdata Machine Learning Meetup [deck](https://docs.google.com/presentation/d/1rfSxktg2av2k-eMwMbjN0tXeo76KC33iBaxerYinovs/edit?usp=sharing) and [YouTube recording](https://www.youtube.com/watch?v=eJGWZHVQdNU). +- Netdata Anomaly Advisor [YouTube Playlist](https://youtube.com/playlist?list=PL-P-gAHfL2KPeUcCKmNHXC-LX-FfdO43j). diff --git a/docs/guides/monitor/kubernetes-k8s-netdata.md b/docs/guides/monitor/kubernetes-k8s-netdata.md new file mode 100644 index 00000000..96d79935 --- /dev/null +++ b/docs/guides/monitor/kubernetes-k8s-netdata.md @@ -0,0 +1,246 @@ +# Kubernetes monitoring with Netdata + +This document gives an overview of what visualizations Netdata provides on Kubernetes deployments. + +At Netdata, we've built Kubernetes monitoring tools that add visibility without complexity while also helping you +actively troubleshoot anomalies or outages. This guide walks you through each of the visualizations and offers best +practices on how to use them to start Kubernetes monitoring in a matter of minutes, not hours or days. + +Netdata's Kubernetes monitoring solution uses a handful of [complementary tools and +collectors](#related-reference-documentation) for peeling back the many complex layers of a Kubernetes cluster, +_entirely for free_. These methods work together to give you every metric you need to troubleshoot performance or +availability issues across your Kubernetes infrastructure. + +## Challenge + +While Kubernetes (k8s) might simplify the way you deploy, scale, and load-balance your applications, not all clusters +come with "batteries included" when it comes to monitoring. Doubly so for a monitoring stack that helps you actively +troubleshoot issues with your cluster. + +Some k8s providers, like GKE (Google Kubernetes Engine), do deploy clusters bundled with monitoring capabilities, such +as Google Stackdriver Monitoring. However, these pre-configured solutions might not offer the depth of metrics, +customization, or integration with your preferred alerting methods. + +Without this visibility, it's like you built an entire house and _then_ smashed your way through the finished walls to +add windows. + +## Solution + +In this tutorial, you'll learn how to navigate Netdata's Kubernetes monitoring features, using +[robot-shop](https://github.com/instana/robot-shop) as an example deployment. Deploying robot-shop is purely optional. +You can also follow along with your own Kubernetes deployment if you choose. While the metrics might be different, the +navigation and best practices are the same for every cluster. + +## What you need to get started + +To follow this tutorial, you need: + +- A free Netdata Cloud account. [Sign up](https://app.netdata.cloud/sign-up?cloudRoute=/spaces) if you don't have one + already. +- A working cluster running Kubernetes v1.9 or newer, with a Netdata deployment and connected parent/child nodes. See + our [Kubernetes deployment process](https://github.com/netdata/netdata/blob/master/packaging/installer/methods/kubernetes.md) for details on deployment and + conneting to Cloud. +- The [`kubectl`](https://kubernetes.io/docs/reference/kubectl/overview/) command line tool, within [one minor version + difference](https://kubernetes.io/docs/tasks/tools/install-kubectl/#before-you-begin) of your cluster, on an + administrative system. +- The [Helm package manager](https://helm.sh/) v3.0.0 or newer on the same administrative system. + +### Install the `robot-shop` demo (optional) + +Begin by downloading the robot-shop code and using `helm` to create a new deployment. + +```bash +git clone git@github.com:instana/robot-shop.git +cd robot-shop/K8s/helm +kubectl create ns robot-shop +helm install robot-shop --namespace robot-shop . +``` + +Running `kubectl get pods` shows both the Netdata and robot-shop deployments. + +```bash +kubectl get pods --all-namespaces +NAMESPACE NAME READY STATUS RESTARTS AGE +default netdata-child-29f9c 2/2 Running 0 10m +default netdata-child-8xphf 2/2 Running 0 10m +default netdata-child-jdvds 2/2 Running 0 11m +default netdata-parent-554c755b7d-qzrx4 1/1 Running 0 11m +kube-system aws-node-jnjv8 1/1 Running 0 17m +kube-system aws-node-svzdb 1/1 Running 0 17m +kube-system aws-node-ts6n2 1/1 Running 0 17m +kube-system coredns-559b5db75d-f58hp 1/1 Running 0 22h +kube-system coredns-559b5db75d-tkzj2 1/1 Running 0 22h +kube-system kube-proxy-9p9cd 1/1 Running 0 17m +kube-system kube-proxy-lt9ss 1/1 Running 0 17m +kube-system kube-proxy-n75t9 1/1 Running 0 17m +robot-shop cart-b4bbc8fff-t57js 1/1 Running 0 14m +robot-shop catalogue-8b5f66c98-mr85z 1/1 Running 0 14m +robot-shop dispatch-67d955c7d8-lnr44 1/1 Running 0 14m +robot-shop mongodb-7f65d86c-dsslc 1/1 Running 0 14m +robot-shop mysql-764c4c5fc7-kkbnf 1/1 Running 0 14m +robot-shop payment-67c87cb7d-5krxv 1/1 Running 0 14m +robot-shop rabbitmq-5bb66bb6c9-6xr5b 1/1 Running 0 14m +robot-shop ratings-94fd9c75b-42wvh 1/1 Running 0 14m +robot-shop redis-0 0/1 Pending 0 14m +robot-shop shipping-7d69cb88b-w7hpj 1/1 Running 0 14m +robot-shop user-79c445b44b-hwnm9 1/1 Running 0 14m +robot-shop web-8bb887476-lkcjx 1/1 Running 0 14m +``` + +## Explore Netdata's Kubernetes monitoring charts + +The Netdata Helm chart deploys and enables everything you need for monitoring Kubernetes on every layer. Once you deploy +Netdata and connect your cluster's nodes, you're ready to check out the visualizations **with zero configuration**. + +To get started, [sign in](https://app.netdata.cloud/sign-in?cloudRoute=/spaces) to your Netdata Cloud account. Head over +to the War Room you connected your cluster to, if not **General**. + +Netdata Cloud is already visualizing your Kubernetes metrics, streamed in real-time from each node, in the +[Overview](https://github.com/netdata/netdata/blob/master/docs/cloud/visualize/overview.md): + +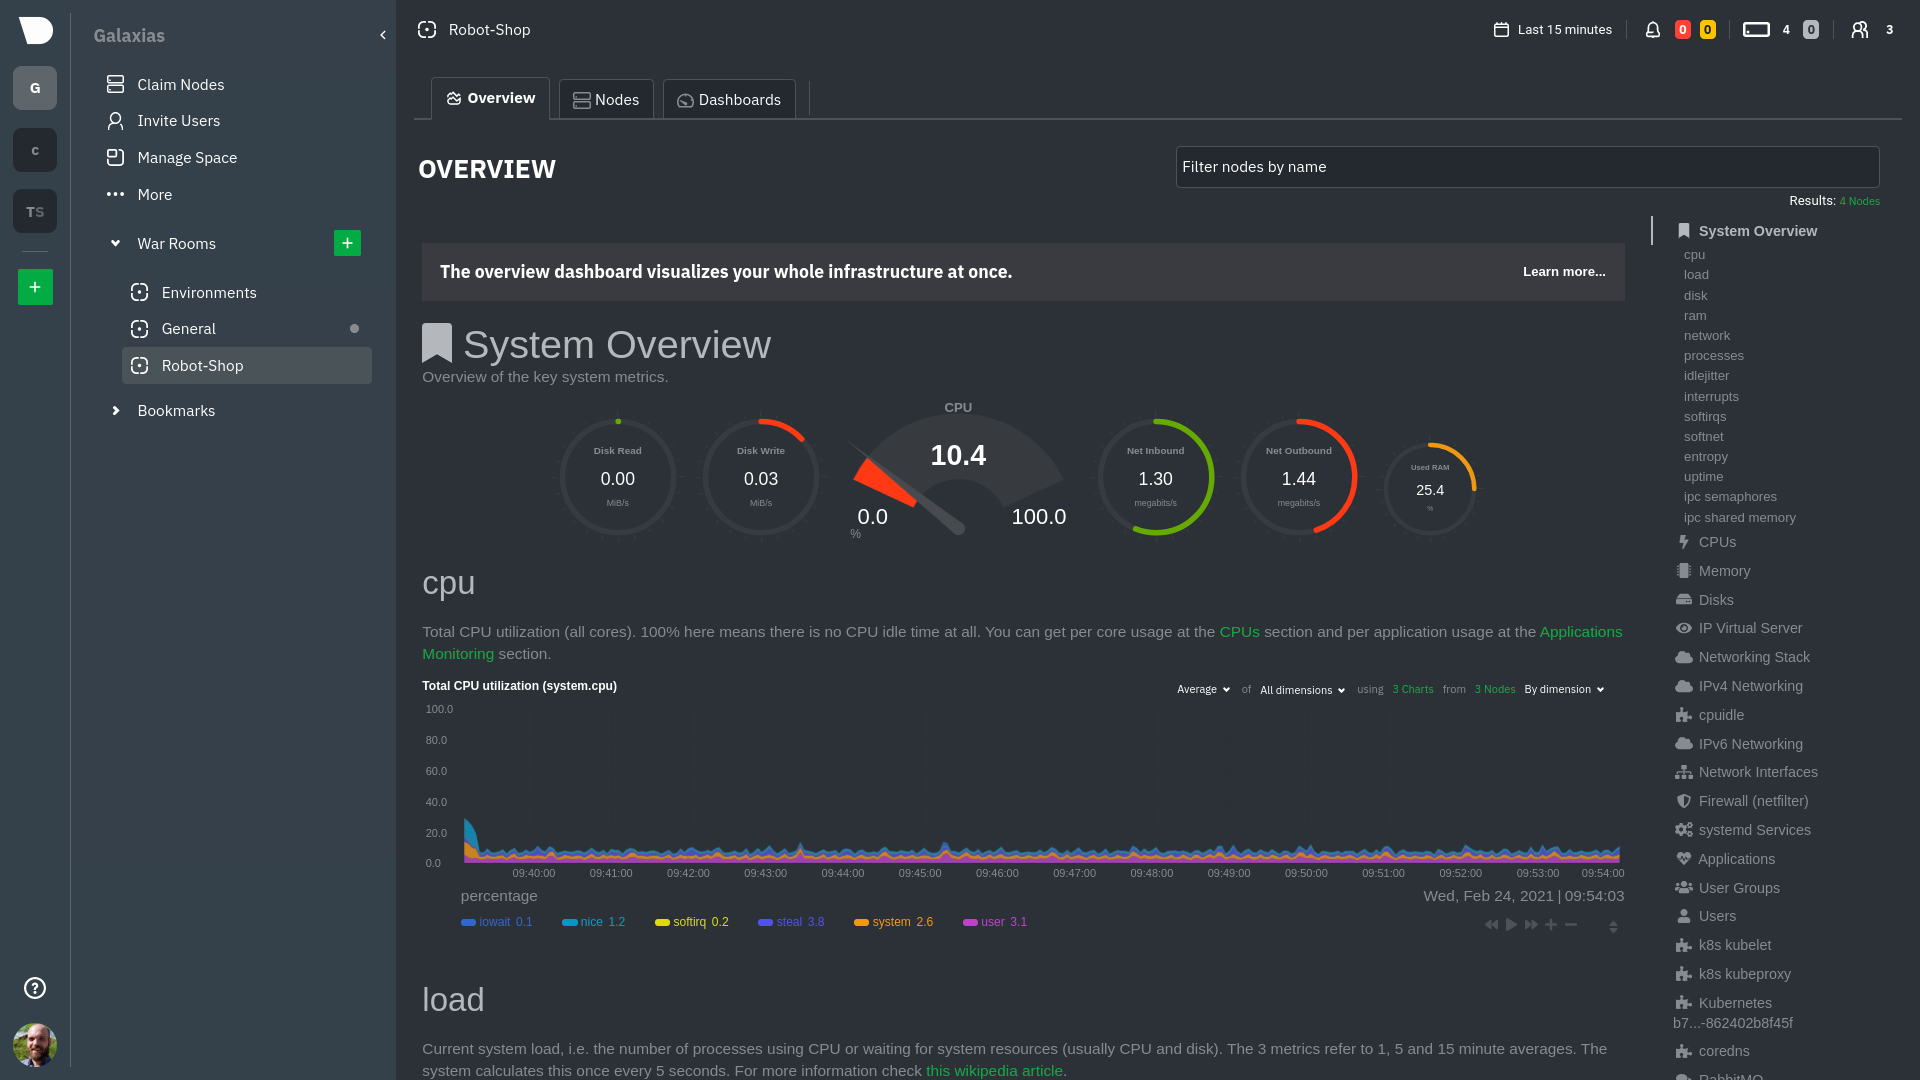 + +Let's walk through monitoring each layer of a Kubernetes cluster using the Overview as our framework. + +## Cluster and node metrics + +The gauges and time-series charts you see right away in the Overview show aggregated metrics from every node in your +cluster. + +For example, the `apps.cpu` chart (in the **Applications** menu item), visualizes the CPU utilization of various +applications/services running on each of the nodes in your cluster. The **X Nodes** dropdown shows which nodes +contribute to the chart and links to jump a single-node dashboard for further investigation. + +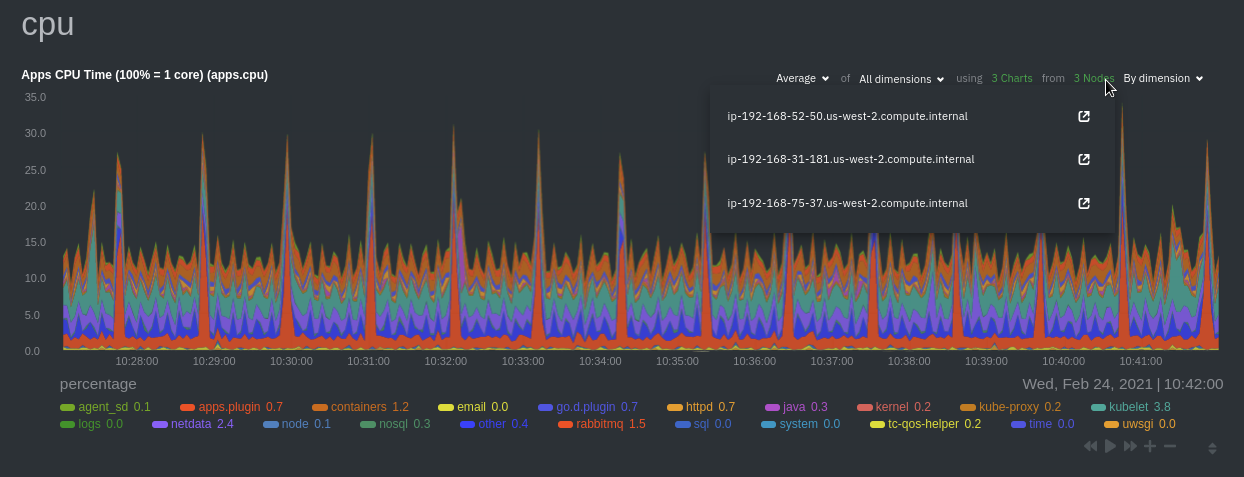 + +For example, the chart above shows a spike in the CPU utilization from `rabbitmq` every minute or so, along with a +baseline CPU utilization of 10-15% across the cluster. + +Read about the [Overview](https://github.com/netdata/netdata/blob/master/docs/cloud/visualize/overview.md) and some best practices on [viewing +an overview of your infrastructure](https://github.com/netdata/netdata/blob/master/docs/visualize/overview-infrastructure.md) for details on using composite charts to +drill down into per-node performance metrics. + +## Pod and container metrics + +Click on the **Kubernetes xxxxxxx...** section to jump down to Netdata Cloud's unique Kubernetes visualizations for view +real-time resource utilization metrics from your Kubernetes pods and containers. + +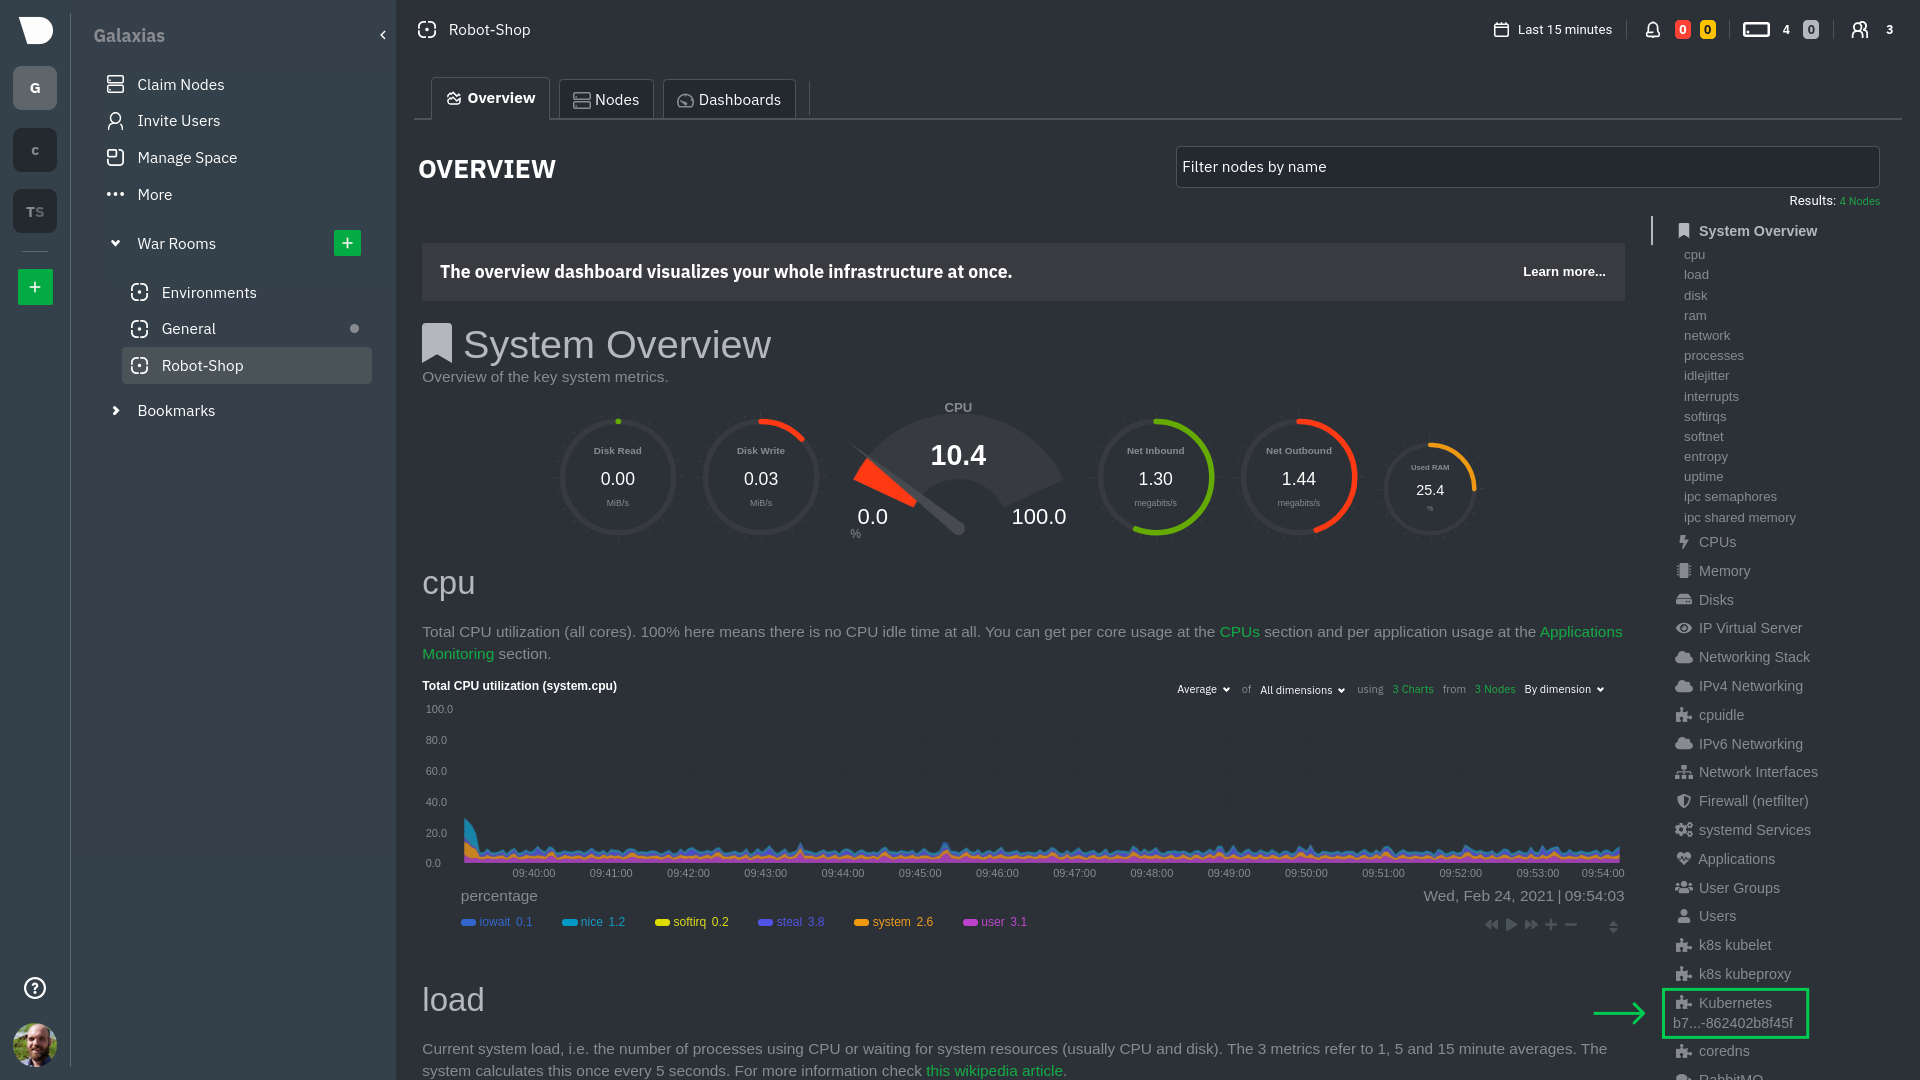 + +### Health map + +The first visualization is the [health map](https://github.com/netdata/netdata/blob/master/docs/cloud/visualize/kubernetes.md#health-map), +which places each container into its own box, then varies the intensity of their color to visualize the resource +utilization. By default, the health map shows the **average CPU utilization as a percentage of the configured limit** +for every container in your cluster. + +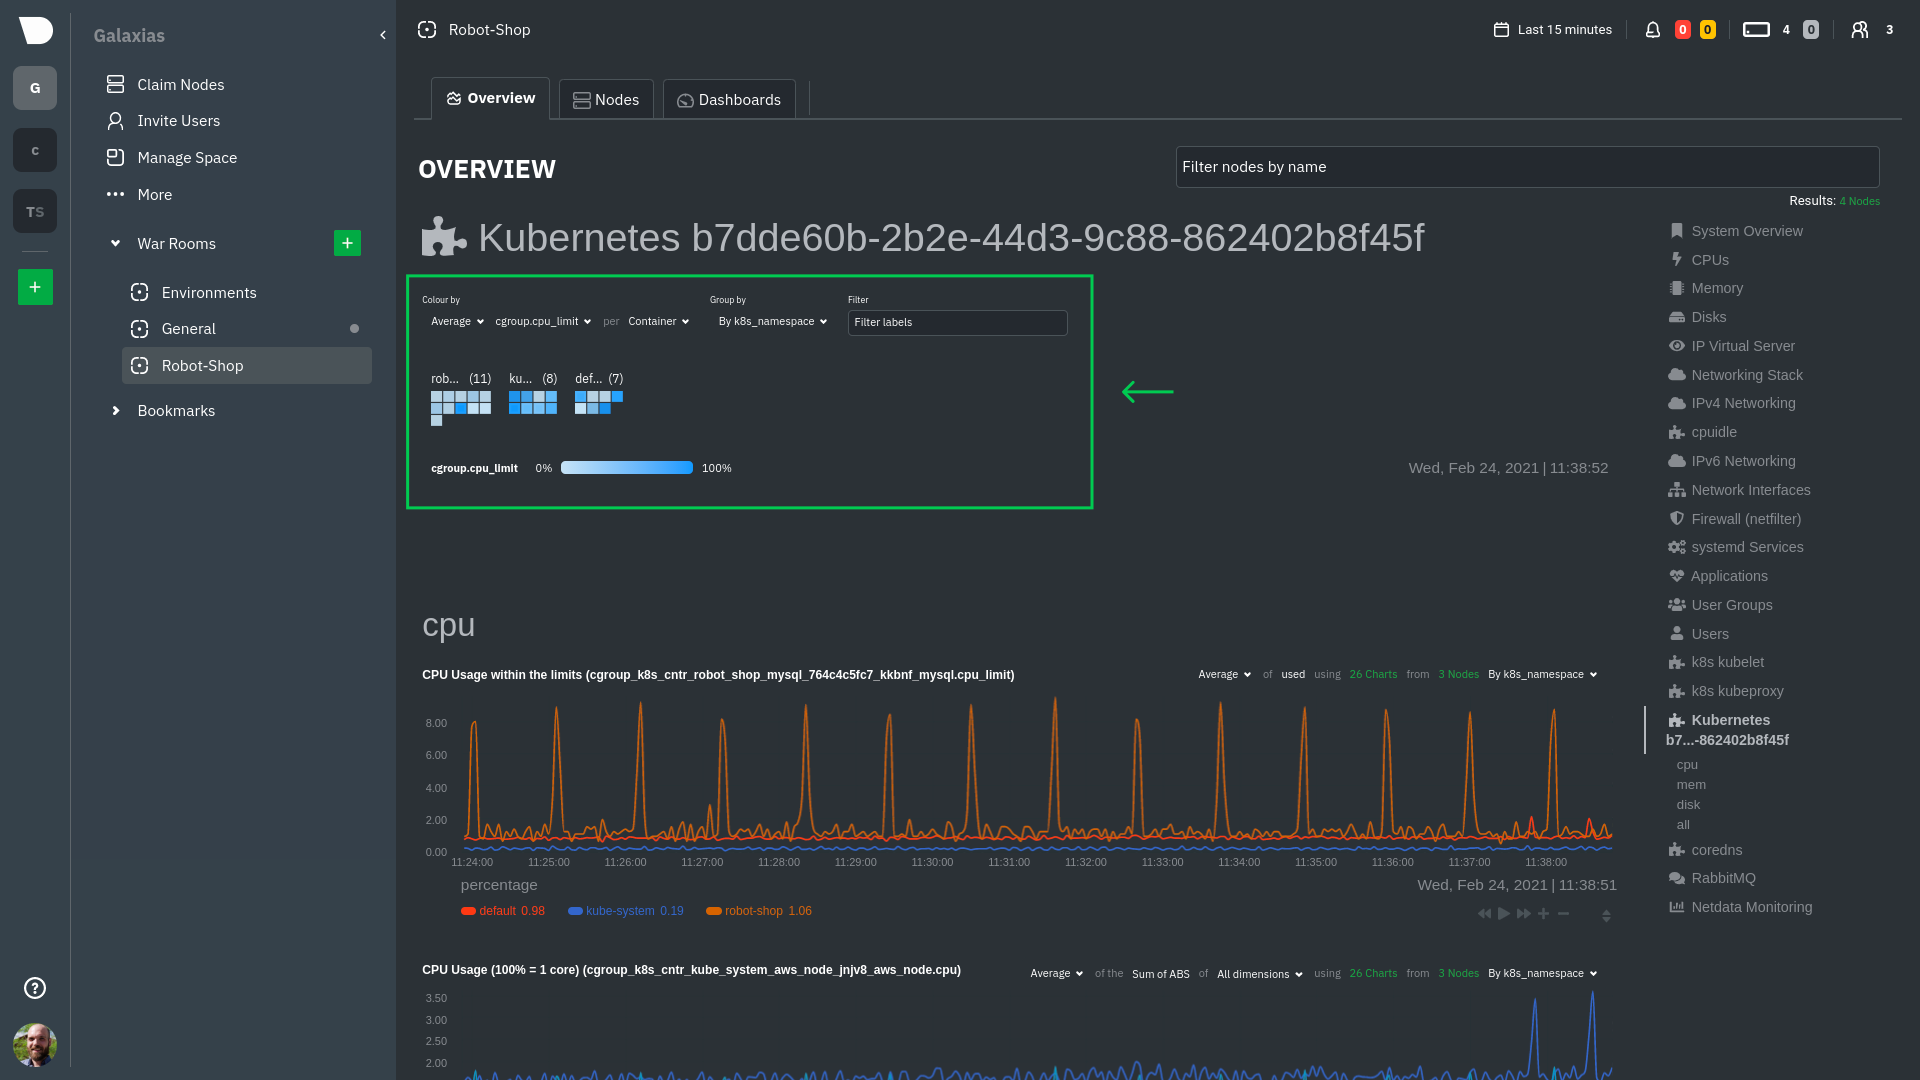 + +Let's explore the most colorful box by hovering over it. + +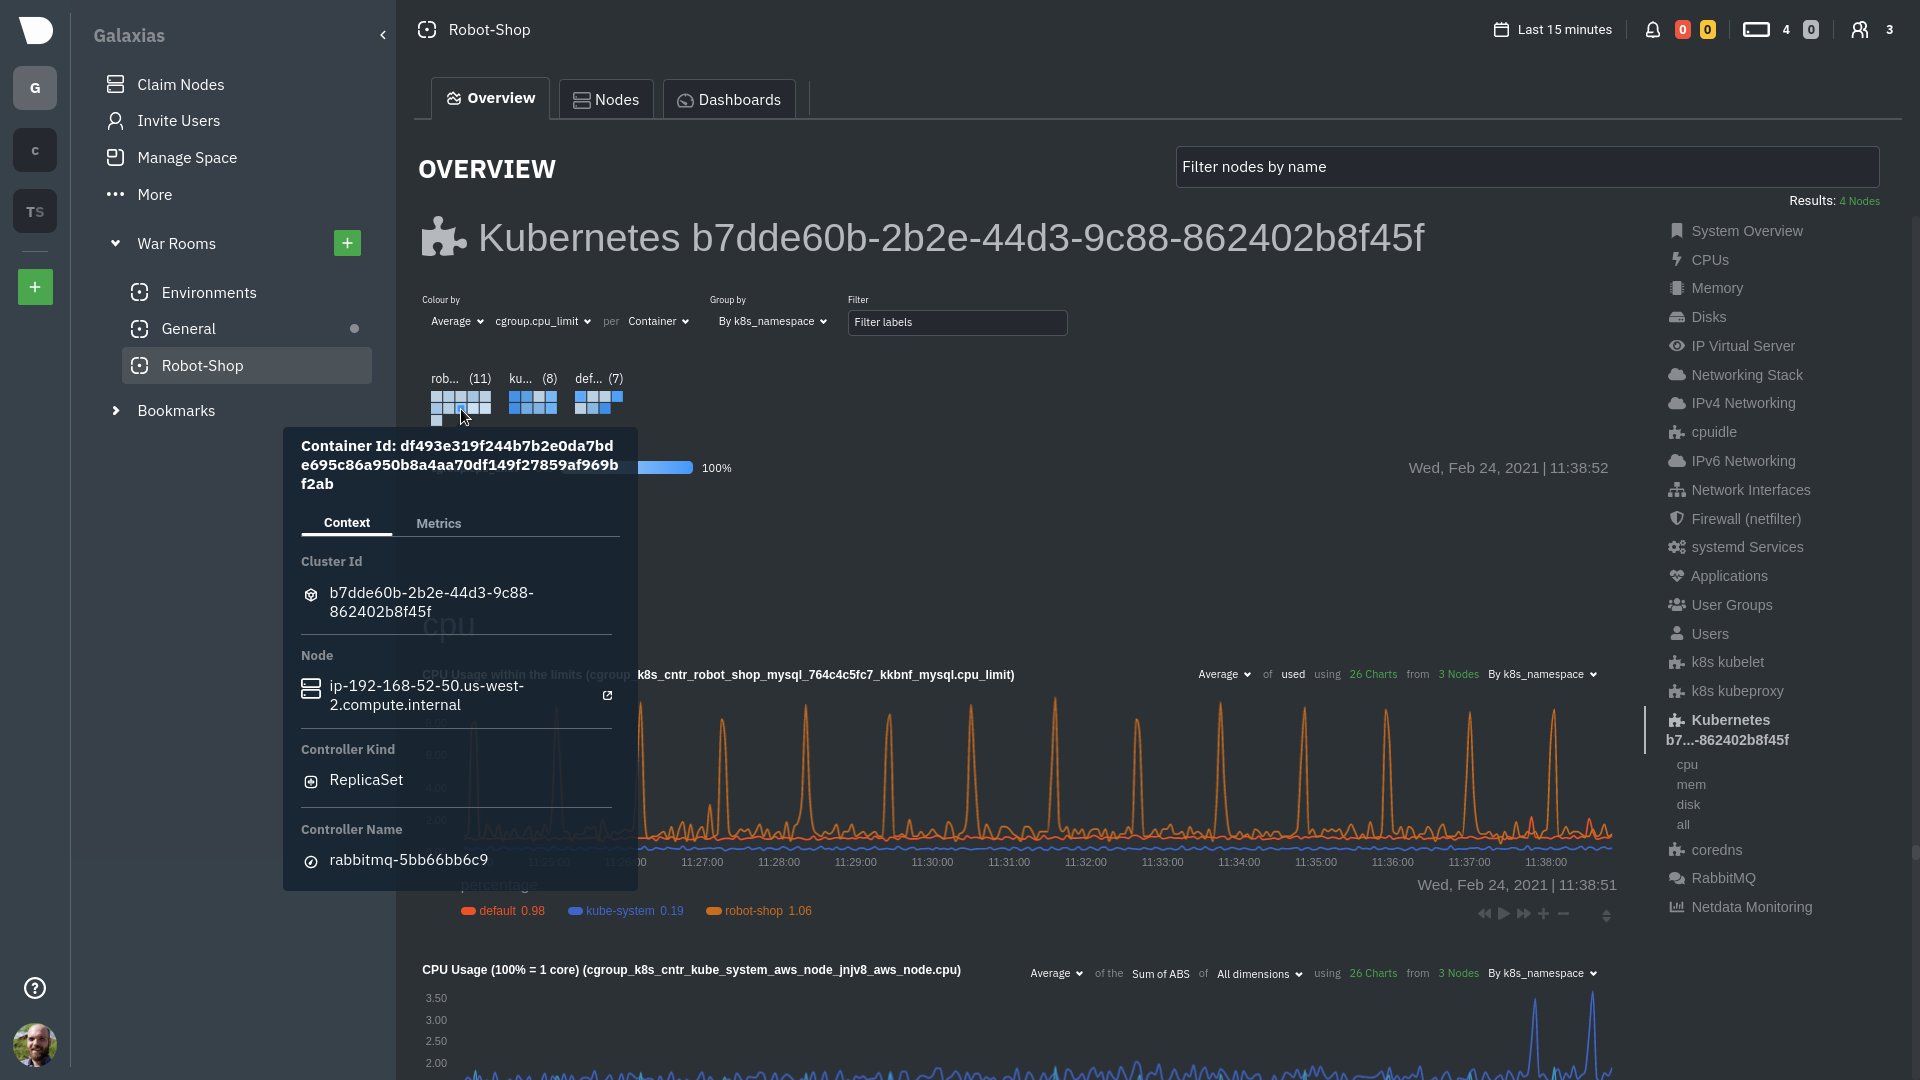 + +The **Context** tab shows `rabbitmq-5bb66bb6c9-6xr5b` as the container's image name, which means this container is +running a [RabbitMQ](https://github.com/netdata/go.d.plugin/blob/master/modules/rabbitmq/README.md) workload. + +Click the **Metrics** tab to see real-time metrics from that container. Unsurprisingly, it shows a spike in CPU +utilization at regular intervals. + +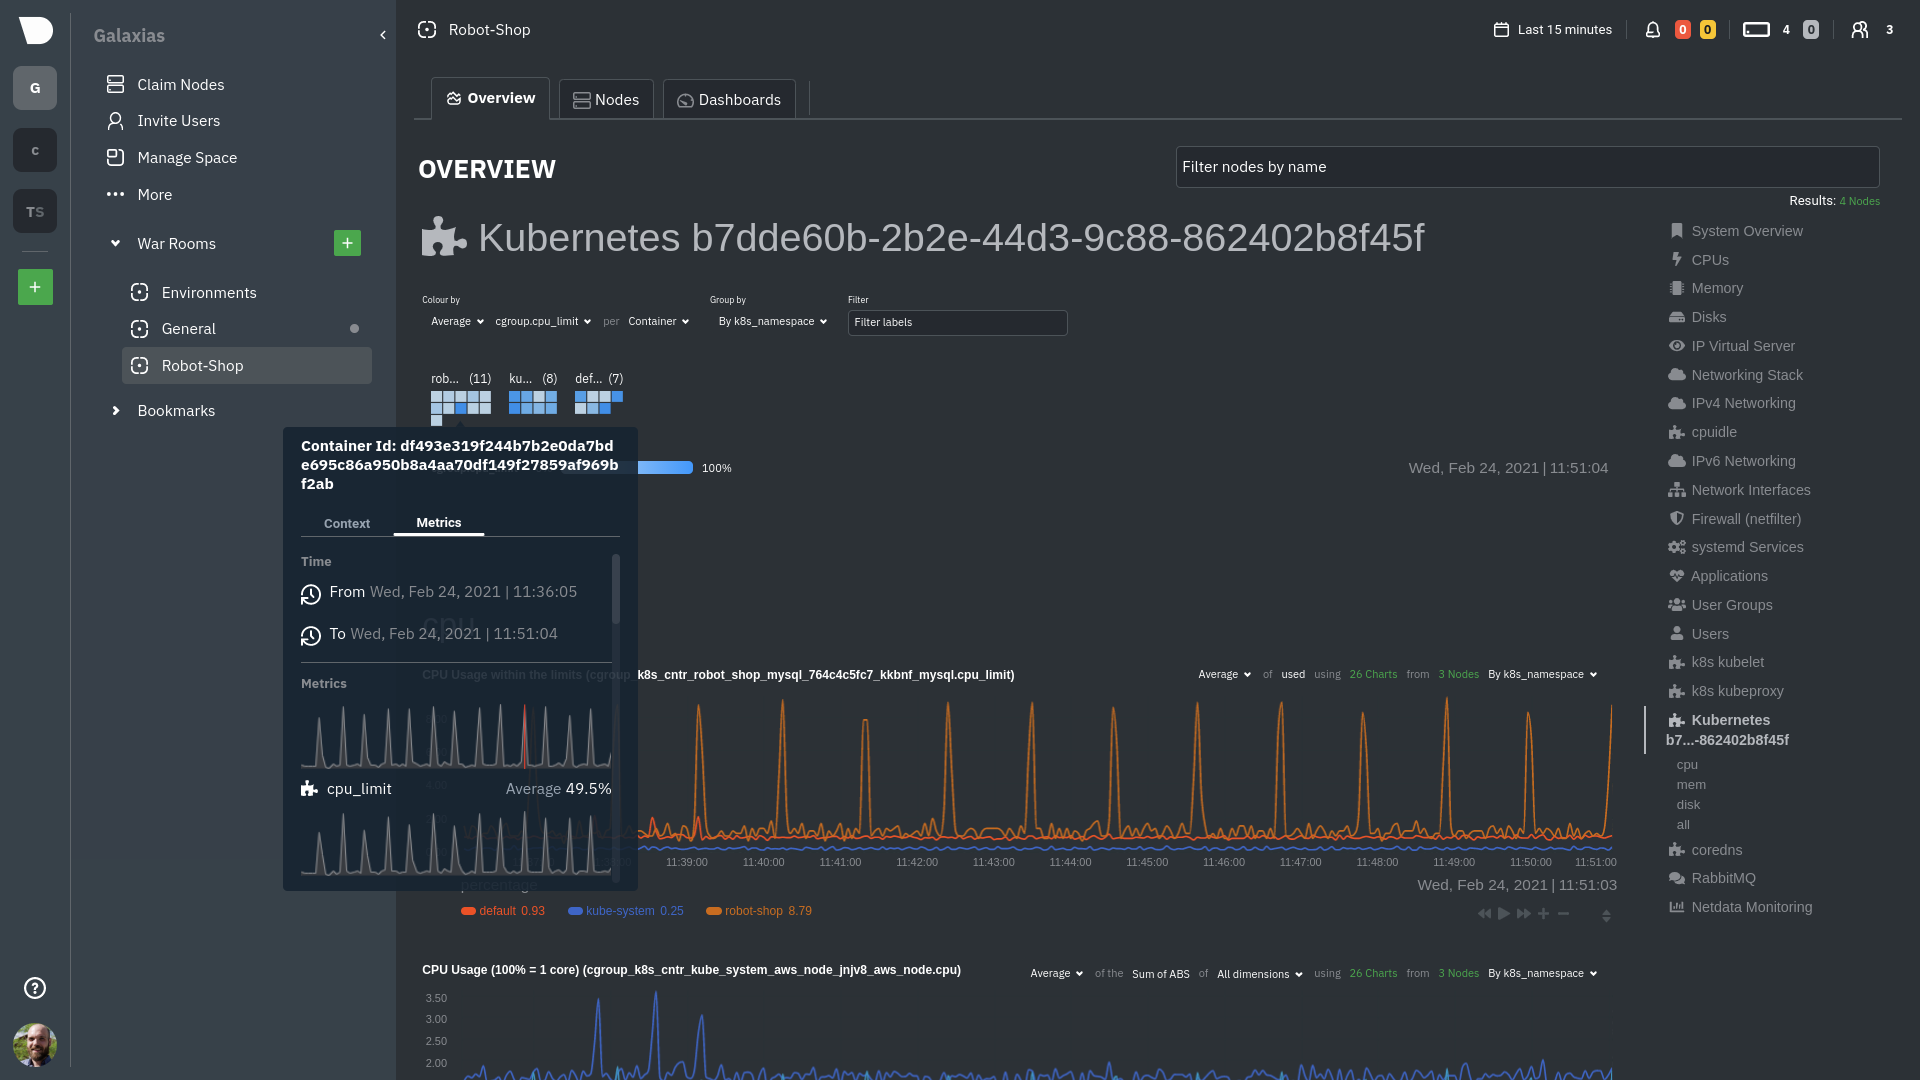 + +### Time-series charts + +Beneath the health map is a variety of time-series charts that help you visualize resource utilization over time, which +is useful for targeted troubleshooting. + +The default is to display metrics grouped by the `k8s_namespace` label, which shows resource utilization based on your +different namespaces. + + + +Each composite chart has a [definition bar](https://github.com/netdata/netdata/blob/master/docs/cloud/visualize/overview.md#definition-bar) +for complete customization. For example, grouping the top chart by `k8s_container_name` reveals new information. + + + +## Service metrics + +Netdata has a [service discovery plugin](https://github.com/netdata/agent-service-discovery), which discovers and +creates configuration files for [compatible +services](https://github.com/netdata/helmchart#service-discovery-and-supported-services) and any endpoints covered by +our [generic Prometheus collector](https://github.com/netdata/go.d.plugin/blob/master/modules/prometheus/README.md). +Netdata uses these files to collect metrics from any compatible application as they run _inside_ of a pod. Service +discovery happens without manual intervention as pods are created, destroyed, or moved between nodes. + +Service metrics show up on the Overview as well, beneath the **Kubernetes** section, and are labeled according to the +service in question. For example, the **RabbitMQ** section has numerous charts from the [`rabbitmq` +collector](https://github.com/netdata/go.d.plugin/blob/master/modules/rabbitmq/README.md): + + + +> The robot-shop cluster has more supported services, such as MySQL, which are not visible with zero configuration. This +> is usually because of services running on non-default ports, using non-default names, or required passwords. Read up +> on [configuring service discovery](https://github.com/netdata/netdata/blob/master/packaging/installer/methods/kubernetes.md#configure-service-discovery) to collect +> more service metrics. + +Service metrics are essential to infrastructure monitoring, as they're the best indicator of the end-user experience, +and key signals for troubleshooting anomalies or issues. + +## Kubernetes components + +Netdata also automatically collects metrics from two essential Kubernetes processes. + +### kubelet + +The **k8s kubelet** section visualizes metrics from the Kubernetes agent responsible for managing every pod on a given +node. This also happens without any configuration thanks to the [kubelet +collector](https://github.com/netdata/go.d.plugin/blob/master/modules/k8s_kubelet/README.md). + +Monitoring each node's kubelet can be invaluable when diagnosing issues with your Kubernetes cluster. For example, you +can see if the number of running containers/pods has dropped, which could signal a fault or crash in a particular +Kubernetes service or deployment (see `kubectl get services` or `kubectl get deployments` for more details). If the +number of pods increases, it may be because of something more benign, like another team member scaling up a +service with `kubectl scale`. + +You can also view charts for the Kubelet API server, the volume of runtime/Docker operations by type, +configuration-related errors, and the actual vs. desired numbers of volumes, plus a lot more. + +### kube-proxy + +The **k8s kube-proxy** section displays metrics about the network proxy that runs on each node in your Kubernetes +cluster. kube-proxy lets pods communicate with each other and accept sessions from outside your cluster. Its metrics are +collected by the [kube-proxy +collector](https://github.com/netdata/go.d.plugin/blob/master/modules/k8s_kubeproxy/README.md). + +With Netdata, you can monitor how often your k8s proxies are syncing proxy rules between nodes. Dramatic changes in +these figures could indicate an anomaly in your cluster that's worthy of further investigation. + +## What's next? + +After reading this guide, you should now be able to monitor any Kubernetes cluster with Netdata, including nodes, pods, +containers, services, and more. + +With the health map, time-series charts, and the ability to drill down into individual nodes, you can see hundreds of +per-second metrics with zero configuration and less time remembering all the `kubectl` options. Netdata moves with your +cluster, automatically picking up new nodes or services as your infrastructure scales. And it's entirely free for +clusters of all sizes. + +### Related reference documentation + +- [Netdata Helm chart](https://github.com/netdata/helmchart) +- [Netdata service discovery](https://github.com/netdata/agent-service-discovery) +- [Netdata Agent · `kubelet` + collector](https://github.com/netdata/go.d.plugin/blob/master/modules/k8s_kubelet/README.md) +- [Netdata Agent · `kube-proxy` + collector](https://github.com/netdata/go.d.plugin/blob/master/modules/k8s_kubeproxy/README.md) +- [Netdata Agent · `cgroups.plugin`](https://github.com/netdata/netdata/blob/master/collectors/cgroups.plugin/README.md) + + diff --git a/docs/guides/monitor/lamp-stack.md b/docs/guides/monitor/lamp-stack.md new file mode 100644 index 00000000..2289c71c --- /dev/null +++ b/docs/guides/monitor/lamp-stack.md @@ -0,0 +1,238 @@ +import { OneLineInstallWget } from '@site/src/components/OneLineInstall/' + +# LAMP stack monitoring with Netdata + +Set up robust LAMP stack monitoring (Linux, Apache, MySQL, PHP) in a few minutes using Netdata. + +The LAMP stack is the "hello world" for deploying dynamic web applications. It's fast, flexible, and reliable, which +means a developer or sysadmin won't go far in their career without interacting with the stack and its services. + +_LAMP_ is an acronym of the core services that make up the web application: **L**inux, **A**pache, **M**ySQL, and +**P**HP. + +- [Linux](https://en.wikipedia.org/wiki/Linux) is the operating system running the whole stack. +- [Apache](https://httpd.apache.org/) is a web server that responds to HTTP requests from users and returns web pages. +- [MySQL](https://www.mysql.com/) is a database that stores and returns information based on queries from the web + application. +- [PHP](https://www.php.net/) is a scripting language used to query the MySQL database and build new pages. + +LAMP stacks are the foundation for tons of end-user applications, with [Wordpress](https://wordpress.org/) being the +most popular. + +## Challenge + +You've already deployed a LAMP stack, either in testing or production. You want to monitor every service's performance +and availability to ensure the best possible experience for your end-users. You might also be particularly interested in +using a free, open-source monitoring tool. + +Depending on your monitoring experience, you may not even know what metrics you're looking for, much less how to build +dashboards using a query language. You need a robust monitoring experience that has the metrics you need without a ton +of required setup. + +## Solution + +In this tutorial, you'll set up robust LAMP stack monitoring with Netdata in just a few minutes. When you're done, +you'll have one dashboard to monitor every part of your web application, including each essential LAMP stack service. + +This dashboard updates every second with new metrics, and pairs those metrics up with preconfigured alerts to keep you +informed of any errors or odd behavior. + +## What you need to get started + +To follow this tutorial, you need: + +- A physical or virtual Linux system, which we'll call a _node_. +- A functional LAMP stack. There's plenty of tutorials for installing a LAMP stack, like [this + one](https://www.digitalocean.com/community/tutorials/how-to-install-linux-apache-mysql-php-lamp-stack-ubuntu-18-04) + from Digital Ocean. +- Optionally, a [Netdata Cloud](https://app.netdata.cloud/sign-up?cloudRoute=/spaces) account, which you can use to view + metrics from multiple nodes in one dashboard, and a whole lot more, for free. + +## Install the Netdata Agent + +If you don't have the free, open-source Netdata monitoring agent installed on your node yet, get started with a [single +kickstart command](https://github.com/netdata/netdata/blob/master/packaging/installer/README.md): + +<OneLineInstallWget/> + +The Netdata Agent is now collecting metrics from your node every second. You don't need to jump into the dashboard yet, +but if you're curious, open your favorite browser and navigate to `http://localhost:19999` or `http://NODE:19999`, +replacing `NODE` with the hostname or IP address of your system. + +## Enable hardware and Linux system monitoring + +There's nothing you need to do to enable [system monitoring](https://github.com/netdata/netdata/blob/master/docs/collect/system-metrics.md) and Linux monitoring with +the Netdata Agent, which autodetects metrics from CPUs, memory, disks, networking devices, and Linux processes like +systemd without any configuration. If you're using containers, Netdata automatically collects resource utilization +metrics from each using the [cgroups data collector](https://github.com/netdata/netdata/blob/master/collectors/cgroups.plugin/README.md). + +## Enable Apache monitoring + +Let's begin by configuring Apache to work with Netdata's [Apache data +collector](https://github.com/netdata/go.d.plugin/blob/master/modules/apache/README.md). + +Actually, there's nothing for you to do to enable Apache monitoring with Netdata. + +Apache comes with `mod_status` enabled by default these days, and Netdata is smart enough to look for metrics at that +endpoint without you configuring it. Netdata is already collecting [`mod_status` +metrics](https://httpd.apache.org/docs/2.4/mod/mod_status.html), which is just _part_ of your web server monitoring. + +## Enable web log monitoring + +The Netdata Agent also comes with a [web log +collector](https://github.com/netdata/go.d.plugin/blob/master/modules/weblog/README.md), which reads Apache's access +log file, processes each line, and converts them into per-second metrics. On Debian systems, it reads the file at +`/var/log/apache2/access.log`. + +At installation, the Netdata Agent adds itself to the [`adm` +group](https://wiki.debian.org/SystemGroups#Groups_without_an_associated_user), which gives the `netdata` process the +right privileges to read Apache's log files. In other words, you don't need to do anything to enable Apache web log +monitoring. + +## Enable MySQL monitoring + +Because your MySQL database is password-protected, you do need to tell MySQL to allow the `netdata` user to connect to +without a password. Netdata's [MySQL data +collector](https://github.com/netdata/go.d.plugin/blob/master/modules/mysql/README.md) collects metrics in _read-only_ +mode, without being able to alter or affect operations in any way. + +First, log into the MySQL shell. Then, run the following three commands, one at a time: + +```mysql +CREATE USER 'netdata'@'localhost'; +GRANT USAGE, REPLICATION CLIENT, PROCESS ON *.* TO 'netdata'@'localhost'; +FLUSH PRIVILEGES; +``` + +Run `sudo systemctl restart netdata`, or the [appropriate alternative for your +system](https://github.com/netdata/netdata/blob/master/docs/configure/start-stop-restart.md), to collect dozens of metrics every second for robust MySQL monitoring. + +## Enable PHP monitoring + +Unlike Apache or MySQL, PHP isn't a service that you can monitor directly, unless you instrument a PHP-based application +with [StatsD](https://github.com/netdata/netdata/blob/master/collectors/statsd.plugin/README.md). + +However, if you use [PHP-FPM](https://php-fpm.org/) in your LAMP stack, you can monitor that process with our [PHP-FPM +data collector](https://github.com/netdata/go.d.plugin/blob/master/modules/phpfpm/README.md). + +Open your PHP-FPM configuration for editing, replacing `7.4` with your version of PHP: + +```bash +sudo nano /etc/php/7.4/fpm/pool.d/www.conf +``` + +> Not sure what version of PHP you're using? Run `php -v`. + +Find the line that reads `;pm.status_path = /status` and remove the `;` so it looks like this: + +```conf +pm.status_path = /status +``` + +Next, add a new `/status` endpoint to Apache. Open the Apache configuration file you're using for your LAMP stack. + +```bash +sudo nano /etc/apache2/sites-available/your_lamp_stack.conf +``` + +Add the following to the end of the file, again replacing `7.4` with your version of PHP: + +```apache +ProxyPass "/status" "unix:/run/php/php7.4-fpm.sock|fcgi://localhost" +``` + +Save and close the file. Finally, restart the PHP-FPM, Apache, and Netdata processes. + +```bash +sudo systemctl restart php7.4-fpm.service +sudo systemctl restart apache2 +sudo systemctl restart netdata +``` + +As the Netdata Agent starts up again, it automatically connects to the new `127.0.0.1/status` page and collects +per-second PHP-FPM metrics to get you started with PHP monitoring. + +## View LAMP stack metrics + +If the Netdata Agent isn't already open in your browser, open a new tab and navigate to `http://localhost:19999` or +`http://NODE:19999`, replacing `NODE` with the hostname or IP address of your system. + +> If you [signed up](https://app.netdata.cloud/sign-up?cloudRoute=/spaces) for Netdata Cloud earlier, you can also view +> the exact same LAMP stack metrics there, plus additional features, like drag-and-drop custom dashboards. Be sure to +> [connecting your node](https://github.com/netdata/netdata/blob/master/claim/README.md) to start streaming metrics to your browser through Netdata Cloud. + +Netdata automatically organizes all metrics and charts onto a single page for easy navigation. Peek at gauges to see +overall system performance, then scroll down to see more. Click-and-drag with your mouse to pan _all_ charts back and +forth through different time intervals, or hold `SHIFT` and use the scrollwheel (or two-finger scroll) to zoom in and +out. Check out our doc on [interacting with charts](https://github.com/netdata/netdata/blob/master/docs/cloud/visualize/interact-new-charts.md) for all the details. + + + +The **System Overview** section, which you can also see in the right-hand menu, contains key hardware monitoring charts, +including CPU utilization, memory page faults, network monitoring, and much more. The **Applications** section shows you +exactly which Linux processes are using the most system resources. + +Next, let's check out LAMP-specific metrics. You should see four relevant sections: **Apache local**, **MySQL local**, +**PHP-FPM local**, and **web log apache**. Click on any of these to see metrics from each service in your LAMP stack. + +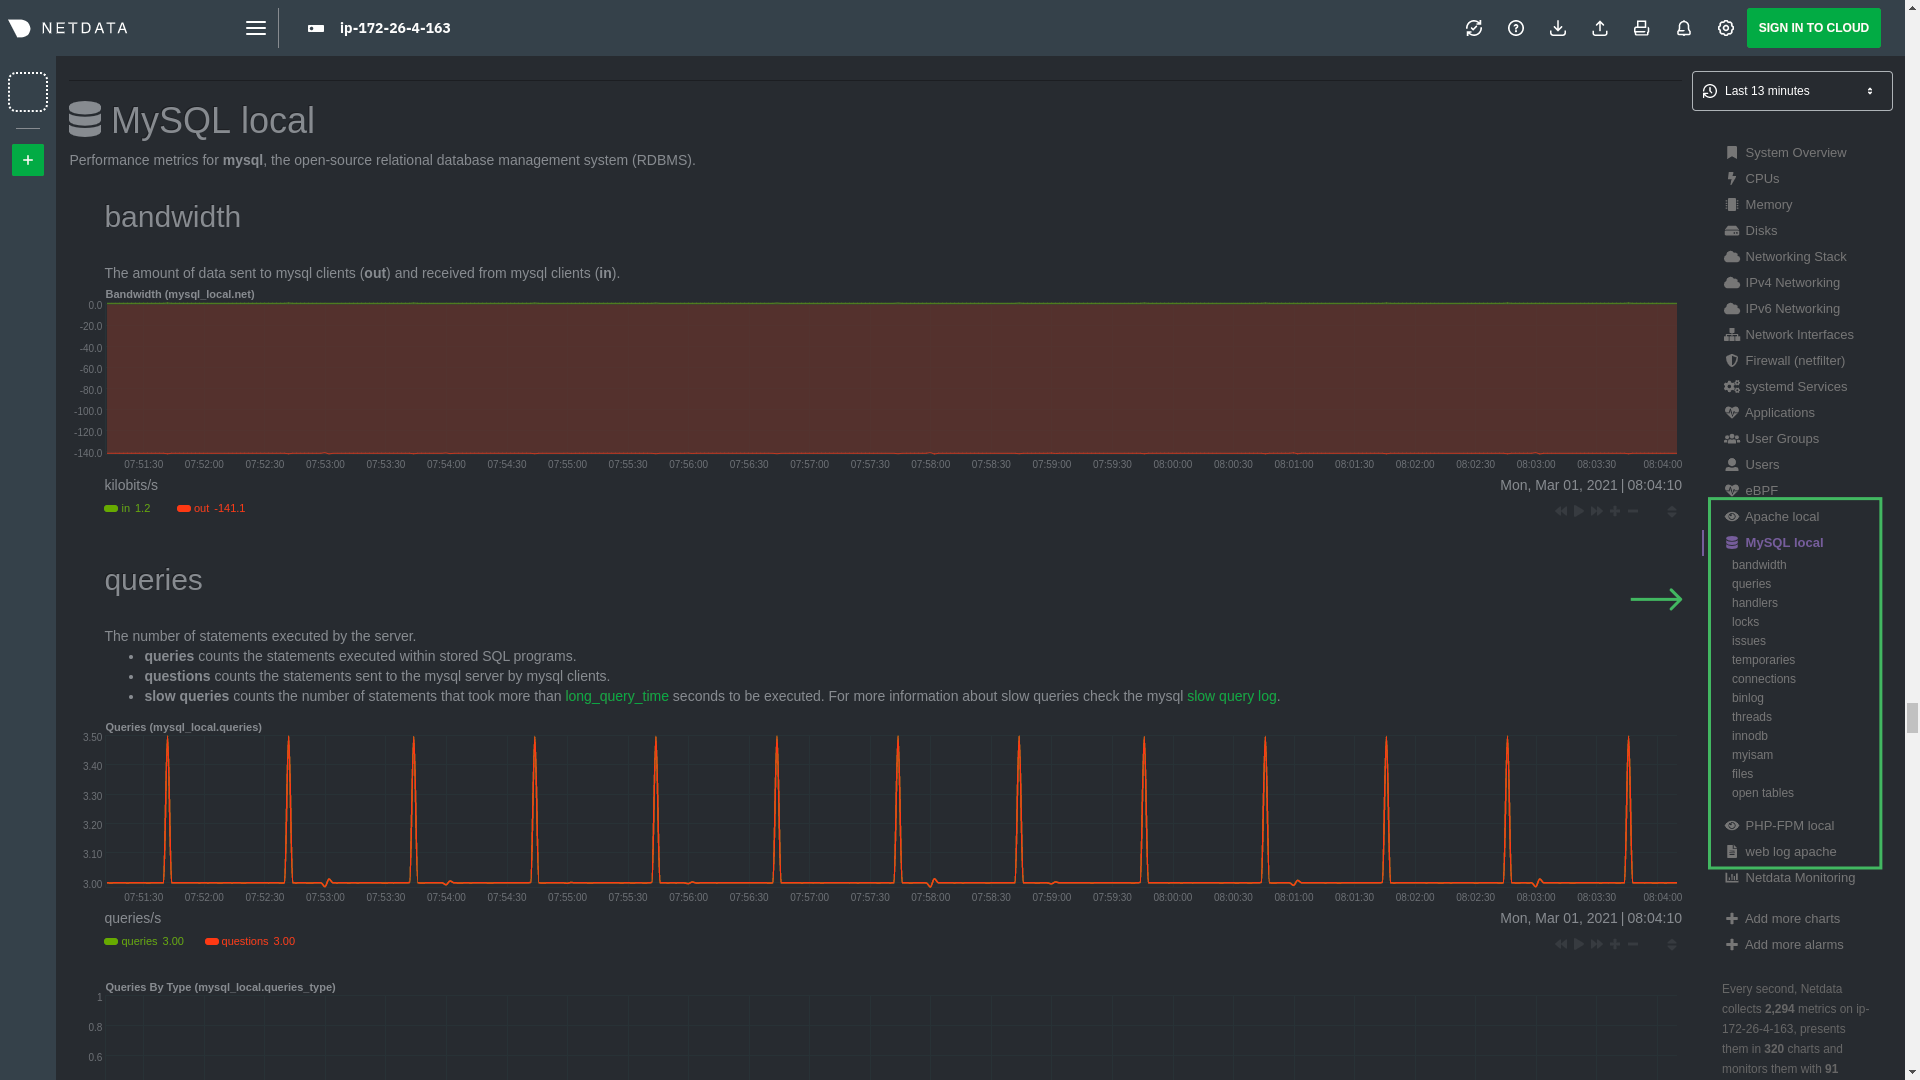 + +### Key LAMP stack monitoring charts + +Here's a quick reference for what charts you might want to focus on after setting up Netdata. + +| Chart name / context | Type | Why? | +|-------------------------------------------------------|---------------------|-----------------------------------------------------------------------------------------------------------------------------------------------------------------------------------------------------------------| +| System Load Average (`system.load`) | Hardware monitoring | A good baseline load average is `0.7`, while `1` (on a 1-core system, `2` on a 2-core system, and so on) means resources are "perfectly" utilized. Higher load indicates a bottleneck somewhere in your system. | +| System RAM (`system.ram`) | Hardware monitoring | Look at the `free` dimension. If that drops to `0`, your system will use swap memory and slow down. | +| Uptime (`apache_local.uptime`) | Apache monitoring | This chart should always be "climbing," indicating a continuous uptime. Investigate any drops back to `0`. | +| Requests By Type (`web_log_apache.requests_by_type`) | Apache monitoring | Check for increases in the `error` or `bad` dimensions, which could indicate users arriving at broken pages or PHP returning errors. | +| Queries (`mysql_local.queries`) | MySQL monitoring | Queries is the total number of queries (queries per second, QPS). Check this chart for sudden spikes or drops, which indicate either increases in traffic/demand or bottlenecks in hardware performance. | +| Active Connections (`mysql_local.connections_active`) | MySQL monitoring | If the `active` dimension nears the `limit`, your MySQL database will bottleneck responses. | +| Performance (phpfpm_local.performance) | PHP monitoring | The `slow requests` dimension lets you know if any requests exceed the configured `request_slowlog_timeout`. If so, users might be having a less-than-ideal experience. | + +## Get alerts for LAMP stack errors + +The Netdata Agent comes with hundreds of pre-configured alerts to help you keep tabs on your system, including 19 alerts +designed for smarter LAMP stack monitoring. + +Click the 🔔 icon in the top navigation to [see active alerts](https://github.com/netdata/netdata/blob/master/docs/monitor/view-active-alerts.md). The **Active** tabs +shows any alerts currently triggered, while the **All** tab displays a list of _every_ pre-configured alert. The + + + +[Tweak alerts](https://github.com/netdata/netdata/blob/master/health/REFERENCE.md) based on your infrastructure monitoring needs, and to see these alerts +in other places, like your inbox or a Slack channel, [enable a notification +method](https://github.com/netdata/netdata/blob/master/docs/monitor/enable-notifications.md). + +## What's next? + +You've now set up robust monitoring for your entire LAMP stack: Linux, Apache, MySQL, and PHP (-FPM, to be exact). These +metrics will help you keep tabs on the performance and availability of your web application and all its essential +services. The per-second metrics granularity means you have the most accurate information possible for troubleshooting +any LAMP-related issues. + +Another powerful way to monitor the availability of a LAMP stack is the [`httpcheck` +collector](https://github.com/netdata/go.d.plugin/blob/master/modules/httpcheck/README.md), which pings a web server at +a regular interval and tells you whether if and how quickly it's responding. The `response_match` option also lets you +monitor when the web server's response isn't what you expect it to be, which might happen if PHP-FPM crashes, for +example. + +The best way to use the `httpcheck` collector is from a separate node from the one running your LAMP stack, which is why +we're not covering it here, but it _does_ work in a single-node setup. Just don't expect it to tell you if your whole +node crashed. + +If you're planning on managing more than one node, or want to take advantage of advanced features, like finding the +source of issues faster with [Metric Correlations](https://github.com/netdata/netdata/blob/master/docs/cloud/insights/metric-correlations.md), +[sign up](https://app.netdata.cloud/sign-up?cloudRoute=/spaces) for a free Netdata Cloud account. + +### Related reference documentation + +- [Netdata Agent · Get started](https://github.com/netdata/netdata/blob/master/packaging/installer/README.md) +- [Netdata Agent · Apache data collector](https://github.com/netdata/go.d.plugin/blob/master/modules/apache/README.md) +- [Netdata Agent · Web log collector](https://github.com/netdata/go.d.plugin/blob/master/modules/weblog/README.md) +- [Netdata Agent · MySQL data collector](https://github.com/netdata/go.d.plugin/blob/master/modules/mysql/README.md) +- [Netdata Agent · PHP-FPM data collector](https://github.com/netdata/go.d.plugin/blob/master/modules/phpfpm/README.md) + diff --git a/docs/guides/monitor/pi-hole-raspberry-pi.md b/docs/guides/monitor/pi-hole-raspberry-pi.md new file mode 100644 index 00000000..4f0ff4cd --- /dev/null +++ b/docs/guides/monitor/pi-hole-raspberry-pi.md @@ -0,0 +1,142 @@ +<!-- +title: "Monitor Pi-hole (and a Raspberry Pi) with Netdata" +sidebar_label: "Monitor Pi-hole (and a Raspberry Pi) with Netdata" +description: "Monitor Pi-hole metrics, plus Raspberry Pi system metrics, in minutes and completely for free with Netdata's open-source monitoring agent." +image: /img/seo/guides/monitor/netdata-pi-hole-raspberry-pi.png +custom_edit_url: https://github.com/netdata/netdata/edit/master/docs/guides/monitor/pi-hole-raspberry-pi.md +learn_status: "Published" +learn_rel_path: "Miscellaneous" +--> + +# Monitor Pi-hole (and a Raspberry Pi) with Netdata + +import { OneLineInstallWget } from '@site/src/components/OneLineInstall/' + +Between intrusive ads, invasive trackers, and vicious malware, many techies and homelab enthusiasts are advancing their +networks' security and speed with a tiny computer and a powerful piece of software: [Pi-hole](https://pi-hole.net/). + +Pi-hole is a DNS sinkhole that prevents unwanted content from even reaching devices on your home network. It blocks ads +and malware at the network, instead of using extensions/add-ons for individual browsers, so you'll stop seeing ads in +some of the most intrusive places, like your smart TV. Pi-hole can even [improve your network's speed and reduce +bandwidth](https://discourse.pi-hole.net/t/will-pi-hole-slow-down-my-network/2048). + +Most Pi-hole users run it on a [Raspberry Pi](https://www.raspberrypi.org/products/raspberry-pi-4-model-b/) (hence the +name), a credit card-sized, super-capable computer that costs about $35. + +And to keep tabs on how both Pi-hole and the Raspberry Pi are working to protect your network, you can use the +open-source [Netdata monitoring agent](https://github.com/netdata/netdata). + +To get started, all you need is a [Raspberry Pi](https://www.raspberrypi.org/products/raspberry-pi-4-model-b/) with +Raspbian installed. This guide uses a Raspberry Pi 4 Model B and Raspbian GNU/Linux 10 (buster). This guide assumes +you're connecting to a Raspberry Pi remotely over SSH, but you could also complete all these steps on the system +directly using a keyboard, mouse, and monitor. + +## Why monitor Pi-hole and a Raspberry Pi with Netdata? + +Netdata helps you monitor and troubleshoot all kinds of devices and the applications they run, including IoT devices +like the Raspberry Pi and applications like Pi-hole. + +After a two-minute installation and with zero configuration, you'll be able to see all of Pi-hole's metrics, including +the volume of queries, connected clients, DNS queries per type, top clients, top blocked domains, and more. + +With Netdata installed, you can also monitor system metrics and any other applications you might be running. By default, +Netdata collects metrics on CPU usage, disk IO, bandwidth, per-application resource usage, and a ton more. With the +Raspberry Pi used for this guide, Netdata automatically collects about 1,500 metrics every second! + +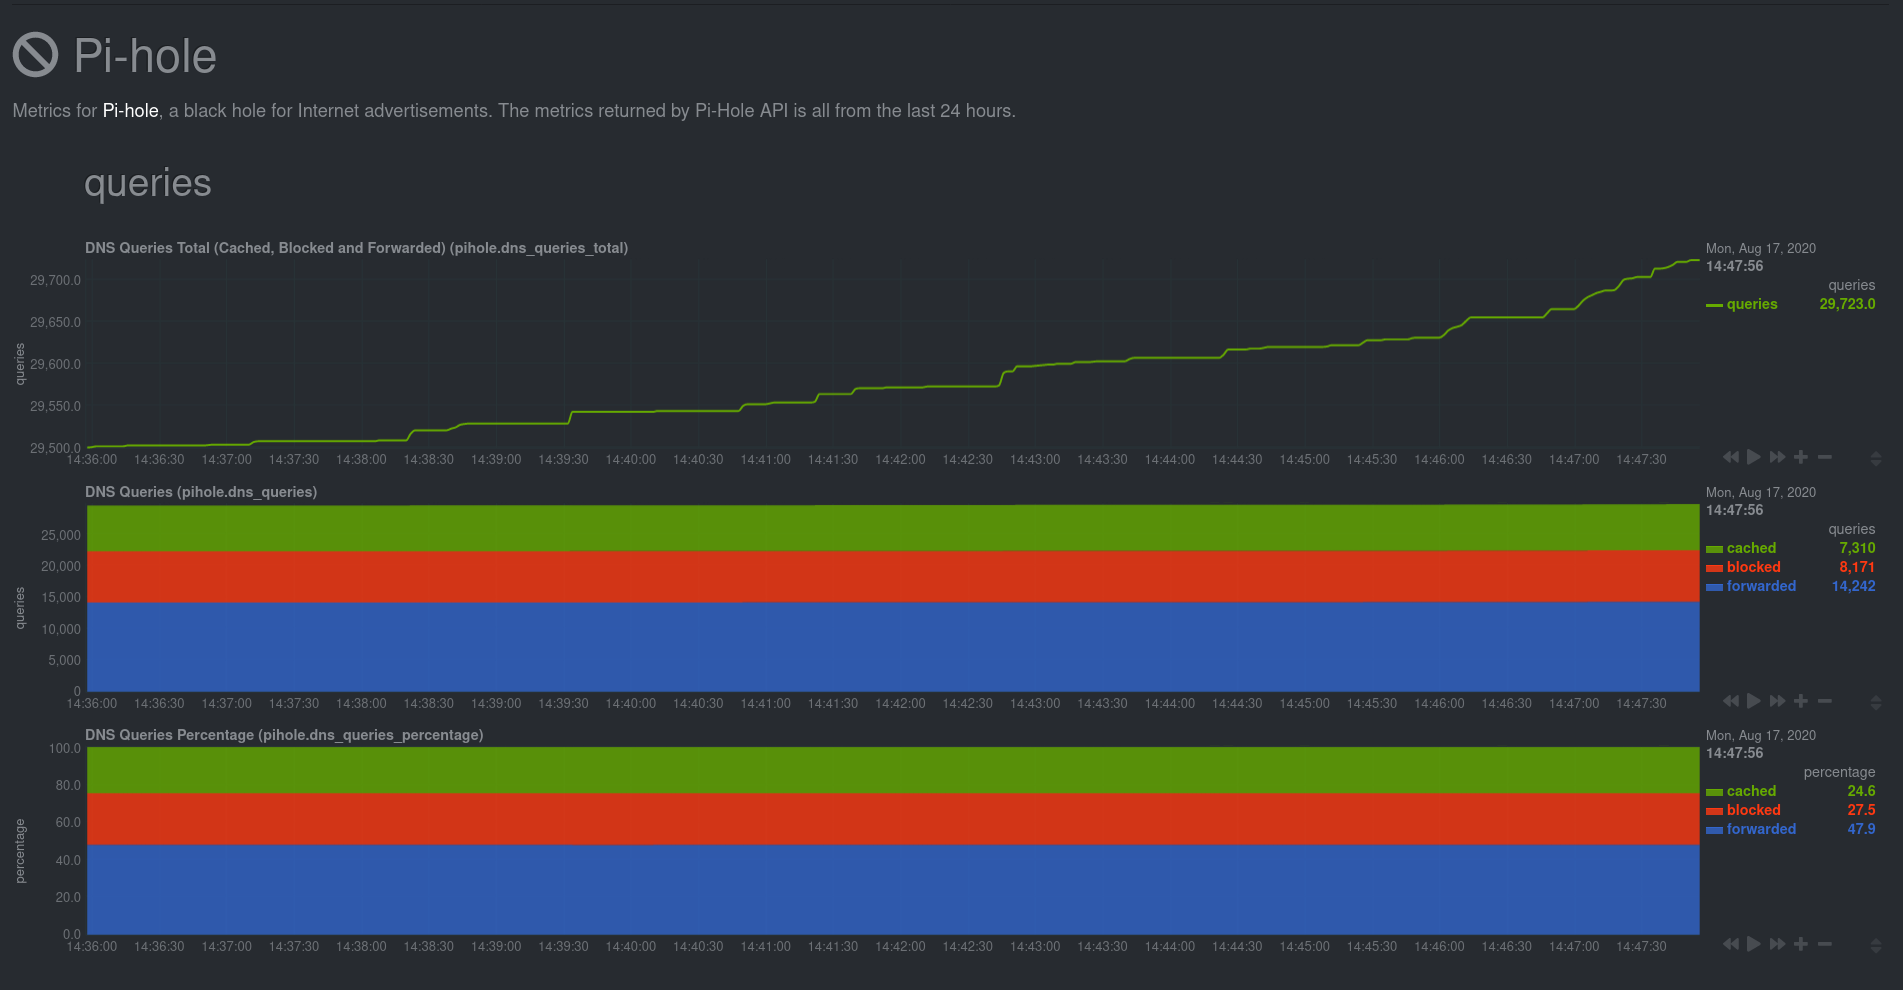 + +## Install Netdata + +Let's start by installing Netdata first so that it can start collecting system metrics as soon as possible for the most +possible historic data. + +> ⚠️ Don't install Netdata using `apt` and the default package available in Raspbian. The Netdata team does not maintain +> this package, and can't guarantee it works properly. + +On Raspberry Pis running Raspbian, the best way to install Netdata is our one-line kickstart script. This script asks +you to install dependencies, then compiles Netdata from source via [GitHub](https://github.com/netdata/netdata). + +<OneLineInstallWget/> + +Once installed on a Raspberry Pi 4 with no accessories, Netdata starts collecting roughly 1,500 metrics every second and +populates its dashboard with more than 250 charts. + +Open your browser of choice and navigate to `http://NODE:19999/`, replacing `NODE` with the IP address of your Raspberry +Pi. Not sure what that IP is? Try running `hostname -I | awk '{print $1}'` from the Pi itself. + +You'll see Netdata's dashboard and a few hundred real-time, interactive charts. Feel free to explore, but let's turn our attention to installing Pi-hole. + +## Install Pi-Hole + +Like Netdata, Pi-hole has a one-line script for simple installation. From your Raspberry Pi, run the following: + +```bash +curl -sSL https://install.pi-hole.net | bash +``` + +The installer will help you set up Pi-hole based on the topology of your network. Once finished, you should set up your +devices—or your router for system-wide sinkhole protection—to [use Pi-hole as their DNS +service](https://discourse.pi-hole.net/t/how-do-i-configure-my-devices-to-use-pi-hole-as-their-dns-server/245). You've +finished setting up Pi-hole at this point. + +As far as configuring Netdata to monitor Pi-hole metrics, there's nothing you actually need to do. Netdata's [Pi-hole +collector](https://github.com/netdata/go.d.plugin/blob/master/modules/pihole/README.md) will autodetect the new service +running on your Raspberry Pi and immediately start collecting metrics every second. + +Restart Netdata with `sudo systemctl restart netdata`, which will then recognize that Pi-hole is running and start a +per-second collection job. When you refresh your Netdata dashboard or load it up again in a new tab, you'll see a new +entry in the menu for **Pi-hole** metrics. + +## Use Netdata to explore and monitor your Raspberry Pi and Pi-hole + +By the time you've reached this point in the guide, Netdata has already collected a ton of valuable data about your +Raspberry Pi, Pi-hole, and any other apps/services you might be running. Even a few minutes of collecting 1,500 metrics +per second adds up quickly. + +You can now use Netdata's synchronized charts to zoom, highlight, scrub through time, and discern how an anomaly in one +part of your system might affect another. + + + +If you're completely new to Netdata, look at the [Introduction](https://github.com/netdata/netdata/blob/master/docs/getting-started/introduction.md) section for a walkthrough of all its features. For a more expedited tour, see the [get started documentation](https://github.com/netdata/netdata/blob/master/packaging/installer/README.md). + +### Enable temperature sensor monitoring + +You need to manually enable Netdata's built-in [temperature sensor +collector](https://github.com/netdata/netdata/blob/master/collectors/charts.d.plugin/sensors/README.md) to start collecting metrics. + +> Netdata uses a few plugins to manage its [collectors](https://github.com/netdata/netdata/blob/master/collectors/REFERENCE.md), each using a different language: Go, +> Python, Node.js, and Bash. While our Go collectors are undergoing the most active development, we still support the +> other languages. In this case, you need to enable a temperature sensor collector that's written in Bash. + +First, open the `charts.d.conf` file for editing. You should always use the `edit-config` script to edit Netdata's +configuration files, as it ensures your settings persist across updates to the Netdata Agent. + +```bash +cd /etc/netdata +sudo ./edit-config charts.d.conf +``` + +Uncomment the `sensors=force` line and save the file. Restart Netdata with `sudo systemctl restart netdata` to enable +Raspberry Pi temperature sensor monitoring. + +### Storing historical metrics on your Raspberry Pi + +By default, Netdata allocates 256 MiB in disk space to store historical metrics inside the [database +engine](https://github.com/netdata/netdata/blob/master/database/engine/README.md). On the Raspberry Pi used for this guide, Netdata collects 1,500 metrics every +second, which equates to storing 3.5 days worth of historical metrics. + +You can increase this allocation by editing `netdata.conf` and increasing the `dbengine multihost disk space` setting to +more than 256. + +```yaml +[global] + dbengine multihost disk space = 512 +``` + +Use our [database sizing +calculator](https://github.com/netdata/netdata/blob/master/docs/store/change-metrics-storage.md#calculate-the-system-resources-ram-disk-space-needed-to-store-metrics) +and the [Database configuration documentation](https://github.com/netdata/netdata/blob/master/database/README.md) to help you determine the right +setting for your Raspberry Pi. diff --git a/docs/guides/monitor/process.md b/docs/guides/monitor/process.md new file mode 100644 index 00000000..9aa6911f --- /dev/null +++ b/docs/guides/monitor/process.md @@ -0,0 +1,270 @@ +<!-- +title: Monitor any process in real-time with Netdata +sidebar_label: Monitor any process in real-time with Netdata +description: "Tap into Netdata's powerful collectors, with per-second utilization metrics for every process, to troubleshoot faster and make data-informed decisions." +image: /img/seo/guides/monitor/process.png +custom_edit_url: https://github.com/netdata/netdata/edit/master/docs/guides/monitor/process.md +learn_status: "Published" +learn_rel_path: "Operations" +--> + +# Monitor any process in real-time with Netdata + +Netdata is more than a multitude of generic system-level metrics and visualizations. Instead of providing only a bird's +eye view of your system, leaving you to wonder exactly _what_ is taking up 99% CPU, Netdata also gives you visibility +into _every layer_ of your node. These additional layers give you context, and meaningful insights, into the true health +and performance of your infrastructure. + +One of these layers is the _process_. Every time a Linux system runs a program, it creates an independent process that +executes the program's instructions in parallel with anything else happening on the system. Linux systems track the +state and resource utilization of processes using the [`/proc` filesystem](https://en.wikipedia.org/wiki/Procfs), and +Netdata is designed to hook into those metrics to create meaningful visualizations out of the box. + +While there are a lot of existing command-line tools for tracking processes on Linux systems, such as `ps` or `top`, +only Netdata provides dozens of real-time charts, at both per-second and event frequency, without you having to write +SQL queries or know a bunch of arbitrary command-line flags. + +With Netdata's process monitoring, you can: + +- Benchmark/optimize performance of standard applications, like web servers or databases +- Benchmark/optimize performance of custom applications +- Troubleshoot CPU/memory/disk utilization issues (why is my system's CPU spiking right now?) +- Perform granular capacity planning based on the specific needs of your infrastructure +- Search for leaking file descriptors +- Investigate zombie processes + +... and much more. Let's get started. + +## Prerequisites + +- One or more Linux nodes running [Netdata](https://github.com/netdata/netdata/blob/master/packaging/installer/README.md) +- A general understanding of how + to [configure the Netdata Agent](https://github.com/netdata/netdata/blob/master/docs/configure/nodes.md) + using `edit-config`. +- A Netdata Cloud account. [Sign up](https://app.netdata.cloud) if you don't have one already. + +## How does Netdata do process monitoring? + +The Netdata Agent already knows to look for hundreds +of [standard applications that we support via collectors](https://github.com/netdata/netdata/blob/master/collectors/COLLECTORS.md), +and groups them based on their +purpose. Let's say you want to monitor a MySQL +database using its process. The Netdata Agent already knows to look for processes with the string `mysqld` in their +name, along with a few others, and puts them into the `sql` group. This `sql` group then becomes a dimension in all +process-specific charts. + +The process and groups settings are used by two unique and powerful collectors. + +[**`apps.plugin`**](https://github.com/netdata/netdata/blob/master/collectors/apps.plugin/README.md) looks at the Linux +process tree every second, much like `top` or +`ps fax`, and collects resource utilization information on every running process. It then automatically adds a layer of +meaningful visualization on top of these metrics, and creates per-process/application charts. + +[**`ebpf.plugin`**](https://github.com/netdata/netdata/blob/master/collectors/ebpf.plugin/README.md): Netdata's extended +Berkeley Packet Filter (eBPF) collector +monitors Linux kernel-level metrics for file descriptors, virtual filesystem IO, and process management, and then hands +process-specific metrics over to `apps.plugin` for visualization. The eBPF collector also collects and visualizes +metrics on an _event frequency_, which means it captures every kernel interaction, and not just the volume of +interaction at every second in time. That's even more precise than Netdata's standard per-second granularity. + +### Per-process metrics and charts in Netdata + +With these collectors working in parallel, Netdata visualizes the following per-second metrics for _any_ process on your +Linux systems: + +- CPU utilization (`apps.cpu`) + - Total CPU usage + - User/system CPU usage (`apps.cpu_user`/`apps.cpu_system`) +- Disk I/O + - Physical reads/writes (`apps.preads`/`apps.pwrites`) + - Logical reads/writes (`apps.lreads`/`apps.lwrites`) + - Open unique files (if a file is found open multiple times, it is counted just once, `apps.files`) +- Memory + - Real Memory Used (non-shared, `apps.mem`) + - Virtual Memory Allocated (`apps.vmem`) + - Minor page faults (i.e. memory activity, `apps.minor_faults`) +- Processes + - Threads running (`apps.threads`) + - Processes running (`apps.processes`) + - Carried over uptime (since the last Netdata Agent restart, `apps.uptime`) + - Minimum uptime (`apps.uptime_min`) + - Average uptime (`apps.uptime_average`) + - Maximum uptime (`apps.uptime_max`) + - Pipes open (`apps.pipes`) +- Swap memory + - Swap memory used (`apps.swap`) + - Major page faults (i.e. swap activity, `apps.major_faults`) +- Network + - Sockets open (`apps.sockets`) +- eBPF file + - Number of calls to open files. (`apps.file_open`) + - Number of files closed. (`apps.file_closed`) + - Number of calls to open files that returned errors. + - Number of calls to close files that returned errors. +- eBPF syscall + - Number of calls to delete files. (`apps.file_deleted`) + - Number of calls to `vfs_write`. (`apps.vfs_write_call`) + - Number of calls to `vfs_read`. (`apps.vfs_read_call`) + - Number of bytes written with `vfs_write`. (`apps.vfs_write_bytes`) + - Number of bytes read with `vfs_read`. (`apps.vfs_read_bytes`) + - Number of calls to write a file that returned errors. + - Number of calls to read a file that returned errors. +- eBPF process + - Number of process created with `do_fork`. (`apps.process_create`) + - Number of threads created with `do_fork` or `__x86_64_sys_clone`, depending on your system's kernel + version. (`apps.thread_create`) + - Number of times that a process called `do_exit`. (`apps.task_close`) +- eBPF net + - Number of bytes sent. (`apps.bandwidth_sent`) + - Number of bytes received. (`apps.bandwidth_recv`) + +As an example, here's the per-process CPU utilization chart, including a `sql` group/dimension. + +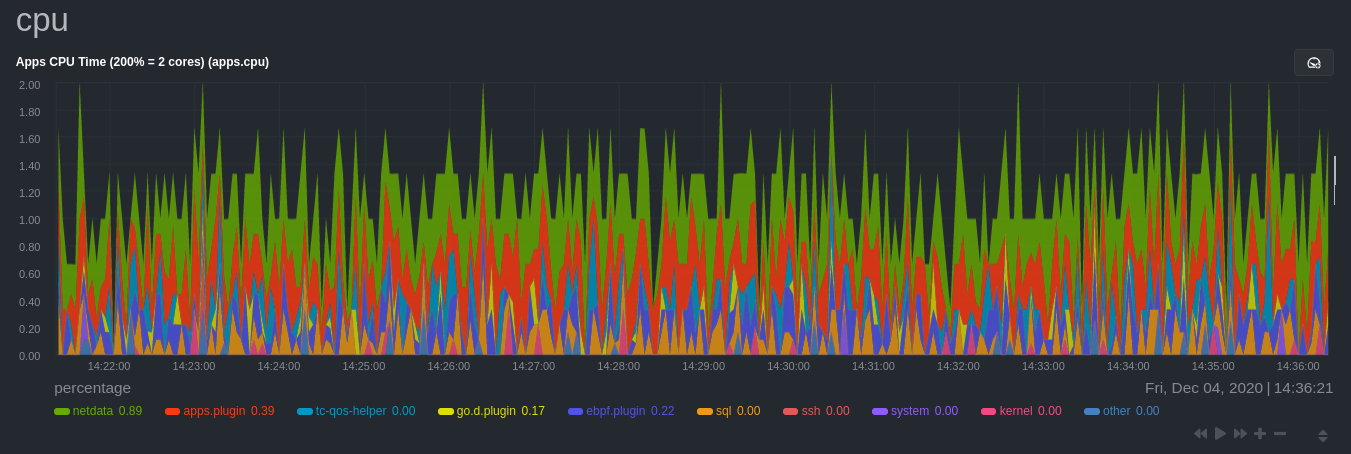 + +## Configure the Netdata Agent to recognize a specific process + +To monitor any process, you need to make sure the Netdata Agent is aware of it. As mentioned above, the Agent is already +aware of hundreds of processes, and collects metrics from them automatically. + +But, if you want to change the grouping behavior, add an application that isn't yet supported in the Netdata Agent, or +monitor a custom application, you need to edit the `apps_groups.conf` configuration file. + +Navigate to your [Netdata config directory](https://github.com/netdata/netdata/blob/master/docs/configure/nodes.md) and +use `edit-config` to edit the file. + +```bash +cd /etc/netdata # Replace this with your Netdata config directory if not at /etc/netdata. +sudo ./edit-config apps_groups.conf +``` + +Inside the file are lists of process names, oftentimes using wildcards (`*`), that the Netdata Agent looks for and +groups together. For example, the Netdata Agent looks for processes starting with `mysqld`, `mariad`, `postgres`, and +others, and groups them into `sql`. That makes sense, since all these processes are for SQL databases. + +```conf +sql: mysqld* mariad* postgres* postmaster* oracle_* ora_* sqlservr +``` + +These groups are then reflected as [dimensions](https://github.com/netdata/netdata/blob/master/web/README.md#dimensions) +within Netdata's charts. + + + +See the following two sections for details based on your needs. If you don't need to configure `apps_groups.conf`, jump +down to [visualizing process metrics](#visualize-process-metrics). + +### Standard applications (web servers, databases, containers, and more) + +As explained above, the Netdata Agent is already aware of most standard applications you run on Linux nodes, and you +shouldn't need to configure it to discover them. + +However, if you're using multiple applications that the Netdata Agent groups together you may want to separate them for +more precise monitoring. If you're not running any other types of SQL databases on that node, you don't need to change +the grouping, since you know that any MySQL is the only process contributing to the `sql` group. + +Let's say you're using both MySQL and PostgreSQL databases on a single node, and want to monitor their processes +independently. Open the `apps_groups.conf` file as explained in +the [section above](#configure-the-netdata-agent-to-recognize-a-specific-process) and scroll down until you find +the `database servers` section. Create new groups for MySQL and PostgreSQL, and move their process queries into the +unique groups. + +```conf +# ----------------------------------------------------------------------------- +# database servers + +mysql: mysqld* +postgres: postgres* +sql: mariad* postmaster* oracle_* ora_* sqlservr +``` + +Restart Netdata with `sudo systemctl restart netdata`, or +the [appropriate method](https://github.com/netdata/netdata/blob/master/docs/configure/start-stop-restart.md) for your system, to start collecting utilization metrics +from your application. Time to [visualize your process metrics](#visualize-process-metrics). + +### Custom applications + +Let's assume you have an application that runs on the process `custom-app`. To monitor eBPF metrics for that application +separate from any others, you need to create a new group in `apps_groups.conf` and associate that process name with it. + +Open the `apps_groups.conf` file as explained in +the [section above](#configure-the-netdata-agent-to-recognize-a-specific-process). Scroll down +to `# NETDATA processes accounting`. +Above that, paste in the following text, which creates a new `custom-app` group with the `custom-app` process. Replace +`custom-app` with the name of your application's Linux process. `apps_groups.conf` should now look like this: + +```conf +... +# ----------------------------------------------------------------------------- +# Custom applications to monitor with apps.plugin and ebpf.plugin + +custom-app: custom-app + +# ----------------------------------------------------------------------------- +# NETDATA processes accounting +... +``` + +Restart Netdata with `sudo systemctl restart netdata`, or +the [appropriate method](https://github.com/netdata/netdata/blob/master/docs/configure/start-stop-restart.md) for your system, to start collecting utilization metrics +from your application. + +## Visualize process metrics + +Now that you're collecting metrics for your process, you'll want to visualize them using Netdata's real-time, +interactive charts. Find these visualizations in the same section regardless of whether you +use [Netdata Cloud](https://app.netdata.cloud) for infrastructure monitoring, or single-node monitoring with the local +Agent's dashboard at `http://localhost:19999`. + +If you need a refresher on all the available per-process charts, see +the [above list](#per-process-metrics-and-charts-in-netdata). + +### Using Netdata's application collector (`apps.plugin`) + +`apps.plugin` puts all of its charts under the **Applications** section of any Netdata dashboard. + +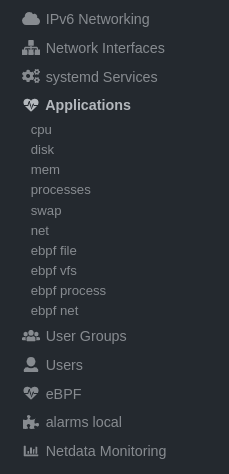 + +Let's continue with the MySQL example. We can create a [test +database](https://www.digitalocean.com/community/tutorials/how-to-measure-mysql-query-performance-with-mysqlslap) in +MySQL to generate load on the `mysql` process. + +`apps.plugin` immediately collects and visualizes this activity `apps.cpu` chart, which shows an increase in CPU +utilization from the `sql` group. There is a parallel increase in `apps.pwrites`, which visualizes writes to disk. + +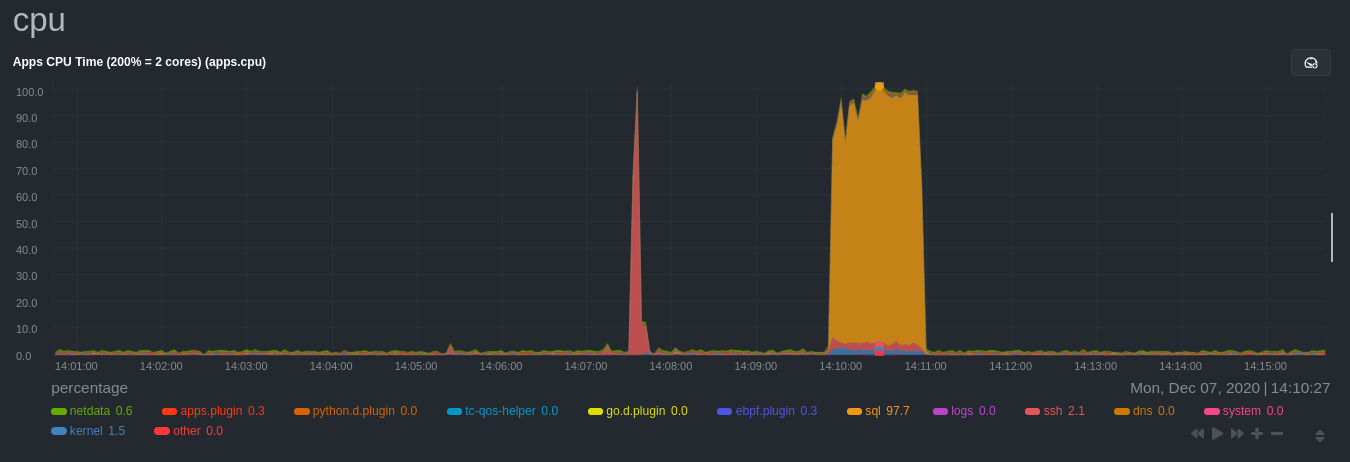 + +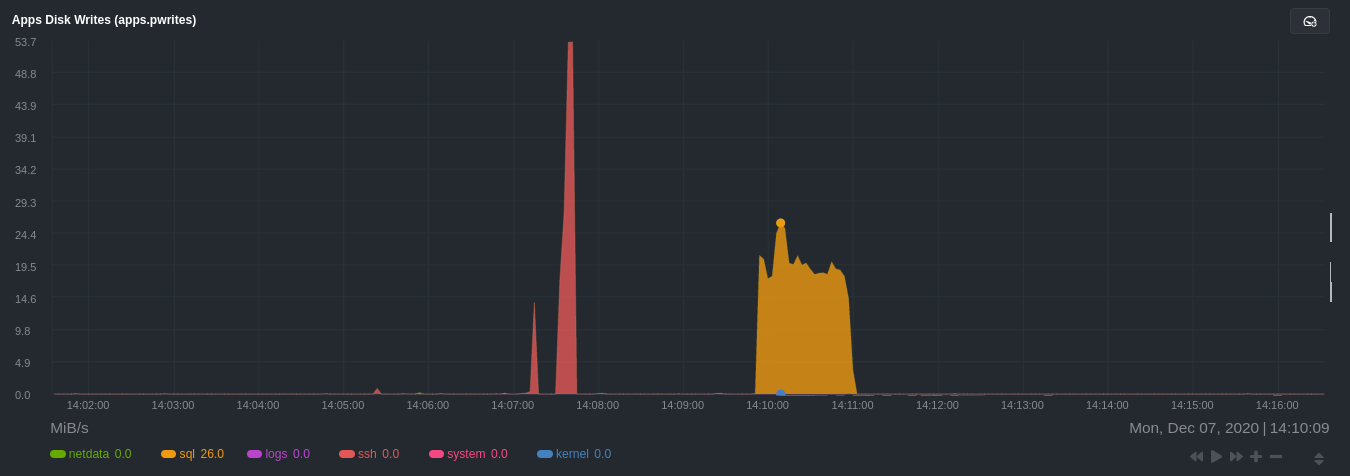 + +Next, the `mysqlslap` utility queries the database to provide some benchmarking load on the MySQL database. It won't +look exactly like a production database executing lots of user queries, but it gives you an idea into the possibility of +these visualizations. + +```bash +sudo mysqlslap --user=sysadmin --password --host=localhost --concurrency=50 --iterations=10 --create-schema=employees --query="SELECT * FROM dept_emp;" --verbose +``` + +The following per-process disk utilization charts show spikes under the `sql` group at the same time `mysqlslap` was run +numerous times, with slightly different concurrency and query options. + + + +> 💡 Click on any dimension below a chart in Netdata Cloud (or to the right of a chart on a local Agent dashboard), to +> visualize only that dimension. This can be particularly useful in process monitoring to separate one process' +> utilization from the rest of the system. + +### Using Netdata's eBPF collector (`ebpf.plugin`) + +Netdata's eBPF collector puts its charts in two places. Of most importance to process monitoring are the **ebpf file**, +**ebpf syscall**, **ebpf process**, and **ebpf net** sub-sections under **Applications**, shown in the above screenshot. + +For example, running the above workload shows the entire "story" how MySQL interacts with the Linux kernel to open +processes/threads to handle a large number of SQL queries, then subsequently close the tasks as each query returns the +relevant data. + +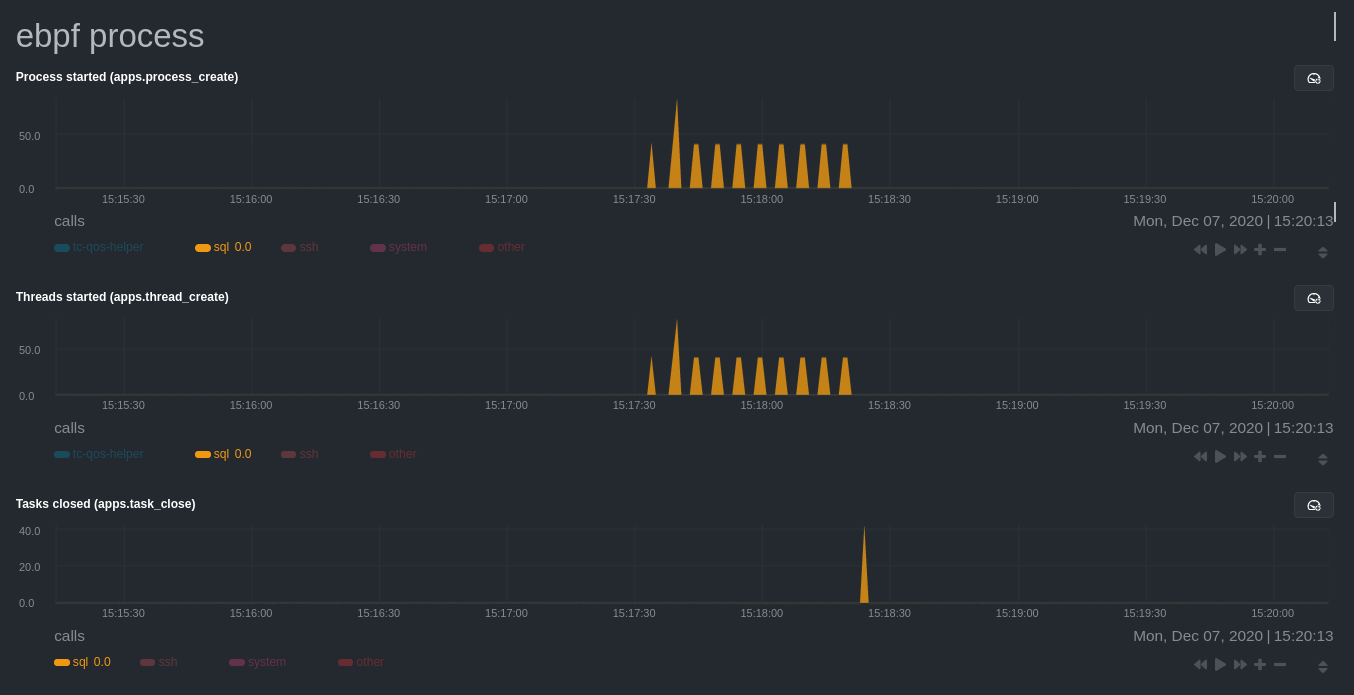 + +`ebpf.plugin` visualizes additional eBPF metrics, which are system-wide and not per-process, under the **eBPF** section. + + diff --git a/docs/guides/monitor/raspberry-pi-anomaly-detection.md b/docs/guides/monitor/raspberry-pi-anomaly-detection.md new file mode 100644 index 00000000..935d0f6c --- /dev/null +++ b/docs/guides/monitor/raspberry-pi-anomaly-detection.md @@ -0,0 +1,96 @@ +# Anomaly detection for RPi monitoring + +Learn how to use a low-overhead machine learning algorithm alongside Netdata to detect anomalous metrics on a Raspberry Pi. + +We love IoT and edge at Netdata, we also love machine learning. Even better if we can combine the two to ease the pain +of monitoring increasingly complex systems. + +We recently explored what might be involved in enabling our Python-based [anomalies +collector](https://github.com/netdata/netdata/blob/master/collectors/python.d.plugin/anomalies/README.md) on a Raspberry Pi. To our delight, it's actually quite +straightforward! + +Read on to learn all the steps and enable unsupervised anomaly detection on your on Raspberry Pi(s). + +> Spoiler: It's just a couple of extra commands that will make you feel like a pro. + +## What you need to get started + +- A Raspberry Pi running Raspbian, which we'll call a _node_. +- The [open-source Netdata](https://github.com/netdata/netdata) monitoring agent. If you don't have it installed on your + node yet, [get started now](https://github.com/netdata/netdata/blob/master/packaging/installer/README.md). + +## Install dependencies + +First make sure Netdata is using Python 3 when it runs Python-based data collectors. + +Next, open `netdata.conf` using [`edit-config`](https://github.com/netdata/netdata/blob/master/docs/configure/nodes.md#use-edit-config-to-edit-configuration-files) +from within the [Netdata config directory](https://github.com/netdata/netdata/blob/master/docs/configure/nodes.md#the-netdata-config-directory). Scroll down to the +`[plugin:python.d]` section to pass in the `-ppython3` command option. + +```conf +[plugin:python.d] + # update every = 1 + command options = -ppython3 +``` + +Next, install some of the underlying libraries used by the Python packages the collector depends upon. + +```bash +sudo apt install llvm-9 libatlas3-base libgfortran5 libatlas-base-dev +``` + +Now you're ready to install the Python packages used by the collector itself. First, become the `netdata` user. + +```bash +sudo su -s /bin/bash netdata +``` + +Then pass in the location to find `llvm` as an environment variable for `pip3`. + +```bash +LLVM_CONFIG=llvm-config-9 pip3 install --user llvmlite numpy==1.20.1 netdata-pandas==0.0.38 numba==0.50.1 scikit-learn==0.23.2 pyod==0.8.3 +``` + +## Enable the anomalies collector + +Now you're ready to enable the collector and [restart Netdata](https://github.com/netdata/netdata/blob/master/docs/configure/start-stop-restart.md). + +```bash +sudo ./edit-config python.d.conf + +# restart netdata +sudo systemctl restart netdata +``` + +And that should be it! Wait a minute or two, refresh your Netdata dashboard, you should see the default anomalies +charts under the **Anomalies** section in the dashboard's menu. + +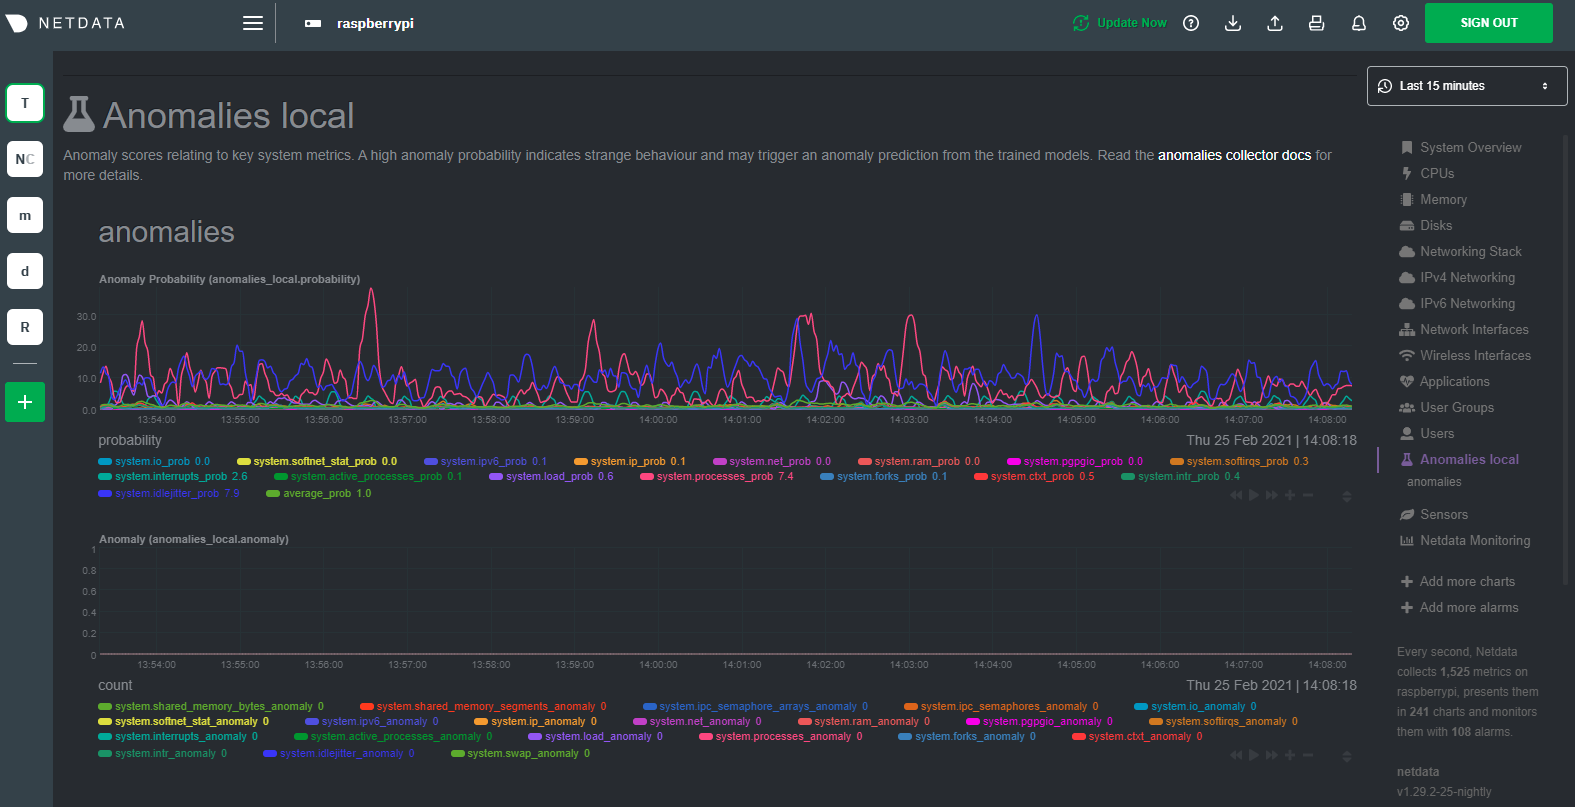 + +## Overhead on system + +Of course one of the most important considerations when trying to do anomaly detection at the edge (as opposed to in a +centralized cloud somewhere) is the resource utilization impact of running a monitoring tool. + +With the default configuration, the anomalies collector uses about 6.5% of CPU at each run. During the retraining step, +CPU utilization jumps to between 20-30% for a few seconds, but you can [configure +retraining](https://github.com/netdata/netdata/blob/master/collectors/python.d.plugin/anomalies/README.md#configuration) to happen less often if you wish. + +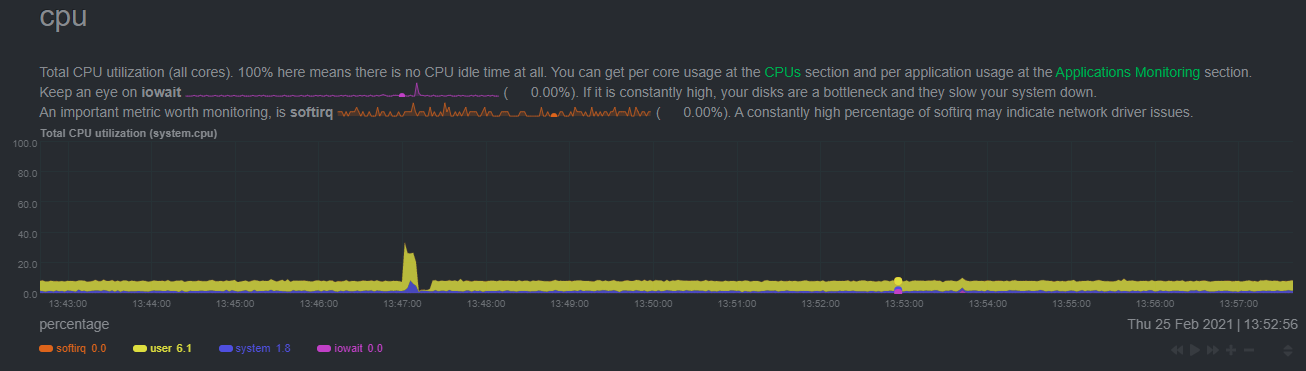 + +In terms of the runtime of the collector, it was averaging around 250ms during each prediction step, jumping to about +8-10 seconds during a retraining step. This jump equates only to a small gap in the anomaly charts for a few seconds. + +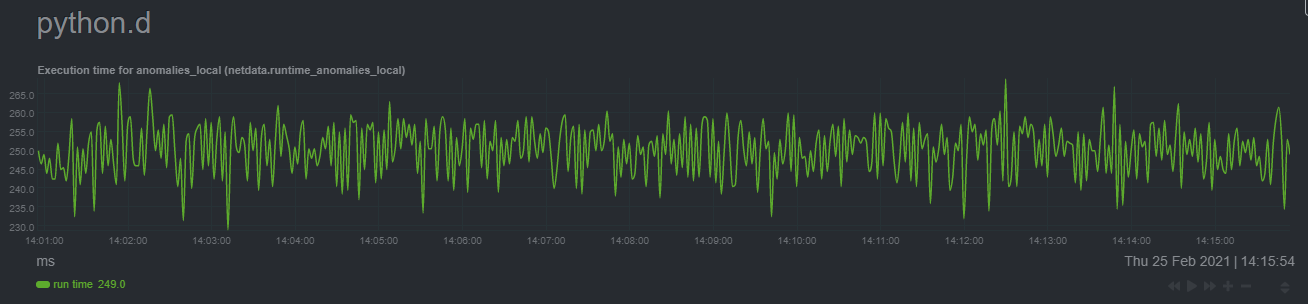 + +The last consideration then is the amount of RAM the collector needs to store both the models and some of the data +during training. By default, the anomalies collector, along with all other running Python-based collectors, uses about +100MB of system memory. + + + + |