
diff options
| author | Daniel Baumann <daniel.baumann@progress-linux.org> | 2021-02-24 04:57:01 +0000 |
|---|---|---|
| committer | Daniel Baumann <daniel.baumann@progress-linux.org> | 2021-02-24 04:57:01 +0000 |
| commit | 69a131c47635213a492ed6ab989b412c8fd5fe1d (patch) | |
| tree | 4ac7b314ea9f88dd24c0947ed12a4c0eac945942 | |
| parent | Releasing debian version 1.29.2-1. (diff) | |
| download | netdata-69a131c47635213a492ed6ab989b412c8fd5fe1d.tar.xz netdata-69a131c47635213a492ed6ab989b412c8fd5fe1d.zip | |
Merging upstream version 1.29.3.
Signed-off-by: Daniel Baumann <daniel.baumann@progress-linux.org>
| -rw-r--r-- | CHANGELOG.md | 19 | ||||
| -rw-r--r-- | collectors/COLLECTORS.md | 13 | ||||
| -rw-r--r-- | collectors/node.d.plugin/sma_webbox/README.md | 7 | ||||
| -rw-r--r-- | collectors/proc.plugin/proc_net_dev.c | 4 | ||||
| -rw-r--r-- | collectors/statsd.plugin/README.md | 241 | ||||
| -rw-r--r-- | docs/configure/nodes.md | 2 | ||||
| -rw-r--r-- | docs/guides/monitor/dimension-templates.md | 2 | ||||
| -rw-r--r-- | docs/guides/step-by-step/step-06.md | 2 | ||||
| -rw-r--r-- | docs/store/distributed-data-architecture.md | 2 | ||||
| -rw-r--r-- | health/notifications/opsgenie/README.md | 7 | ||||
| -rw-r--r-- | libnetdata/clocks/README.md | 4 | ||||
| -rw-r--r-- | libnetdata/dictionary/README.md | 4 | ||||
| -rw-r--r-- | libnetdata/ebpf/README.md | 4 | ||||
| -rw-r--r-- | libnetdata/locks/README.md | 4 | ||||
| -rw-r--r-- | libnetdata/log/README.md | 4 | ||||
| -rw-r--r-- | libnetdata/popen/README.md | 4 | ||||
| -rw-r--r-- | libnetdata/socket/README.md | 4 | ||||
| -rw-r--r-- | libnetdata/statistical/README.md | 4 | ||||
| -rw-r--r-- | libnetdata/threads/README.md | 4 | ||||
| -rw-r--r-- | libnetdata/url/README.md | 4 | ||||
| -rw-r--r-- | netdata.spec.in | 4 | ||||
| -rw-r--r-- | packaging/version | 2 | ||||
| -rw-r--r-- | web/gui/dashboard_info.js | 6 |
23 files changed, 242 insertions, 109 deletions
diff --git a/CHANGELOG.md b/CHANGELOG.md index 7ae8754e0..1caf3ed72 100644 --- a/CHANGELOG.md +++ b/CHANGELOG.md @@ -1,5 +1,17 @@ # Changelog +## [v1.29.3](https://github.com/netdata/netdata/tree/v1.29.3) (2021-02-23) + +[Full Changelog](https://github.com/netdata/netdata/compare/v1.29.2...v1.29.3) + +**Merged pull requests:** + +- Invalidate RRDSETVAR pointers on obsoletion. [\#10667](https://github.com/netdata/netdata/pull/10667) ([mfundul](https://github.com/mfundul)) +- Fixed condition controlling use of static LWS in RPM builds. [\#10661](https://github.com/netdata/netdata/pull/10661) ([Ferroin](https://github.com/Ferroin)) +- fix wrong link on docs Netdata Agent Daemon [\#10659](https://github.com/netdata/netdata/pull/10659) ([OdysLam](https://github.com/OdysLam)) +- Fix broken links in docs and add collectors to list [\#10651](https://github.com/netdata/netdata/pull/10651) ([joelhans](https://github.com/joelhans)) +- Statsd dashboard [\#10640](https://github.com/netdata/netdata/pull/10640) ([OdysLam](https://github.com/OdysLam)) + ## [v1.29.2](https://github.com/netdata/netdata/tree/v1.29.2) (2021-02-18) [Full Changelog](https://github.com/netdata/netdata/compare/v1.29.1...v1.29.2) @@ -238,13 +250,6 @@ - Fix README exporting link [\#10020](https://github.com/netdata/netdata/pull/10020) ([Dim-P](https://github.com/Dim-P)) - Clean up and better cross-link new docsv2 documents [\#10015](https://github.com/netdata/netdata/pull/10015) ([joelhans](https://github.com/joelhans)) - collector infiniband: fix file descriptor leak [\#10013](https://github.com/netdata/netdata/pull/10013) ([Saruspete](https://github.com/Saruspete)) -- changes default query thread count [\#10009](https://github.com/netdata/netdata/pull/10009) ([underhood](https://github.com/underhood)) -- Add missing tests to the web server [\#10008](https://github.com/netdata/netdata/pull/10008) ([thiagoftsm](https://github.com/thiagoftsm)) -- Update freebsd.md [\#10005](https://github.com/netdata/netdata/pull/10005) ([disko](https://github.com/disko)) -- Add documentation for claiming k8s parent pods and Prometheus service discovery [\#10001](https://github.com/netdata/netdata/pull/10001) ([joelhans](https://github.com/joelhans)) -- Add docsv2 project to master branch [\#10000](https://github.com/netdata/netdata/pull/10000) ([joelhans](https://github.com/joelhans)) -- Allow connecting to arbitrary MQTT WSS broker for devs [\#9999](https://github.com/netdata/netdata/pull/9999) ([underhood](https://github.com/underhood)) -- minor - removes leading whitespace before JSON in ACLK [\#9998](https://github.com/netdata/netdata/pull/9998) ([underhood](https://github.com/underhood)) ## [before_rebase](https://github.com/netdata/netdata/tree/before_rebase) (2020-09-24) diff --git a/collectors/COLLECTORS.md b/collectors/COLLECTORS.md index e718fd239..a795de100 100644 --- a/collectors/COLLECTORS.md +++ b/collectors/COLLECTORS.md @@ -259,8 +259,10 @@ configure any of these collectors according to your setup and infrastructure. - [Access point](/collectors/charts.d.plugin/ap/README.md): Monitor client, traffic and signal metrics using the `aw` tool. - [APC UPS](/collectors/charts.d.plugin/apcupsd/README.md): Capture status information using the `apcaccess` tool. -- [Energi Core](/collectors/python.d.plugin/energid/README.md): Monitor blockchain, memory, network, and unspent - transactions statistics. +- [Energi Core (Go)](https://learn.netdata.cloud/docs/agent/collectors/go.d.plugin/modules/energid): Monitor + blockchain indexes, memory usage, network usage, and transactions of wallet instances. +- [Energi Core (Python)](/collectors/python.d.plugin/energid/README.md): Monitor blockchain, memory, network, and + unspent transactions statistics. - [Fronius Symo](/collectors/node.d.plugin/fronius/): Collect power, consumption, autonomy, energy, and inverter statistics. - [UPS/PDU](/collectors/charts.d.plugin/nut/README.md): Read the status of UPS/PDU devices using the `upsc` tool. @@ -313,6 +315,9 @@ configure any of these collectors according to your setup and infrastructure. metrics via `ngx_http_stub_status_module`. - [Nginx Plus](/collectors/python.d.plugin/nginx_plus/README.md): Collect global and per-server zone, upstream, and cache metrics. +- [Nginx VTS](https://learn.netdata.cloud/docs/agent/collectors/go.d.plugin/modules/nginxvts/): Gathers metrics from + any Nginx deployment with the _virtual host traffic status module_ enabled, including metrics on uptime, memory + usage, and cache, and more. - [PHP-FPM (Go)](https://learn.netdata.cloud/docs/agent/collectors/go.d.plugin/modules/phpfpm/): Collect application summary and processes health metrics by scraping the status page (`/status?full`). - [PHP-FPM (Python)](/collectors/python.d.plugin/phpfpm/README.md): Collect application summary and processes health @@ -484,8 +489,8 @@ The Netdata Agent can collect these system- and hardware-level metrics using a v These collectors are recursive in nature, in that they monitor some function of the Netdata Agent itself. Some collectors are described only in code and associated charts in Netdata dashboards. -- [ACLK (code only)](https://github.com/netdata/netdata/blob/master/aclk/aclk_stats.c): View whether a Netdata Agent - is connected to Netdata Cloud via the [ACLK](/aclk/README.md), the volume of queries, process times, and more. +- [ACLK (code only)](https://github.com/netdata/netdata/blob/master/aclk/legacy/aclk_stats.c): View whether a Netdata + Agent is connected to Netdata Cloud via the [ACLK](/aclk/README.md), the volume of queries, process times, and more. - [Alarms](https://learn.netdata.cloud/docs/agent/collectors/python.d.plugin/alarms): This collector creates an <strong>Alarms</strong> menu with one line plot showing the alarm states of a Netdata Agent over time. - [Anomalies](https://learn.netdata.cloud/docs/agent/collectors/python.d.plugin/anomalies): This collector uses the diff --git a/collectors/node.d.plugin/sma_webbox/README.md b/collectors/node.d.plugin/sma_webbox/README.md index ba7039d20..ec6b248c3 100644 --- a/collectors/node.d.plugin/sma_webbox/README.md +++ b/collectors/node.d.plugin/sma_webbox/README.md @@ -6,11 +6,10 @@ sidebar_label: "SMA Sunny WebBox" # SMA Sunny WebBox monitoring with Netdata -[SMA Sunny Webbox](http://files.sma.de/dl/4253/WEBBOX-DUS131916W.pdf) +Montiroing for the [SMA Sunny +WebBox](https://www.sma-sunny.com/en/questions-and-answers-on-discontinuation-of-the-sunny-webbox/). -Example Netdata configuration for node.d/sma_webbox.conf - -The module supports any number of name servers, like this: +The module supports any number of name servers: ```json { diff --git a/collectors/proc.plugin/proc_net_dev.c b/collectors/proc.plugin/proc_net_dev.c index 5355077f8..a7db37e61 100644 --- a/collectors/proc.plugin/proc_net_dev.c +++ b/collectors/proc.plugin/proc_net_dev.c @@ -169,6 +169,10 @@ static void netdev_charts_release(struct netdev *d) { d->rd_tcollisions = NULL; d->rd_tcarrier = NULL; d->rd_tcompressed = NULL; + + d->chart_var_speed = NULL; + d->chart_var_duplex = NULL; + d->chart_var_operstate = NULL; } static void netdev_free_chart_strings(struct netdev *d) { diff --git a/collectors/statsd.plugin/README.md b/collectors/statsd.plugin/README.md index 332b60e73..070bfc554 100644 --- a/collectors/statsd.plugin/README.md +++ b/collectors/statsd.plugin/README.md @@ -6,17 +6,19 @@ custom_edit_url: https://github.com/netdata/netdata/edit/master/collectors/stats # statsd.plugin -statsd is a system to collect data from any application. Applications are sending metrics to it, usually via non-blocking UDP communication, and statsd servers collect these metrics, perform a few simple calculations on them and push them to backend time-series databases. +StatsD is a system to collect data from any application. Applications send metrics to it, usually via non-blocking UDP communication, and StatsD servers collect these metrics, perform a few simple calculations on them and push them to backend time-series databases. + +If you want to learn more about the StatsD protocol, we have written a [blog post](https://www.netdata.cloud/blog/introduction-to-statsd/) about it! There is a [plethora of client libraries](https://github.com/etsy/statsd/wiki#client-implementations) for embedding statsd metrics to any application framework. This makes statsd quite popular for custom application metrics. -Netdata is a fully featured statsd server. It can collect statsd formatted metrics, visualize them on its dashboards, stream them to other Netdata servers or archive them to backend time-series databases. +Netdata is a fully featured statsd server. It can collect statsd formatted metrics, visualize them on its dashboards and store them in it's database for long-term retention. -Netdata statsd is inside Netdata (an internal plugin, running inside the Netdata daemon), it is configured via `netdata.conf` and by-default listens on standard statsd ports (tcp and udp 8125 - yes, Netdata statsd server supports both tcp and udp at the same time). +Netdata statsd is inside Netdata (an internal plugin, running inside the Netdata daemon), it is configured via `netdata.conf` and by-default listens on standard statsd port 8125. Netdata supports both tcp and udp packets at the same time. -Since statsd is embedded in Netdata, it means you now have a statsd server embedded on all your servers. So, the application can send its metrics to `localhost:8125`. This provides a distributed statsd implementation. +Since statsd is embedded in Netdata, it means you now have a statsd server embedded on all your servers. -Netdata statsd is fast. It can collect more than **1.200.000 metrics per second** on modern hardware, more than **200Mbps of sustained statsd traffic**, using 1 CPU core (yes, it is single threaded - actually double-threaded, one thread collects metrics, another one updates the charts from the collected data). +Netdata statsd is fast. It can collect more than **1.200.000 metrics per second** on modern hardware, more than **200Mbps of sustained statsd traffic**, using 1 CPU core. The implementation uses two threads: one thread collects metrics, another one updates the charts from the collected data. ## Metrics supported by Netdata @@ -28,7 +30,7 @@ Netdata fully supports the statsd protocol. All statsd client libraries can be u The application may increment or decrement a previous value, by setting the first character of the value to `+` or `-` (so, the only way to set a gauge to an absolute negative value, is to first set it to zero). - Sampling rate is supported (check below). + [Sampling rate](#sampling-rates) is supported. When a gauge is not collected and the setting is not to show gaps on the charts (the default), the last value will be shown, until a data collection event changes it. @@ -38,21 +40,25 @@ Netdata fully supports the statsd protocol. All statsd client libraries can be u `:value` can be omitted and statsd will assume it is `1`. `|c`, `|C` and `|m` can be omitted an statsd will assume it is `|m`. So, the application may send just `name` and statsd will parse it as `name:1|m`. - For counters use `|c` (etsy/statsd compatible) or `|C` (brubeck compatible), for meters use `|m`. - - Sampling rate is supported (check below). + - Counters use `|c` (etsy/statsd compatible) or `|C` (brubeck compatible) + - Meters use `|m` - When a counter or meter is not collected and the setting is not to show gaps on the charts (the default), zero will be shown, until a data collection event changes it. + [Sampling rate](#sampling-rates) is supported. + When a counter or meter is not collected, Netdata **defaults** to showing a zero value, until a data collection event changes the value. + - **Timers** and **Histograms** The application sends `name:value|ms` or `name:value|h`, where `value` is any **decimal/fractional** number, statsd reports **min**, **max**, **average**, **sum**, **95th percentile**, **median** and **standard deviation** and the total number of times it was updated (events). - For timers use `|ms`, or histograms use `|h`. The only difference between the two, is the `units` of the charts (timers report milliseconds). + - Timers use `|ms` + - Histograms use `|h` + + The only difference between the two, is the `units` of the charts, as timers report *miliseconds*. - Sampling rate is supported (check below). + [Sampling rate](#sampling-rates) is supported. - When a timer or histogram is not collected and the setting is not to show gaps on the charts (the default), zero will be shown, until a data collection event changes it. + When a counter or meter is not collected, Netdata **defaults** to showing a zero value, until a data collection event changes the value. - **Sets** @@ -60,15 +66,15 @@ Netdata fully supports the statsd protocol. All statsd client libraries can be u Sampling rate is **not** supported for Sets. `value` is always considered text. - When a set is not collected and the setting is not to show gaps on the charts (the default), zero will be shown, until a data collection event changes it. + When a counter or meter is not collected, Netdata **defaults** to showing a zero value, until a data collection event changes the value. #### Sampling Rates -The application may append `|@sampling_rate`, where `sampling_rate` is a number from `0.0` to `1.0`, to have statsd extrapolate the value, to predict to total for the whole period. So, if the application reports to statsd a value for 1/10th of the time, it can append `|@0.1` to the metrics it sends to statsd. +The application may append `|@sampling_rate`, where `sampling_rate` is a number from `0.0` to `1.0` in order for StatD to extrapolate the value and predict the total for the entire period. If the application reports to StatsD a value for 1/10th of the time, it can append `|@0.1` to the metrics it sends to statsd. #### Overlapping metrics -Netdata's statsd server maintains different indexes for each of the types supported. This means the same metric `name` may exist under different types concurrently. +Netdata's StatsD server maintains different indexes for each of the types supported. This means the same metric `name` may exist under different types concurrently. #### Multiple metrics per packet @@ -76,15 +82,21 @@ Netdata accepts multiple metrics per packet if each is terminated with `\n`. #### TCP packets -Netdata listens for both TCP and UDP packets. For TCP though, is it important to always append `\n` on each metric. Netdata uses this to detect if a metric is split into multiple TCP packets. On disconnect, even the remaining (non terminated with `\n`) buffer, is processed. +Netdata listens for both TCP and UDP packets. For TCP, is it important to always append `\n` on each metric, as Netdata will use the newline character to detect if a metric is split into multiple TCP packets. + +On disconnect, Netdata will process the entire buffer, even if it is not terminated with a `\n`. #### UDP packets -When sending multiple packets over UDP, it is important not to exceed the network MTU (usually 1500 bytes minus a few bytes for the headers). Netdata will accept UDP packets up to 9000 bytes, but the underlying network will not exceed MTU. +When sending multiple packets over UDP, it is important not to exceed the network MTU, usually about 1500 packets. -## configuration +Netdata will accept UDP packets up to 9000 bytes, but the underlying network will not exceed MTU. -This is the statsd configuration at `/etc/netdata/netdata.conf`: +> You can read more about the network maxium transmission unit(MTU) in this cloudflare [article](https://www.cloudflare.com/en-gb/learning/network-layer/what-is-mtu/). + +## Configuration + +You can find the configuration at `/etc/netdata/netdata.conf`: ``` [statsd] @@ -110,47 +122,51 @@ This is the statsd configuration at `/etc/netdata/netdata.conf`: # bind to = udp:localhost:8125 tcp:localhost:8125 ``` -### statsd main config options +### StatsD main config options - `enabled = yes|no` - controls if statsd will be enabled for this Netdata. The default is enabled. + controls if StatsD will be enabled for this Netdata. The default is enabled. - `default port = 8125` - controls the port statsd will use. This is the default, since the next line, allows defining ports too. + controls the default port StatsD will use if no port is defined in the following setting. - `bind to = udp:localhost tcp:localhost` is a space separated list of IPs and ports to listen to. The format is `PROTOCOL:IP:PORT` - if `PORT` is omitted, the `default port` will be used. If `IP` is IPv6, it needs to be enclosed in `[]`. `IP` can also be `*` (to listen on all IPs) or even a hostname. -- `update every (flushInterval) = 1` seconds, controls the frequency statsd will push the collected metrics to Netdata charts. +- `update every (flushInterval) = 1` seconds, controls the frequency StatsD will push the collected metrics to Netdata charts. - `decimal detail = 1000` controls the number of fractional digits in gauges and histograms. Netdata collects metrics using signed 64 bit integers and their fractional detail is controlled using multipliers and divisors. This setting is used to multiply all collected values to convert them to integers and is also set as the divisors, so that the final data will be a floating point number with this fractional detail (1000 = X.0 - X.999, 10000 = X.0 - X.9999, etc). The rest of the settings are discussed below. -## statsd charts +## StatsD charts -Netdata can visualize statsd collected metrics in 2 ways: +Netdata can visualize StatsD collected metrics in 2 ways: -1. Each metric gets its own **private chart**. This is the default and does not require any configuration (although there are a few options to tweak). +1. Each metric gets its own **private chart**. This is the default and does not require any configuration. You can adjust the default parameters. 2. **Synthetic charts** can be created, combining multiple metrics, independently of their metric types. For this type of charts, special configuration is required, to define the chart title, type, units, its dimensions, etc. -### private metric charts +### Private metric charts -Private charts are controlled with `create private charts for metrics matching = *`. This setting accepts a space separated list of simple patterns (use `*` as wildcard, prepend a pattern with `!` for a negative match, the order of patterns is important). +Private charts are controlled with `create private charts for metrics matching = *`. This setting accepts a space separated list of [simple patterns](/libnetdata/simple_pattern/README.md). Netdata will create private charts for all metrics **by default** -So to render charts for all `myapp.*` metrics, except `myapp.*.badmetric`, use: +For example, to render charts for all `myapp.*` metrics, except `myapp.*.badmetric`, use: ``` create private charts for metrics matching = !myapp.*.badmetric myapp.* ``` -The default is to render private charts for all metrics. +You can specify Netdata StatsD to have a different `memory mode` than the rest of the Netdata Agent. You can read more about `memory mode` in the [documentation](/database/README.md). + +The default behavior is to use the same settings as the rest of the Netdata Agent. If you wish to change them, edit the following settings: +- `private charts memory mode` +- `private charts history` -The `memory mode` of the round robin database and the `history` of private metric charts are controlled with `private charts memory mode` and `private charts history`. The defaults for both settings is to use the global Netdata settings. So, you need to edit them only when you want statsd to use different settings compared to the global ones. +### Optimise private metric charts visualization and storage If you have thousands of metrics, each with its own private chart, you may notice that your web browser becomes slow when you view the Netdata dashboard (this is a web browser issue we need to address at the Netdata UI). So, Netdata has a protection to stop creating charts when `max private charts allowed = 200` (soft limit) is reached. @@ -160,19 +176,19 @@ Metrics above the hard limit are still collected, but they can only be used in s Example private charts (automatically generated without any configuration): -#### counters +#### Counters - Scope: **count the events of something** (e.g. number of file downloads) - Format: `name:INTEGER|c` or `name:INTEGER|C` or `name|c` -- statsd increments the counter by the `INTEGER` number supplied (positive, or negative). +- StatsD increments the counter by the `INTEGER` number supplied (positive, or negative).  -#### gauges +#### Gauges - Scope: **report the value of something** (e.g. cache memory used by the application server) - Format: `name:FLOAT|g` -- statsd remembers the last value supplied, and can increment or decrement the latest value if `FLOAT` begins with `+` or `-`. +- StatsD remembers the last value supplied, and can increment or decrement the latest value if `FLOAT` begins with `+` or `-`.  @@ -180,56 +196,57 @@ Example private charts (automatically generated without any configuration): - Scope: **statistics on a size of events** (e.g. statistics on the sizes of files downloaded) - Format: `name:FLOAT|h` -- statsd maintains a list of all the values supplied and provides statistics on them. +- StatsD maintains a list of all the values supplied and provides statistics on them.  The same chart with `sum` unselected, to show the detail of the dimensions supported:  -#### meters +#### Meters This is identical to `counter`. - Scope: **count the events of something** (e.g. number of file downloads) - Format: `name:INTEGER|m` or `name|m` or just `name` -- statsd increments the counter by the `INTEGER` number supplied (positive, or negative). +- StatsD increments the counter by the `INTEGER` number supplied (positive, or negative).  -#### sets +#### Sets - Scope: **count the unique occurrences of something** (e.g. unique filenames downloaded, or unique users that downloaded files) - Format: `name:TEXT|s` -- statsd maintains a unique index of all values supplied, and reports the unique entries in it. +- StatsD maintains a unique index of all values supplied, and reports the unique entries in it.  -#### timers +#### Timers - Scope: **statistics on the duration of events** (e.g. statistics for the duration of file downloads) - Format: `name:FLOAT|ms` -- statsd maintains a list of all the values supplied and provides statistics on them. +- StatsD maintains a list of all the values supplied and provides statistics on them.  The same chart with the `sum` unselected:  -### synthetic statsd charts +### Synthetic StatsD charts -Use synthetic charts to create dedicated sections on the dashboard to render the charts, with control over the main -menu, the submenus, the charts, the dimensions on each chart, and more. +Use synthetic charts to create dedicated sections on the dashboard to render your StatsD charts. Synthetic charts are organized in -- **applications** (i.e. entries at the main menu of the Netdata dashboard) -- **charts for each application** (grouped in families - i.e. submenus at the dashboard menu) -- **statsd metrics for each chart** (i.e. dimensions of the charts) +- **application** aka section in Netdata Dashboard. +- **charts for each application** aka family in Netdata Dashboard. +- **StatsD metrics for each chart** /aka charts and context Netdata Dashboard. + +> You can read more about how the Netdata Agent organizes information in the relevant [documentation](/web/README.md) For each application you need to create a `.conf` file in `/etc/netdata/statsd.d`. -So, to create the statsd application `myapp`, create the file `/etc/netdata/statsd.d/myapp.conf`, with this content: +For example, if you want to monitor the application `myapp` using StatD and Netdata, create the file `/etc/netdata/statsd.d/myapp.conf`, with this content: ``` [app] @@ -263,11 +280,11 @@ Using the above configuration `myapp` should get its own section on the dashboar `[app]` starts a new application definition. The supported settings in this section are: - `name` defines the name of the app. -- `metrics` is a Netdata simple pattern (space separated patterns, using `*` for wildcard, possibly starting with `!` for negative match). This pattern should match all the possible statsd metrics that will be participating in the application `myapp`. +- `metrics` is a Netdata [simple pattern](/libnetdata/simple_pattern/README.md). This pattern should match all the possible StatsD metrics that will be participating in the application `myapp`. - `private charts = yes|no`, enables or disables private charts for the metrics matched. -- `gaps when not collected = yes|no`, enables or disables gaps on the charts of the application, when metrics are not collected. -- `memory mode` sets the memory mode for all charts of the application. The default is the global default for Netdata (not the global default for statsd private charts). -- `history` sets the size of the round robin database for this application. The default is the global default for Netdata (not the global default for statsd private charts). +- `gaps when not collected = yes|no`, enables or disables gaps on the charts of the application in case that no metrics are collected. +- `memory mode` sets the memory mode for all charts of the application. The default is the global default for Netdata (not the global default for StatsD private charts). +- `history` sets the size of the round robin database for this application. The default is the global default for Netdata (not the global default for StatsD private charts). This is only relevant if you use `memory mode = save`. Read more on our guide: [longer metrics storage](https://learn.netdata.cloud/guides/longer-metrics-storage). `[dictionary]` defines name-value associations. These are used to renaming metrics, when added to synthetic charts. Metric names are also defined at each `dimension` line. However, using the dictionary dimension names can be declared globally, for each app and is the only way to rename dimensions when using patterns. Of course the dictionary can be empty or missing. @@ -288,13 +305,13 @@ So, the format is this: dimension = [pattern] METRIC NAME TYPE MULTIPLIER DIVIDER OPTIONS ``` -`pattern` is a keyword. When set, `METRIC` is expected to be a Netdata simple pattern that will be used to match all the statsd metrics to be added to the chart. So, `pattern` automatically matches any number of statsd metrics, all of which will be added as separate chart dimensions. +`pattern` is a keyword. When set, `METRIC` is expected to be a Netdata [simple pattern](/libnetdata/simple_pattern/README.md) that will be used to match all the StatsD metrics to be added to the chart. So, `pattern` automatically matches any number of StatsD metrics, all of which will be added as separate chart dimensions. `TYPE`, `MULTIPLIER`, `DIVIDER` and `OPTIONS` are optional. `TYPE` can be: -- `events` to show the number of events received by statsd for this metric +- `events` to show the number of events received by StatsD for this metric - `last` to show the last value, as calculated at the flush interval of the metric (the default) Then for histograms and timers the following types are also supported: @@ -303,13 +320,13 @@ Then for histograms and timers the following types are also supported: - `max`, show the maximum value - `sum`, show the sum of all values - `average` (same as `last`) -- `percentile`, show the 95th percentile (or any other percentile, as configured at statsd global config) +- `percentile`, show the 95th percentile (or any other percentile, as configured at StatsD global config) - `median`, show the median of all values (i.e. sort all values and get the middle value) - `stddev`, show the standard deviation of the values -#### example synthetic charts +#### Example synthetic charts -statsd metrics: `foo` and `bar`. +StatsD metrics: `foo` and `bar`. Contents of file `/etc/netdata/stats.d/foobar.conf`: @@ -329,17 +346,19 @@ Contents of file `/etc/netdata/stats.d/foobar.conf`: dimension = bar 'bar me' last 1 1 ``` -I sent to statsd: `foo:10|g` and `bar:20|g`. +Metrics sent to statsd: `foo:10|g` and `bar:20|g`. -I got these private charts: +Private charts: 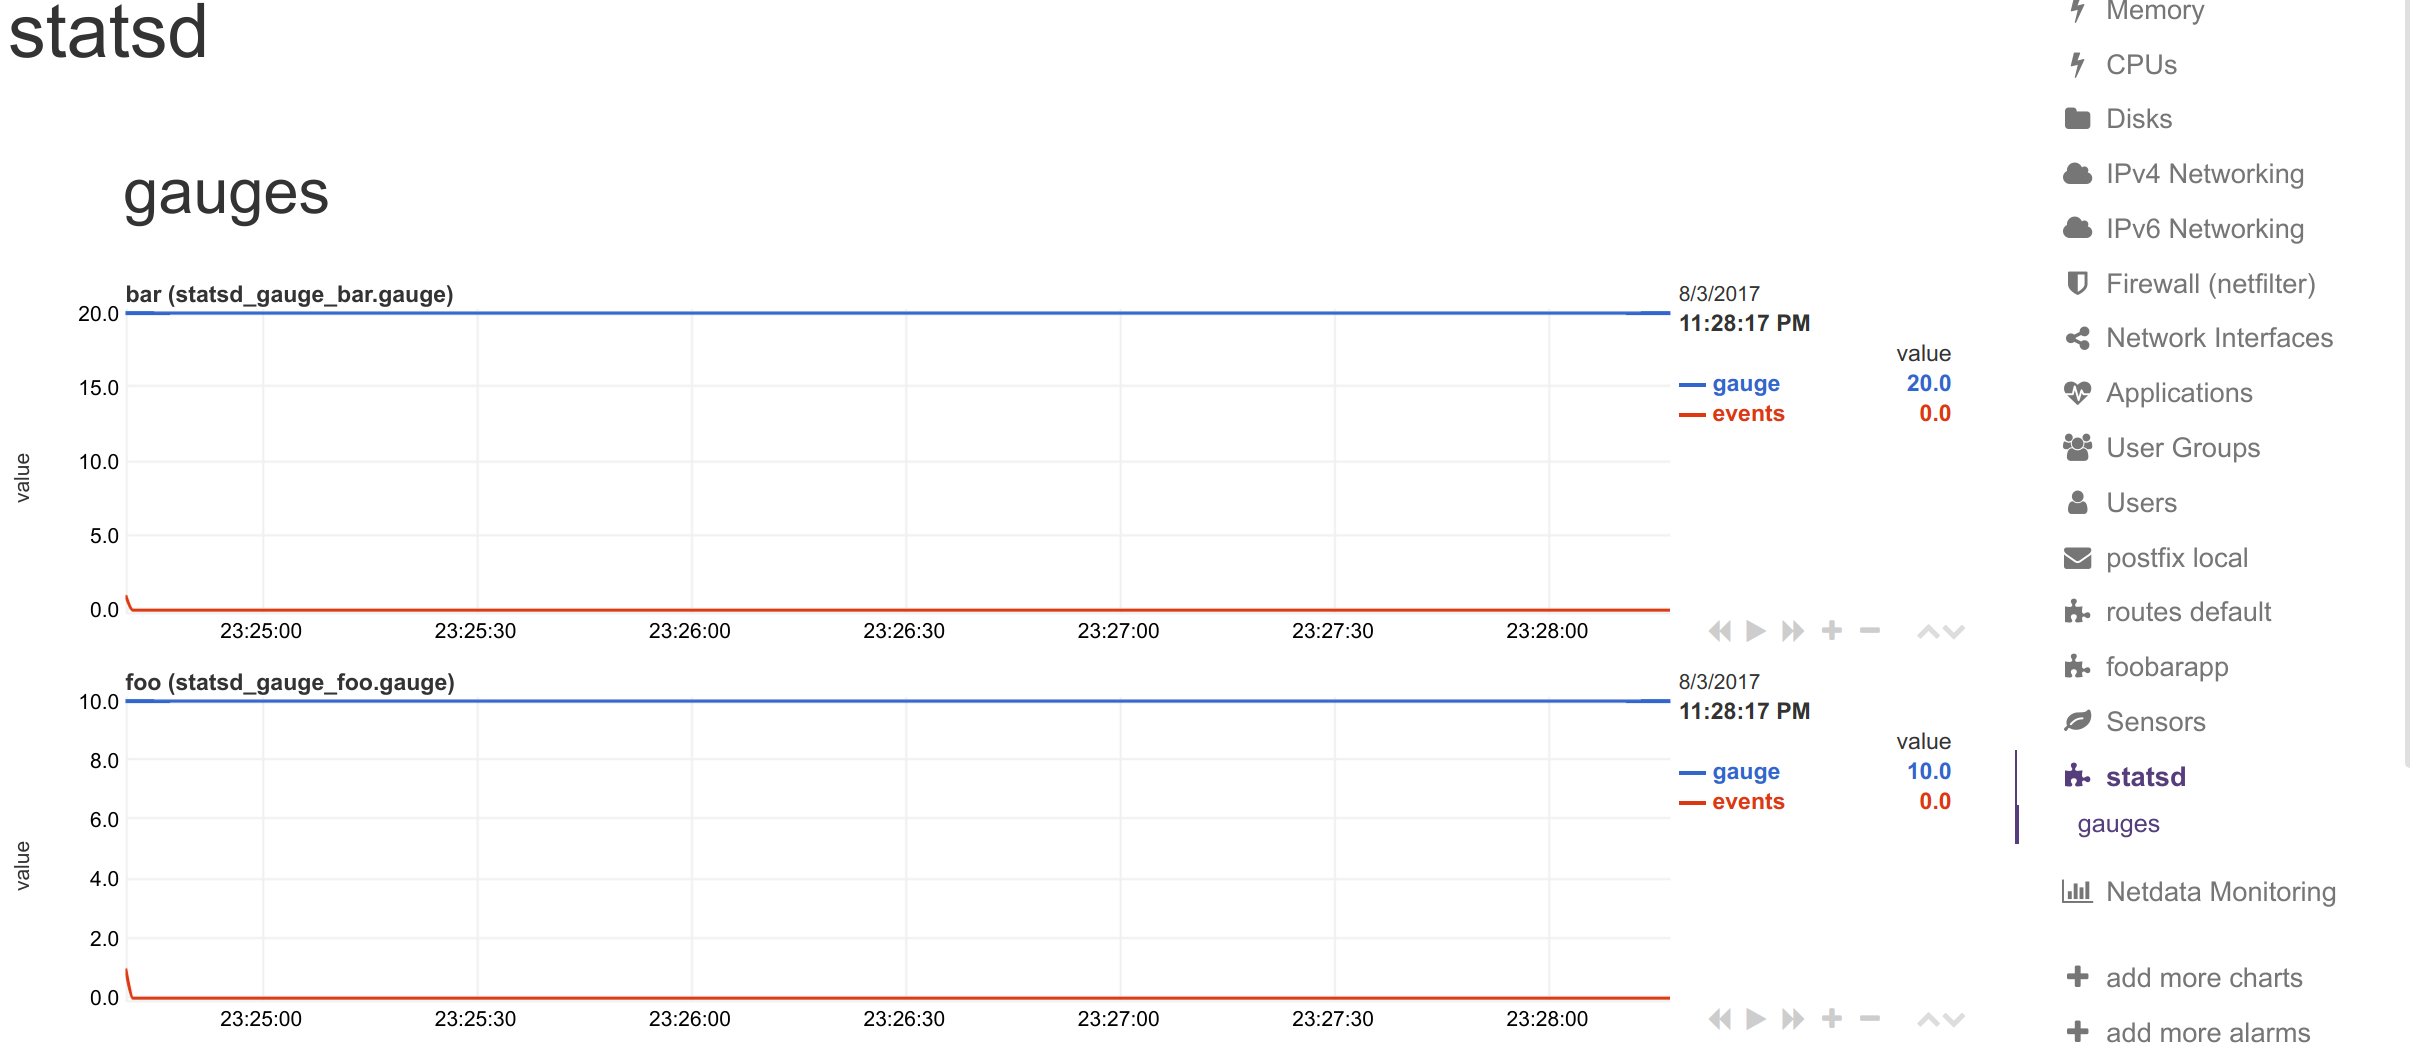 -and this synthetic chart: +Synthetic chart: 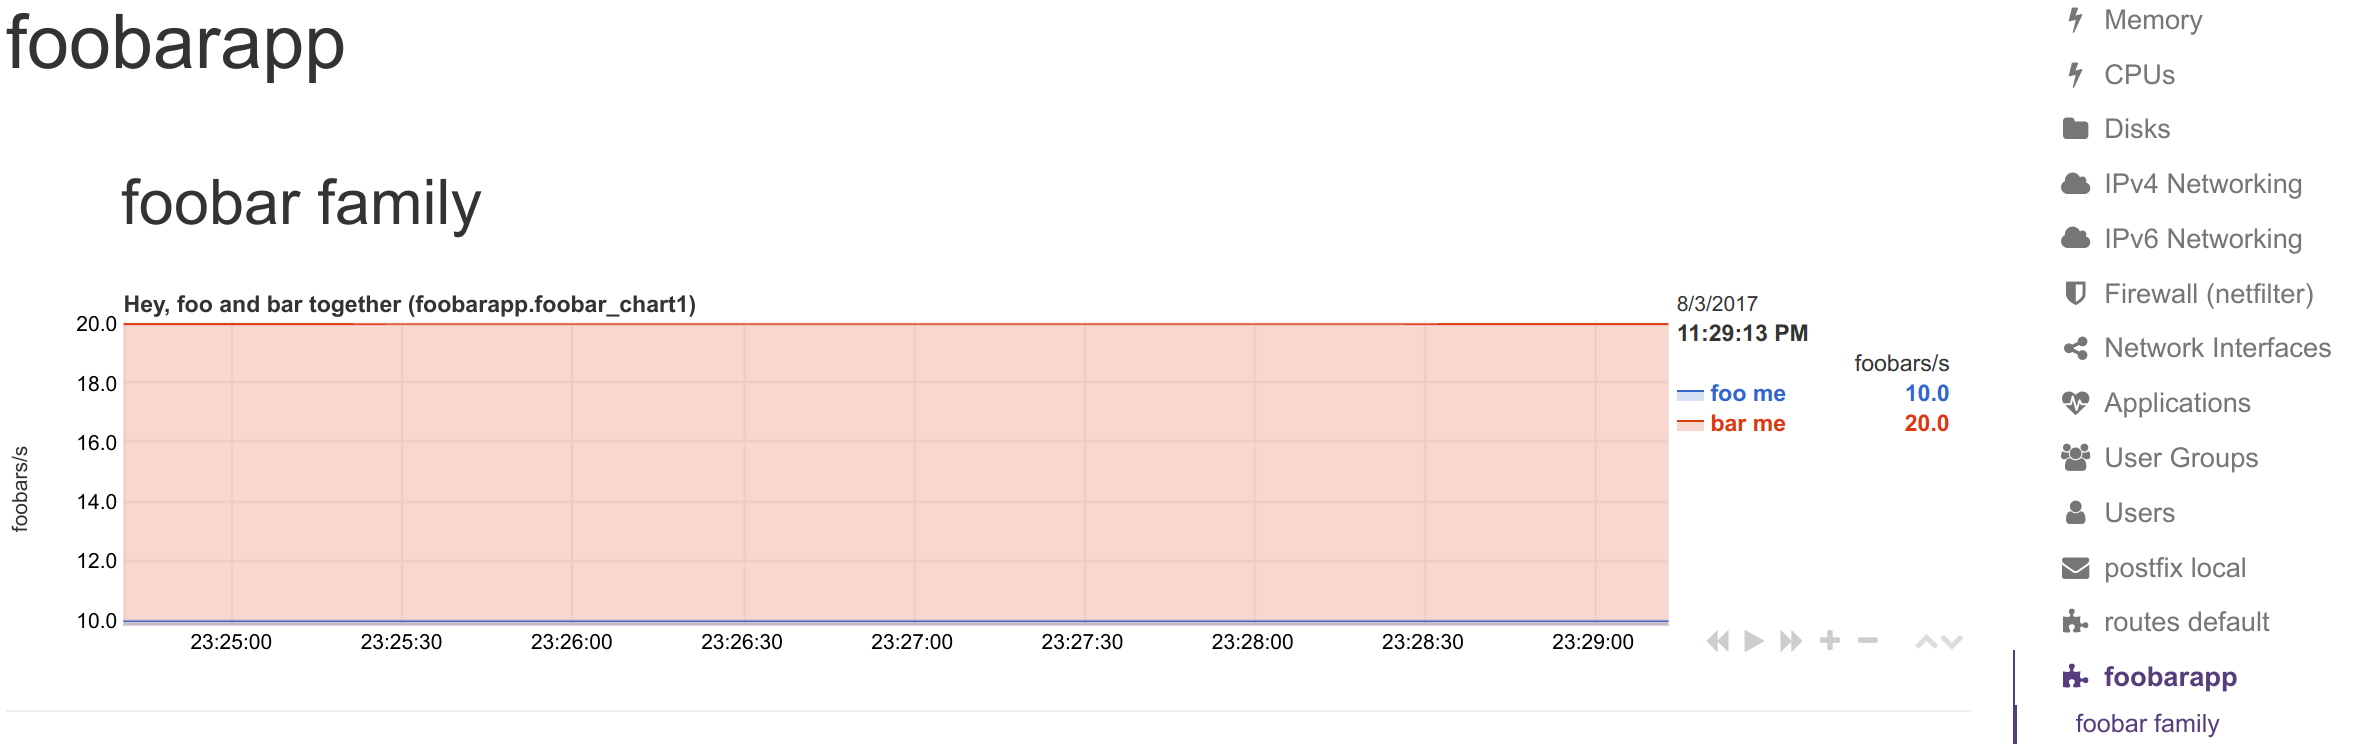 -#### dictionary to name dimensions +#### Renaming StatsD metrics + +You can define a dictionary to rename metrics sent by StatsD clients. This enables you to send response `"200"` and Netdata visualize it as `succesful connection` The `[dictionary]` section accepts any number of `name = value` pairs. @@ -347,9 +366,9 @@ Netdata uses this dictionary as follows: 1. When a `dimension` has a non-empty `NAME`, that name is looked up at the dictionary. -2. If the above lookup gives nothing, or the `dimension` has an empty `NAME`, the original statsd metric name is looked up at the dictionary. +2. If the above lookup gives nothing, or the `dimension` has an empty `NAME`, the original StatsD metric name is looked up at the dictionary. -3. If any of the above succeeds, Netdata uses the `value` of the dictionary, to set the name of the dimension. The dimensions will have as ID the original statsd metric name, and as name, the dictionary value. +3. If any of the above succeeds, Netdata uses the `value` of the dictionary, to set the name of the dimension. The dimensions will have as ID the original StatsD metric name, and as name, the dictionary value. Use the dictionary in 2 ways: @@ -358,13 +377,13 @@ Use the dictionary in 2 ways: In both cases, the dimension will be added with ID `myapp.metric1` and will be named `metric1 name`. So, in alarms use either of the 2 as `${myapp.metric1}` or `${metric1 name}`. -> keep in mind that if you add multiple times the same statsd metric to a chart, Netdata will append `TYPE` to the dimension ID, so `myapp.metric1` will be added as `myapp.metric1_last` or `myapp.metric1_events`, etc. If you add multiple times the same metric with the same `TYPE` to a chart, Netdata will also append an incremental counter to the dimension ID, i.e. `myapp.metric1_last1`, `myapp.metric1_last2`, etc. +> keep in mind that if you add multiple times the same StatsD metric to a chart, Netdata will append `TYPE` to the dimension ID, so `myapp.metric1` will be added as `myapp.metric1_last` or `myapp.metric1_events`, etc. If you add multiple times the same metric with the same `TYPE` to a chart, Netdata will also append an incremental counter to the dimension ID, i.e. `myapp.metric1_last1`, `myapp.metric1_last2`, etc. -#### dimension patterns +#### Dimension patterns -Netdata allows adding multiple dimensions to a chart, by matching the statsd metrics with a Netdata simple pattern. +Netdata allows adding multiple dimensions to a chart, by matching the StatsD metrics with a Netdata simple pattern. -Assume we have an API that provides statsd metrics for each response code per method it supports, like these: +Assume we have an API that provides StatsD metrics for each response code per method it supports, like these: ``` myapp.api.get.200 @@ -381,7 +400,7 @@ myapp.api.all.400 myapp.api.all.500 ``` -To add all response codes of `myapp.api.get` to a chart use this: +In order to add all the response codes of `myapp.api.get` to a chart, we simply make the following configuration: ``` [api_get_responses] @@ -389,7 +408,9 @@ To add all response codes of `myapp.api.get` to a chart use this: dimension = pattern 'myapp.api.get.* '' last 1 1 ``` -The above will add dimension named `200`, `400` and `500` (yes, Netdata extracts the wildcarded part of the metric name - so the dimensions will be named with whatever the `*` matched). Rename the dimensions with this: +The above will add dimension named `200`, `400` and `500`. Netdata extracts the wildcard part of the metric name - so the dimensions will be named with whatever the `*` matched. + +You can rename the dimensions with this: ``` [dictionary] @@ -404,7 +425,7 @@ The above will add dimension named `200`, `400` and `500` (yes, Netdata extracts Note that we added a `NAME` to the dimension line with `get.`. This is prefixed to the wildcarded part of the metric name, to compose the key for looking up the dictionary. So `500` became `get.500` which was looked up to the dictionary to find value `500 cannot connect to db`. This way we can have different dimension names, for each of the API methods (i.e. `get.500 = 500 cannot connect to db` while `post.500 = 500 cannot write to disk`). -To add all API methods to a chart, do this: +To add all API methods to a chart, you can do this: ``` [ok_by_method] @@ -424,7 +445,7 @@ If `all` is not wanted (a `stacked` chart does not need the `all` dimension, sin With the above, all methods except `all` will be added to the chart. -To automatically rename the methods, use this: +To automatically rename the methods, you can use this: ``` [dictionary] @@ -439,20 +460,73 @@ To automatically rename the methods, use this: Using the above, the dimensions will be added as `GET`, `ADD` and `DELETE`. -## interpolation +## StatsD examples -~~If you send just one value to statsd, you will notice that the chart is created but no value is shown. The reason is that Netdata interpolates all values at second boundaries. For incremental values (`counters` and `meters` in statsd terminology), if you send 10 at 00:00:00.500, 20 at 00:00:01.500 and 30 at 00:00:02.500, Netdata will show 15 at 00:00:01 and 25 at 00:00:02.~~ +### Python + +It's really easy to instrument your python application with StatsD, for example using [jsocol/pystatsd](https://github.com/jsocol/pystatsd). + +```python +import statsd +c = statsd.StatsClient('localhost', 8125) +c.incr('foo') # Increment the 'foo' counter. +for i in range(100000000): + c.incr('bar') + c.incr('foo') + if i % 3: + c.decr('bar') + c.timing('stats.timed', 320) # Record a 320ms 'stats.timed'. +``` -~~This interpolation is automatic and global in Netdata for all charts, for incremental values. This means that for the chart to start showing values you need to send 2 values across 2 flush intervals.~~ +You can find detailed documentation in their [documentation page](https://statsd.readthedocs.io/en/v3.3/). -~~(although this is required for incremental values, Netdata allows mixing incremental and absolute values on the same charts, so this little limitation [i.e. 2 values to start visualization], is applied on all Netdata dimensions).~~ +### Javascript and Node.js -(statsd metrics do not lose their first data collection due to interpolation anymore - fixed with [PR #2411](https://github.com/netdata/netdata/pull/2411)) +Using the client library by [sivy/node-statsd](https://github.com/sivy/node-statsd), you can easily embed StatsD into your Node.js project. -## sending statsd metrics from shell scripts +```javascript + var StatsD = require('node-statsd'), + client = new StatsD(); -Send/update statsd metrics from shell scripts to visualize automated jobs you run on your servers using the Netdata -Agent. + // Timing: sends a timing command with the specified milliseconds + client.timing('response_time', 42); + + // Increment: Increments a stat by a value (default is 1) + client.increment('my_counter'); + + // Decrement: Decrements a stat by a value (default is -1) + client.decrement('my_counter'); + + // Using the callback + client.set(['foo', 'bar'], 42, function(error, bytes){ + //this only gets called once after all messages have been sent + if(error){ + console.error('Oh noes! There was an error:', error); + } else { + console.log('Successfully sent', bytes, 'bytes'); + } + }); + + // Sampling, tags and callback are optional and could be used in any combination + client.histogram('my_histogram', 42, 0.25); // 25% Sample Rate + client.histogram('my_histogram', 42, ['tag']); // User-defined tag + client.histogram('my_histogram', 42, next); // Callback + client.histogram('my_histogram', 42, 0.25, ['tag']); + client.histogram('my_histogram', 42, 0.25, next); + client.histogram('my_histogram', 42, ['tag'], next); + client.histogram('my_histogram', 42, 0.25, ['tag'], next); +``` +### Other languages + +You can also use StatsD with: +- Golang, thanks to [alexcesaro/statsd](https://github.com/alexcesaro/statsd) +- Ruby, thanks to [reinh/statsd](https://github.com/reinh/statsd) +- Java, thanks to [DataDog/java-docstatsd-client](https://github.com/DataDog/java-dogstatsd-client) + + +### Shell + +Getting the proper support for a programming language is not always easy, but shell is always available on most UNIX systems. You can use shell and `nc` to easily instrument your systems and send metric data to Netdata StatsD. Here is how: The command you need to run is: @@ -522,9 +596,10 @@ You can use it like this: source statsd.sh # then, at any point: -statsd "metric1:10|g" "metric2:10|c" ... +StatsD "metric1:10|g" "metric2:10|c" ... ``` - The function is smart enough to call `nc` just once and pass all the metrics to it. It will also automatically switch to TCP if the metrics to send are above 1000 bytes. +If you have gotten thus far, make sure to check out our [Community Forums](https://community.netdata.cloud) to share your experience using Netdata with StatsD. + [](<>) diff --git a/docs/configure/nodes.md b/docs/configure/nodes.md index 2e4bef640..d0a6fd7a7 100644 --- a/docs/configure/nodes.md +++ b/docs/configure/nodes.md @@ -158,7 +158,7 @@ You can also take what you've learned about node configuration to enable or enha ### Related reference documentation -- [Netdata Agent · Daemon](/health/README.md) +- [Netdata Agent · Daemon](docs/agent/daemon) - [Netdata Agent · Health monitoring](/health/README.md) - [Netdata Agent · Notifications](/health/notifications/README.md) diff --git a/docs/guides/monitor/dimension-templates.md b/docs/guides/monitor/dimension-templates.md index da1faed8b..7cbe7959c 100644 --- a/docs/guides/monitor/dimension-templates.md +++ b/docs/guides/monitor/dimension-templates.md @@ -1,6 +1,6 @@ <!-- title: "Use dimension templates to create dynamic alarms" -custom_edit_url: https://github.com/netdata/netdata/edit/master/docs/monitor/health/dimension-templates.md +custom_edit_url: https://github.com/netdata/netdata/edit/master/docs/guides/monitor/dimension-templates.md --> # Use dimension templates to create dynamic alarms diff --git a/docs/guides/step-by-step/step-06.md b/docs/guides/step-by-step/step-06.md index bb1f23494..160b1b1f6 100644 --- a/docs/guides/step-by-step/step-06.md +++ b/docs/guides/step-by-step/step-06.md @@ -1,6 +1,6 @@ <!-- title: "Step 6. Collect metrics from more services and apps" -custom_edit_url: https://github.com/netdata/netdata/edit/master/guides/docs/step-by-step/step-06.md +custom_edit_url: https://github.com/netdata/netdata/edit/master/docs/guides/step-by-step/step-06.md --> # Step 6. Collect metrics from more services and apps diff --git a/docs/store/distributed-data-architecture.md b/docs/store/distributed-data-architecture.md index dbf73f35b..0ec5c1420 100644 --- a/docs/store/distributed-data-architecture.md +++ b/docs/store/distributed-data-architecture.md @@ -1,7 +1,7 @@ <!-- title: "Distributed data architecture" description: "Netdata's distributed data architecture stores metrics on individual nodes for high performance and scalability using all your granular metrics." -custom_edit_url: https://github.com/netdata/netdata/edit/master/docs/store/distributed-data.md +custom_edit_url: https://github.com/netdata/netdata/edit/master/docs/store/distributed-data-architecture.md --> # Distributed data architecture diff --git a/health/notifications/opsgenie/README.md b/health/notifications/opsgenie/README.md index 7ae409df4..10b9f5242 100644 --- a/health/notifications/opsgenie/README.md +++ b/health/notifications/opsgenie/README.md @@ -20,10 +20,11 @@ directory](/docs/configure/nodes.md): ./edit-config health_alarm_notify.conf ``` -Change the variable `OPSGENIE_API_KEY` with the API key you got from Opsgenie. -`OPSGENIE_API_URL` defaults to https://api.opsgenie.com, however there are region specific API URLs such as https://eu.api.opsgenie.com, so set this if required. +Change the variable `OPSGENIE_API_KEY` with the API key you got from Opsgenie. `OPSGENIE_API_URL` defaults to +`https://api.opsgenie.com`, however there are region-specific API URLs such as `https://eu.api.opsgenie.com`, so set +this if required. -``` +```conf SEND_OPSGENIE="YES" # Api key diff --git a/libnetdata/clocks/README.md b/libnetdata/clocks/README.md index e4c424f39..e53b86a61 100644 --- a/libnetdata/clocks/README.md +++ b/libnetdata/clocks/README.md @@ -1 +1,5 @@ +<!-- +custom_edit_url: https://github.com/netdata/netdata/edit/master/libnetdata/clocks/README.md +--> + [](<>) diff --git a/libnetdata/dictionary/README.md b/libnetdata/dictionary/README.md index 5622b6914..234ff1845 100644 --- a/libnetdata/dictionary/README.md +++ b/libnetdata/dictionary/README.md @@ -1 +1,5 @@ +<!-- +custom_edit_url: https://github.com/netdata/netdata/edit/master/libnetdata/dictionary/README.md +--> + [](<>) diff --git a/libnetdata/ebpf/README.md b/libnetdata/ebpf/README.md index 72446eb5b..09c6607d9 100644 --- a/libnetdata/ebpf/README.md +++ b/libnetdata/ebpf/README.md @@ -1 +1,5 @@ +<!-- +custom_edit_url: https://github.com/netdata/netdata/edit/master/libnetdata/ebpf/README.md +--> + [](<>) diff --git a/libnetdata/locks/README.md b/libnetdata/locks/README.md index d06f5b0bd..b525c97f0 100644 --- a/libnetdata/locks/README.md +++ b/libnetdata/locks/README.md @@ -1 +1,5 @@ +<!-- +custom_edit_url: https://github.com/netdata/netdata/edit/master/libnetdata/locks/README.md +--> + [](<>) diff --git a/libnetdata/log/README.md b/libnetdata/log/README.md index d10f817ff..c0d7a340c 100644 --- a/libnetdata/log/README.md +++ b/libnetdata/log/README.md @@ -1 +1,5 @@ +<!-- +custom_edit_url: https://github.com/netdata/netdata/edit/master/libnetdata/log/README.md +--> + [](<>) diff --git a/libnetdata/popen/README.md b/libnetdata/popen/README.md index 63002d1cd..e51e2059b 100644 --- a/libnetdata/popen/README.md +++ b/libnetdata/popen/README.md @@ -1 +1,5 @@ +<!-- +custom_edit_url: https://github.com/netdata/netdata/edit/master/libnetdata/popen/README.md +--> + [](<>) diff --git a/libnetdata/socket/README.md b/libnetdata/socket/README.md index ee1b97cfb..6736f13bd 100644 --- a/libnetdata/socket/README.md +++ b/libnetdata/socket/README.md @@ -1 +1,5 @@ +<!-- +custom_edit_url: https://github.com/netdata/netdata/edit/master/libnetdata/socket/README.md +--> + [](<>) diff --git a/libnetdata/statistical/README.md b/libnetdata/statistical/README.md index 686299f79..ee1faba22 100644 --- a/libnetdata/statistical/README.md +++ b/libnetdata/statistical/README.md @@ -1 +1,5 @@ +<!-- +custom_edit_url: https://github.com/netdata/netdata/edit/master/libnetdata/statistical/README.md +--> + [](<>) diff --git a/libnetdata/threads/README.md b/libnetdata/threads/README.md index 478c746eb..377da5ea3 100644 --- a/libnetdata/threads/README.md +++ b/libnetdata/threads/README.md @@ -1 +1,5 @@ +<!-- +custom_edit_url: https://github.com/netdata/netdata/edit/master/libnetdata/threads/README.md +--> + [](<>) diff --git a/libnetdata/url/README.md b/libnetdata/url/README.md index 2f44d0e9a..4a95547a5 100644 --- a/libnetdata/url/README.md +++ b/libnetdata/url/README.md @@ -1 +1,5 @@ +<!-- +custom_edit_url: https://github.com/netdata/netdata/edit/master/libnetdata/url/README.md +--> + [](<>) diff --git a/netdata.spec.in b/netdata.spec.in index ea2519603..f55dcfe3d 100644 --- a/netdata.spec.in +++ b/netdata.spec.in @@ -221,7 +221,7 @@ happened, on your systems and applications. %prep %setup -q -n %{name}-%{version} export CFLAGS="${CFLAGS} -fPIC" && ${RPM_BUILD_DIR}/%{name}-%{version}/packaging/bundle-mosquitto.sh ${RPM_BUILD_DIR}/%{name}-%{version} -%if 0%{?centos_ver} >= 8 || 0%{?fedora} +%if 0%{?centos_ver} < 8 || 0%{!?fedora:1} export CFLAGS="${CFLAGS} -fPIC" && ${RPM_BUILD_DIR}/%{name}-%{version}/packaging/bundle-lws.sh ${RPM_BUILD_DIR}/%{name}-%{version} %endif # Only bundle libJudy if this isn't Fedora or SUSE @@ -239,7 +239,7 @@ autoreconf -ivf %if 0%{!?fedora:1} && 0%{!?suse_version:1} --with-libJudy=externaldeps/libJudy \ %endif - %if 0%{?centos_ver} >= 8 || 0%{?fedora} + %if 0%{?centos_ver} < 8 || 0%{!?fedora:1} --with-bundled-lws=externaldeps/libwebsockets \ %endif --prefix="%{_prefix}" \ diff --git a/packaging/version b/packaging/version index 11d6ae8ef..9bfaa7892 100644 --- a/packaging/version +++ b/packaging/version @@ -1 +1 @@ -v1.29.2 +v1.29.3 diff --git a/web/gui/dashboard_info.js b/web/gui/dashboard_info.js index 1f289ba0c..df15a6372 100644 --- a/web/gui/dashboard_info.js +++ b/web/gui/dashboard_info.js @@ -582,7 +582,11 @@ netdataDashboard.menu = { icon: '<i class="fas fa-bell"></i>', info: 'Charts showing alarm status over time. More details <a href="https://github.com/netdata/netdata/blob/master/collectors/python.d.plugin/alarms/README.md" target="_blank">here</a>.' }, - + 'statsd': { + title: 'StatsD', + icon: '<i class="fas fa-chart-line"></i>', + info:'StatsD is an industry-standard technology stack for monitoring applications and instrumenting any piece of software to deliver custom metrics. Netdata allows the user to organize the metrics in different charts and visualize any application metric easily. Read more on <a href="https://learn.netdata.cloud/docs/agent/collectors/statsd.plugin">Netdata Learn</a>.' + } }; |