
diff options
| author | Daniel Baumann <daniel.baumann@progress-linux.org> | 2021-12-01 06:15:11 +0000 |
|---|---|---|
| committer | Daniel Baumann <daniel.baumann@progress-linux.org> | 2021-12-01 06:15:11 +0000 |
| commit | 483926a283e118590da3f9ecfa75a8a4d62143ce (patch) | |
| tree | cb77052778df9a128a8cd3ff5bf7645322a13bc5 /docs | |
| parent | Releasing debian version 1.31.0-4. (diff) | |
| download | netdata-483926a283e118590da3f9ecfa75a8a4d62143ce.tar.xz netdata-483926a283e118590da3f9ecfa75a8a4d62143ce.zip | |
Merging upstream version 1.32.0.
Signed-off-by: Daniel Baumann <daniel.baumann@progress-linux.org>
Diffstat (limited to 'docs')
34 files changed, 153 insertions, 94 deletions
diff --git a/docs/Demo-Sites.md b/docs/Demo-Sites.md index 8af1282ba..5c0369c15 100644 --- a/docs/Demo-Sites.md +++ b/docs/Demo-Sites.md @@ -10,7 +10,7 @@ You can also view live demos of Netdata at **[https://www.netdata.cloud](https:/ | Location | Netdata demo URL | 60 mins reqs | VM donated by | | :------------------ | :-------------------------------------------------------------------------------------------------------------------------------------------- | :------------------------------------------------------------------------------------------------------------------------------------------------------------------------------------------------------------------------------------------------------------| :------------------------------------------------- | -| London (UK) | **[london.my-netdata.io](https://london.my-netdata.io)**<br/>(this is the global Netdata **registry** and has **named** and **mysql** charts) | [](https://london.my-netdata.io) | [DigitalOcean.com](https://m.do.co/c/83dc9f941745) | +| London (UK) | **[london3.my-netdata.io](https://london3.my-netdata.io)**<br/>(this is the global Netdata **registry** and has **named** and **mysql** charts) | [](https://london3.my-netdata.io) | [DigitalOcean.com](https://m.do.co/c/83dc9f941745) | | Atlanta (USA) | **[cdn77.my-netdata.io](https://cdn77.my-netdata.io)**<br/>(with **named** and **mysql** charts) | [](https://cdn77.my-netdata.io) | [CDN77.com](https://www.cdn77.com/) | | Israel | **[octopuscs.my-netdata.io](https://octopuscs.my-netdata.io)** | [](https://octopuscs.my-netdata.io) | [OctopusCS.com](https://www.octopuscs.com) | | Bangalore (India) | **[bangalore.my-netdata.io](https://bangalore.my-netdata.io)** | [](https://bangalore.my-netdata.io) | [DigitalOcean.com](https://m.do.co/c/83dc9f941745) | diff --git a/docs/Running-behind-lighttpd.md b/docs/Running-behind-lighttpd.md index 864915800..1e86f334f 100644 --- a/docs/Running-behind-lighttpd.md +++ b/docs/Running-behind-lighttpd.md @@ -14,7 +14,7 @@ $HTTP["url"] =~ "^/netdata/" { } ``` -If you have older lighttpd you have to use a chain (such as bellow), as explained [at this stackoverflow answer](http://stackoverflow.com/questions/14536554/lighttpd-configuration-to-proxy-rewrite-from-one-domain-to-another). +If you have older lighttpd you have to use a chain (such as below), as explained [at this stackoverflow answer](http://stackoverflow.com/questions/14536554/lighttpd-configuration-to-proxy-rewrite-from-one-domain-to-another). ```txt $HTTP["url"] =~ "^/netdata/" { diff --git a/docs/agent-cloud.md b/docs/agent-cloud.md index 061b8472d..fcec10af8 100644 --- a/docs/agent-cloud.md +++ b/docs/agent-cloud.md @@ -28,7 +28,7 @@ Cloud](https://user-images.githubusercontent.com/1153921/80828986-1ebb3b00-8b9b- [Read more about Netdata Cloud](https://learn.netdata.cloud/docs/cloud/) to better understand how it gives you real-time visibility into your entire infrastructure, and why you might consider using it. -Next, [get started in 5 minutes](https://learn.netdata.cloud/docs/cloud/get-started/), or read our [claiming +Next, [get started in 5 minutes](https://learn.netdata.cloud/docs/cloud/get-started/), or read our [connection to Cloud reference](/claim/README.md) for a complete investigation of Cloud's security and encryption features, plus instructions for Docker containers. @@ -72,8 +72,8 @@ about how you might want to use or configure Cloud, we recommend the following: - Get an overview of Cloud's features by reading [Cloud documentation](https://learn.netdata.cloud/docs/cloud/). - Follow the 5-minute [get started with Cloud](https://learn.netdata.cloud/docs/cloud/get-started/) guide to finish - onboarding and claim your first nodes. -- Better understand how agents connect securely to the Cloud with [claiming](/claim/README.md) and [Agent-Cloud + onboarding and connect your first nodes. +- Better understand how agents connect securely to the Cloud with [connect agent to Cloud](/claim/README.md) and [Agent-Cloud link](/aclk/README.md) documentation. []() diff --git a/docs/anonymous-statistics.md b/docs/anonymous-statistics.md index 27b48e13c..75e586bd4 100644 --- a/docs/anonymous-statistics.md +++ b/docs/anonymous-statistics.md @@ -7,7 +7,13 @@ custom_edit_url: https://github.com/netdata/netdata/edit/master/docs/anonymous-s # Anonymous statistics -Netdata collects anonymous usage information by default using the open-source product analytics platform [PostHog](https://github.com/PostHog/posthog). We self-host our PostHog instance, which means your data is never sent or processed by any third parties outside of the Netdata infrastructure. We use the statistics gathered from this information for two purposes: +By default, Netdata collects anonymous usage information from the open-source monitoring agent using the open-source +product analytics platform [PostHog](https://github.com/PostHog/posthog). We self-host our PostHog instance, which means +your data is never sent or processed by any third parties outside of the Netdata infrastructure. + +We are strongly committed to your [data privacy](https://netdata.cloud/data-privacy/). + +We use the statistics gathered from this information for two purposes: 1. **Quality assurance**, to help us understand if Netdata behaves as expected, and to help us classify repeated issues with certain distributions or environments. @@ -62,7 +68,7 @@ Starting with v1.21, we additionally collect information about: - Failures to build the dependencies required to use Cloud features. - Unavailability of Cloud features in an agent. -- Failures to connect to the Cloud in case the agent has been [claimed](/claim/README.md). This includes error codes +- Failures to connect to the Cloud in case the [connection process](/claim/README.md) has been completed. This includes error codes to inform the Netdata team about the reason why the connection failed. To see exactly what and how is collected, you can review the script template `daemon/anonymous-statistics.sh.in`. The diff --git a/docs/configure/nodes.md b/docs/configure/nodes.md index a721c73c4..8399e89d9 100644 --- a/docs/configure/nodes.md +++ b/docs/configure/nodes.md @@ -18,9 +18,10 @@ anomaly, or change in infrastructure affects how their Agents should perform. ## The Netdata config directory -On most Linux systems, using our [recommended one-line installation](/docs/get/README.md#install-the-netdata-agent), the -**Netdata config directory** is `/etc/netdata/`. The config directory contains several configuration files with the -`.conf` extension, a few directories, and a shell script named `edit-config`. +On most Linux systems, using our [recommended one-line +installation](/docs/get-started.mdx#install-on-linux-with-one-line-installer-recommended), the **Netdata config +directory** is `/etc/netdata/`. The config directory contains several configuration files with the `.conf` extension, a +few directories, and a shell script named `edit-config`. > Some operating systems will use `/opt/netdata/etc/netdata/` as the config directory. If you're not sure where yours > is, navigate to `http://NODE:19999/netdata.conf` in your browser, replacing `NODE` with the IP address or hostname of diff --git a/docs/configure/secure-nodes.md b/docs/configure/secure-nodes.md index 704db35a3..180ffe357 100644 --- a/docs/configure/secure-nodes.md +++ b/docs/configure/secure-nodes.md @@ -34,7 +34,7 @@ that align with your goals and your organization's standards. ## Disable the local dashboard -This is the _recommended method for those who have claimed their nodes to Netdata Cloud_ and prefer viewing real-time +This is the _recommended method for those who have connected their nodes to Netdata Cloud_ and prefer viewing real-time metrics using the War Room Overview, Nodes view, and Cloud dashboards. You can disable the local dashboard (and API) but retain the encrypted Agent-Cloud link ([ACLK](/aclk/README.md)) that diff --git a/docs/contributing/style-guide.md b/docs/contributing/style-guide.md index faa6fc62b..625237bc0 100644 --- a/docs/contributing/style-guide.md +++ b/docs/contributing/style-guide.md @@ -469,7 +469,7 @@ The following tables describe the standard spelling, capitalization, and usage o | Term | Definition | |-----------------------------|-----------------------------------------------------------------------------------------------------------------------------------------------------------------------------------------------------------------------------------------------------------------------------------------------------------------------------------------------------------------------------------------------------------------------| -| **claimed node** | A node that you've proved ownership of by completing the [claiming process](/claim/README.md). The claimed node will then appear in your Space and any War Rooms you added it to. | +| **claimed node** | A node that you've proved ownership of by completing the [connecting to Cloud process](/claim/README.md). The claimed node will then appear in your Space and any War Rooms you added it to. | | **Netdata** | The company behind the open-source Netdata Agent and the Netdata Cloud web application. Never use _netdata_ or _NetData_. <br /><br />In general, focus on the user's goals, actions, and solutions rather than what the company provides. For example, write _Learn more about enabling alarm notifications on your preferred platforms_ instead of _Netdata sends alarm notifications to your preferred platforms_. | | **Netdata Agent** | The free and open source [monitoring agent](https://github.com/netdata/netdata) that you can install on all of your distributed systems, whether they're physical, virtual, containerized, ephemeral, and more. The Agent monitors systems running Linux, Docker, Kubernetes, macOS, FreeBSD, and more, and collects metrics from hundreds of popular services and applications. | | **Netdata Cloud** | The web application hosted at [https://app.netdata.cloud](https://app.netdata.cloud) that helps you monitor an entire infrastructure of distributed systems in real time. <br /><br />Never use _Cloud_ without the preceding _Netdata_ to avoid ambiguity. | @@ -477,7 +477,7 @@ The following tables describe the standard spelling, capitalization, and usage o | **Netdata community forum** | The Discourse-powered forum for feature requests, Netdata Cloud technical support, and conversations about Netdata's monitoring and troubleshooting products. | | **node** | A system on which the Netdata Agent is installed. The system can be physical, virtual, in a Docker container, and more. Depending on your infrastructure, you may have one, dozens, or hundreds of nodes. Some nodes are _ephemeral_, in that they're created/destroyed automatically by an orchestrator service. | | **Space** | The highest level container within Netdata Cloud for a user to organize their team members and nodes within their infrastructure. A Space likely represents an entire organization or a large team. <br /><br />_Space_ is always capitalized. | -| **unreachable node** | A claimed node with a disrupted [Agent-Cloud link](/aclk/README.md). Unreachable could mean the node no longer exists or is experiencing network connectivity issues with Cloud. | +| **unreachable node** | A connected node with a disrupted [Agent-Cloud link](/aclk/README.md). Unreachable could mean the node no longer exists or is experiencing network connectivity issues with Cloud. | | **visited node** | A node which has had its Agent dashboard directly visited by a user. A list of these is maintained on a per-user basis. | | **War Room** | A smaller grouping of nodes where users can view key metrics in real-time and monitor the health of many nodes with their alarm status. War Rooms can be used to organize nodes in any way that makes sense for your infrastructure, such as by a service, purpose, physical location, and more. <br /><br />_War Room_ is always capitalized. | diff --git a/docs/dashboard/customize.mdx b/docs/dashboard/customize.mdx index f3a8f805a..2c82a1c50 100644 --- a/docs/dashboard/customize.mdx +++ b/docs/dashboard/customize.mdx @@ -25,7 +25,7 @@ Here are a few popular settings: ### Change chart legend position Find this setting under the **Visual** tab. By default, Netdata places the [legend of -dimensions](/docs/dashboards/charts-dimensions-contexts-families.mdx#dimensions) _below_ charts. Click this toggle to +dimensions](/docs/dashboard/dimensions-contexts-families.mdx#dimensions) _below_ charts. Click this toggle to move the legend to the _right_ of charts. ### Change theme @@ -88,6 +88,6 @@ dashboards](/web/gui/custom/README.md) with HTML, CSS, and JavaScript. - [How the dashboard works](/docs/dashboard/how-dashboard-works.mdx) - [Interact with charts](/docs/dashboard/interact-charts.mdx) - [Chart dimensions, contexts, and families](/docs/dashboard/dimensions-contexts-families.mdx) - - [Select timeframes to visualize](/docs/dashboard/select-timeframes.mdx) + - [Select timeframes to visualize](/docs/dashboard/visualization-date-and-time-controls.mdx) - [Import, export, and print a snapshot](/docs/dashboard/import-export-print-snapshot.mdx) - **[Customize the standard dashboard](/docs/dashboard/customize.mdx)** diff --git a/docs/dashboard/dimensions-contexts-families.mdx b/docs/dashboard/dimensions-contexts-families.mdx index 49438bf2d..da9aad78f 100644 --- a/docs/dashboard/dimensions-contexts-families.mdx +++ b/docs/dashboard/dimensions-contexts-families.mdx @@ -79,7 +79,7 @@ names: ## What's next? With an understanding of a chart's dimensions, context, and family, you're now ready to dig even deeper into Netdata's -dashboard. We recommend looking into [using the timeframe selector](/docs/dashboard/select-timeframes.mdx). +dashboard. We recommend looking into [using the timeframe selector](/docs/dashboard/visualization-date-and-time-controls.mdx). If you feel comfortable with the [dashboard](/docs/dashboard/how-dashboard-works.mdx) and interacting with charts, we recommend learning about [configuration](/docs/configure/nodes.md). While Netdata doesn't _require_ a complicated setup @@ -91,6 +91,6 @@ process or a query language to create charts, there are a lot of ways to tweak t - [How the dashboard works](/docs/dashboard/how-dashboard-works.mdx) - [Interact with charts](/docs/dashboard/interact-charts.mdx) - **[Chart dimensions, contexts, and families](/docs/dashboard/dimensions-contexts-families.mdx)** - - [Select timeframes to visualize](/docs/dashboard/select-timeframes.mdx) + - [Select timeframes to visualize](/docs/dashboard/visualization-date-and-time-controls.mdx) - [Import, export, and print a snapshot](/docs/dashboard/import-export-print-snapshot.mdx) - [Customize the standard dashboard](/docs/dashboard/customize.mdx) diff --git a/docs/dashboard/how-dashboard-works.mdx b/docs/dashboard/how-dashboard-works.mdx index 00c5df33b..315614d69 100644 --- a/docs/dashboard/how-dashboard-works.mdx +++ b/docs/dashboard/how-dashboard-works.mdx @@ -105,7 +105,7 @@ organizes its dashboard and operates [alarms](/docs/monitor/configure-alarms.md) - **[How the dashboard works](/docs/dashboard/how-dashboard-works.mdx)** - [Interact with charts](/docs/dashboard/interact-charts.mdx) - [Chart dimensions, contexts, and families](/docs/dashboard/dimensions-contexts-families.mdx) - - [Select timeframes to visualize](/docs/dashboard/select-timeframes.mdx) + - [Select timeframes to visualize](/docs/dashboard/visualization-date-and-time-controls.mdx) - [Import, export, and print a snapshot](/docs/dashboard/import-export-print-snapshot.mdx) - [Customize the standard dashboard](/docs/dashboard/customize.mdx) - [HTTP API](/web/api/README.md) diff --git a/docs/dashboard/import-export-print-snapshot.mdx b/docs/dashboard/import-export-print-snapshot.mdx index b5488914a..7e94a52c8 100644 --- a/docs/dashboard/import-export-print-snapshot.mdx +++ b/docs/dashboard/import-export-print-snapshot.mdx @@ -13,8 +13,8 @@ paper. Snapshots can be incredibly useful for diagnosing anomalies after they've already happened. Let's say Netdata triggered a warning alarm while you were asleep. In the morning, you can [pick the -timeframe](/docs/dashboards/pick-timeframes.mdx) when the alarm triggered, export a snapshot, and send it to a colleague -for further analysis. +timeframe](/docs/dashboard/visualization-date-and-time-controls.mdx) when the alarm triggered, export a snapshot, and send it to a +colleague for further analysis. Or, send the Netdata team a snapshot of your dashboard when [filing a bug report](https://github.com/netdata/netdata/issues/new?assignees=&labels=bug%2C+needs+triage&template=bug_report.md) on @@ -39,7 +39,7 @@ Some caveats and tips to keep in mind: - Only metrics in the export timeframe are available to you. If you zoom out or pan through time, you'll see the beginning and end of the snapshot. -- Charts won't update with new inforamtion, as you're looking at a static replica, not the live dashboard. +- Charts won't update with new information, as you're looking at a static replica, not the live dashboard. - The import is only temporary. Reload your browser tab to return to your node's real-time dashboard. ## Export a snapshot @@ -78,6 +78,6 @@ dashboards](/web/gui/custom/README.md). - [How the dashboard works](/docs/dashboard/how-dashboard-works.mdx) - [Interact with charts](/docs/dashboard/interact-charts.mdx) - [Chart dimensions, contexts, and families](/docs/dashboard/dimensions-contexts-families.mdx) - - [Select timeframes to visualize](/docs/dashboard/select-timeframes.mdx) + - [Select timeframes to visualize](/docs/dashboard/visualization-date-and-time-controls.mdx) - **[Import, export, and print a snapshot](/docs/dashboard/import-export-print-snapshot.mdx)** - [Customize the standard dashboard](/docs/dashboard/customize.mdx)
\ No newline at end of file diff --git a/docs/dashboard/interact-charts.mdx b/docs/dashboard/interact-charts.mdx index 2266e101e..5633bd080 100644 --- a/docs/dashboard/interact-charts.mdx +++ b/docs/dashboard/interact-charts.mdx @@ -7,6 +7,9 @@ custom_edit_url: https://github.com/netdata/netdata/edit/master/docs/dashboard/i # Interact with charts +> ⚠️ There is a new version of charts that is currently **only** available on [Netdata Cloud](https://learn.netdata.cloud/docs/cloud/visualize/interact-new-charts). We didn't +> want to keep this valuable feature from you, so after we get this into your hands on the Cloud, we will collect and implement your feedback to make sure we are providing the best possible version of the feature on the Netdata Agent dashboard as quickly as possible. + While charts that update every second with new metrics are helpful for understanding the immediate state of a node, deep troubleshooting and root cause analysis begins by manipulating the default charts. To help you troubleshoot, Netdata synchronizes every chart every time you interact with one of them. @@ -119,7 +122,7 @@ are, respectively, `Pan Left`, `Reset`, `Pan Right`, `Zoom In`, and `Zoom Out`. We recommend you read up on the differences between [chart dimensions, contexts, and families](/docs/dashboard/dimensions-contexts-families.mdx) to complete your understanding of how Netdata organizes its dashboards. Another valuable way to interact with charts is to use the [timeframe -selector](/docs/dashboard/select-timeframes.mdx), which helps you visualize specific moments of historical metrics. +selector](/docs/dashboard/visualization-date-and-time-controls.mdx), which helps you visualize specific moments of historical metrics. If you feel comfortable with the [dashboard](/docs/dashboard/how-dashboard-works.mdx) and interacting with charts, we recommend moving on to learning about [configuration](/docs/configure/nodes.md). While Netdata doesn't _require_ a @@ -130,8 +133,8 @@ your needs. - Dashboard - [How the dashboard works](/docs/dashboard/how-dashboard-works.mdx) - - **[Interact with charts](/docs/dashboard/interact-charts.mdx)** + - [Netdata Cloud · Interact with new charts](https://learn.netdata.cloud/docs/cloud/visualize/interact-new-charts) - [Chart dimensions, contexts, and families](/docs/dashboard/dimensions-contexts-families.mdx) - - [Select timeframes to visualize](/docs/dashboard/select-timeframes.mdx) + - [Select timeframes to visualize](/docs/dashboard/visualization-date-and-time-controls.mdx) - [Import, export, and print a snapshot](/docs/dashboard/import-export-print-snapshot.mdx) - [Customize the standard dashboard](/docs/dashboard/customize.mdx) diff --git a/docs/dashboard/select-timeframes.mdx b/docs/dashboard/visualization-date-and-time-controls.mdx index ac1b3f7c7..fe3e51091 100644 --- a/docs/dashboard/select-timeframes.mdx +++ b/docs/dashboard/visualization-date-and-time-controls.mdx @@ -1,13 +1,17 @@ --- -title: "Select timeframes to visualize" -description: "Netdata's dashboard features a rich timeframe selector, with useful defaults and rich customization, to help you narrow your focus when troubleshooting issues or anomalies." +title: "Visualization date and time controls" +description: "Netdata's dashboard features powerful date visualization controls that include a time control (play, pause, force play), a timezone selector and a rich date and timeframe selector, with useful defaults and rich customization, to help you narrow your focus when troubleshooting issues or anomalies." type: how-to -custom_edit_url: https://github.com/netdata/netdata/edit/master/docs/dashboard/select-timeframes.mdx +custom_edit_url: https://github.com/netdata/netdata/edit/master/docs/dashboard/visualization-date-and-time-controls.mdx --- -# Pick timeframes to visualize +# Visualization date and time controls -While [panning through time and zooming in/out](/docs/dashboard/interact-charts.mdx) from charts is helpful when +## Date and time selector + +### Pick timeframes to visualize + +While [panning through time and zooming in/out](/docs/dashboard/interact-charts.mdx) from charts it is helpful when you're looking a recent history, or want to do granular troubleshooting, what if you want to see metrics from 6 hours ago? Or 6 days? @@ -15,7 +19,7 @@ Netdata's dashboard features a **timeframe selector** to help you visualize spec By default, it shows a certain number of minutes of historical metrics based on the your browser's viewport to ensure it's always showing per-second granularity. -## Open the timeframe selector +#### Open the timeframe selector To visualize a new timeframe, you need to open the picker, which appears just above the menu, near the top-right cover of the dashboard. @@ -26,7 +30,7 @@ dashboard](https://user-images.githubusercontent.com/1153921/101507784-2c585080- The **Clear** button resets the dashboard back to its default state based on your browser viewport, and **Apply** closes the picker and shifts all charts to the selected timeframe. -## Use the Quick Selector +#### Use the Quick Selector Click any of the following options in the **Quick Selector** to choose a commonly-used timeframe. @@ -38,16 +42,49 @@ Click any of the following options in the **Quick Selector** to choose a commonl Click **Apply** to see metrics from your selected timeframe. -## Choose a specific interval +#### Choose a specific interval Beneath the Quick Selector is an input field and dropdown you use in combination to select a specific timeframe of minutes, hours, days, or months. Enter a number and choose the appropriate unit of time, then click **Apply**. -## Choose multiple days +#### Choose multiple days Use the calendar to select multiple days. Click on a date to begin the timeframe selection, then an ending date. The timeframe begins at noon on the beginning and end dates. Click **Apply** to see your selected multi-day timeframe. +## Time controls + +The time control provides you the following options: **Play**, **Pause** and **Force Play**. +* **Play** - the content of the page will be automatically refreshed while this is in the foreground +* **Pause** - the content of the page isn't refreshed due to a manual request to pause it or, for example, when your investigating data on a +chart (cursor is on top of a chart) +* **Force Play** - the content of the page will be automatically refreshed even if this is in the background + +With this, we aim to bring more clarity and allow you to distinguish if the content you are looking at is live or historical and also allow you + to always refresh the content of the page when the tabs are in the background. + +Main use cases for **Force Play**: +* You use a terminal or deployment tools to do changes in your infra and want to see immediately, Netdata is in the background, displaying the impact +of these changes +* You want to have Netdata on the background, example displayed on a TV, to constantly see metrics through dashboards or to watch the alert +status + +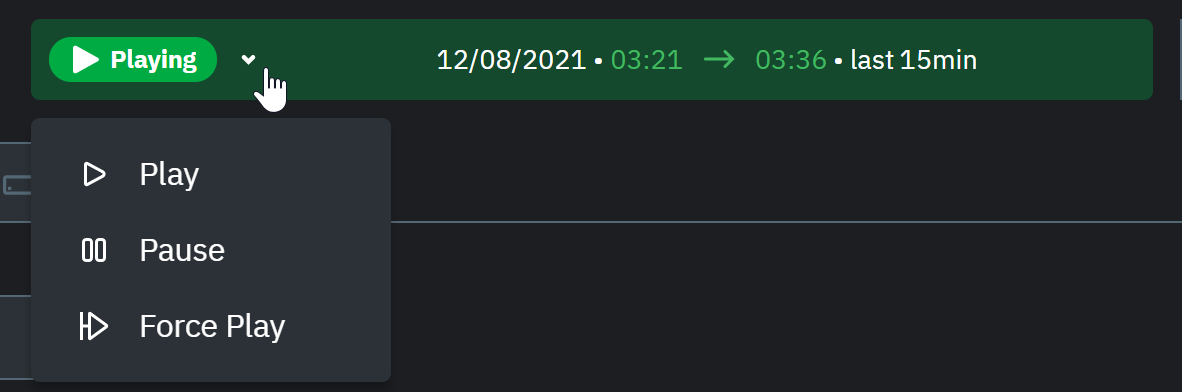 + +## Timezone selector + +With the timezone selector, you have the ability to change the timezone on Netdata Cloud. More often than not teams are +distributed in different timezones and they need to collaborate. + +Our goal is to make it easier for you and your teams to troubleshoot based on your timezone preference and communicate easily +with varying timezones and timeframes without the need to be concerned about their specificity. + +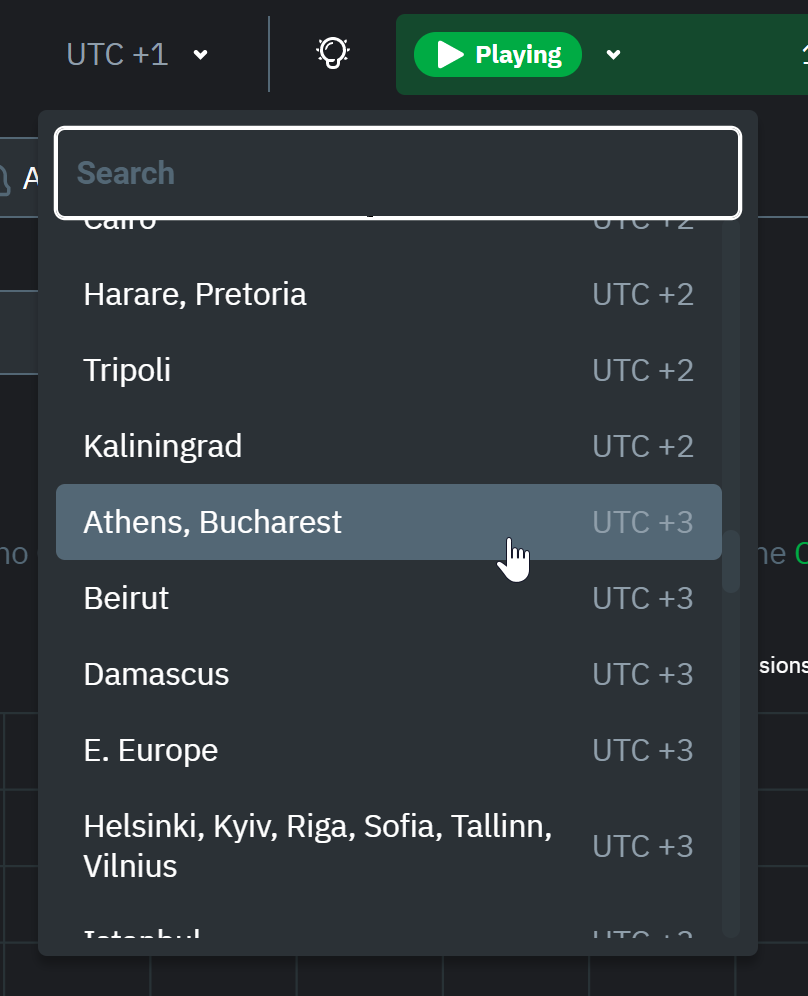 + +When you change the timezone all the date and time fields will be updated to be displayed according to the specified timezone, this goes from +charts to alerts information and across the Netdata Cloud. + ## Caveats and considerations **Longer timeframes will decrease metrics granularity**. At the default timeframe, based on your browser viewport, each @@ -74,12 +111,11 @@ into any other Netdata dashboard. There are also many ways to [customize](/docs/dashboard/customize.mdx) the standard dashboard experience, from changing the theme to editing the text that accompanies every section of charts. -### Further reading & related information +## Further reading & related information - Dashboard - [How the dashboard works](/docs/dashboard/how-dashboard-works.mdx) - [Interact with charts](/docs/dashboard/interact-charts.mdx) - [Chart dimensions, contexts, and families](/docs/dashboard/dimensions-contexts-families.mdx) - - **[Select timeframes to visualize](/docs/dashboard/select-timeframes.mdx)** - [Import, export, and print a snapshot](/docs/dashboard/import-export-print-snapshot.mdx) - [Customize the standard dashboard](/docs/dashboard/customize.mdx) diff --git a/docs/get-started.mdx b/docs/get-started.mdx index ef1d3f9a6..562c587ef 100644 --- a/docs/get-started.mdx +++ b/docs/get-started.mdx @@ -11,7 +11,7 @@ import { Install, InstallBox } from '../src/components/Install/' # Get started with Netdata -Netdata is an free and open-source (FOSS) monitoring agent that collects thousands of hardware and software metrics from +Netdata is a free and open-source (FOSS) monitoring agent that collects thousands of hardware and software metrics from any physical or virtual system (we call them _nodes_) and organizes them in an easy-to-use and -navigate interface. Together with [Netdata Cloud](https://learn.netdata.cloud/docs/cloud), you can monitor your entire infrastructure in diff --git a/docs/getting-started.md b/docs/getting-started.md index e80b80eed..2d1f3de6d 100644 --- a/docs/getting-started.md +++ b/docs/getting-started.md @@ -203,7 +203,7 @@ You can use these features together or separately—the decision is up to yo - Sign up for [Netdata Cloud](https://app.netdata.cloud). - Read the [infrastructure monitoring quickstart](/docs/quickstart/infrastructure.md). -- Better understand how the Netdata Agent connects securely to Netdata Cloud with [claiming](/claim/README.md) and +- Better understand how the Netdata Agent connects securely to Netdata Cloud with [connection process](/claim/README.md) and [Agent-Cloud link](/aclk/README.md) documentation. ## Start, stop, and restart Netdata @@ -221,7 +221,7 @@ details. ## What's next? Even after you've configured `netdata.conf`, tweaked alarms, learned the basics of performance troubleshooting, and -claimed all your systems in Netdata Cloud or added them to the Visited nodes menu, you've just gotten started with +connected all your systems in Netdata Cloud or added them to the Visited nodes menu, you've just gotten started with Netdata. Take a look at some more advanced features and configurations: diff --git a/docs/guides/deploy/ansible.md b/docs/guides/deploy/ansible.md index 8298fd00c..f7bf514e2 100644 --- a/docs/guides/deploy/ansible.md +++ b/docs/guides/deploy/ansible.md @@ -7,11 +7,11 @@ custom_edit_url: https://github.com/netdata/netdata/edit/master/docs/guides/depl # Deploy Netdata with Ansible -Netdata's [one-line kickstart](https://learn.netdata.cloud/docs/get) is zero-configuration, highly adaptable, and -compatible with tons of different operating systems and Linux distributions. You can use it on bare metal, VMs, -containers, and everything in-between. +Netdata's [one-line kickstart](/docs/get-started.mdx) is zero-configuration, highly adaptable, and compatible with tons +of different operating systems and Linux distributions. You can use it on bare metal, VMs, containers, and everything +in-between. -But what if you're trying to bootstrap an infrastructure monitoring solution as quickly as possible. What if you need to +But what if you're trying to bootstrap an infrastructure monitoring solution as quickly as possible? What if you need to deploy Netdata across an entire infrastructure with many nodes? What if you want to make this deployment reliable, repeatable, and idempotent? What if you want to write and deploy your infrastructure or cloud monitoring system like code? @@ -22,7 +22,7 @@ those operations over standard and secure SSH connections. There's no agent to i have to worry about is your application and your monitoring software. Ansible has some competition from the likes of [Puppet](https://puppet.com/) or [Chef](https://www.chef.io/), but the -most valuable feature about Ansible is that every is **idempotent**. From the [Ansible +most valuable feature about Ansible is **idempotent**. From the [Ansible glossary](https://docs.ansible.com/ansible/latest/reference_appendices/glossary.html) > An operation is idempotent if the result of performing it once is exactly the same as the result of performing it @@ -33,7 +33,7 @@ operate. When you deploy Netdata with Ansible, you're also deploying _monitoring In this guide, we'll walk through the process of using an [Ansible playbook](https://github.com/netdata/community/tree/main/netdata-agent-deployment/ansible-quickstart) to automatically -deploy the Netdata Agent to any number of distributed nodes, manage the configuration of each node, and claim them to +deploy the Netdata Agent to any number of distributed nodes, manage the configuration of each node, and connect them to your Netdata Cloud account. You'll go from some unmonitored nodes to a infrastructure monitoring solution in a matter of minutes. @@ -98,7 +98,7 @@ two different SSH keys supplied by AWS. ### Edit the `vars/main.yml` file -In order to claim your node(s) to your Space in Netdata Cloud, and see all their metrics in real-time in [composite +In order to connect your node(s) to your Space in Netdata Cloud, and see all their metrics in real-time in [composite charts](/docs/visualize/overview-infrastructure.md) or perform [Metric Correlations](https://learn.netdata.cloud/docs/cloud/insights/metric-correlations), you need to set the `claim_token` and `claim_room` variables. @@ -120,7 +120,7 @@ claim_rooms: XXXXX Change the `dbengine_multihost_disk_space` if you want to change the metrics retention policy by allocating more or less disk space for storing metrics. The default is 2048 Mib, or 2 GiB. -Because we're claiming this node to Netdata Cloud, and will view its dashboards there instead of via the IP address or +Because we're connecting this node to Netdata Cloud, and will view its dashboards there instead of via the IP address or hostname of the node, the playbook disables that local dashboard by setting `web_mode` to `none`. This gives a small security boost by not allowing any unwanted access to the local dashboard. @@ -147,7 +147,7 @@ Next, Ansible makes changes to each node according to the `tasks` defined in the [returns](https://docs.ansible.com/ansible/latest/reference_appendices/common_return_values.html#changed) whether each task results in a changed, failure, or was skipped entirely. -The task to install Netdata will take a few minutes per node, so be patient! Once the playbook reaches the claiming +The task to install Netdata will take a few minutes per node, so be patient! Once the playbook reaches the connect to Cloud task, your nodes start populating your Space in Netdata Cloud. ## What's next? diff --git a/docs/guides/monitor-cockroachdb.md b/docs/guides/monitor-cockroachdb.md index 0ff9f3c77..0307381e3 100644 --- a/docs/guides/monitor-cockroachdb.md +++ b/docs/guides/monitor-cockroachdb.md @@ -13,7 +13,7 @@ maximum granularity using Netdata. Collect more than 50 unique metrics and put t designed for better visual anomaly detection. Netdata itself uses CockroachDB as part of its Netdata Cloud infrastructure, so we're happy to introduce this new -collector and help others get started with it straightaway. +collector and help others get started with it straight away. Let's dive in and walk through the process of monitoring CockroachDB metrics with Netdata. diff --git a/docs/guides/monitor/anomaly-detection.md b/docs/guides/monitor/anomaly-detection.md index f680f5f2e..2d8b6d1d6 100644 --- a/docs/guides/monitor/anomaly-detection.md +++ b/docs/guides/monitor/anomaly-detection.md @@ -23,7 +23,7 @@ library](https://github.com/yzhao062/pyod/tree/master), which periodically runs quantify how anomalous certain charts are. All these metrics and alarms are available for centralized monitoring in [Netdata Cloud](https://app.netdata.cloud). If -you choose to sign up for Netdata Cloud and [claim your nodes](/claim/README.md), you will have the ability to run +you choose to sign up for Netdata Cloud and [coonect your nodes](/claim/README.md), you will have the ability to run tailored anomaly detection on every node in your infrastructure, regardless of its purpose or workload. In this guide, you'll learn how to set up the anomalies collector to instantly detect anomalies in an Nginx web server @@ -123,7 +123,7 @@ configure the collector to monitor charts from the log](https://learn.netdata.cloud/docs/agent/collectors/go.d.plugin/modules/weblog) collectors. `charts_regex` allows for some basic regex, such as wildcards (`*`) to match all contexts with a certain pattern. For -example, `system\..*` matches with any chart wit ha context that begins with `system.`, and ends in any number of other +example, `system\..*` matches with any chart with a context that begins with `system.`, and ends in any number of other characters (`.*`). Note the escape character (`\`) around the first period to capture a period character exactly, and not any character. diff --git a/docs/guides/monitor/kubernetes-k8s-netdata.md b/docs/guides/monitor/kubernetes-k8s-netdata.md index c5cb2c1bc..5d4886e68 100644 --- a/docs/guides/monitor/kubernetes-k8s-netdata.md +++ b/docs/guides/monitor/kubernetes-k8s-netdata.md @@ -45,9 +45,9 @@ To follow this tutorial, you need: - A free Netdata Cloud account. [Sign up](https://app.netdata.cloud/sign-up?cloudRoute=/spaces) if you don't have one already. -- A working cluster running Kubernetes v1.9 or newer, with a Netdata deployment and claimed parent/child nodes. See +- A working cluster running Kubernetes v1.9 or newer, with a Netdata deployment and connected parent/child nodes. See our [Kubernetes deployment process](/packaging/installer/methods/kubernetes.md) for details on deployment and - claiming. + conneting to Cloud. - The [`kubectl`](https://kubernetes.io/docs/reference/kubectl/overview/) command line tool, within [one minor version difference](https://kubernetes.io/docs/tasks/tools/install-kubectl/#before-you-begin) of your cluster, on an administrative system. @@ -98,10 +98,10 @@ robot-shop web-8bb887476-lkcjx 1/1 Running 0 14m ## Explore Netdata's Kubernetes monitoring charts The Netdata Helm chart deploys and enables everything you need for monitoring Kubernetes on every layer. Once you deploy -Netdata and claim your cluster's nodes, you're ready to check out the visualizations **with zero configuration**. +Netdata and connect your cluster's nodes, you're ready to check out the visualizations **with zero configuration**. To get started, [sign in](https://app.netdata.cloud/sign-in?cloudRoute=/spaces) to your Netdata Cloud account. Head over -to the War Room you claimed your cluster to, if not **General**. +to the War Room you connected your cluster to, if not **General**. Netdata Cloud is already visualizing your Kubernetes metrics, streamed in real-time from each node, in the [Overview](https://learn.netdata.cloud/docs/cloud/visualize/overview): diff --git a/docs/guides/monitor/lamp-stack.md b/docs/guides/monitor/lamp-stack.md index 95aa03f0b..38b9d0bef 100644 --- a/docs/guides/monitor/lamp-stack.md +++ b/docs/guides/monitor/lamp-stack.md @@ -167,7 +167,7 @@ If the Netdata Agent isn't already open in your browser, open a new tab and navi > If you [signed up](https://app.netdata.cloud/sign-up?cloudRoute=/spaces) for Netdata Cloud earlier, you can also view > the exact same LAMP stack metrics there, plus additional features, like drag-and-drop custom dashboards. Be sure to -> [claim your node](/claim/README.md) to start streaming metrics to your browser through Netdata Cloud. +> [connecting your node](/claim/README.md) to start streaming metrics to your browser through Netdata Cloud. Netdata automatically organizes all metrics and charts onto a single page for easy navigation. Peek at gauges to see overall system performance, then scroll down to see more. Click-and-drag with your mouse to pan _all_ charts back and diff --git a/docs/guides/monitor/statsd.md b/docs/guides/monitor/statsd.md index 120715b19..e4f04c575 100644 --- a/docs/guides/monitor/statsd.md +++ b/docs/guides/monitor/statsd.md @@ -22,14 +22,15 @@ In general, the process for creating a StatsD collector can be summarized in 2 s - Run an experiment by sending StatsD metrics to Netdata, without any prior configuration. This will create a chart per metric (called private charts) and will help you verify that everything works as expected from the application side of things. - Make sure to reload the dashboard tab **after** you start sending data to Netdata. -- Create a configuration file for your app using [edit-config](https://learn.netdata.cloud/guides/step-by-step/step-04): `sudo ./edit-config statsd.d/myapp.conf` +- Create a configuration file for your app using [edit-config](/docs/configure/nodes.md): `sudo ./edit-config + statsd.d/myapp.conf` - Each app will have it's own section in the right-hand menu. Now, let's see the above process in detail. ## Prerequisites -- A node with the [Netdata Agent](https://learn.netdata.cloud/docs/get#install-the-netdata-agent) installed. +- A node with the [Netdata](/docs/get-started.mdx) installed. - An application to instrument. For this guide, that will be [k6](https://k6.io/docs/getting-started/installation). ## Understanding the metrics @@ -110,7 +111,7 @@ Find more details about family and context in our [documentation](/web/README.md Now, having decided on how we are going to group the charts, we need to define how we are going to group metrics into different charts. This is particularly important, since we decide: - What metrics **not** to show, since they are not useful for our use-case. -- What metrics to consolidate into the same charts, so as to reduce noice and increase visual correlation. +- What metrics to consolidate into the same charts, so as to reduce noise and increase visual correlation. The dimension option has this syntax: `dimension = [pattern] METRIC NAME TYPE MULTIPLIER DIVIDER OPTIONS` diff --git a/docs/guides/python-collector.md b/docs/guides/python-collector.md index 0478bffe0..b8facd9f0 100644 --- a/docs/guides/python-collector.md +++ b/docs/guides/python-collector.md @@ -24,7 +24,7 @@ prebuilt method for collecting your required metric data. In this tutorial, you'll learn how to leverage the [Python programming language](https://www.python.org/) to build a custom data collector for the Netdata Agent. Follow along with your own dataset, using the techniques and best practices -covered here, or use the included examples for collecting and organizing eithre random or weather data. +covered here, or use the included examples for collecting and organizing either random or weather data. ## What you need to get started @@ -48,7 +48,7 @@ The basic elements of a Netdata collector are: - `ORDER[]`: A list containing the charts to be displayed. - `CHARTS{}`: A dictionary containing the details for the charts to be displayed. - `data{}`: A dictionary containing the values to be displayed. -- `get_data()`: The basic function of the plugin which will retrun to Netdata the correct values. +- `get_data()`: The basic function of the plugin which will return to Netdata the correct values. Let's walk through these jobs and elements as independent elements first, then apply them to example Python code. @@ -138,7 +138,7 @@ correct values. The `python.d` plugin has a number of framework classes that can be used to speed up the development of your python collector. Your class can inherit one of these framework classes, which have preconfigured methods. -For example, the snippet bellow is from the [RabbitMQ +For example, the snippet below is from the [RabbitMQ collector](https://github.com/netdata/netdata/blob/91f3268e9615edd393bd43de4ad8068111024cc9/collectors/python.d.plugin/rabbitmq/rabbitmq.chart.py#L273). This collector uses an HTTP endpoint and uses the `UrlService` framework class, which only needs to define an HTTP endpoint for data collection. @@ -298,7 +298,7 @@ class Service(SimpleService): def get_data(self): #The data dict is basically all the values to be represented # The entries are in the format: { "dimension": value} - #And each "dimension" shoudl belong to a chart. + #And each "dimension" should belong to a chart. data = dict() self.populate_data() @@ -356,7 +356,7 @@ chart: Next, time to add one more chart that visualizes the average, minimum, and maximum temperature values. Add a new entry in the `CHARTS` dictionary with the definition for the new chart. Since you want three values -represented in this this chart, add three dimensions. You shoudl also use the same `FAMILY` value in the charts (`TEMP`) +represented in this this chart, add three dimensions. You should also use the same `FAMILY` value in the charts (`TEMP`) so that those two charts are grouped together. ```python @@ -418,7 +418,7 @@ configuration in [YAML](https://www.tutorialspoint.com/yaml/yaml_basics.htm) for - Create a configuration file in the same directory as the `<plugin_name>.chart.py`. Name it `<plugin_name>.conf`. - Define a `job`, which is an instance of the collector. It is useful when you want to collect data from different sources with different attributes. For example, we could gather data from 2 different weather stations, which use - different temperature measures: Fahrenheit and Celcius. + different temperature measures: Fahrenheit and Celsius. - You can define many different jobs with the same name, but with different attributes. Netdata will try each job serially and will stop at the first job that returns data. If multiple jobs have the same name, only one of them can run. This enables you to define different "ways" to fetch data from a particular data source so that the collector has diff --git a/docs/guides/step-by-step/step-00.md b/docs/guides/step-by-step/step-00.md index 794366645..106571915 100644 --- a/docs/guides/step-by-step/step-00.md +++ b/docs/guides/step-by-step/step-00.md @@ -32,7 +32,6 @@ Click on the **issues** tab to see all the conversations we're having with Netda previously-written advice for your specific problem, and if you don't see any results, hit the **New issue** button to send us a question. -Or, if that's too complicated, feel free to send this guide's author [an email](mailto:joel@netdata.cloud). ## Before we get started diff --git a/docs/guides/step-by-step/step-03.md b/docs/guides/step-by-step/step-03.md index 2319adb44..a2f37beeb 100644 --- a/docs/guides/step-by-step/step-03.md +++ b/docs/guides/step-by-step/step-03.md @@ -43,7 +43,7 @@ features, new collectors for more applications, and improved UI, so will Cloud. ## Get started with Netdata Cloud -Signing in, onboarding, and claiming your first nodes only takes a few minutes, and we have a [Get started with +Signing in, onboarding, and connecting your first nodes only takes a few minutes, and we have a [Get started with Cloud](https://learn.netdata.cloud/docs/cloud/get-started) guide to help you walk through every step. Or, if you're feeling confident, dive right in. @@ -82,7 +82,7 @@ nodes](https://user-images.githubusercontent.com/1153921/80831018-e158ac80-8b9e- ## What's next? -Now that you have a Netdata Cloud account with a claimed node (or a few!) and can navigate between your dashboards with +Now that you have a Netdata Cloud account with a connected node (or a few!) and can navigate between your dashboards with Visited nodes, it's time to learn more about how you can configure Netdata to your liking. From there, you'll be able to customize your Netdata experience to your exact infrastructure and the information you need. diff --git a/docs/guides/step-by-step/step-05.md b/docs/guides/step-by-step/step-05.md index 30ab329cd..8a4d084e4 100644 --- a/docs/guides/step-by-step/step-05.md +++ b/docs/guides/step-by-step/step-05.md @@ -110,6 +110,13 @@ bother you with notifications. The best way to understand how health entities work is building your own and experimenting with the options. To start, let's build a health entity that triggers an alarm when system RAM usage goes above 80%. +We will first create a new file inside of the `health.d/` directory. We'll name our file +`example.conf` for now. + +```bash +./edit-config health.d/example.conf +``` + The first line in a health entity will be `alarm:`. This is how you name your entity. You can give it any name you choose, but the only symbols allowed are `.` and `_`. Let's call the alarm `ram_usage`. diff --git a/docs/guides/troubleshoot/monitor-debug-applications-ebpf.md b/docs/guides/troubleshoot/monitor-debug-applications-ebpf.md index d6c4b0697..688e7d296 100644 --- a/docs/guides/troubleshoot/monitor-debug-applications-ebpf.md +++ b/docs/guides/troubleshoot/monitor-debug-applications-ebpf.md @@ -236,8 +236,8 @@ same application on multiple systems and want to correlate how it performs on ea findings with someone else on your team. If you don't already have a Netdata Cloud account, go [sign in](https://app.netdata.cloud) and get started for free. -Read the [get started with Cloud guide](https://learn.netdata.cloud/docs/cloud/get-started) for a walkthrough of node -claiming and other fundamentals. +Read the [get started with Cloud guide](https://learn.netdata.cloud/docs/cloud/get-started) for a walkthrough of +connecting nodes to and other fundamentals. Once you've added one or more nodes to a Space in Netdata Cloud, you can see aggregated eBPF metrics in the [Overview dashboard](/docs/visualize/overview-infrastructure.md) under the same **Applications** or **eBPF** sections that you diff --git a/docs/guides/using-host-labels.md b/docs/guides/using-host-labels.md index 6d4af2e5d..79558dd16 100644 --- a/docs/guides/using-host-labels.md +++ b/docs/guides/using-host-labels.md @@ -27,7 +27,7 @@ sudo ./edit-config netdata.conf ``` Create a new `[host labels]` section defining a new host label and its value for the system in question. Make sure not -to violate any of the [host label naming rules](/docs/configuration-guide.md#netdata-labels). +to violate any of the [host label naming rules](/docs/configure/common-changes.md#organize-nodes-with-host-labels). ```conf [host labels] diff --git a/docs/metrics-storage-management/enable-streaming.mdx b/docs/metrics-storage-management/enable-streaming.mdx index 65acdb14f..d97a8a769 100644 --- a/docs/metrics-storage-management/enable-streaming.mdx +++ b/docs/metrics-storage-management/enable-streaming.mdx @@ -85,7 +85,7 @@ by the `netdata` user. ```bash sudo openssl req -newkey rsa:2048 -nodes -sha512 -x509 -days 365 -keyout /etc/netdata/ssl/key.pem -out /etc/netdata/ssl/cert.pem -sudo chown netdata:netdata /etc/netdata/ssl/cert.pem k/etc/netdata/ssl/ey.pem +sudo chown netdata:netdata /etc/netdata/ssl/cert.pem /etc/netdata/ssl/key.pem ``` Next, enforce TLS/SSL on the web server. Open `netdata.conf`, scroll down to the `[web]` section, and look for the `bind @@ -148,4 +148,4 @@ details. - Streaming - [How Netdata streams metrics](/docs/metrics-storage-management/how-streaming-works.mdx) - **[Enable streaming between nodes](/docs/metrics-storage-management/enable-streaming.mdx)** - - [Streaming reference](/docs/metrics-storage-management/reference-streaming.mdx)
\ No newline at end of file + - [Streaming reference](/docs/metrics-storage-management/reference-streaming.mdx) diff --git a/docs/monitor/enable-notifications.md b/docs/monitor/enable-notifications.md index 68beba53e..e5b5a6f26 100644 --- a/docs/monitor/enable-notifications.md +++ b/docs/monitor/enable-notifications.md @@ -14,7 +14,7 @@ alarms](/docs/monitor/configure-alarms.md) to change the preconfigured threshold infrastructure. Netdata Cloud offers [centralized alarm notifications](#netdata-cloud) via email, which leverages the health status -information already streamed to Netdata Cloud from claimed nodes to send notifications to those who have enabled them. +information already streamed to Netdata Cloud from connected nodes to send notifications to those who have enabled them. The Netdata Agent has a [notification system](#netdata-agent) that supports more than a dozen services, such as email, Slack, PagerDuty, Twilio, Amazon SNS, Discord, and much more. @@ -25,10 +25,11 @@ response process. ## Netdata Cloud -Netdata Cloud's [centralized alarm notifications](https://learn.netdata.cloud/docs/cloud/monitoring/notifications/) is a -zero-configuration way to get notified when an anomaly or incident strikes any node or application in your -infrastructure. The advantage of using centralized alarm notifications from Netdata Cloud is that you don't have to -worry about configuring each node in your infrastructure. +Netdata Cloud's [centralized alarm +notifications](https://learn.netdata.cloud/docs/cloud/alerts-notifications/notifications) is a zero-configuration way to +get notified when an anomaly or incident strikes any node or application in your infrastructure. The advantage of using +centralized alarm notifications from Netdata Cloud is that you don't have to worry about configuring each node in your +infrastructure. To enable centralized alarm notifications for a Space, click on **Manage Space** in the left-hand menu, then click on the **Notifications** tab. Click the toggle switch next to **E-mail** to enable this notification method. @@ -40,8 +41,9 @@ choose what types of notifications to receive from each War Room.  -See the [centralized alarm notifications](https://learn.netdata.cloud/docs/cloud/monitoring/notifications/) reference -doc for further details about what information is conveyed in an email notification, flood protection, and more. +See the [centralized alarm notifications](https://learn.netdata.cloud/docs/cloud/alerts-notifications/notifications) +reference doc for further details about what information is conveyed in an email notification, flood protection, and +more. ## Netdata Agent @@ -69,6 +71,7 @@ notification platform. - [**Kavenegar**](/health/notifications/kavenegar/README.md) - [**Matrix**](/health/notifications/matrix/README.md) - [**Messagebird**](/health/notifications/messagebird/README.md) +- [**Microsoft Teams**](/health/notifications/msteams/README.md) - [**Netdata Agent dashboard**](/health/notifications/web/README.md) - [**Opsgenie**](/health/notifications/opsgenie/README.md) - [**PagerDuty**](/health/notifications/pagerduty/README.md) @@ -138,7 +141,7 @@ architecture](/docs/store/distributed-data-architecture.md) for the best-in-clas ### Related reference documentation -- [Netdata Cloud · Alarm notifications](https://learn.netdata.cloud/docs/cloud/monitoring/notifications/) +- [Netdata Cloud · Alarm notifications](https://learn.netdata.cloud/docs/cloud/alerts-notifications/notifications) - [Netdata Agent · Notifications](/health/notifications/README.md) [](<>) diff --git a/docs/monitor/view-active-alarms.md b/docs/monitor/view-active-alarms.md index b23e2d721..99169c2c8 100644 --- a/docs/monitor/view-active-alarms.md +++ b/docs/monitor/view-active-alarms.md @@ -11,9 +11,10 @@ performance issue affects your node or the applications it runs. ## Netdata Cloud -A War Room's [alarms indicator](https://learn.netdata.cloud/docs/cloud/war-rooms#indicators) displays the number of active `critical` (red) and -`warning` (yellow) alerts for the nodes in this War Room. Click on either the critical or warning badges to open a -pre-filtered modal displaying only those types of [active alarms](https://learn.netdata.cloud/docs/cloud/monitoring/alarms). +A War Room's [alarms indicator](https://learn.netdata.cloud/docs/cloud/war-rooms#indicators) displays the number of +active `critical` (red) and `warning` (yellow) alerts for the nodes in this War Room. Click on either the critical or +warning badges to open a pre-filtered modal displaying only those types of [active +alarms](https://learn.netdata.cloud/docs/cloud/alerts-notifications/view-active-alerts). 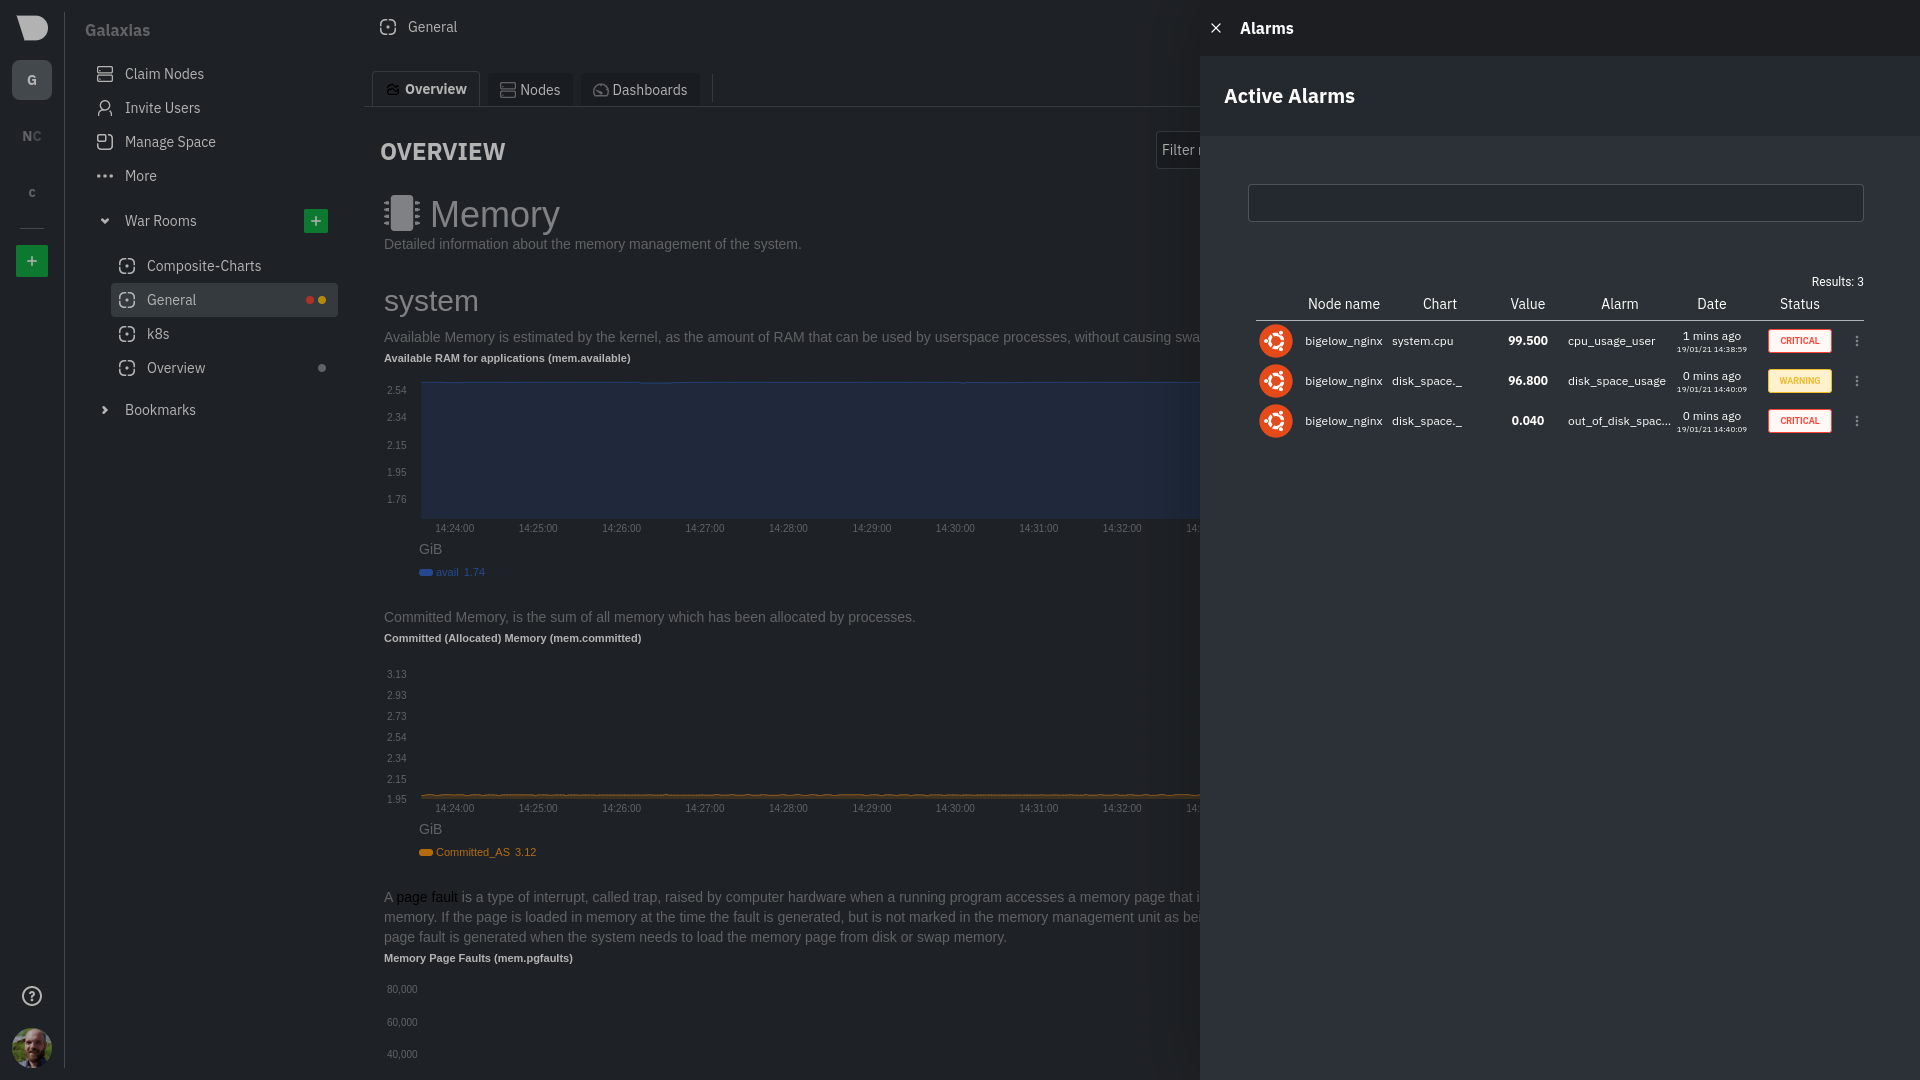 diff --git a/docs/netdata-security.md b/docs/netdata-security.md index 8c0fc6d63..42dd0415f 100644 --- a/docs/netdata-security.md +++ b/docs/netdata-security.md @@ -9,7 +9,7 @@ We have given special attention to all aspects of Netdata, ensuring that everyth **Table of Contents** -1. [Your data are safe with Netdata](#your-data-are-safe-with-netdata) +1. [Your data is safe with Netdata](#your-data-is-safe-with-netdata) 2. [Your systems are safe with Netdata](#your-systems-are-safe-with-netdata) 3. [Netdata is read-only](#netdata-is-read-only) 4. [Netdata viewers authentication](#netdata-viewers-authentication) @@ -20,13 +20,13 @@ We have given special attention to all aspects of Netdata, ensuring that everyth \- [Other methods](#other-methods) 5. [Registry or how to not send any information to a third party server](#registry-or-how-to-not-send-any-information-to-a-third-party-server) -## Your data are safe with Netdata +## Your data is safe with Netdata Netdata collects raw data from many sources. For each source, Netdata uses a plugin that connects to the source (or reads the relative files produced by the source), receives raw data and processes them to calculate the metrics shown on Netdata dashboards. Even if Netdata plugins connect to your database server, or read your application log file to collect raw data, the product of this data collection process is always a number of **chart metadata and metric values** (summarized data for dashboard visualization). All Netdata plugins (internal to the Netdata daemon, and external ones written in any computer language), convert raw data collected into metrics, and only these metrics are stored in Netdata databases, sent to upstream Netdata servers, or archived to external time-series databases. -> The **raw data** collected by Netdata, do not leave the host they are collected. **The only data Netdata exposes are chart metadata and metric values.** +> The **raw data** collected by Netdata, does not leave the host when collected. **The only data Netdata exposes are chart metadata and metric values.** This means that Netdata can safely be used in environments that require the highest level of data isolation (like PCI Level 1). @@ -133,7 +133,7 @@ to IP addresses within the `160.1.x.x` range and that reverse DNS is setup for t Use one web server to provide authentication in front of **all your Netdata servers**. So, you will be accessing all your Netdata with URLs like `http://{HOST}/netdata/{NETDATA_HOSTNAME}/` and authentication will be shared among all of them (you will sign-in once for all your servers). Instructions are provided on how to set the proxy configuration to have Netdata run behind [nginx](Running-behind-nginx.md), [Apache](Running-behind-apache.md), [lighttpd](Running-behind-lighttpd.md) and [Caddy](Running-behind-caddy.md). -To use this method, you should firewall protect all your Netdata servers, so that only the web server IP will allowed to directly access Netdata. To do this, run this on each of your servers (or use your firewall manager): +To use this method, you should firewall protect all your Netdata servers, so that only the web server IP will be allowed to directly access Netdata. To do this, run this on each of your servers (or use your firewall manager): ```sh PROXY_IP="1.2.3.4" diff --git a/docs/overview/what-is-netdata.md b/docs/overview/what-is-netdata.md index 0a600234c..37f974ad8 100644 --- a/docs/overview/what-is-netdata.md +++ b/docs/overview/what-is-netdata.md @@ -32,10 +32,8 @@ Cloud, you can view key metrics, insightful charts, and active alarms from all y When an anomaly strikes, seamlessly navigate to any node to troubleshoot and discover the root cause with the familiar Netdata dashboard. -**[Netdata Cloud is -free](https://learn.netdata.cloud/docs/cloud/faq-glossary#how-much-does-netdata-cost-how-and-why-is-it-free)**! You can -add an entire infrastructure of nodes, invite all your colleagues, and visualize any number of metrics, charts, and -alarms entirely for free. +**[Netdata Cloud is free](https://www.netdata.cloud/blog/why-netdata-is-free/)**! You can add an entire infrastructure +of nodes, invite all your colleagues, and visualize any number of metrics, charts, and alarms entirely for free. While Netdata Cloud offers a centralized method of monitoring your Agents, your metrics data is not stored or centralized in any way. Metrics data remains with your nodes and is only streamed to your browser, through Cloud, when diff --git a/docs/quickstart/infrastructure.md b/docs/quickstart/infrastructure.md index 71e70b94b..ed136fe12 100644 --- a/docs/quickstart/infrastructure.md +++ b/docs/quickstart/infrastructure.md @@ -25,10 +25,10 @@ In this quickstart guide, you'll learn the basics of using Netdata Cloud to moni composite charts, and alarm viewing. You'll then learn about the most critical ways to configure the Agent on each of your nodes to maximize the value you get from Netdata. -This quickstart assumes you've installed the Netdata Agent on more than one node in your infrastructure, and claimed +This quickstart assumes you've installed the Netdata Agent on more than one node in your infrastructure, and connected those nodes to your Space in Netdata Cloud. If you haven't yet, see the [Netdata Cloud](https://learn.netdata.cloud/docs/cloud) docs for details on signing up for Netdata Cloud, installation, and -claiming. +connection process. > If you want to monitor a Kubernetes cluster with Netdata, see our [k8s installation > doc](/packaging/installer/methods/kubernetes.md) for setup details, and then read our guide, [_Monitor a Kubernetes diff --git a/docs/visualize/interact-dashboards-charts.md b/docs/visualize/interact-dashboards-charts.md index 30503c220..c5b4c1b62 100644 --- a/docs/visualize/interact-dashboards-charts.md +++ b/docs/visualize/interact-dashboards-charts.md @@ -6,6 +6,9 @@ custom_edit_url: https://github.com/netdata/netdata/edit/master/docs/visualize/i # Interact with dashboards and charts +> ⚠️ There is a new version of charts that is currently **only** available on [Netdata Cloud](https://learn.netdata.cloud/docs/cloud/visualize/interact-new-charts). We didn't +> want to keep this valuable feature from you, so after we get this into your hands on the Cloud, we will collect and implement your feedback to make sure we are providing the best possible version of the feature on the Netdata Agent dashboard as quickly as possible. + You can find Netdata's dashboards in two places: locally served at `http://NODE:19999` by the Netdata Agent, and in Netdata Cloud. While you access these dashboards differently, they have similar interfaces, identical charts and metrics, and you interact with both of them the same way. @@ -119,6 +122,7 @@ to get informed when something goes wrong in your infrastructure. ### Related reference documentation - [Netdata Agent · Web dashboards overview](/web/README.md) +- [Netdata Cloud · Interact with new charts](https://learn.netdata.cloud/docs/cloud/visualize/interact-new-charts) - [Netdata Cloud · War Rooms](https://learn.netdata.cloud/docs/cloud/war-rooms) - [Netdata Cloud · Overview](https://learn.netdata.cloud/docs/cloud/visualize/overview) - [Netdata Cloud · Nodes](https://learn.netdata.cloud/docs/cloud/visualize/nodes) |