
diff options
| author | Daniel Baumann <daniel.baumann@progress-linux.org> | 2024-03-09 13:19:48 +0000 |
|---|---|---|
| committer | Daniel Baumann <daniel.baumann@progress-linux.org> | 2024-03-09 13:20:02 +0000 |
| commit | 58daab21cd043e1dc37024a7f99b396788372918 (patch) | |
| tree | 96771e43bb69f7c1c2b0b4f7374cb74d7866d0cb /docs | |
| parent | Releasing debian version 1.43.2-1. (diff) | |
| download | netdata-58daab21cd043e1dc37024a7f99b396788372918.tar.xz netdata-58daab21cd043e1dc37024a7f99b396788372918.zip | |
Merging upstream version 1.44.3.
Signed-off-by: Daniel Baumann <daniel.baumann@progress-linux.org>
Diffstat (limited to 'docs')
20 files changed, 322 insertions, 559 deletions
diff --git a/docs/category-overview-pages/logs.md b/docs/category-overview-pages/logs.md new file mode 100644 index 00000000..fbaf8563 --- /dev/null +++ b/docs/category-overview-pages/logs.md @@ -0,0 +1,3 @@ +# Logs + +This section talks about ways Netdata collects and visualizes logs, while also providing useful guides on log centralization setups that can be used with Netdata. diff --git a/docs/cloud/alerts-notifications/add-discord-notification.md b/docs/cloud/alerts-notifications/add-discord-notification.md deleted file mode 100644 index 3edf5002..00000000 --- a/docs/cloud/alerts-notifications/add-discord-notification.md +++ /dev/null @@ -1,44 +0,0 @@ -# Add Discord notification configuration - -From the Netdata Cloud UI, you can manage your space's notification settings and enable the configuration to deliver notifications on Discord. - -## Prerequisites - -To enable Discord notifications you need: - -- A Netdata Cloud account -- Access to the space as an **administrator** -- Have a Discord server able to receive webhook integrations. For more details check [how to configure this on Discord](#settings-on-discord) - -## Steps - -1. Click on the **Space settings** cog (located above your profile icon) -1. Click on the **Notification** tab -1. Click on the **+ Add configuration** button (near the top-right corner of your screen) -1. On the **Discord** card click on **+ Add** -1. A modal will be presented to you to enter the required details to enable the configuration: - 1. **Notification settings** are Netdata specific settings - - Configuration name - you can optionally provide a name for your configuration you can easily refer to it - - Rooms - by specifying a list of Rooms you are select to which nodes or areas of your infrastructure you want to be notified using this configuration - - Notification - you specify which notifications you want to be notified using this configuration: All Alerts and unreachable, All Alerts, Critical only - 1. **Integration configuration** are the specific notification integration required settings, which vary by notification method. For Discord: - - Define the type channel you want to send notifications to: **Text channel** or **Forum channel** - - Webhook URL - URL provided on Discord for the channel you want to receive your notifications. For more details check [how to configure this on Discord](#settings-on-discord) - - Thread name - if the Discord channel is a **Forum channel** you will need to provide the thread name as well - -## Settings on Discord - -## Enable webhook integrations on Discord server - -To enable the webhook integrations on Discord you need: -1. Go to *Integrations** under your **Server Settings - - 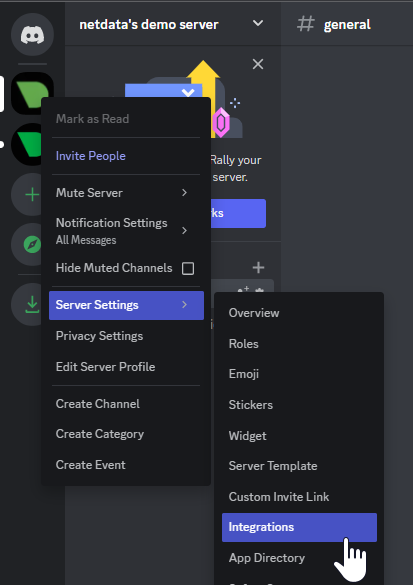 - -1. **Create Webhook** or **View Webhooks** if you already have some defined -1. When you create a new webhook you specify: Name and Channel -1. Once you have this configured you will need the Webhook URL to add your notification configuration on Netdata UI - - 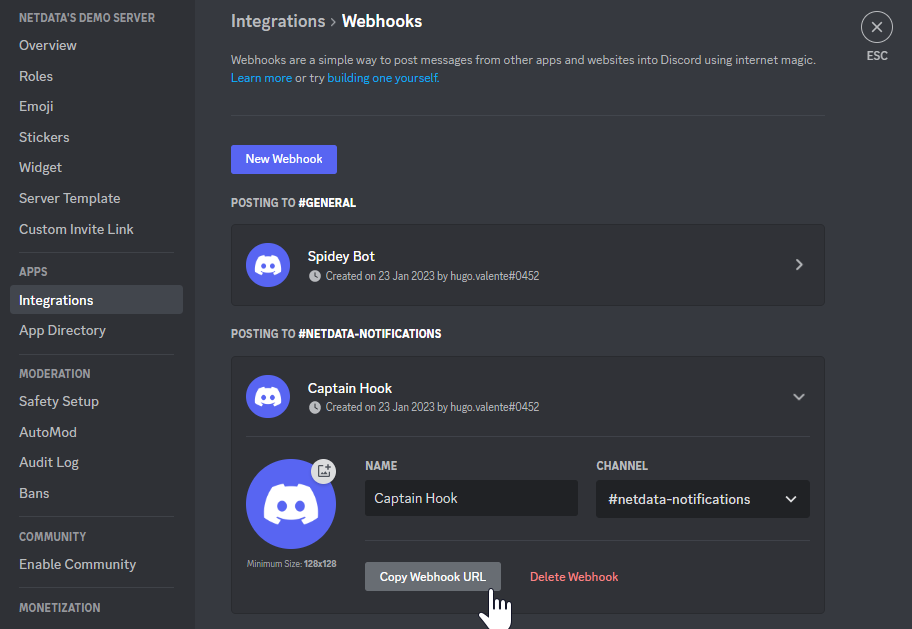 - -For more details please read this article from Discord: [Intro to Webhooks](https://support.discord.com/hc/en-us/articles/228383668). diff --git a/docs/cloud/alerts-notifications/add-mattermost-notification-configuration.md b/docs/cloud/alerts-notifications/add-mattermost-notification-configuration.md deleted file mode 100644 index 79bc9861..00000000 --- a/docs/cloud/alerts-notifications/add-mattermost-notification-configuration.md +++ /dev/null @@ -1,51 +0,0 @@ -# Add Mattermost notification configuration - -From the Cloud interface, you can manage your space's notification settings and from these you can add a specific configuration to get notifications delivered on Mattermost. - -## Prerequisites - -To add Mattermost notification configurations you need: - -- A Netdata Cloud account -- Access to the space as an **administrator** -- Space needs to be on **Business** plan or higher -- Have a Mattermost app on your workspace to receive the webhooks, for more details check [how to configure this on Mattermost](#settings-on-mattermost) - -## Steps - -1. Click on the **Space settings** cog (located above your profile icon) -1. Click on the **Notification** tab -1. Click on the **+ Add configuration** button (near the top-right corner of your screen) -1. On the **Mattermost** card click on **+ Add** -1. A modal will be presented to you to enter the required details to enable the configuration: - 1. **Notification settings** are Netdata specific settings - - Configuration name - you can optionally provide a name for your configuration you can easily refer to it - - Rooms - by specifying a list of Rooms you are select to which nodes or areas of your infrastructure you want to be notified using this configuration - - Notification - you specify which notifications you want to be notified using this configuration: All Alerts and unreachable, All Alerts, Critical only - 1. **Integration configuration** are the specific notification integration required settings, which vary by notification method. For Mattermost: - - Webhook URL - URL provided on Mattermost for the channel you want to receive your notifications. For more details check [how to configure this on Mattermost](#settings-on-mattermost) - -## Settings on Mattermost - -To enable the webhook integrations on Mattermost you need: -1. In Mattermost, go to Product menu > Integrations > Incoming Webhook. - -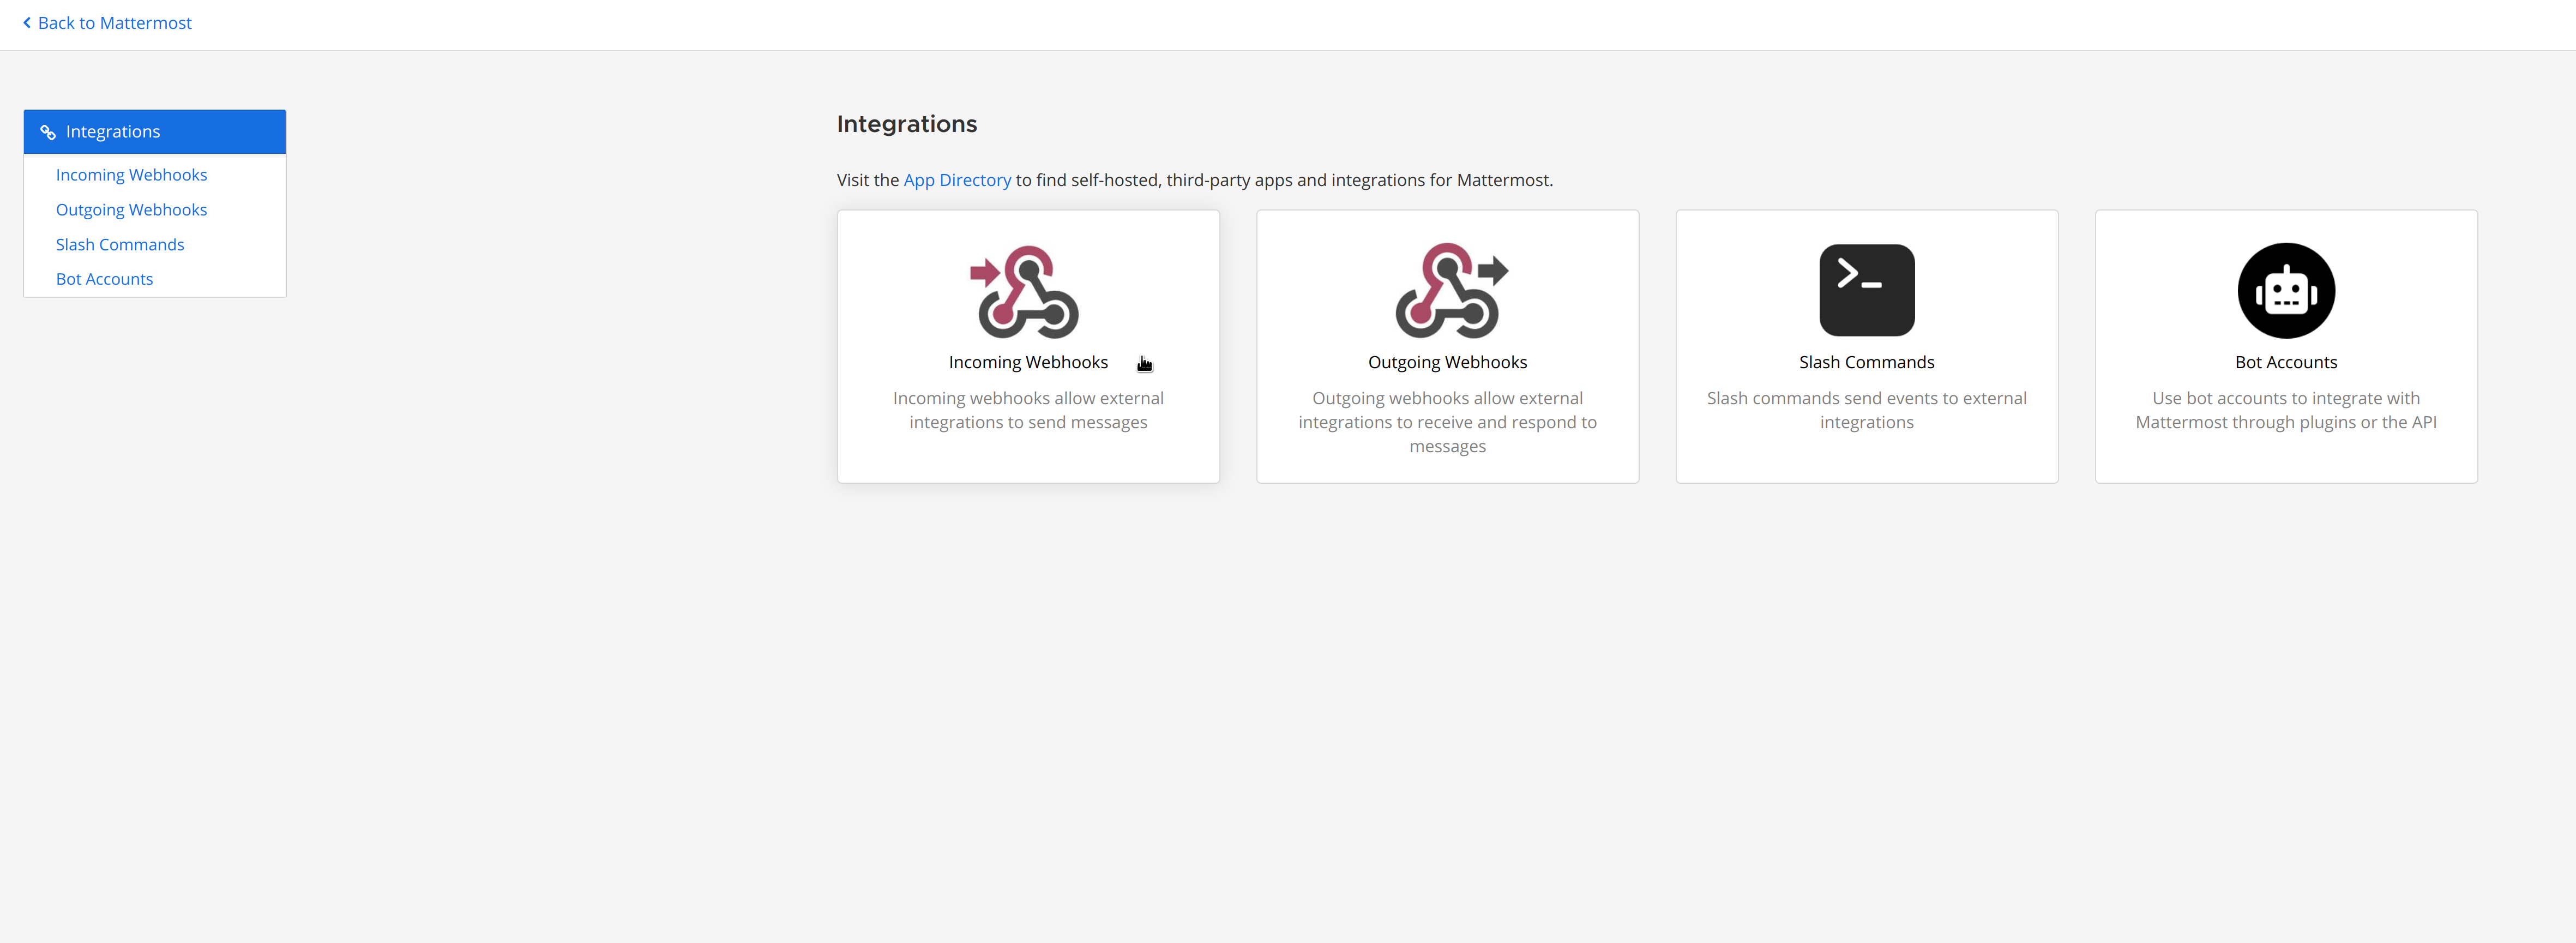 - - - If you don’t have the Integrations option, incoming webhooks may not be enabled on your Mattermost server or may be disabled for non-admins. They can be enabled by a System Admin from System Console > Integrations > Integration Management. Once incoming webhooks are enabled, continue with the steps below - - - -2. Select Add Incoming Webhook and add a name and description for the webhook. The description can be up to 500 characters - -3. Select the channel to receive webhook payloads, then select Add to create the webhook - -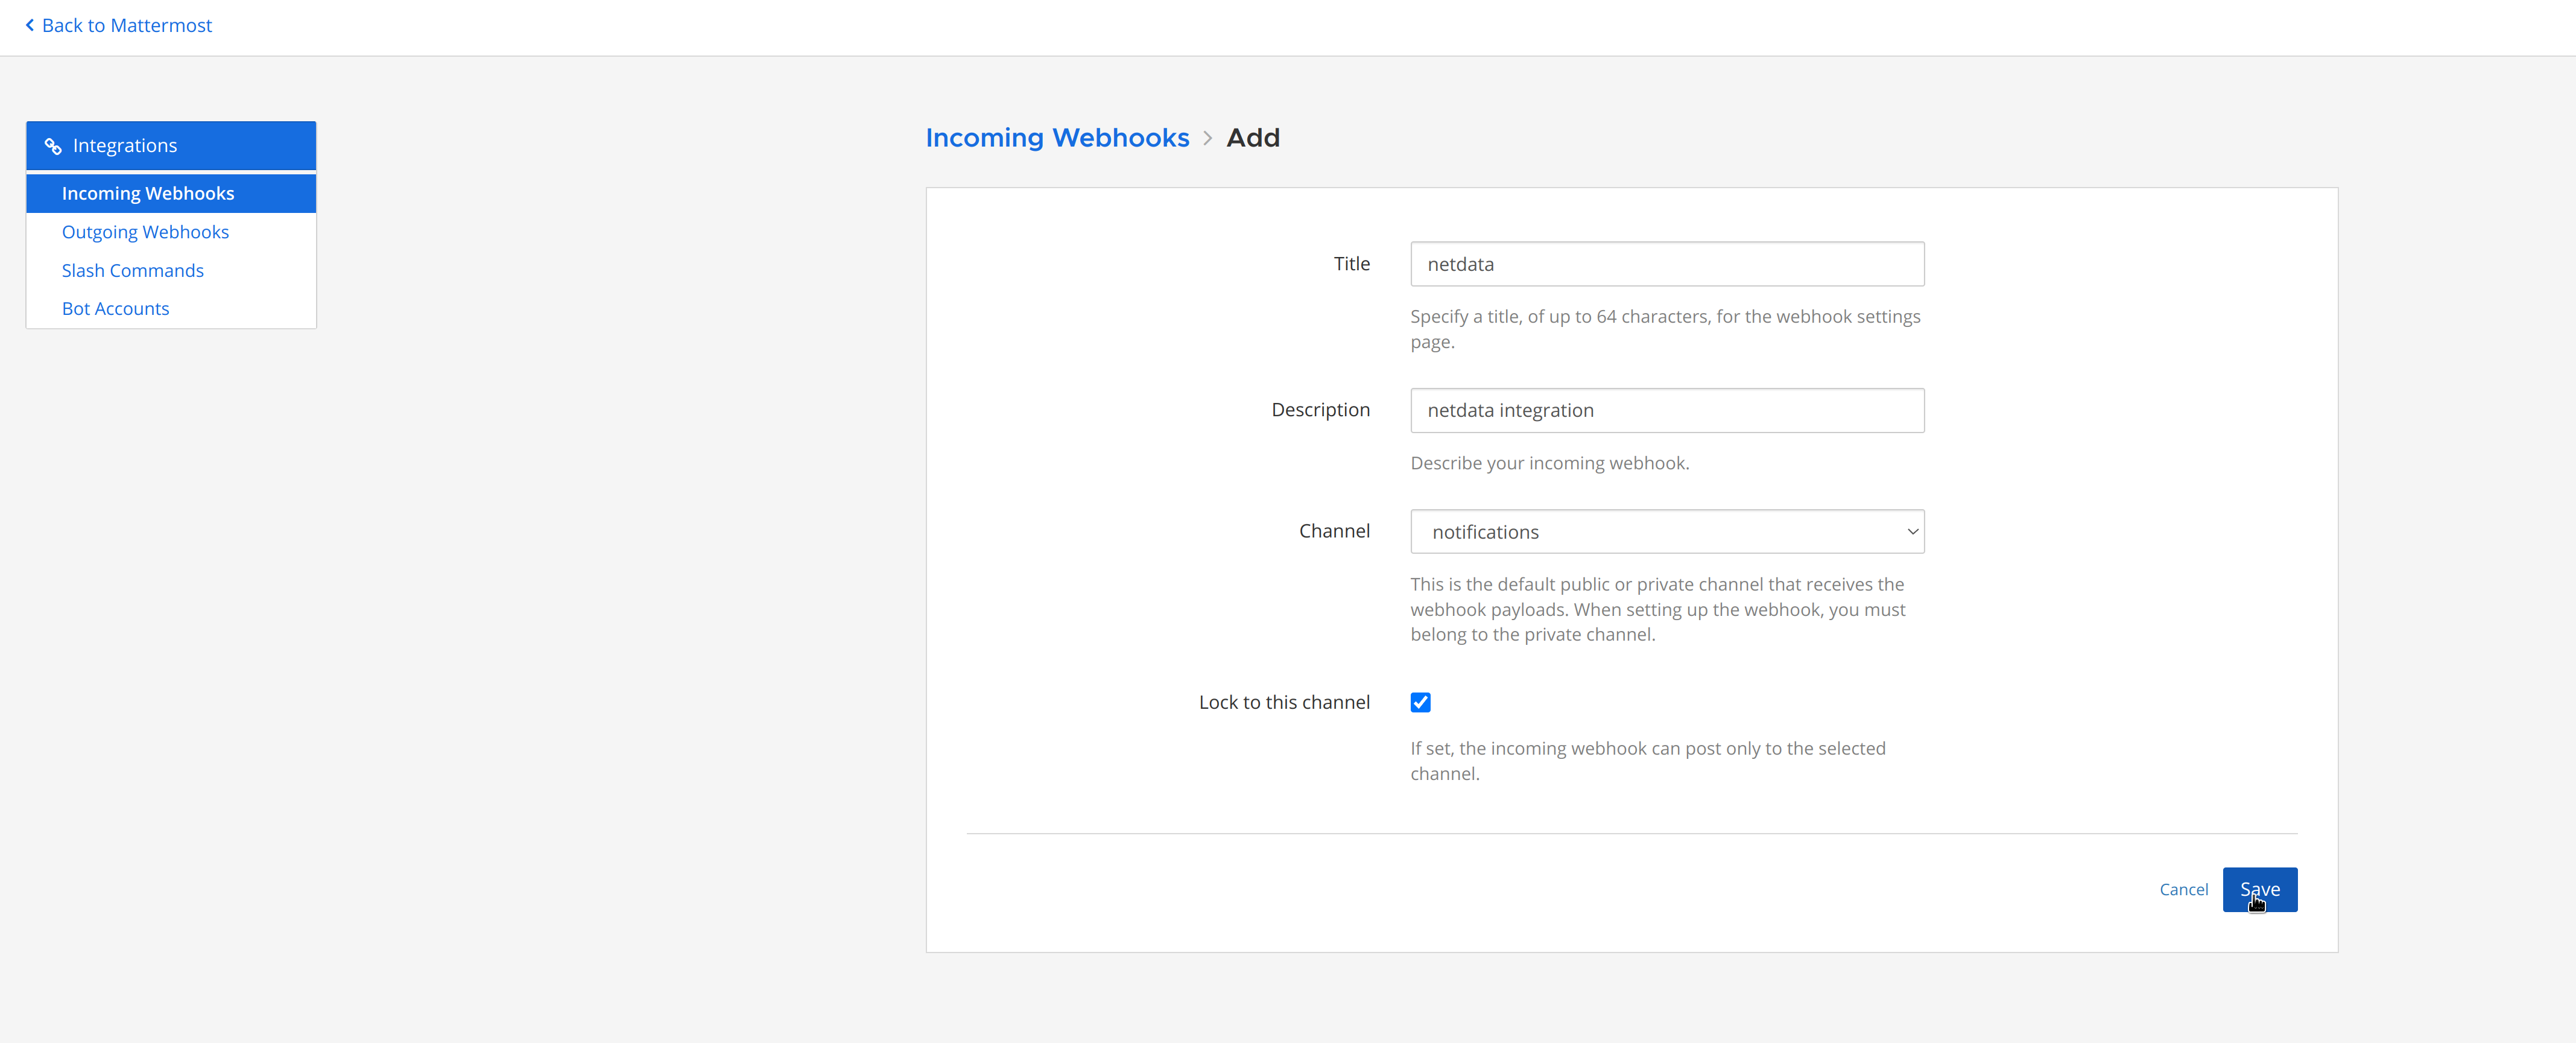 - -4. You will end up with a webhook endpoint that looks like so: -``` -https://your-mattermost-server.com/hooks/xxx-generatedkey-xxx -``` - - Treat this endpoint as a secret. Anyone who has it will be able to post messages to your Mattermost instance. - -For more details please check Mattermost's article [Incoming webhooks for Mattermost](https://developers.mattermost.com/integrate/webhooks/incoming/). diff --git a/docs/cloud/alerts-notifications/add-opsgenie-notification-configuration.md b/docs/cloud/alerts-notifications/add-opsgenie-notification-configuration.md deleted file mode 100644 index 0a80311e..00000000 --- a/docs/cloud/alerts-notifications/add-opsgenie-notification-configuration.md +++ /dev/null @@ -1,37 +0,0 @@ -# Add Opsgenie notification configuration - -From the Cloud interface, you can manage your space's notification settings and from these you can add a specific configuration to get notifications delivered on Opsgenie. - -## Prerequisites - -To add Opsgenie notification configurations you need: - -- A Netdata Cloud account -- Access to the space as an **administrator** -- Space on **Business** plan or higher -- Have a permission to add new integrations in Opsgenie. - -## Steps - -1. Click on the **Space settings** cog (located above your profile icon) -1. Click on the **Notification** tab -1. Click on the **+ Add configuration** button (near the top-right corner of your screen) -1. On the **Opsgenie** card click on **+ Add** -1. A modal will be presented to you to enter the required details to enable the configuration: - 1. **Notification settings** are Netdata specific settings - - Configuration name - you can optionally provide a name for your configuration you can easily refer to it - - Rooms - by specifying a list of Rooms you are select to which nodes or areas of your infrastructure you want to be notified using this configuration - - Notification - you specify which notifications you want to be notified using this configuration: All Alerts and unreachable, All Alerts, Critical only - 1. **Integration configuration** are the specific notification integration required settings, which vary by notification method. For Opsgenie: - - API Key - a key provided on Opsgenie for the channel you want to receive your notifications. For more details check [how to configure this on Opsgenie](#settings-on-opsgenie) - -## Settings on Opsgenie - -To enable the Netdata integration on Opsgenie you need: -1. Go to integrations tab of your team, click **Add integration**. - - 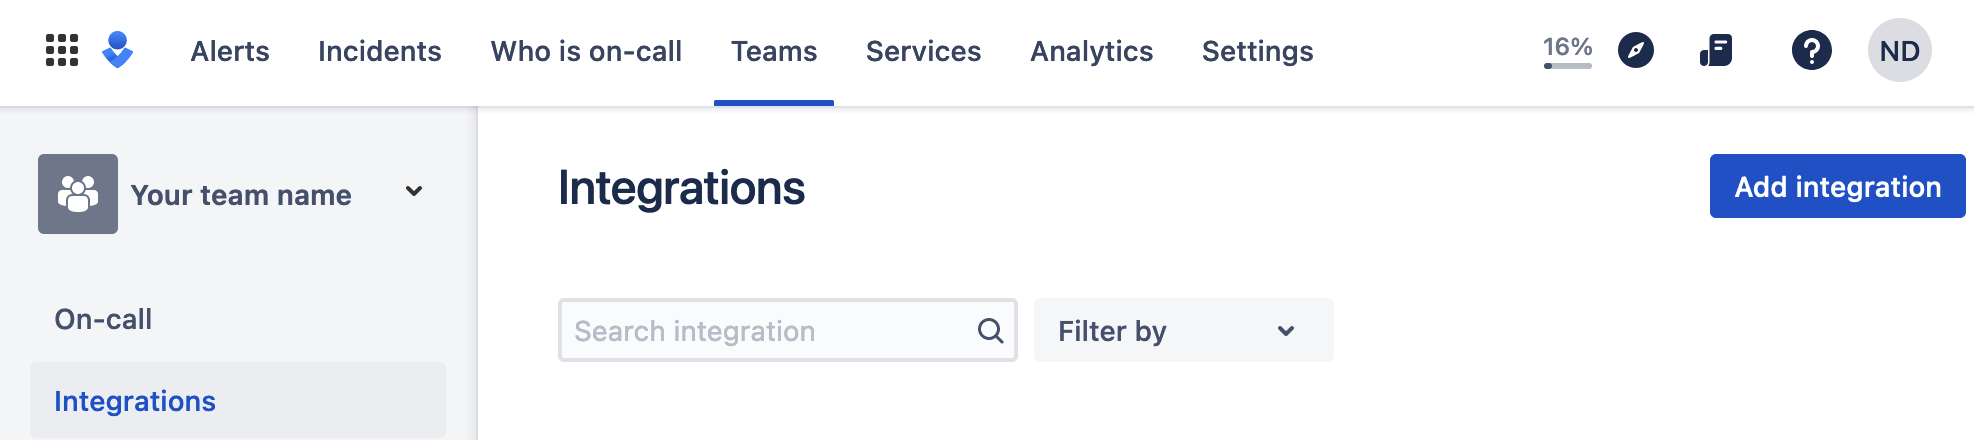 - -1. Pick **API** from available integrations. Copy your API Key and press **Save Integration**. - -1. Paste copied API key into the corresponding field in **Integration configuration** section of Opsgenie modal window in Netdata. diff --git a/docs/cloud/alerts-notifications/add-pagerduty-notification-configuration.md b/docs/cloud/alerts-notifications/add-pagerduty-notification-configuration.md deleted file mode 100644 index eec4f94c..00000000 --- a/docs/cloud/alerts-notifications/add-pagerduty-notification-configuration.md +++ /dev/null @@ -1,43 +0,0 @@ -# Add PagerDuty notification configuration - -From the Cloud interface, you can manage your space's notification settings and from these you can add a specific configuration to get notifications delivered on PagerDuty. - -## Prerequisites - -To add PagerDuty notification configurations you need: - -- A Cloud account -- Access to the space as and **administrator** -- Space needs to be on **Business** plan or higher -- Have a PagerDuty service to receive events, for more details check [how to configure this on PagerDuty](#settings-on-pagerduty) - -## Steps - -1. Click on the **Space settings** cog (located above your profile icon) -1. Click on the **Notification** tab -1. Click on the **+ Add configuration** button (near the top-right corner of your screen) -1. On the **PagerDuty** card click on **+ Add** -1. A modal will be presented to you to enter the required details to enable the configuration: - 1. **Notification settings** are Netdata specific settings - - Configuration name - you can optionally provide a name for your configuration you can easily refer to it - - Rooms - by specifying a list of Rooms you are select to which nodes or areas of your infrastructure you want to be notified using this configuration - - Notification - you specify which notifications you want to be notified using this configuration: All Alerts and unreachable, All Alerts, Critical only - 1. **Integration configuration** are the specific notification integration required settings, which vary by notification method. For PagerDuty: - - Integration Key - is a 32 character key provided by PagerDuty to receive events on your service. For more details check [how to configure this on PagerDuty](#settings-on-pagerduty) - -## Settings on PagerDuty - -## Enable webhook integrations on PagerDuty - -To enable the webhook integrations on PagerDuty you need: -1. Create a service to receive events from your services directory page: - - 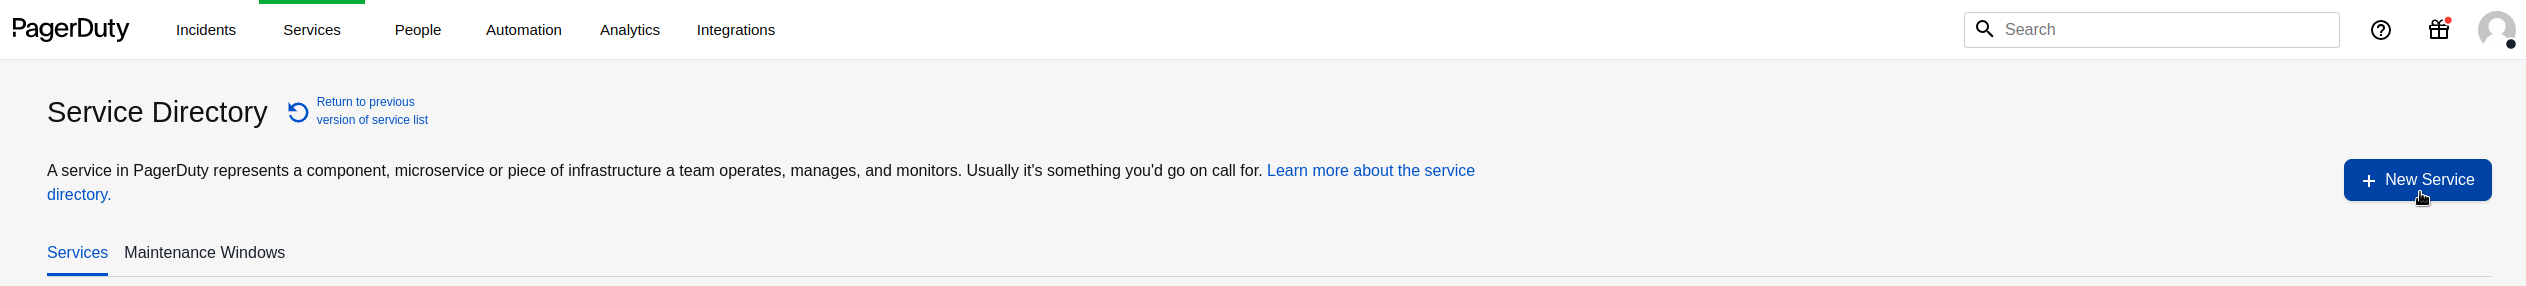 - -1. At step 3, select `Events API V2` Integration:or **View Webhooks** if you already have some defined - - 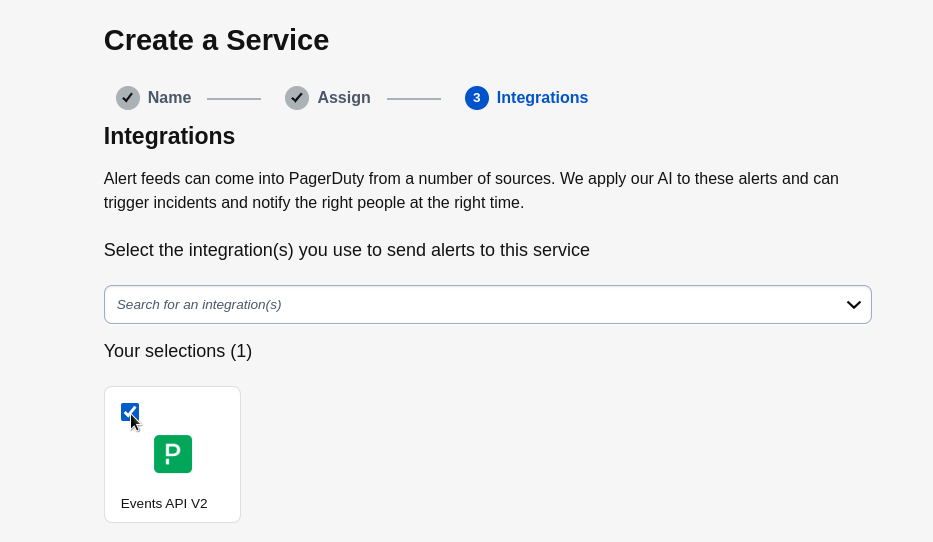 - -1. Once the service is created you will be redirected to its configuration page, where you can copy the **integration key**, that you will need need to add to your notification configuration on Netdata UI: - - 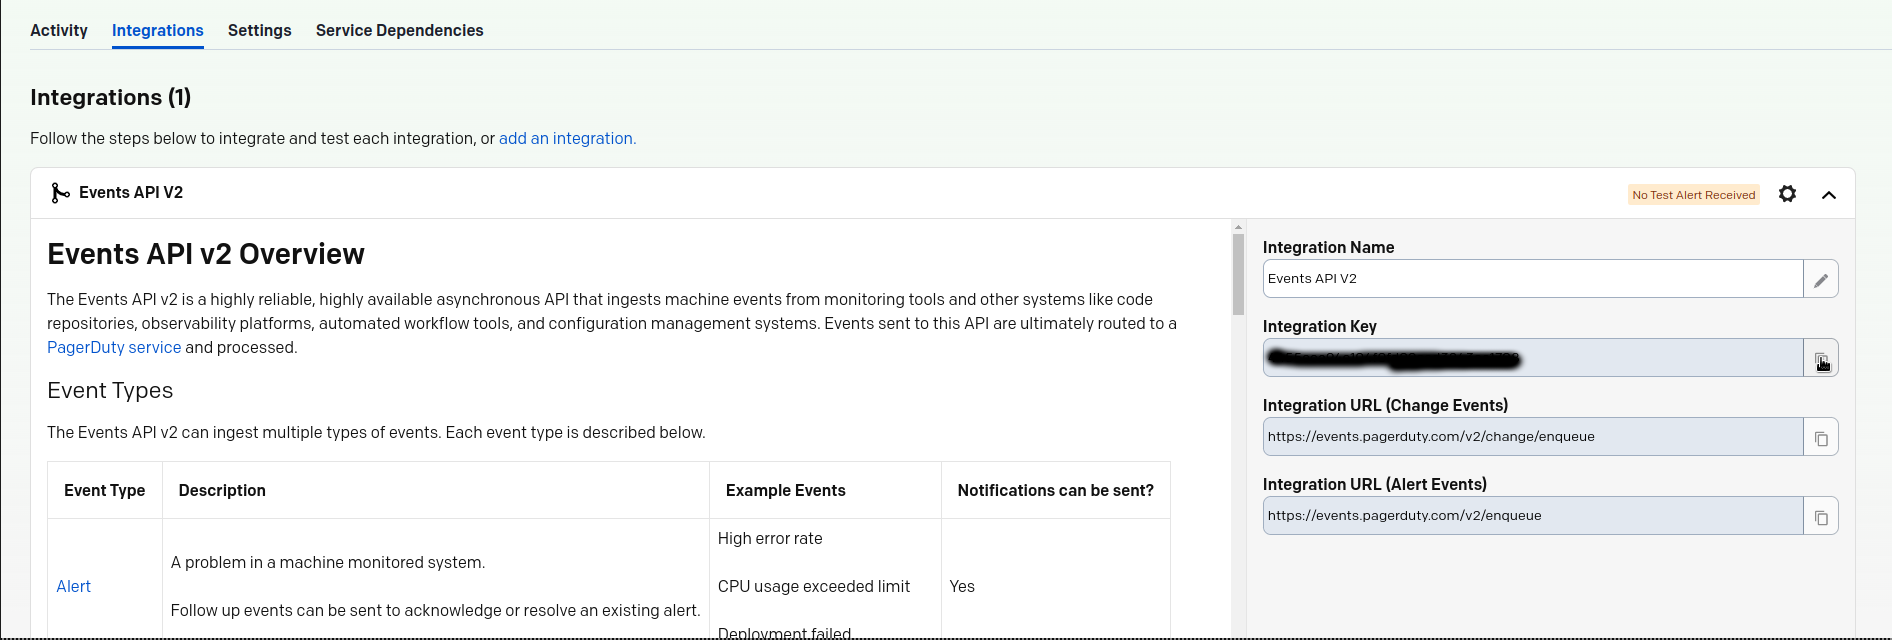 diff --git a/docs/cloud/alerts-notifications/add-rocketchat-notification-configuration.md b/docs/cloud/alerts-notifications/add-rocketchat-notification-configuration.md deleted file mode 100644 index 6a81ad1d..00000000 --- a/docs/cloud/alerts-notifications/add-rocketchat-notification-configuration.md +++ /dev/null @@ -1,49 +0,0 @@ -# Add RocketChat notification configuration - -From the Cloud interface, you can manage your space's notification settings and from these you can add a specific configuration to get notifications delivered on RocketChat. - -## Prerequisites - -To add RocketChat notification configurations you need: - -- A Netdata Cloud account -- Access to the space as an **administrator** -- Space needs to be on **Business** plan or higher -- Have a RocketChat app on your workspace to receive the webhooks, for more details check [how to configure this on RocketChat](#settings-on-rocketchat) - -## Steps - -1. Click on the **Space settings** cog (located above your profile icon) -1. Click on the **Notification** tab -1. Click on the **+ Add configuration** button (near the top-right corner of your screen) -1. On the **RocketChat** card click on **+ Add** -1. A modal will be presented to you to enter the required details to enable the configuration: - 1. **Notification settings** are Netdata specific settings - - Configuration name - you can optionally provide a name for your configuration you can easily refer to it - - Rooms - by specifying a list of Rooms you are select to which nodes or areas of your infrastructure you want to be notified using this configuration - - Notification - you specify which notifications you want to be notified using this configuration: All Alerts and unreachable, All Alerts, Critical only - 1. **Integration configuration** are the specific notification integration required settings, which vary by notification method. For RocketChat: - - Webhook URL - URL provided on RocketChat for the channel you want to receive your notifications. For more details check [how to configure this on RocketChat](#settings-on-rocketchat) - -## Settings on RocketChat - -To enable the webhook integrations on RocketChat you need: -1. In RocketChat, Navigate to Administration > Workspace > Integrations. - -2. Click +New at the top right corner. - -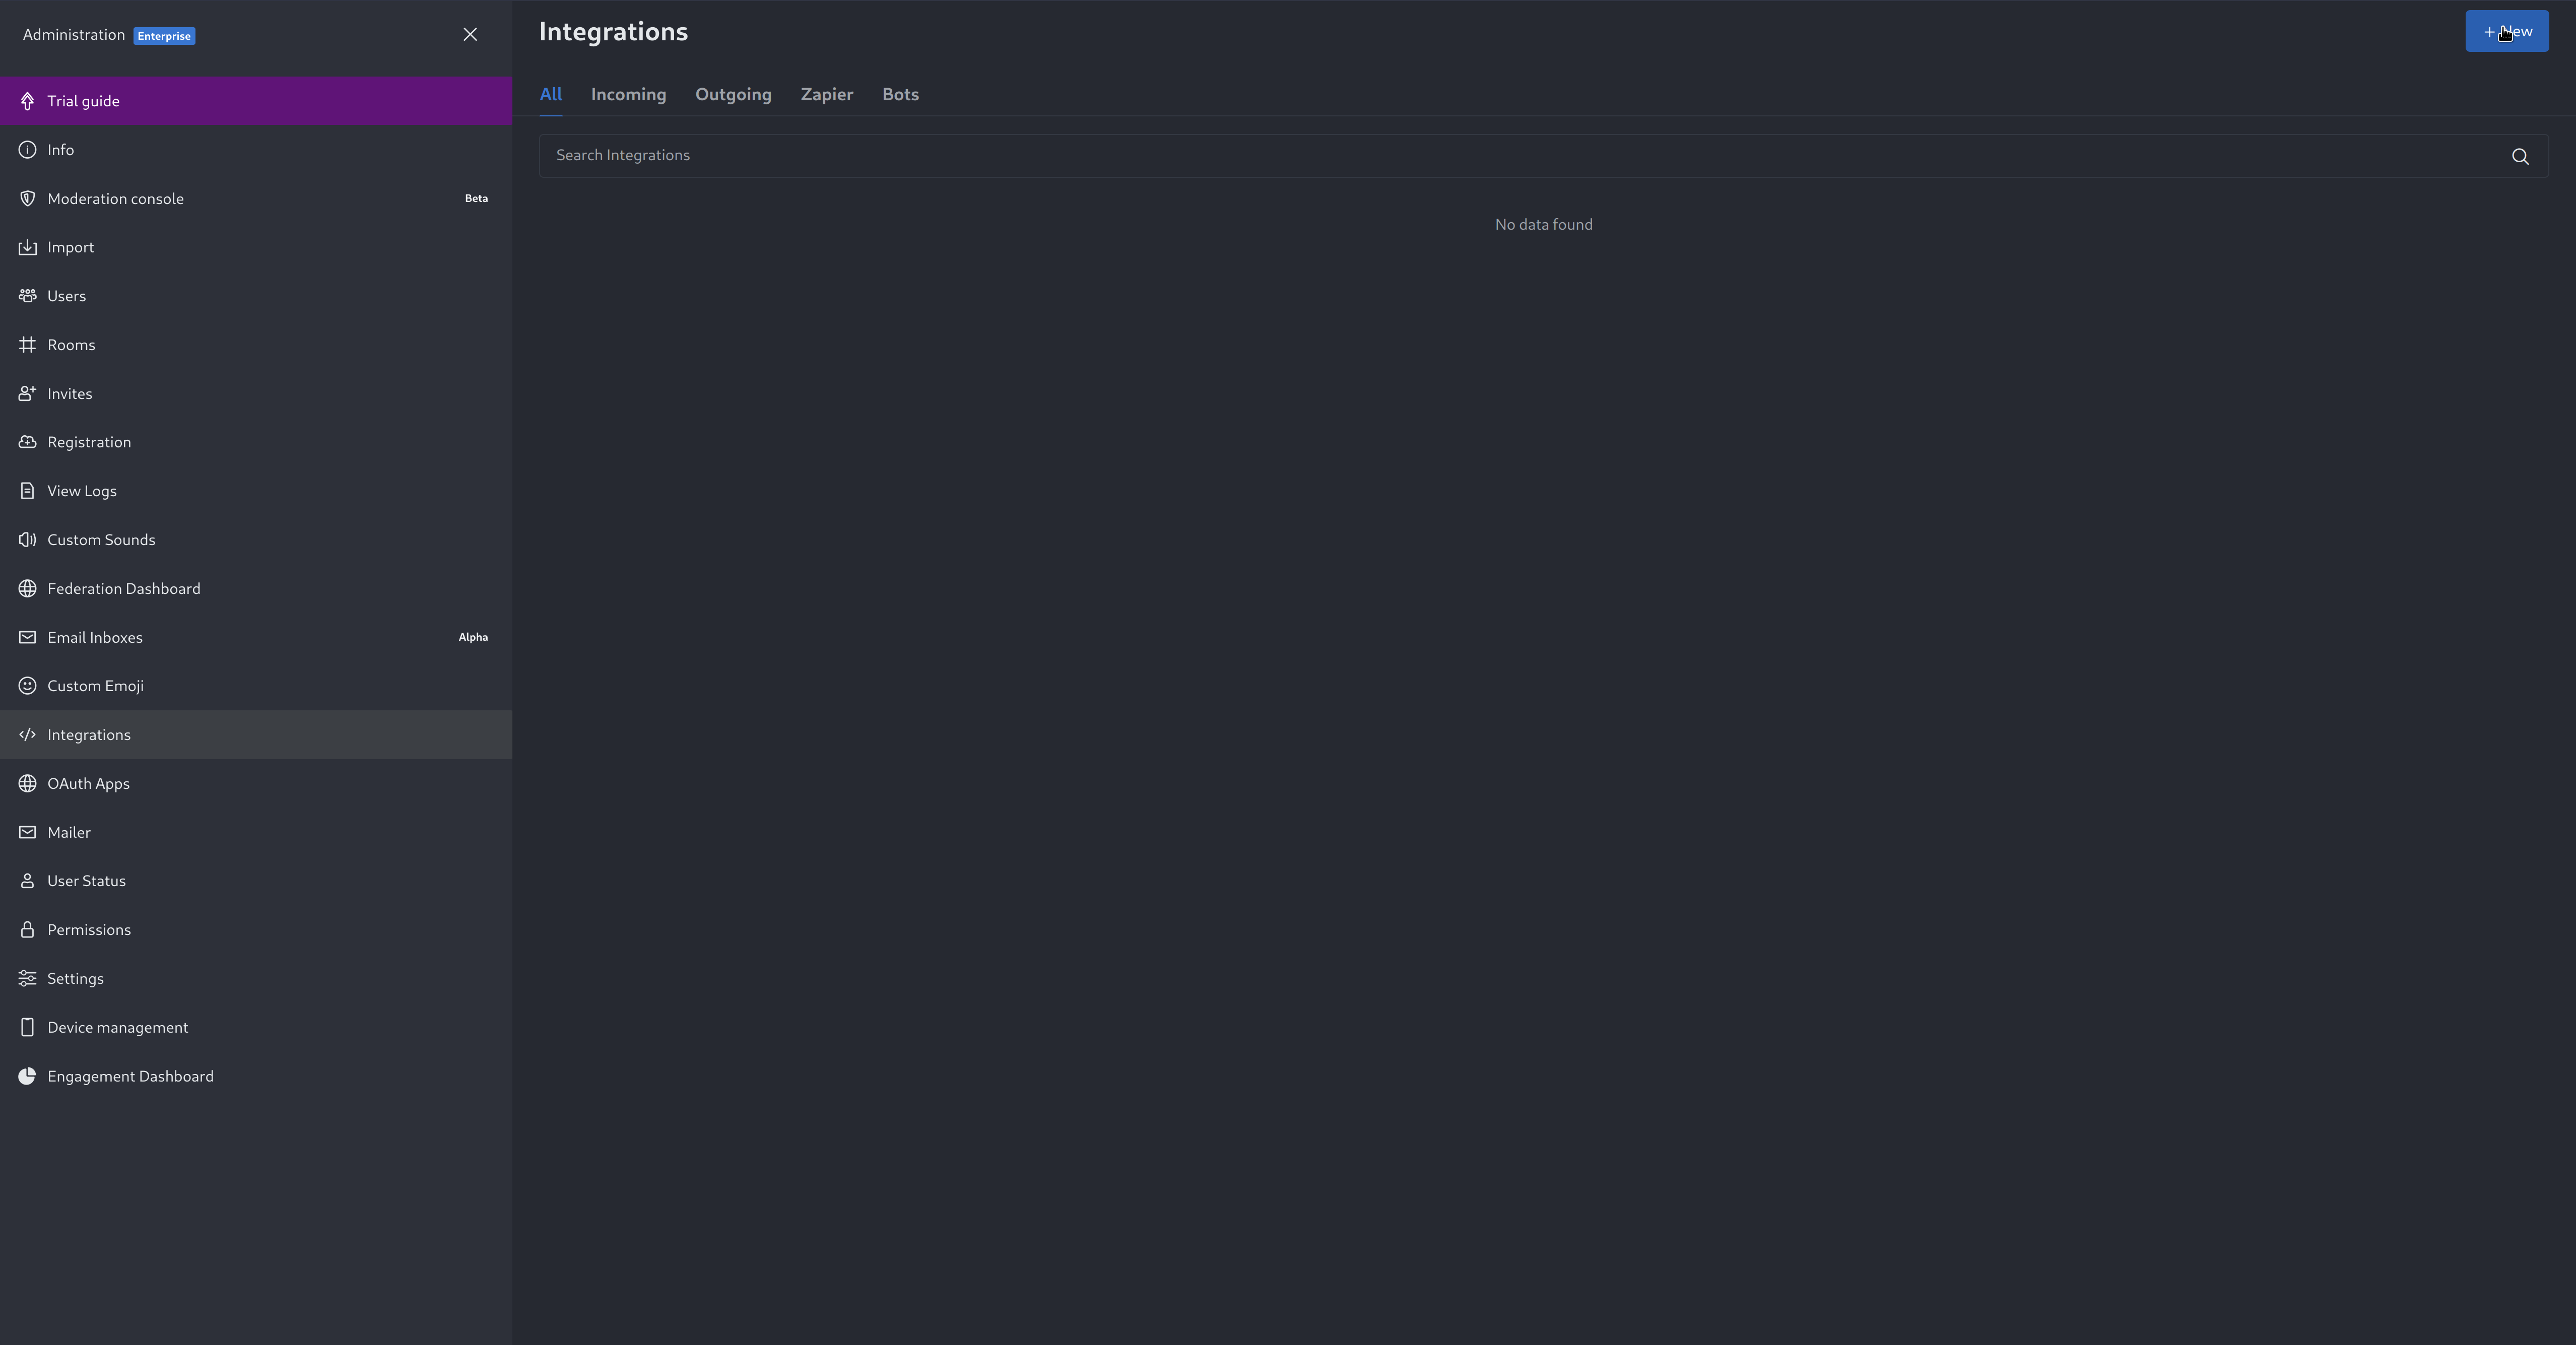 - -3. For more details about each parameter, check [create-a-new-incoming-webhook](https://docs.rocket.chat/use-rocket.chat/workspace-administration/integrations#create-a-new-incoming-webhook). - -4. After configuring integration, click Save. - -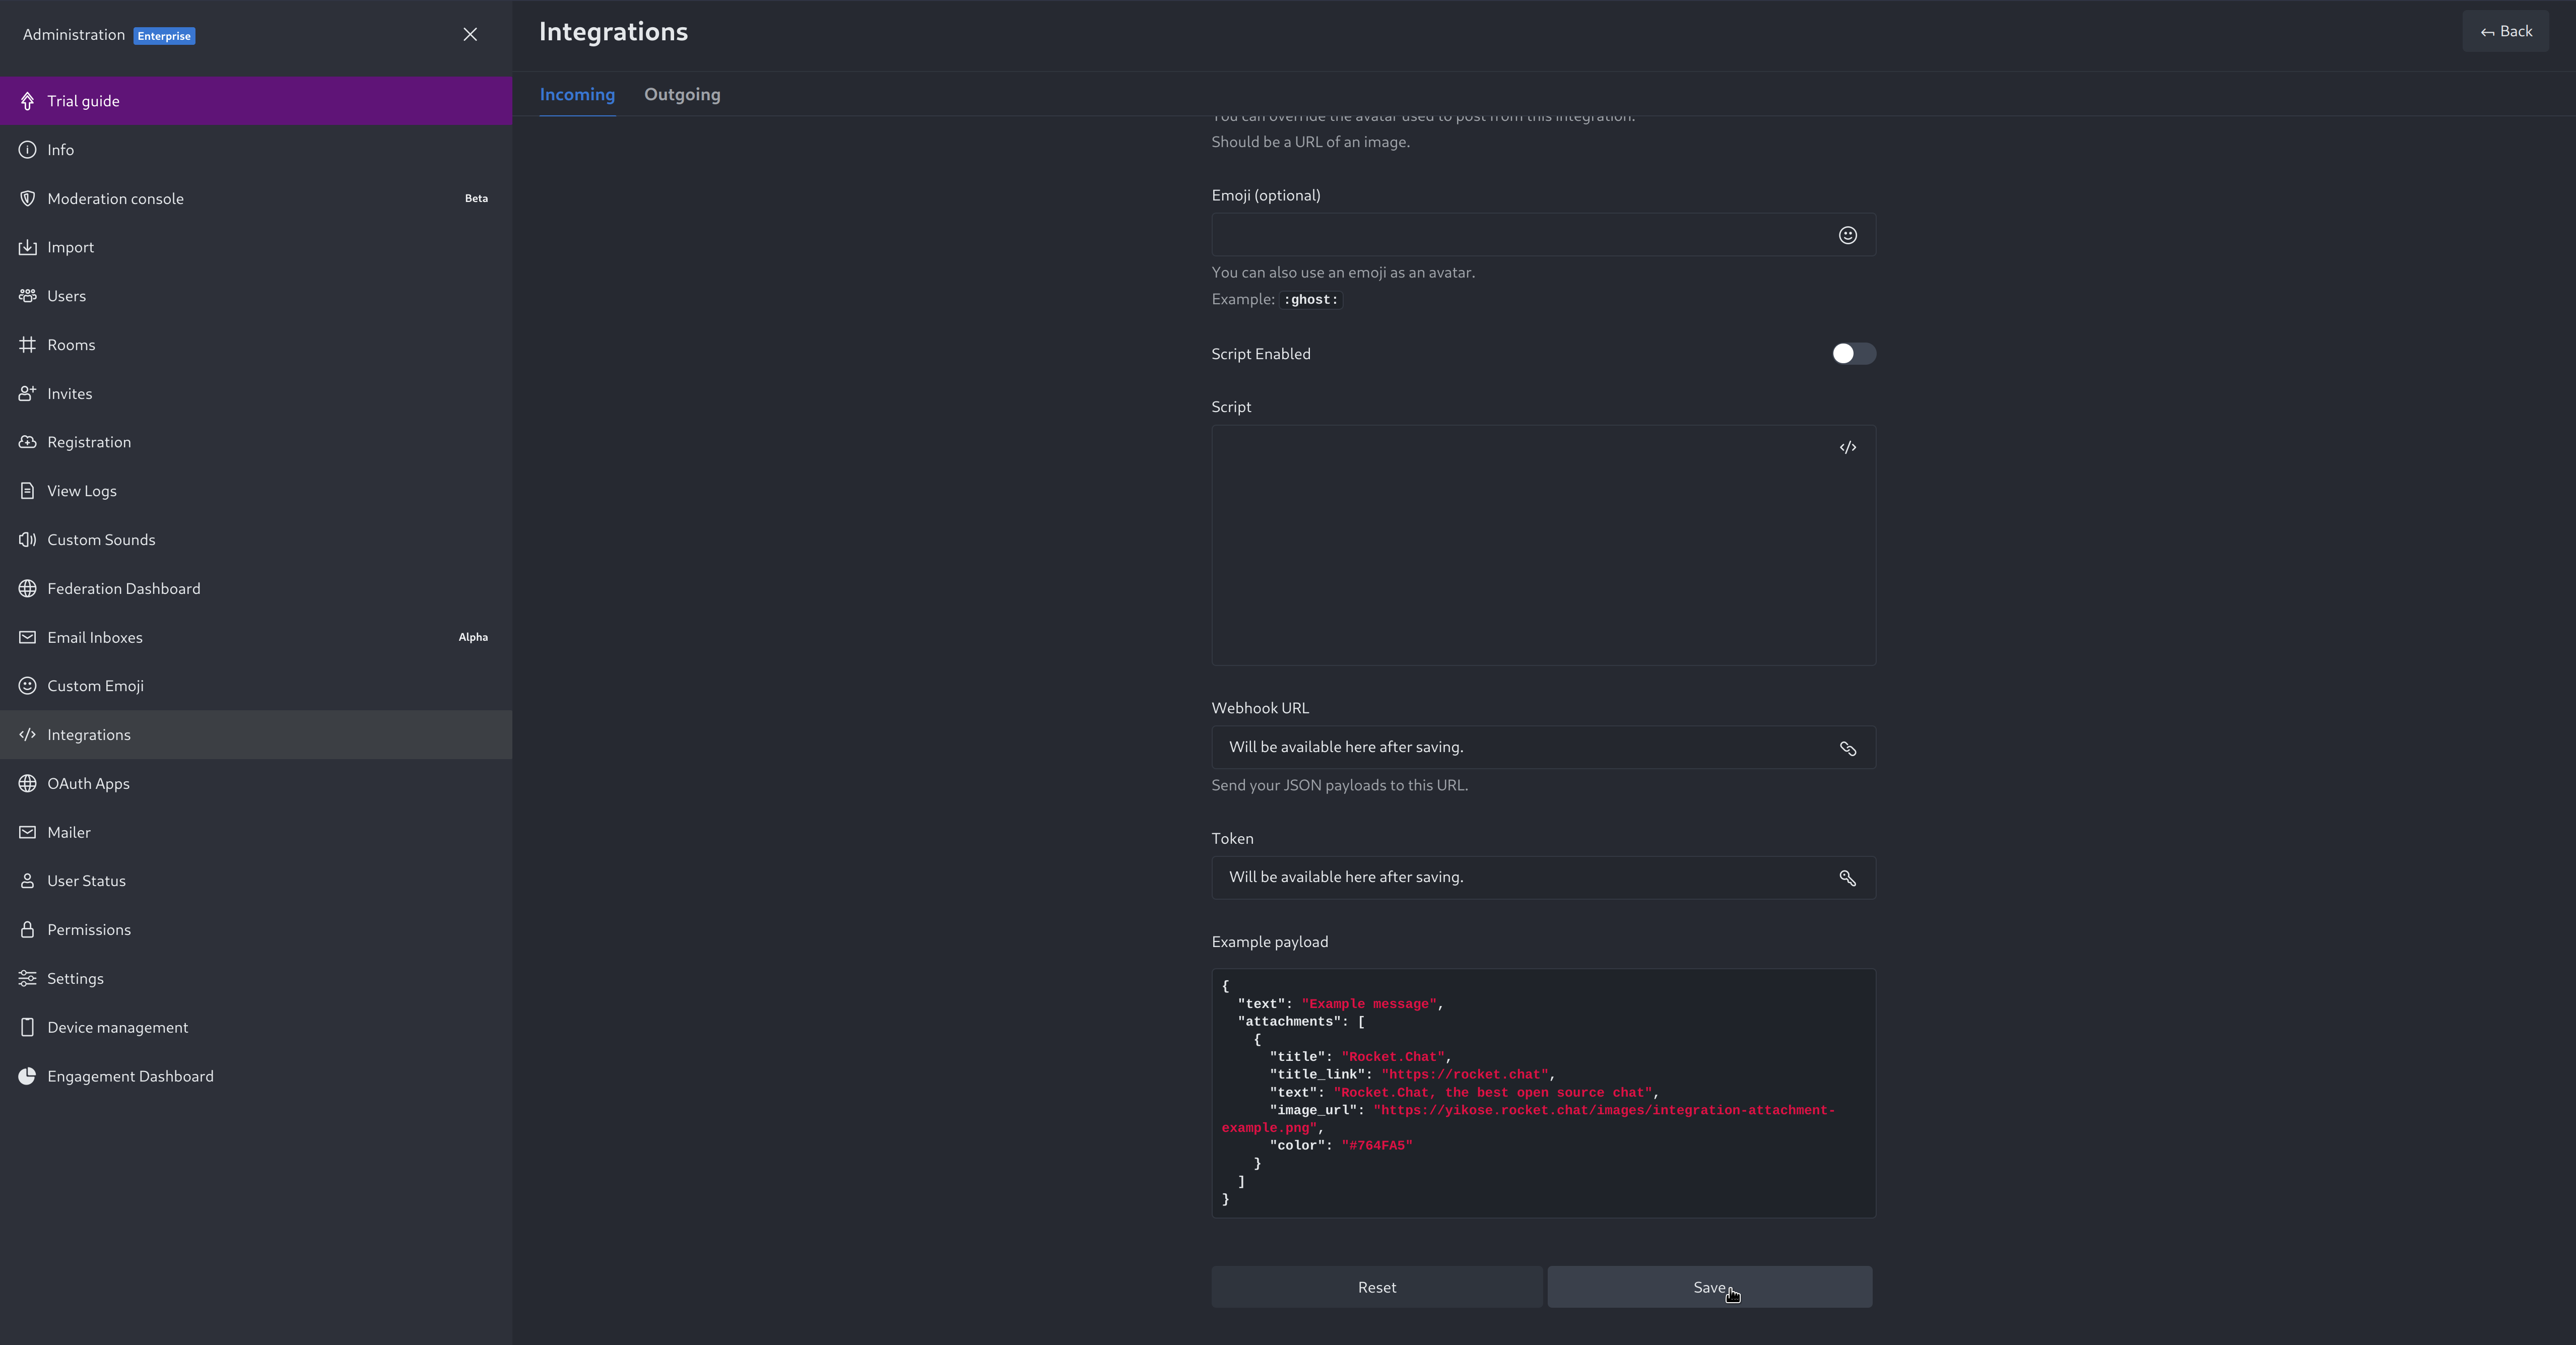 - -4. You will end up with a webhook endpoint that looks like so: -``` -https://your-server.rocket.chat/hooks/YYYYYYYYYYYYYYYYYYYYYYYY/XXXXXXXXXXXXXXXXXXXXXXXXXXXXXXXXXXXXXXXXXXXXXXXX -``` - - Treat this endpoint as a secret. Anyone who has it will be able to post messages to your RocketChat instance. - -For more details please check RocketChat's article [Incoming webhooks for RocketChat](https://docs.rocket.chat/use-rocket.chat/workspace-administration/integrations/). diff --git a/docs/cloud/alerts-notifications/add-slack-notification-configuration.md b/docs/cloud/alerts-notifications/add-slack-notification-configuration.md deleted file mode 100644 index ed845b4d..00000000 --- a/docs/cloud/alerts-notifications/add-slack-notification-configuration.md +++ /dev/null @@ -1,47 +0,0 @@ -# Add Slack notification configuration - -From the Cloud interface, you can manage your space's notification settings and from these you can add a specific configuration to get notifications delivered on Slack. - -## Prerequisites - -To add slack notification configurations you need: - -- A Netdata Cloud account -- Access to the space as an **administrator** -- Space needs to be on **Business** plan or higher -- Have a Slack app on your workspace to receive the webhooks, for more details check [how to configure this on Slack](#settings-on-slack) - -## Steps - -1. Click on the **Space settings** cog (located above your profile icon) -1. Click on the **Notification** tab -1. Click on the **+ Add configuration** button (near the top-right corner of your screen) -1. On the **Slack** card click on **+ Add** -1. A modal will be presented to you to enter the required details to enable the configuration: - 1. **Notification settings** are Netdata specific settings - - Configuration name - you can optionally provide a name for your configuration you can easily refer to it - - Rooms - by specifying a list of Rooms you are select to which nodes or areas of your infrastructure you want to be notified using this configuration - - Notification - you specify which notifications you want to be notified using this configuration: All Alerts and unreachable, All Alerts, Critical only - 1. **Integration configuration** are the specific notification integration required settings, which vary by notification method. For Slack: - - Webhook URL - URL provided on Slack for the channel you want to receive your notifications. For more details check [how to configure this on Slack](#settings-on-slack) - -## Settings on Slack - -To enable the webhook integrations on Slack you need: -1. Create an app to receive webhook integrations. Check [Create an app](https://api.slack.com/apps?new_app=1) from Slack documentation for further details -1. Install the app on your workspace -1. Configure Webhook URLs for your workspace - - On your app go to **Incoming Webhooks** and click on **activate incoming webhooks** - - 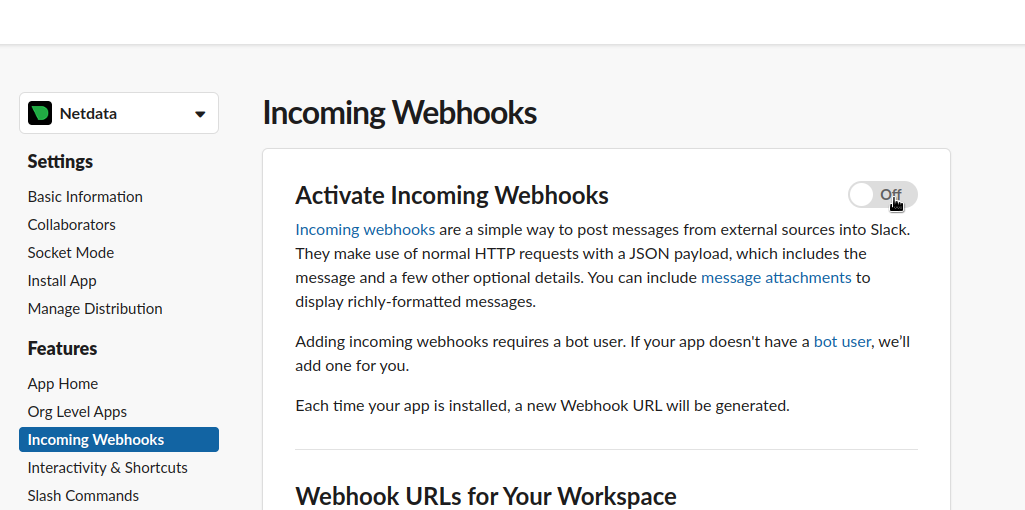 - - - At the bottom of **Webhook URLs for Your Workspace** section you have **Add New Webhook to Workspace** - - After pressing that specify the channel where you want your notifications to be delivered - - 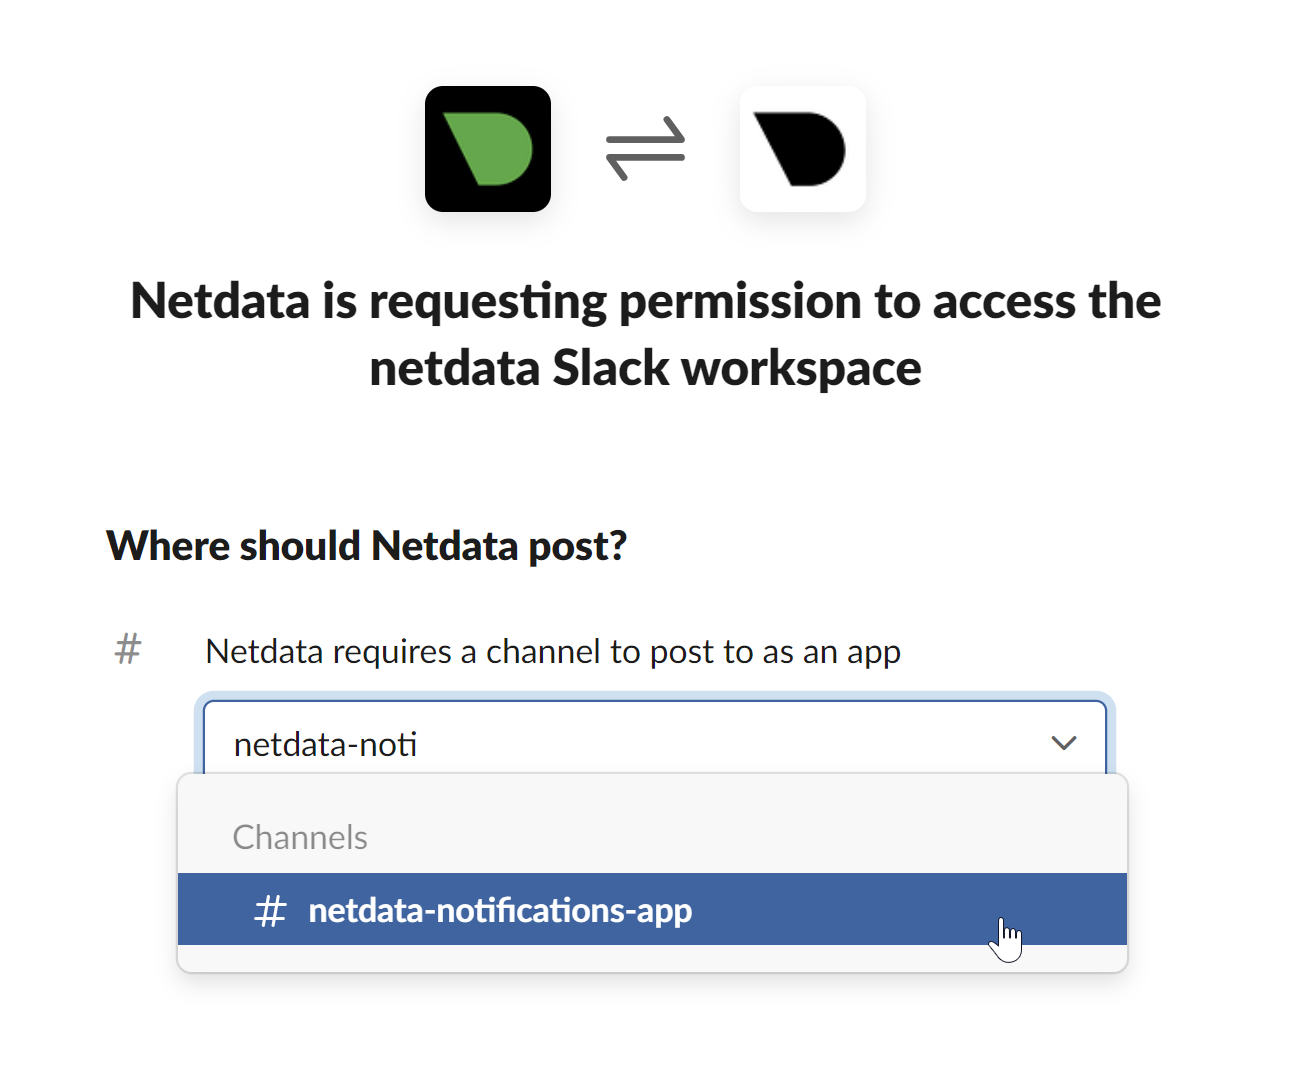 - - - Once completed copy the Webhook URL that you will need to add to your notification configuration on Netdata UI - - 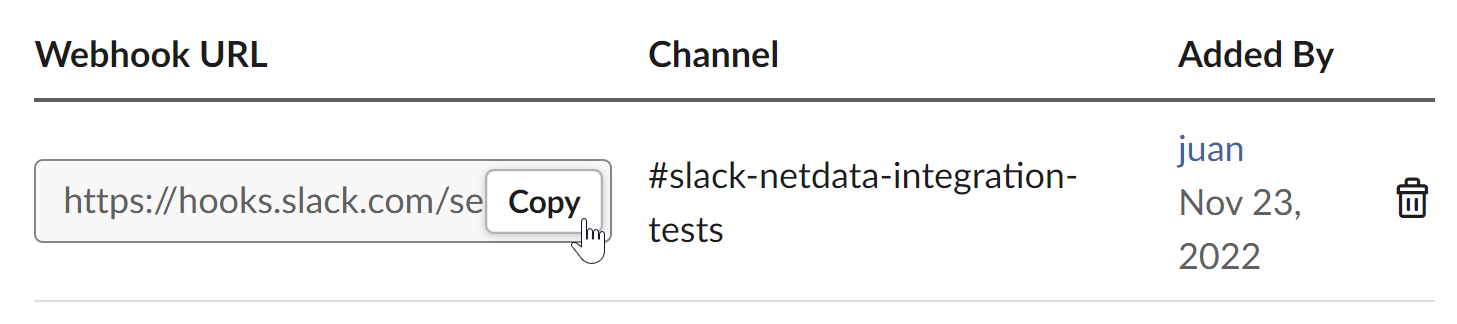 - -For more details please check Slacks's article [Incoming webhooks for Slack](https://slack.com/help/articles/115005265063-Incoming-webhooks-for-Slack). diff --git a/docs/cloud/alerts-notifications/add-webhook-notification-configuration.md b/docs/cloud/alerts-notifications/add-webhook-notification-configuration.md deleted file mode 100644 index 4fb518f6..00000000 --- a/docs/cloud/alerts-notifications/add-webhook-notification-configuration.md +++ /dev/null @@ -1,234 +0,0 @@ -# Add webhook notification configuration - -From the Cloud interface, you can manage your space's notification settings and from these you can add a specific configuration to get notifications delivered on a webhook using a predefined schema. - -## Prerequisites - -To add webhook notification configurations you need: - -- A Netdata Cloud account -- Access to the space as an **administrator** -- Space needs to be on **Pro** plan or higher -- Have an app that allows you to receive webhooks following a predefined schema, for more details check [how to create the webhook service](#webhook-service) - -## Steps - -1. Click on the **Space settings** cog (located above your profile icon) -1. Click on the **Notification** tab -1. Click on the **+ Add configuration** button (near the top-right corner of your screen) -1. On the **webhook** card click on **+ Add** -1. A modal will be presented to you to enter the required details to enable the configuration: - 1. **Notification settings** are Netdata specific settings - - Configuration name - you can optionally provide a name for your configuration you can easily refer to it - - Rooms - by specifying a list of Rooms you are select to which nodes or areas of your infrastructure you want to be notified using this configuration - - Notification - you specify which notifications you want to be notified using this configuration: All Alerts and unreachable, All Alerts, Critical only - 1. **Integration configuration** are the specific notification integration required settings, which vary by notification method. For webhook: - - Webhook URL - webhook URL is the url of the service that Netdata will send notifications to. In order to keep the communication secured, we only accept HTTPS urls. Check [how to create the webhook service](#webhook-service). - - Extra headers - these are optional key-value pairs that you can set to be included in the HTTP requests sent to the webhook URL. For more details check [Extra headers](#extra-headers) - - Authentication Mechanism - Netdata webhook integration supports 3 different authentication mechanisms. For more details check [Authentication mechanisms](#authentication-mechanisms): - - Mutual TLS (recommended) - default authentication mechanism used if no other method is selected. - - Basic - the client sends a request with an Authorization header that includes a base64-encoded string in the format **username:password**. These will settings will be required inputs. - - Bearer - the client sends a request with an Authorization header that includes a **bearer token**. This setting will be a required input. - -## Webhook service - -A webhook integration allows your application to receive real-time alerts from Netdata by sending HTTP requests to a specified URL. In this document, we'll go over the steps to set up a generic webhook integration, including adding headers, and implementing different types of authorization mechanisms. - -### Netdata webhook integration - -A webhook integration is a way for one service to notify another service about events that occur within it. This is done by sending an HTTP POST request to a specified URL (known as the "webhook URL") when an event occurs. - -Netdata webhook integration service will send alert notifications to the destination service as soon as they are detected. - -The notification content sent to the destination service will be a JSON object having these properties: - -| field | type | description | -|:----------------------------------|:------------------------------|:--------------------------------------------------------------------------| -| message | string | A summary message of the alert. | -| alarm | string | The alert the notification is about. | -| info | string | Additional info related with the alert. | -| chart | string | The chart associated with the alert. | -| context | string | The chart context. | -| space | string | The space where the node that raised the alert is assigned. | -| rooms | object[object(string,string)] | Object with list of rooms names and urls where the node belongs to. | -| family | string | Context family. | -| class | string | Classification of the alert, e.g. "Error". | -| severity | string | Alert severity, can be one of "warning", "critical" or "clear". | -| date | string | Date of the alert in ISO8601 format. | -| duration | string | Duration the alert has been raised. | -| additional_active_critical_alerts | integer | Number of additional critical alerts currently existing on the same node. | -| additional_active_warning_alerts | integer | Number of additional warning alerts currently existing on the same node. | -| alarm_url | string | Netdata Cloud URL for this alert. | - -### Extra headers - -When setting up a webhook integration, the user can specify a set of headers to be included in the HTTP requests sent to the webhook URL. - -By default, the following headers will be sent in the HTTP request - -| **Header** | **Value** | -|:------------:|------------------| -| Content-Type | application/json | - -### Authentication mechanisms - -Netdata webhook integration supports 3 different authentication mechanisms: - -#### Mutual TLS authentication (recommended) - -In mutual Transport Layer Security (mTLS) authentication, the client and the server authenticate each other using X.509 certificates. This ensures that the client is connecting to the intended server, and that the server is only accepting connections from authorized clients. - -This is the default authentication mechanism used if no other method is selected. - -To take advantage of mutual TLS, you can configure your server to verify Netdata's client certificate. In order to achieve this, the Netdata client sending the notification supports mutual TLS (mTLS) to identify itself with a client certificate that your server can validate. - -The steps to perform this validation are as follows: - -- Store Netdata CA certificate on a file in your disk. The content of this file should be: - -<details> - <summary>Netdata CA certificate</summary> - -``` ------BEGIN CERTIFICATE----- -MIIF0jCCA7qgAwIBAgIUDV0rS5jXsyNX33evHEQOwn9fPo0wDQYJKoZIhvcNAQEN -BQAwgYAxCzAJBgNVBAYTAlVTMRMwEQYDVQQIEwpDYWxpZm9ybmlhMRYwFAYDVQQH -Ew1TYW4gRnJhbmNpc2NvMRYwFAYDVQQKEw1OZXRkYXRhLCBJbmMuMRIwEAYDVQQL -EwlDbG91ZCBTUkUxGDAWBgNVBAMTD05ldGRhdGEgUm9vdCBDQTAeFw0yMzAyMjIx -MjQzMDBaFw0zMzAyMTkxMjQzMDBaMIGAMQswCQYDVQQGEwJVUzETMBEGA1UECBMK -Q2FsaWZvcm5pYTEWMBQGA1UEBxMNU2FuIEZyYW5jaXNjbzEWMBQGA1UEChMNTmV0 -ZGF0YSwgSW5jLjESMBAGA1UECxMJQ2xvdWQgU1JFMRgwFgYDVQQDEw9OZXRkYXRh -IFJvb3QgQ0EwggIiMA0GCSqGSIb3DQEBAQUAA4ICDwAwggIKAoICAQCwIg7z3R++ -ppQYYVVoMIDlhWO3qVTMsAQoJYEvVa6fqaImUBLW/k19LUaXgUJPohB7gBp1pkjs -QfY5dBo8iFr7MDHtyiAFjcQV181sITTMBEJwp77R4slOXCvrreizhTt1gvf4S1zL -qeHBYWEgH0RLrOAqD0jkOHwewVouO0k3Wf2lEbCq3qRk2HeDvkv0LR7sFC+dDms8 -fDHqb/htqhk+FAJELGRqLeaFq1Z5Eq1/9dk4SIeHgK5pdYqsjpBzOTmocgriw6he -s7F3dOec1ZZdcBEAxOjbYt4e58JwuR81cWAVMmyot5JNCzYVL9e5Vc5n22qt2dmc -Tzw2rLOPt9pT5bzbmyhcDuNg2Qj/5DySAQ+VQysx91BJRXyUimqE7DwQyLhpQU72 -jw29lf2RHdCPNmk8J1TNropmpz/aI7rkperPugdOmxzP55i48ECbvDF4Wtazi+l+ -4kx7ieeLfEQgixy4lRUUkrgJlIDOGbw+d2Ag6LtOgwBiBYnDgYpvLucnx5cFupPY -Cy3VlJ4EKUeQQSsz5kVmvotk9MED4sLx1As8V4e5ViwI5dCsRfKny7BeJ6XNPLnw -PtMh1hbiqCcDmB1urCqXcMle4sRhKccReYOwkLjLLZ80A+MuJuIEAUUuEPCwywzU -R7pagYsmvNgmwIIuJtB6mIJBShC7TpJG+wIDAQABo0IwQDAOBgNVHQ8BAf8EBAMC -AQYwDwYDVR0TAQH/BAUwAwEB/zAdBgNVHQ4EFgQU9IbvOsPSUrpr8H2zSafYVQ9e -Ft8wDQYJKoZIhvcNAQENBQADggIBABQ08aI31VKZs8jzg+y/QM5cvzXlVhcpkZsY -1VVBr0roSBw9Pld9SERrEHto8PVXbadRxeEs4sKivJBKubWAooQ6NTvEB9MHuGnZ -VCU+N035Gq/mhBZgtIs/Zz33jTB2ju3G4Gm9VTZbVqd0OUxFs41Iqvi0HStC3/Io -rKi7crubmp5f2cNW1HrS++ScbTM+VaKVgQ2Tg5jOjou8wtA+204iYXlFpw9Q0qnP -qq6ix7TfLLeRVp6mauwPsAJUgHZluz7yuv3r7TBdukU4ZKUmfAGIPSebtB3EzXfH -7Y326xzv0hEpjvDHLy6+yFfTdBSrKPsMHgc9bsf88dnypNYL8TUiEHlcTgCGU8ts -ud8sWN2M5FEWbHPNYRVfH3xgY2iOYZzn0i+PVyGryOPuzkRHTxDLPIGEWE5susM4 -X4bnNJyKH1AMkBCErR34CLXtAe2ngJlV/V3D4I8CQFJdQkn9tuznohUU/j80xvPH -FOcDGQYmh4m2aIJtlNVP6+/92Siugb5y7HfslyRK94+bZBg2D86TcCJWaaZOFUrR -Y3WniYXsqM5/JI4OOzu7dpjtkJUYvwtg7Qb5jmm8Ilf5rQZJhuvsygzX6+WM079y -nsjoQAm6OwpTN5362vE9SYu1twz7KdzBlUkDhePEOgQkWfLHBJWwB+PvB1j/cUA3 -5zrbwvQf ------END CERTIFICATE----- -``` -</details> - -- Enable client certificate validation on the web server that is doing the TLS termination. Below we show you how to perform this configuration in `NGINX` and `Apache` - - **NGINX** - -```bash -server { - listen 443 ssl default_server; - - # ... existing SSL configuration for server authentication ... - ssl_verify_client on; - ssl_client_certificate /path/to/Netdata_CA.pem; - - location / { - if ($ssl_client_s_dn !~ "CN=app.netdata.cloud") { - return 403; - } - # ... existing location configuration ... - } -} -``` - -**Apache** - -```bash -Listen 443 -<VirtualHost *:443> - # ... existing SSL configuration for server authentication ... - SSLVerifyClient require - SSLCACertificateFile "/path/to/Netdata_CA.pem" -</VirtualHost> -<Directory /var/www/> - Require expr "%{SSL_CLIENT_S_DN_CN} == 'app.netdata.cloud'" - # ... existing directory configuration ... -</Directory> -``` - -#### Basic authentication - -In basic authorization, the client sends a request with an Authorization header that includes a base64-encoded string in the format username:password. The server then uses this information to authenticate the client. If this authentication method is selected, the user can set the user and password that will be used when connecting to the destination service. - -#### Bearer token authentication - -In bearer token authentication, the client sends a request with an Authorization header that includes a bearer token. The server then uses this token to authenticate the client. Bearer tokens are typically generated by an authentication service, and are passed to the client after a successful authentication. If this method is selected, the user can set the token to be used for connecting to the destination service. - -##### Challenge secret - -To validate that you has ownership of the web application that will receive the webhook events, we are using a challenge response check mechanism. - -This mechanism works as follows: - -- The challenge secret parameter that you provide is a shared secret between you and Netdata only. -- On your request for creating a new Webhook integration, we will make a GET request to the url of the webhook, adding a query parameter `crc_token`, consisting of a random string. -- You will receive this request on your application and it must construct an encrypted response, consisting of a base64-encoded HMAC SHA-256 hash created from the crc_token and the shared secret. The response will be in the format: - -```json -{ - "response_token": "sha256=9GKoHJYmcHIkhD+C182QWN79YBd+D+Vkj4snmZrfNi4=" -} -``` - -- We will compare your application's response with the hash that we will generate using the challenge secret, and if they are the same, the integration creation will succeed. - -We will do this validation everytime you update your integration configuration. - -- Response requirements: - - A base64 encoded HMAC SHA-256 hash created from the crc_token and the shared secret. - - Valid response_token and JSON format. - - Latency less than 5 seconds. - - 200 HTTP response code. - -**Example response token generation in Python:** - -Here you can see how to define a handler for a Flask application in python 3: - -```python -import base64 -import hashlib -import hmac -import json - -key ='YOUR_CHALLENGE_SECRET' - -@app.route('/webhooks/netdata') -def webhook_challenge(): - token = request.args.get('crc_token').encode('ascii') - - # creates HMAC SHA-256 hash from incomming token and your consumer secret - sha256_hash_digest = hmac.new(key.encode(), - msg=token, - digestmod=hashlib.sha256).digest() - - # construct response data with base64 encoded hash - response = { - 'response_token': 'sha256=' + base64.b64encode(sha256_hash_digest).decode('ascii') - } - - # returns properly formatted json response - return json.dumps(response) -``` - -#### Related topics - -- [Alerts Configuration](https://github.com/netdata/netdata/blob/master/health/README.md) -- [Alert Notifications](https://github.com/netdata/netdata/blob/master/docs/cloud/alerts-notifications/notifications.md) -- [Manage notification methods](https://github.com/netdata/netdata/blob/master/docs/cloud/alerts-notifications/manage-notification-methods.md) diff --git a/docs/cloud/manage/organize-your-infrastrucutre-invite-your-team.md b/docs/cloud/manage/organize-your-infrastrucutre-invite-your-team.md index 95bc1741..b36e0806 100644 --- a/docs/cloud/manage/organize-your-infrastrucutre-invite-your-team.md +++ b/docs/cloud/manage/organize-your-infrastrucutre-invite-your-team.md @@ -128,7 +128,7 @@ Click on the gear icon of the War Room's name in the top of the page to do that. 2. To **include an existing node** to a War Room or **connect a new node\*** click on **Nodes** tab. Choose any connected node you want to add to this War Room by clicking on the checkbox next to its hostname, then click **+ Add** at the top of the panel. 3. To **add existing users to a War Room**, click on **Add Users**. - See our [invite doc](#invite-your-team.md) for details on inviting new users to your Space in Netdata Cloud. + See our [invite section](#invite-your-team) for details on inviting new users to your Space in Netdata Cloud. > #### Note > diff --git a/docs/cloud/netdata-functions.md b/docs/cloud/netdata-functions.md index 80616ca4..caff9b35 100644 --- a/docs/cloud/netdata-functions.md +++ b/docs/cloud/netdata-functions.md @@ -30,11 +30,19 @@ functions - [plugins.d](https://github.com/netdata/netdata/blob/master/collector #### What functions are currently available? -| Function | Description | plugin - module | -| :-- | :-- | :-- | -| processes | Detailed information on the currently running processes on the node. | [apps.plugin](https://github.com/netdata/netdata/blob/master/collectors/apps.plugin/README.md) | -| ebpf_socket | Detailed socket information. | [ebpf.plugin](https://github.com/netdata/netdata/blob/master/collectors/ebpf.plugin/README.md#ebpf_thread) | -| ebpf_thread | Controller for eBPF threads. | [ebpf.plugin](https://github.com/netdata/netdata/blob/master/collectors/ebpf.plugin/README.md#ebpf_socket) | +| Function | Description | Alternative to CLI tools | plugin - module | +|:-------------------|:---------------------------------------------------------------------------------------------------------------------------------------------------------------|---------------------------------|:-----------------------------------------------------------------------------------------------------------| +| block-devices | Disk I/O activity for all block devices, offering insights into both data transfer volume and operation performance. | `iostat` | [proc](https://github.com/netdata/netdata/tree/master/collectors/proc.plugin#readme) | +| containers-vms | Insights into the resource utilization of containers and QEMU virtual machines: CPU usage, memory consumption, disk I/O, and network traffic. | `docker stats`, `systemd-cgtop` | [cgroups](https://github.com/netdata/netdata/tree/master/collectors/cgroups.plugin#readme) | +| ipmi-sensors | Readings and status of IPMI sensors. | `ipmi-sensors` | [freeipmi](https://github.com/netdata/netdata/tree/master/collectors/freeipmi.plugin#readme) | +| mount-points | Disk usage for each mount point, including used and available space, both in terms of percentage and actual bytes, as well as used and available inode counts. | `df` | [diskspace](https://github.com/netdata/netdata/tree/master/collectors/diskspace.plugin#readme) | +| network interfaces | Network traffic, packet drop rates, interface states, MTU, speed, and duplex mode for all network interfaces. | `bmon`, `bwm-ng` | [proc](https://github.com/netdata/netdata/tree/master/collectors/proc.plugin#readme) | +| processes | Real-time information about the system's resource usage, including CPU utilization, memory consumption, and disk IO for every running process. | `top`, `htop` | [apps](https://github.com/netdata/netdata/blob/master/collectors/apps.plugin/README.md) | +| systemd-journal | Viewing, exploring and analyzing systemd journal logs. | `journalctl` | [systemd-journal](https://github.com/netdata/netdata/tree/master/collectors/systemd-journal.plugin#readme) | +| systemd-list-units | Information about all systemd units, including their active state, description, whether or not they are enabled, and more. | `systemctl list-units` | [systemd-journal](https://github.com/netdata/netdata/tree/master/collectors/systemd-journal.plugin#readme) | +| systemd-services | System resource utilization for all running systemd services: CPU, memory, and disk IO. | `systemd-cgtop` | [cgroups](https://github.com/netdata/netdata/tree/master/collectors/cgroups.plugin#readme) | +| streaming | Comprehensive overview of all Netdata children instances, offering detailed information about their status, replication completion time, and many more. | | | + If you have ideas or requests for other functions: * Participate in the relevant [GitHub discussion](https://github.com/netdata/netdata/discussions/14412) @@ -43,7 +51,7 @@ If you have ideas or requests for other functions: #### How do functions work with streaming? -Via streaming, the definitions of functions are transmitted to a parent node so it knows all the functions available on +Via streaming, the definitions of functions are transmitted to a parent node, so it knows all the functions available on any children connected to it. If the parent node is the one connected to Netdata Cloud it is capable of triggering the call to the respective children @@ -51,7 +59,7 @@ node to run the function. #### Why are they available only on Netdata Cloud? -Since these functions are able to execute routines on the node and due the potential use cases that they can cover, our +Since these functions are able to execute routines on the node and due to the potential use cases that they can cover, our concern is to ensure no sensitive information or disruptive actions are exposed through the Agent's API. diff --git a/docs/cloud/visualize/dashboards.md b/docs/cloud/visualize/dashboards.md index 8291d6f1..4b4baf42 100644 --- a/docs/cloud/visualize/dashboards.md +++ b/docs/cloud/visualize/dashboards.md @@ -9,22 +9,30 @@ Click on the **Dashboards** tab in any War Room to get started. From the Dashboards tab, click on the **+** button. -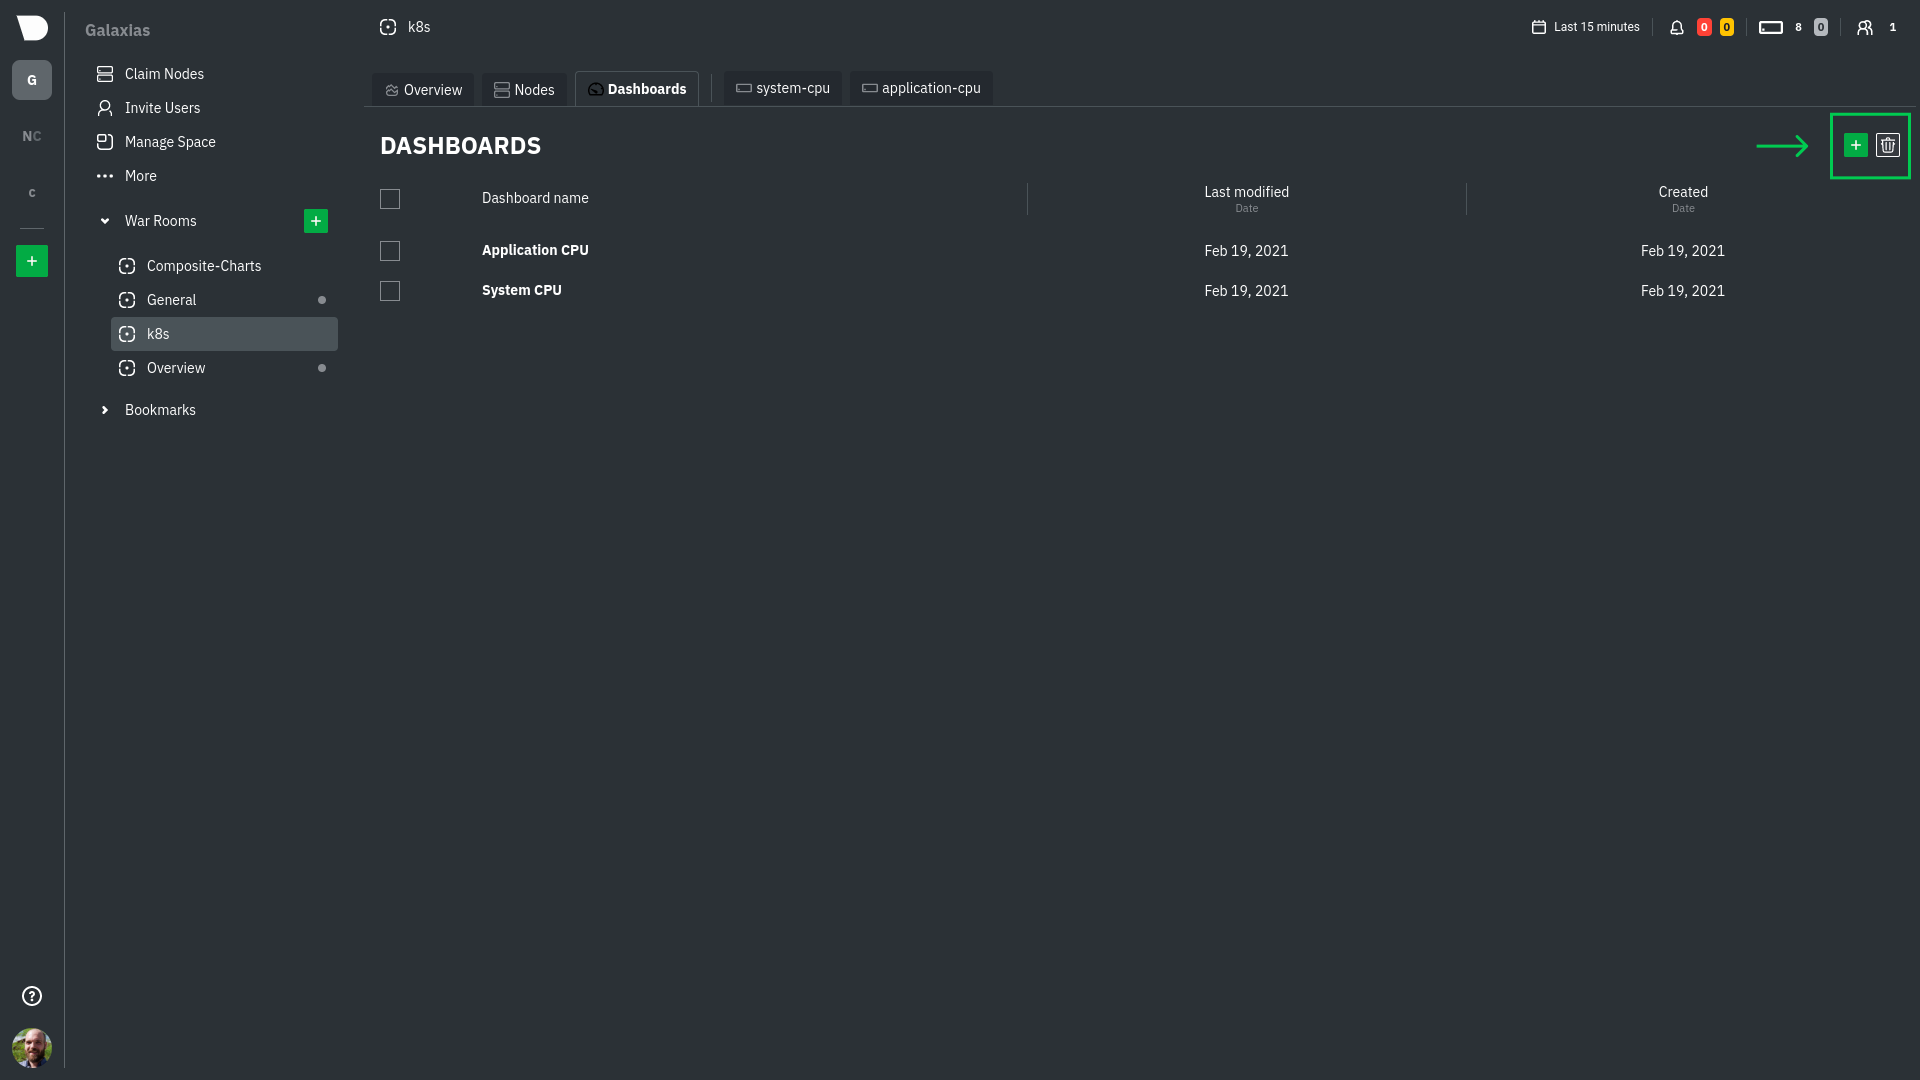 +<img width="98" alt=" Green plus button " src="https://github.com/netdata/netdata/assets/73346910/511e2b38-e751-4a88-bc7d-bcd49764b7f6"/> -In the modal, give your new dashboard a name, and click **+ Add**. -Click the **Add Chart** button to add your first chart card. From the dropdown, select either *All Nodes** or a specific -node. If you select **All Nodes**, you will add a [composite chart](https://github.com/netdata/netdata/blob/master/docs/cloud/visualize/overview.md) to -your new dashboard. Next, select the context. You'll see a preview of the chart before you finish adding it. +In the modal, give your new dashboard a name, and click **+ Add**. -The **Add Text** button creates a new card with user-defined text, which you can use to describe or document a +- The **Add Chart** button on the top right of the interface adds your first chart card. From the dropdown, select either **All Nodes** or a specific +node. Next, select the context. You'll see a preview of the chart before you finish adding it. In this modal you can also [interact with the chart](https://github.com/netdata/netdata/blob/master/docs/cloud/visualize/interact-new-charts.md), meaning you can configure all the aspects of the [NIDL framework](https://github.com/netdata/netdata/blob/master/docs/cloud/visualize/interact-new-charts.md#nidl-framework) of the chart and more in detail, you can: + - define which `group by` method to use + - select the aggregation function over the data source + - select nodes + - select instances + - select dimensions + - select labels + - select the aggregation function over time + + After you are done configuring the chart, you can also change the type of the chart from the right hand side of the [Title bar](https://github.com/netdata/netdata/blob/master/docs/cloud/visualize/interact-new-charts.md#title-bar), and select which of the final dimensions you want to be visible and in what order, from the [Dimensions bar](https://github.com/netdata/netdata/blob/master/docs/cloud/visualize/interact-new-charts.md#dimensions-bar). + +- The **Add Text** button on the top right of the interface creates a new card with user-defined text, which you can use to describe or document a particular dashboard's meaning and purpose. -Be sure to click the **Save** button any time you make changes to your dashboard. +> ### Important +> +> Be sure to click the **Save** button any time you make changes to your dashboard. - ## Using your dashboard @@ -33,24 +41,17 @@ of any number of **cards**, which can contain charts or text. ### Chart cards -Click the **Add Chart** button to add your first chart card. From the dropdown, select either *All Nodes** or a specific -node. If you select **All Nodes**, you will add a [composite chart](https://github.com/netdata/netdata/blob/master/docs/cloud/visualize/overview.md) to -your new dashboard. Next, select the context. You'll see a preview of the chart before you finish adding it. - -The charts you add to any dashboard are fully interactive, just like the charts in an Agent dashboard or a single node's -dashboard in Cloud. Zoom in and out, highlight timeframes, and more. +The charts you add to any dashboard are [fully interactive](https://github.com/netdata/netdata/blob/master/docs/cloud/visualize/interact-new-charts.md), just like any other Netdata chart. You can zoom in and out, highlight timeframes, and more. Charts also synchronize as you interact with them, even across contexts _or_ nodes. ### Text cards -The **Add Text** button creates a new card with user-defined text. When you create a new text card or edit an existing -one, select/highlight characters or words to open a modal to make them **bold**, _italic_, or <ins>underlined</ins>. You -can also create a link. +You can use text cards as notes to explain to other members of the [War Room](https://github.com/netdata/netdata/blob/master/docs/cloud/manage/organize-your-infrastrucutre-invite-your-team.md#netdata-cloud-war-rooms) the purpose of the dashboard's arrangement. ### Move cards -To move any card, click and hold on the top of the card, then drag it to a new location. A red placeholder indicates the +To move any card, click and hold on **Drag & rearrange** at the top right of the card and drag it to a new location. A red placeholder indicates the new location. Once you release your mouse, other charts re-sort to the grid system automatically. ### Resize cards @@ -58,27 +59,16 @@ new location. Once you release your mouse, other charts re-sort to the grid syst To resize any card on a dashboard, click on the bottom-right corner and drag to the card's new size. Other cards re-sort to the grid system automatically. -## Jump to single-node dashboards +## Go to chart -Quickly jump to any node's dashboard by clicking the 3-dot icon in the corner of any card to open a menu. Hit the **Go -to Chart** item. +Quickly jump to the location of the chart in either the Overview tab or if the card refers to a single node, its single node dashboard by clicking the 3-dot icon in the corner of any card to open a menu. Hit the **Go to Chart** item. You'll land directly on that chart of interest, but you can now scroll up and down to correlate your findings with other -charts. Of course, you can continue to zoom, highlight, and pan through time just as you're used to with Agent -dashboards. - -## Pin dashboards - -Click on the **Pin** button in any dashboard to put those charts into a separate panel at the bottom of the screen. You -can now navigate through Netdata Cloud freely, individual Cloud dashboards, the Nodes tab, different War Rooms, or even -different Spaces, and have those valuable metrics follow you. - -Pinning dashboards helps you correlate potentially related charts across your infrastructure, no matter how you -organized your Spaces and War Rooms, and helps you discover root causes faster. +charts. Of course, you can continue to zoom, highlight, and pan through time just as you're used to with Netdata Charts. -## Manage your dashboards +## Managing your dashboard -To see dashboards associated with the current War Room, click **Dashboards** tab in any War Room. You can select +To see dashboards associated with the current War Room, click the **Dashboards** tab in any War Room. You can select dashboards and delete them using the 🗑️ icon. ### Update/save a dashboard @@ -92,7 +82,7 @@ prompted to either overwrite the dashboard or reload to see the most recent chan ### Remove an individual card -Click on the 3-dot icon in the corner of any card to open a menu. Click the **Remove Card** item to remove the card. +Click on the 3-dot icon in the corner of any card to open a menu. Click the **Remove** item to remove the card. ### Delete a dashboard diff --git a/docs/contributing/style-guide.md b/docs/contributing/style-guide.md index 359befeb..b9dd63b8 100644 --- a/docs/contributing/style-guide.md +++ b/docs/contributing/style-guide.md @@ -31,9 +31,6 @@ emoji. The same idea about voice and tone applies to organizations, too. Our voice shouldn't change much between two pieces of content, no matter who wrote each, but the tone might be quite different based on who we think is reading. -For example, a [blog post](https://www.netdata.cloud/blog/) and a [press release](https://www.netdata.cloud/news/) -should have a similar voice, despite most often being written by different people. However, blog posts are relaxed and -witty, while press releases are focused and academic. You won't see any emoji in a press release. ### Voice diff --git a/docs/getting-started/introduction.md b/docs/getting-started/introduction.md index 43626bce..5586bff2 100644 --- a/docs/getting-started/introduction.md +++ b/docs/getting-started/introduction.md @@ -168,10 +168,9 @@ You can also find Netdata on: Contributions are the lifeblood of open-source projects. While we continue to invest in and improve Netdata, we need help to democratize monitoring! -- Read our [Contributing Guide](https://github.com/netdata/.github/blob/main/CONTRIBUTING.md), which contains all the information you need to contribute to Netdata, such as improving our documentation, engaging in the community, and developing new features. We've made it as frictionless as possible, but if you need help, just ping us on our community forums! -- We have a whole category dedicated to contributing and extending Netdata on our [community forums](https://community.netdata.cloud/c/agent-development/9) +- Check our [Security Policy](https://github.com/netdata/netdata/security/policy). - Found a bug? Open a [GitHub issue](https://github.com/netdata/netdata/issues/new?assignees=&labels=bug%2Cneeds+triage&template=BUG_REPORT.yml&title=%5BBug%5D%3A+). -- View our [Security Policy](https://github.com/netdata/netdata/security/policy). +- Read our [Contributing Guide](https://github.com/netdata/.github/blob/main/CONTRIBUTING.md), which contains all the information you need to contribute to Netdata, such as improving our documentation, engaging in the community, and developing new features. We've made it as frictionless as possible, but if you need help, just ping us on our community forums! Package maintainers should read the guide on [building Netdata from source](https://github.com/netdata/netdata/blob/master/packaging/installer/methods/source.md) for instructions on building each Netdata component from source and preparing a package. diff --git a/docs/guides/monitor-hadoop-cluster.md b/docs/guides/monitor-hadoop-cluster.md index 41bf891f..1ddac85e 100644 --- a/docs/guides/monitor-hadoop-cluster.md +++ b/docs/guides/monitor-hadoop-cluster.md @@ -179,7 +179,6 @@ The Netdata community helped us create sane defaults for alerts related to both investigate these to ensure they work well with your Hadoop implementation. - [HDFS alerts](https://raw.githubusercontent.com/netdata/netdata/master/health/health.d/hdfs.conf) -- [Zookeeper alerts](https://raw.githubusercontent.com/netdata/netdata/master/health/health.d/zookeeper.conf) You can also access/edit these files directly with `edit-config`: diff --git a/docs/netdata-cloud-onprem/getting-started-light-poc.md b/docs/netdata-cloud-onprem/getting-started-light-poc.md new file mode 100644 index 00000000..dfe0a0c8 --- /dev/null +++ b/docs/netdata-cloud-onprem/getting-started-light-poc.md @@ -0,0 +1,51 @@ +# Getting started with Netdata Cloud On-Prem Light PoC +Due to the high demand, we designed a very light and easy-to-install version of netdata for clients who do not have Kubernetes cluster installed. Please keep in mind that this is (for now) only designed to be used as a PoC with no built-in resiliency on failures of any kind. + +Requirements: + - Ubuntu 22.04 (clean installation will work best). + - 10 CPU Cores and 24 GiB of memory. + - Access to shell as a sudo. + - TLS certificate for Netdata Cloud On-Prem PoC. A single endpoint is required. The certificate must be trusted by all entities connecting to the On-Prem installation by any means. + - AWS ID and Key - contact Netdata Product Team - info@netdata.cloud + - License Key - contact Netdata Product Team - info@netdata.cloud + +To install the whole environment, log in to the designated host and run: +```shell +curl https://netdata-cloud-netdata-static-content.s3.amazonaws.com/provision.sh -o provision.sh +chmod +x provision.sh +sudo ./provision.sh --install +``` + +What does the script do during installation? +1. Prompts user to provide: + - ID and KEY for accessing the AWS (to pull helm charts and container images) + - License Key + - URL under which Netdata Cloud Onprem PoC is going to function (without protocol like `https://`) + - Path for certificate file (PEM format) + - Path for private key file (PEM format) +2. After getting all of the information installation is starting. The script will install: + - Helm + - Kubectl + - AWS CLI + - K3s cluster (single node) +3. When all the required software is installed script starts to provision the K3s cluster with gathered data. + +After cluster provisioning netdata is ready to be used. + +##### How to log in? +Because this is a PoC with 0 configurations required, only log in by mail can work. What's more every mail that Netdata Cloud On-Prem sends will appear on the mailcatcher, which acts as the SMTP server with a simple GUI to read the mails. Steps: +1. Open Netdata Cloud On-Prem PoC in the web browser on URL you specified +2. Provide email and use the button to confirm +3. Mailcatcher will catch all the emails so go to `<URL from point 1.>/mailcatcher`. Find yours and click the link. +4. You are now logged into the netdata. Add your first nodes! + +##### How to remove Netdata Cloud On-Prem PoC? +To uninstall the whole PoC, use the same script that installed it, with the `--uninstall` switch. + +```shell +cd <script dir> +sudo ./provision.sh --uninstall +``` + +#### WARNING +This script will automatically expose not only netdata but also a mailcatcher under `<URL from point 1.>/mailcatcher`. diff --git a/docs/netdata-cloud-onprem/getting-started.md b/docs/netdata-cloud-onprem/getting-started.md new file mode 100644 index 00000000..9d2eea66 --- /dev/null +++ b/docs/netdata-cloud-onprem/getting-started.md @@ -0,0 +1,200 @@ +# Getting started with Netdata Cloud On-Prem +Helm charts are designed for Kubernetes to run as the local equivalent of the Netdata Cloud public offering. This means that no data is sent outside of your cluster. By default, On-Prem installation is trying to reach outside resources only when pulling the container images. +There are 2 helm charts in total: +- netdata-cloud-onprem - installs onprem itself. +- netdata-cloud-dependency - installs all necessary dependency applications. Not for production use, PoC only. + +## Requirements +#### Install host: +- [AWS CLI](https://docs.aws.amazon.com/cli/latest/userguide/getting-started-install.html) +- [Helm](https://helm.sh/docs/intro/install/) version 3.12+ with OCI Configuration (explained in the installation section) +- [Kubectl](https://kubernetes.io/docs/tasks/tools/) + +#### Kubernetes requirements: +- Kubernetes cluster version 1.23+ +- Kubernetes metrics server (For autoscaling) +- TLS certificate for Netdata Cloud On-Prem. A single endpoint is required but there is an option to split the frontend, api, and mqtt endpoints. The certificate must be trusted by all entities connecting to the On-Prem installation by any means. +- Ingress controller to support HTTPS `*` +- PostgreSQL version 13.7 `*` (Main persistent data app) +- EMQX version 5.11 `*` (MQTT Broker that allows Agents to send messages to the On-Prem Cloud) +- Apache Pulsar version 2.10+ `*` (Central communication hub. Applications exchange messages through Pulsar) +- Traefik version 2.7.x `*` (Internal communication - API Gateway) +- Elasticsearch version 8.8.x `*` (Holds Feed) +- Redis version 6.2 `*` (Cache) +- Some form of generating imagePullSecret `*` (Our ECR repos are secured) +- Default storage class configured and working (Persistent volumes based on SSDs are preferred) +`*` - available in dependencies helm chart for PoC applications. + +#### Hardware requirements: +##### How we tested it: +- Several VMs on the AWS EC2, the size of the instance was c6a.32xlarge (128CPUs / 256GiB memory). +- Host system - Ubuntu 22.04. +- Each VM hosts 200 Agent nodes as docker containers. +- Agents are connected directly to the Netdata Cloud On-Prem (no Parent-Child relationships). This is the worst option for the cloud. +- Cloud hosted on 1 Kubernetes node c6a.8xlarge (32CPUs / 64GiB memory). +- Dependencies were also installed on the same node. +The maximum of nodes connected was ~2000. + +##### Results +There was no point in trying to connect more nodes as we are covering the PoC purposes. +- In a peak connection phase - All nodes startup were triggered in ~15 minutes: + - Up to 60% (20 cores) CPU usage of the Kubernetes node. Top usage came from: + - Ingress controller (we used haproxy ingress controller) + - Postgres + - Pulsar + - EMQX + Combined they were responsible for ~30-35% of CPU usage of the node. +- When all nodes connected and synchronized their state CPU usage floated between 30% and 40% - depending on what we did on the Cloud. Here top offenders were: + - Pulsar + - Postgres + Combined they were responsible for ~15-20% of CPU usage of the node. +- Memory usage - 45GiB in a peak. Most of it (~20GiB) was consumed by: + - Postgres + - Elasticsearch + - Pulsar + +For a comparison - Netdata Cloud On-prem installation with just 100 nodes connected, without dependencies is going to consume ~2CPUs and ~2GiB of memory (REAL usage, not requests on a Kubernetes). + +## Pulling the helm chart +The helm chart for the Netdata Cloud On-Prem installation on Kubernetes is available in the ECR registry. +The ECR registry is private, so you need to log in first. Credentials are sent by our Product Team. If you do not have them, please contact our Product Team - info@netdata.cloud. + +#### Configure AWS CLI +The machine used for helm chart installation will also need [AWS CLI installed](https://docs.aws.amazon.com/cli/latest/userguide/getting-started-install.html). +There are 2 options for configuring `aws cli` to work with the provided credentials. The first one is to set the environment variables: +```bash +export AWS_ACCESS_KEY_ID=<your_secret_id> +export AWS_SECRET_ACCESS_KEY=<your_secret_key> +``` + +The second one is to use an interactive shell: +```bash +aws configure +``` + +#### Configure helm to use secured ECR repository +Using `aws` command we will generate a token for helm to access the secured ECR repository: +```bash +aws ecr get-login-password --region us-east-1 | helm registry login --username AWS --password-stdin 362923047827.dkr.ecr.us-east-1.amazonaws.com/netdata-cloud-onprem +``` + +After this step you should be able to add the repository to your helm or just pull the helm chart: +```bash +helm pull oci://362923047827.dkr.ecr.us-east-1.amazonaws.com/netdata-cloud-dependency --untar #optional +helm pull oci://362923047827.dkr.ecr.us-east-1.amazonaws.com/netdata-cloud-onprem --untar +``` + +Local folders with the newest versions of helm charts should appear on your working dir. + +## Installation + +Netdata provides access to two helm charts: +1. netdata-cloud-dependency - required applications for netdata-cloud-onprem. Not for production use. +2. netdata-cloud-onprem - the application itself + provisioning + +### netdata-cloud-dependency +The entire helm chart is designed around the idea that it allows the installation of the necessary applications: +- Redis +- Elasticsearch +- EMQX +- Apache Pulsar +- PostgreSQL +- Traefik +- Mailcatcher +- k8s-ecr-login-renew +- kubernetes-ingress + +Every configuration option is available through `values.yaml` in the folder that contains your netdata-cloud-dependency helm chart. All configuration options are described in README.md which is a part of the helm chart. It is enough to mention here that each component can be enabled/disabled individually. It is done by true/false switches in `values.yaml`. In this way, it is easier for the user to migrate to production-grade components gradually. + +Unless you prefer a different solution to the problem, `k8s-ecr-login-renew` is responsible for calling out the `AWS API` for token regeneration. This token is then injected into the secret that every node is using for authentication with secured ECR when pulling the images. +The default setting in `values.yaml` of `netdata-cloud-onprem` - `.global.imagePullSecrets` is configured to work out of the box with the dependency helm chart. + +For helm chart installation - save your changes in `values.yaml` and execute: +```shell +cd [your helm chart location] +helm upgrade --wait --install netdata-cloud-dependency -n netdata-cloud --create-namespace -f values.yaml . +``` + +### netdata-cloud-onprem + +Every configuration option is available through `values.yaml` in the folder that contains your netdata-cloud-onprem helm chart. All configuration options are described in README.md which is a part of the helm chart. + +#### Installing Netdata Cloud On-Prem +```shell +cd [your helm chart location] +helm upgrade --wait --install netdata-cloud-onprem -n netdata-cloud --create-namespace -f values.yaml . +``` + +##### Important notes +1. Installation takes care of provisioning the resources with migration services. +1. During the first installation, a secret called the `netdata-cloud-common` is created. It contains several randomly generated entries. Deleting helm chart is not going to delete this secret, nor reinstalling the whole On-Prem, unless manually deleted by kubernetes administrator. The content of this secret is extremely relevant - strings that are contained there are essential parts of encryption. Losing or changing the data that it contains will result in data loss. + +## Short description of services +#### cloud-accounts-service +Responsible for user registration & authentication. Manages user account information. +#### cloud-agent-data-ctrl-service +Forwards request from the cloud to the relevant agents. +The requests include: +* Fetching chart metadata from the agent +* Fetching chart data from the agent +* Fetching function data from the agent +#### cloud-agent-mqtt-input-service +Forwards MQTT messages emitted by the agent related to the agent entities to the internal Pulsar broker. These include agent connection state updates. +#### cloud-agent-mqtt-output-service +Forwards Pulsar messages emitted in the cloud related to the agent entities to the MQTT broker. From there, the messages reach the relevant agent. +#### cloud-alarm-config-mqtt-input-service +Forwards MQTT messages emitted by the agent related to the alarm-config entities to the internal Pulsar broker. These include the data for the alarm configuration as seen by the agent. +#### cloud-alarm-log-mqtt-input-service +Forwards MQTT messages emitted by the agent related to the alarm-log entities to the internal Pulsar broker. These contain data about the alarm transitions that occurred in an agent. +#### cloud-alarm-mqtt-output-service +Forwards Pulsar messages emitted in the cloud related to the alarm entities to the MQTT broker. From there, the messages reach the relevant agent. +#### cloud-alarm-processor-service +Persists latest alert statuses received from the agent in the cloud. +Aggregates alert statuses from relevant node instances. +Exposes API endpoints to fetch alert data for visualization on the cloud. +Determines if notifications need to be sent when alert statuses change and emits relevant messages to Pulsar. +Exposes API endpoints to store and return notification-silencing data. +#### cloud-alarm-streaming-service +Responsible for starting the alert stream between the agent and the cloud. +Ensures that messages are processed in the correct order, and starts a reconciliation process between the cloud and the agent if out-of-order processing occurs. +#### cloud-charts-mqtt-input-service +Forwards MQTT messages emitted by the agent related to the chart entities to the internal Pulsar broker. These include the chart metadata that is used to display relevant charts on the cloud. +#### cloud-charts-mqtt-output-service +Forwards Pulsar messages emitted in the cloud related to the charts entities to the MQTT broker. From there, the messages reach the relevant agent. +#### cloud-charts-service +Exposes API endpoints to fetch the chart metadata. +Forwards data requests via the `cloud-agent-data-ctrl-service` to the relevant agents to fetch chart data points. +Exposes API endpoints to call various other endpoints on the agent, for instance, functions. +#### cloud-custom-dashboard-service +Exposes API endpoints to fetch and store custom dashboard data. +#### cloud-environment-service +Serves as the first contact point between the agent and the cloud. +Returns authentication and MQTT endpoints to connecting agents. +#### cloud-feed-service +Processes incoming feed events and stores them in Elasticsearch. +Exposes API endpoints to fetch feed events from Elasticsearch. +#### cloud-frontend +Contains the on-prem cloud website. Serves static content. +#### cloud-iam-user-service +Acts as a middleware for authentication on most of the API endpoints. Validates incoming token headers, injects the relevant ones, and forwards the requests. +#### cloud-metrics-exporter +Exports various metrics from an On-Prem Cloud installation. Uses the Prometheus metric exposition format. +#### cloud-netdata-assistant +Exposes API endpoints to fetch a human-friendly explanation of various netdata configuration options, namely the alerts. +#### cloud-node-mqtt-input-service +Forwards MQTT messages emitted by the agent related to the node entities to the internal Pulsar broker. These include the node metadata as well as their connectivity state, either direct or via parents. +#### cloud-node-mqtt-output-service +Forwards Pulsar messages emitted in the cloud related to the charts entities to the MQTT broker. From there, the messages reach the relevant agent. +#### cloud-notifications-dispatcher-service +Exposes API endpoints to handle integrations. +Handles incoming notification messages and uses the relevant channels(email, slack...) to notify relevant users. +#### cloud-spaceroom-service +Exposes API endpoints to fetch and store relations between agents, nodes, spaces, users, and rooms. +Acts as a provider of authorization for other cloud endpoints. +Exposes API endpoints to authenticate agents connecting to the cloud. + +## Infrastructure Diagram + + + +### If you have any questions or suggestions please contact the Netdata team. diff --git a/docs/netdata-cloud-onprem/infrastructure.jpeg b/docs/netdata-cloud-onprem/infrastructure.jpeg Binary files differnew file mode 100644 index 00000000..a866e141 --- /dev/null +++ b/docs/netdata-cloud-onprem/infrastructure.jpeg diff --git a/docs/netdata-cloud-onprem/troubleshooting-onprem.md b/docs/netdata-cloud-onprem/troubleshooting-onprem.md new file mode 100644 index 00000000..4f449c96 --- /dev/null +++ b/docs/netdata-cloud-onprem/troubleshooting-onprem.md @@ -0,0 +1,21 @@ +# Basic troubleshooting +We cannot predict how your particular installation of Netdata Cloud On-prem is going to work. It is a mixture of underlying infrastructure, the number of agents, and their topology. +You can always contact the Netdata team for recommendations! + +#### Loading charts takes a long time or ends with an error +Charts service is trying to collect the data from all of the agents in question. If we are talking about the overview screen, all of the nodes in space are going to be queried (`All nodes` room). If it takes a long time, there are a few things that should be checked: +1. How many nodes are you querying directly? + There is a big difference between having 100 nodes connected directly to the cloud compared to them being connected through a few parents. Netdata always prioritizes querying nodes through parents. This way, we can reduce some of the load by pushing the responsibility to query the data to the parent. The parent is then responsible for passing accumulated data from nodes connected to it to the cloud. +1. If you are missing data from endpoints all the time. + Netdata Cloud always queries nodes themselves for the metrics. The cloud only holds information about metadata, such as information about what charts can be pulled from any node, but not the data points themselves for any metric. This means that if a node is throttled by the network connection or under high resource pressure, the information exchange between the agent and cloud through the MQTT broker might take a long time. In addition to checking resource usage and networking, we advise using a parent node for such endpoints. Parents can hold the data from nodes that are connected to the cloud through them, eliminating the need to query those endpoints. +1. Errors on the cloud when trying to load charts. + If the entire data query is crashing and no data is displayed on the UI, it could indicate problems with the `cloud-charts-service`. The query you are performing might simply exceed the CPU and/or memory limits set on the deployment. We advise increasing those resources. +It takes a long time to load anything on the Cloud UI +When experiencing sluggishness and slow responsiveness, the following factors should be checked regarding the Postgres database: + 1. CPU: Monitor the CPU usage to ensure it is not reaching its maximum capacity. High and sustained CPU usage can lead to sluggish performance. + 1. Memory: Check if the database server has sufficient memory allocated. Inadequate memory could cause excessive disk I/O and slow down the database. + 1. Disk Queue / IOPS: Analyze the disk queue length and disk I/O operations per second (IOPS). A high disk queue length or limited IOPS can indicate a bottleneck and negatively impact database performance. +By examining these factors and ensuring that CPU, memory, and disk IOPS are within acceptable ranges, you can mitigate potential performance issues with the Postgres database. + +#### Nodes are not updated quickly on the Cloud UI +If you're experiencing delays with information exchange between the Cloud UI and the Agent, and you've already checked the networking and resource usage on the agent side, the problem may be related to Apache Pulsar or the database. Slow alerts on node alerts or slow updates on node status (online/offline) could indicate issues with message processing or database performance. You may want to investigate the performance of Apache Pulsar, ensure it is properly configured, and consider scaling or optimizing the database to handle the volume of data being processed or written to it. diff --git a/docs/quickstart/infrastructure.md b/docs/quickstart/infrastructure.md index 3e24d7ac..d2e7f2d8 100644 --- a/docs/quickstart/infrastructure.md +++ b/docs/quickstart/infrastructure.md @@ -220,7 +220,7 @@ collect from across your infrastructure with Netdata. - [Events Feed](https://github.com/netdata/netdata/blob/master/docs/cloud/insights/events-feed.md) - Management and settings - [Sign in with email, Google, or GitHub](https://github.com/netdata/netdata/blob/master/docs/cloud/manage/sign-in.md) - - [Invite your team](hhttps://github.com/netdata/netdata/blob/master/docs/cloud/manage/organize-your-infrastrucutre-invite-your-team.md#invite-your-team) + - [Invite your team](https://github.com/netdata/netdata/blob/master/docs/cloud/manage/organize-your-infrastrucutre-invite-your-team.md#invite-your-team) - [Choose your Netdata Cloud theme](https://github.com/netdata/netdata/blob/master/docs/cloud/manage/themes.md) - [Role-Based Access](https://github.com/netdata/netdata/blob/master/docs/cloud/manage/role-based-access.md) - [Paid Plans](https://github.com/netdata/netdata/blob/master/docs/cloud/manage/plans.md) diff --git a/docs/store/change-metrics-storage.md b/docs/store/change-metrics-storage.md index ef1f8ee8..456ea6c2 100644 --- a/docs/store/change-metrics-storage.md +++ b/docs/store/change-metrics-storage.md @@ -38,7 +38,7 @@ on the maximum retention and the memory used by Netdata is described in detail, ``` The default "update every iterations" of 60 means that if a metric is collected per second in Tier 0, then -we will have a data point every minute in tier 1 and every minute in tier 2. +we will have a data point every minute in tier 1 and every hour in tier 2. Up to 5 tiers are supported. You may add, or remove tiers and/or modify these multipliers, as long as the product of all the "update every iterations" does not exceed 65535 (number of points for each tier0 point). |