
diff options
| author | Daniel Baumann <daniel.baumann@progress-linux.org> | 2024-03-21 17:19:04 +0000 |
|---|---|---|
| committer | Daniel Baumann <daniel.baumann@progress-linux.org> | 2024-03-21 17:19:04 +0000 |
| commit | 310edf444908b09ea6d00c03baceb7925f3bb7a2 (patch) | |
| tree | 7064577c7fa7a851e2e930beb606ea8237b0bbd2 /health | |
| parent | Releasing debian version 1.44.3-2. (diff) | |
| download | netdata-310edf444908b09ea6d00c03baceb7925f3bb7a2.tar.xz netdata-310edf444908b09ea6d00c03baceb7925f3bb7a2.zip | |
Merging upstream version 1.45.0.
Signed-off-by: Daniel Baumann <daniel.baumann@progress-linux.org>
Diffstat (limited to 'health')
467 files changed, 0 insertions, 32936 deletions
diff --git a/health/Makefile.am b/health/Makefile.am deleted file mode 100644 index 7d7bca4c..00000000 --- a/health/Makefile.am +++ /dev/null @@ -1,106 +0,0 @@ -# SPDX-License-Identifier: GPL-3.0-or-later - -AUTOMAKE_OPTIONS = subdir-objects -MAINTAINERCLEANFILES = $(srcdir)/Makefile.in - -SUBDIRS = \ - notifications \ - $(NULL) - -CLEANFILES = \ - $(NULL) - -dist_noinst_DATA = \ - README.md \ - $(NULL) - -userhealthconfigdir=$(configdir)/health.d -dist_userhealthconfig_DATA = \ - $(NULL) - -# Explicitly install directories to avoid permission issues due to umask -install-exec-local: - $(INSTALL) -d $(DESTDIR)$(userhealthconfigdir) - -healthconfigdir=$(libconfigdir)/health.d -dist_healthconfig_DATA = \ - health.d/adaptec_raid.conf \ - health.d/anomalies.conf \ - health.d/apcupsd.conf \ - health.d/bcache.conf \ - health.d/beanstalkd.conf \ - health.d/bind_rndc.conf \ - health.d/boinc.conf \ - health.d/btrfs.conf \ - health.d/ceph.conf \ - health.d/cgroups.conf \ - health.d/cpu.conf \ - health.d/cockroachdb.conf \ - health.d/consul.conf \ - health.d/disks.conf \ - health.d/dnsmasq_dhcp.conf \ - health.d/dns_query.conf \ - health.d/docker.conf \ - health.d/elasticsearch.conf \ - health.d/entropy.conf \ - health.d/exporting.conf \ - health.d/file_descriptors.conf \ - health.d/geth.conf \ - health.d/ioping.conf \ - health.d/gearman.conf \ - health.d/go.d.plugin.conf \ - health.d/haproxy.conf \ - health.d/hdfs.conf \ - health.d/httpcheck.conf \ - health.d/ipc.conf \ - health.d/ipfs.conf \ - health.d/ipmi.conf \ - health.d/isc_dhcpd.conf \ - health.d/kubelet.conf \ - health.d/linux_power_supply.conf \ - health.d/load.conf \ - health.d/mdstat.conf \ - health.d/megacli.conf \ - health.d/memcached.conf \ - health.d/memory.conf \ - health.d/ml.conf \ - health.d/mysql.conf \ - health.d/net.conf \ - health.d/netfilter.conf \ - health.d/nvme.conf \ - health.d/pihole.conf \ - health.d/plugin.conf \ - health.d/ping.conf \ - health.d/postgres.conf \ - health.d/portcheck.conf \ - health.d/processes.conf \ - health.d/python.d.plugin.conf \ - health.d/qos.conf \ - health.d/ram.conf \ - health.d/redis.conf \ - health.d/retroshare.conf \ - health.d/riakkv.conf \ - health.d/scaleio.conf \ - health.d/softnet.conf \ - health.d/synchronization.conf \ - health.d/swap.conf \ - health.d/systemdunits.conf \ - health.d/timex.conf \ - health.d/tcp_conn.conf \ - health.d/tcp_listen.conf \ - health.d/tcp_mem.conf \ - health.d/tcp_orphans.conf \ - health.d/tcp_resets.conf \ - health.d/udp_errors.conf \ - health.d/unbound.conf \ - health.d/upsd.conf \ - health.d/vcsa.conf \ - health.d/vernemq.conf \ - health.d/vsphere.conf \ - health.d/web_log.conf \ - health.d/whoisquery.conf \ - health.d/windows.conf \ - health.d/x509check.conf \ - health.d/zfs.conf \ - health.d/dbengine.conf \ - $(NULL) diff --git a/health/README.md b/health/README.md deleted file mode 100644 index eec8ad06..00000000 --- a/health/README.md +++ /dev/null @@ -1,14 +0,0 @@ -# Alerts and notifications - -The Netdata Agent is a health watchdog for the health and performance of your systems, services, and applications. We've -worked closely with our community of DevOps engineers, SREs, and developers to define hundreds of production-ready -alerts that work without any configuration. - -The Agent's health monitoring system is also dynamic and fully customizable. You can write entirely new alerts, tune the -community-configured alerts for every app/service [the Agent collects metrics from](https://github.com/netdata/netdata/blob/master/collectors/COLLECTORS.md), or -silence anything you're not interested in. You can even power complex lookups by running statistical algorithms against -your metrics. - -You can [use various alert notification methods](https://github.com/netdata/netdata/edit/master/docs/monitor/enable-notifications.md), -[customize alerts](https://github.com/netdata/netdata/blob/master/health/REFERENCE.md), and -[disable/silence](https://github.com/netdata/netdata/blob/master/health/REFERENCE.md#disable-or-silence-alerts) alerts. diff --git a/health/REFERENCE.md b/health/REFERENCE.md deleted file mode 100644 index 7ea89529..00000000 --- a/health/REFERENCE.md +++ /dev/null @@ -1,1387 +0,0 @@ -# Configure alerts - -Netdata's health watchdog is highly configurable, with support for dynamic thresholds, hysteresis, alert templates, and -more. You can tweak any of the existing alerts based on your infrastructure's topology or specific monitoring needs, or -create new entities. - -You can use health alerts in conjunction with any of Netdata's [collectors](https://github.com/netdata/netdata/blob/master/collectors/README.md) (see -the [supported collector list](https://github.com/netdata/netdata/blob/master/collectors/COLLECTORS.md)) to monitor the health of your systems, containers, and -applications in real time. - -While you can see active alerts both on the local dashboard and Netdata Cloud, all health alerts are configured _per -node_ via individual Netdata Agents. If you want to deploy a new alert across your -[infrastructure](https://github.com/netdata/netdata/blob/master/docs/quickstart/infrastructure.md), you must configure each node with the same health configuration -files. - -## Edit health configuration files - -You can configure the Agent's health watchdog service by editing files in two locations: - -- The `[health]` section in `netdata.conf`. By editing the daemon's behavior, you can disable health monitoring - altogether, run health checks more or less often, and more. See - [daemon configuration](https://github.com/netdata/netdata/blob/master/daemon/config/README.md#health-section-options) for a table of - all the available settings, their default values, and what they control. - -- The individual `.conf` files in `health.d/`. These health entity files are organized by the type of metric they are - performing calculations on or their associated collector. You should edit these files using the `edit-config` - script. For example: `sudo ./edit-config health.d/cpu.conf`. - -Navigate to your [Netdata config directory](https://github.com/netdata/netdata/blob/master/docs/configure/nodes.md) and -use `edit-config` to make changes to any of these files. - -### Edit individual alerts - -For example, to edit the `cpu.conf` health configuration file, run: - -```bash -sudo ./edit-config health.d/cpu.conf -``` - -Each health configuration file contains one or more health _entities_, which always begin with `alarm:` or `template:`. -For example, here is the first health entity in `health.d/cpu.conf`: - -```yaml - template: 10min_cpu_usage - on: system.cpu - class: Utilization - type: System -component: CPU - os: linux - hosts: * - lookup: average -10m unaligned of user,system,softirq,irq,guest - units: % - every: 1m - warn: $this > (($status >= $WARNING) ? (75) : (85)) - crit: $this > (($status == $CRITICAL) ? (85) : (95)) - delay: down 15m multiplier 1.5 max 1h - summary: CPU utilization - info: Average cpu utilization for the last 10 minutes (excluding iowait, nice and steal) - to: sysadmin -``` - -To tune this alert to trigger warning and critical alerts at a lower CPU utilization, change the `warn` and `crit` lines -to the values of your choosing. For example: - -```yaml - warn: $this > (($status >= $WARNING) ? (60) : (75)) - crit: $this > (($status == $CRITICAL) ? (75) : (85)) -``` - -Save the file and [reload Netdata's health configuration](#reload-health-configuration) to apply your changes. - -## Disable or silence alerts - -Alerts and notifications can be disabled permanently via configuration changes, or temporarily, via the -[health management API](https://github.com/netdata/netdata/blob/master/web/api/health/README.md). The -available options are described below. - -### Disable all alerts - -In the `netdata.conf` `[health]` section, set `enabled` to `no`, and restart the agent. - -### Disable some alerts - -In the `netdata.conf` `[health]` section, set `enabled alarms` to a -[simple pattern](https://github.com/netdata/netdata/edit/master/libnetdata/simple_pattern/README.md) that -excludes one or more alerts. e.g. `enabled alarms = !oom_kill *` will load all alerts except `oom_kill`. - -You can also [edit the file where the alert is defined](#edit-individual-alerts), comment out its definition, -and [reload Netdata's health configuration](#reload-health-configuration). - -### Silence an individual alert - -You can stop receiving notification for an individual alert by [changing](#edit-individual-alerts) the `to:` line to `silent`. - -```yaml - to: silent -``` - -This action requires that you [reload Netdata's health configuration](#reload-health-configuration). - -### Temporarily disable alerts at runtime - -When you need to frequently disable all or some alerts from triggering during certain times (for instance -when running backups) you can use the -[health management API](https://github.com/netdata/netdata/blob/master/web/api/health/README.md). -The API allows you to issue commands to control the health engine's behavior without changing configuration, -or restarting the agent. - -### Temporarily silence notifications at runtime - -If you want health checks to keep running and alerts to keep getting triggered, but notifications to be -suppressed temporarily, you can use the -[health management API](https://github.com/netdata/netdata/blob/master/web/api/health/README.md). -The API allows you to issue commands to control the health engine's behavior without changing configuration, -or restarting the agent. - -## Write a new health entity - -While tuning existing alerts may work in some cases, you may need to write entirely new health entities based on how -your systems, containers, and applications work. - -Read the [health entity reference](#health-entity-reference) for a full listing of the format, -syntax, and functionality of health entities. - -To write a new health entity into a new file, navigate to your [Netdata config directory](https://github.com/netdata/netdata/blob/master/docs/configure/nodes.md), -then use `touch` to create a new file in the `health.d/` directory. Use `edit-config` to start editing the file. - -As an example, let's create a `ram-usage.conf` file. - -```bash -sudo touch health.d/ram-usage.conf -sudo ./edit-config health.d/ram-usage.conf -``` - -For example, here is a health entity that triggers a warning alert when a node's RAM usage rises above 80%, and a -critical alert above 90%: - -```yaml - alarm: ram_usage - on: system.ram -lookup: average -1m percentage of used - units: % - every: 1m - warn: $this > 80 - crit: $this > 90 - info: The percentage of RAM being used by the system. -``` - -Let's look into each of the lines to see how they create a working health entity. - -- `alarm`: The name for your new entity. The name needs to follow these requirements: - - Any alphabet letter or number. - - The symbols `.` and `_`. - - Cannot be `chart name`, `dimension name`, `family name`, or `chart variable names`. - -- `on`: Which chart the entity listens to. - -- `lookup`: Which metrics the alert monitors, the duration of time to monitor, and how to process the metrics into a - usable format. - - `average`: Calculate the average of all the metrics collected. - - `-1m`: Use metrics from 1 minute ago until now to calculate that average. - - `percentage`: Clarify that we're calculating a percentage of RAM usage. - - `of used`: Specify which dimension (`used`) on the `system.ram` chart you want to monitor with this entity. - -- `units`: Use percentages rather than absolute units. - -- `every`: How often to perform the `lookup` calculation to decide whether to trigger this alert. - -- `warn`/`crit`: The value at which Netdata should trigger a warning or critical alert. This example uses simple - syntax, but most pre-configured health entities use - [hysteresis](#special-use-of-the-conditional-operator) to avoid superfluous notifications. - -- `info`: A description of the alert, which will appear in the dashboard and notifications. - -In human-readable format: - -> This health entity, named **ram_usage**, watches the **system.ram** chart. It looks up the last **1 minute** of -> metrics from the **used** dimension and calculates the **average** of all those metrics in a **percentage** format, -> using a **% unit**. The entity performs this lookup **every minute**. -> -> If the average RAM usage percentage over the last 1 minute is **more than 80%**, the entity triggers a warning alert. -> If the usage is **more than 90%**, the entity triggers a critical alert. - -When you finish writing this new health entity, [reload Netdata's health configuration](#reload-health-configuration) to -see it live on the local dashboard or Netdata Cloud. - -## Reload health configuration - -To make any changes to your health configuration live, you must reload Netdata's health monitoring system. To do that -without restarting all of Netdata, run `netdatacli reload-health` or `killall -USR2 netdata`. - -## Health entity reference - -The following reference contains information about the syntax and options of _health entities_, which Netdata attaches -to charts in order to trigger alerts. - -### Entity types - -There are two entity types: **alarms** and **templates**. They have the same format and feature set—the only difference -is their label. - -**Alerts** are attached to specific charts and use the `alarm` label. - -**Templates** define rules that apply to all charts of a specific context, and use the `template` label. Templates help -you apply one entity to all disks, all network interfaces, all MySQL databases, and so on. - -Alerts have higher precedence and will override templates. -If the `alert` and `template` entities have the same name and are attached to the same chart, Netdata will use `alarm`. - -### Entity format - -Netdata parses the following lines. Beneath the table is an in-depth explanation of each line's purpose and syntax. - -- The `alarm` or `template` line must be the first line of any entity. -- The `on` line is **always required**. -- The `every` line is **required** if not using `lookup`. -- Each entity **must** have at least one of the following lines: `lookup`, `calc`, `warn`, or `crit`. -- A few lines use space-separated lists to define how the entity behaves. You can use `*` as a wildcard or prefix with - `!` for a negative match. Order is important, too! See our [simple patterns docs](https://github.com/netdata/netdata/blob/master/libnetdata/simple_pattern/README.md) for - more examples. -- Lines terminated by a `\` are spliced together with the next line. The backslash is removed and the following line is - joined with the current one. No space is inserted, so you may split a line anywhere, even in the middle of a word. - This comes in handy if your `info` line consists of several sentences. - -| line | required | functionality | -|-----------------------------------------------------|-----------------|---------------------------------------------------------------------------------------| -| [`alarm`/`template`](#alert-line-alarm-or-template) | yes | Name of the alert/template. | -| [`on`](#alert-line-on) | yes | The chart this alert should attach to. | -| [`class`](#alert-line-class) | no | The general alert classification. | -| [`type`](#alert-line-type) | no | What area of the system the alert monitors. | -| [`component`](#alert-line-component) | no | Specific component of the type of the alert. | -| [`os`](#alert-line-os) | no | Which operating systems to run this chart. | -| [`hosts`](#alert-line-hosts) | no | Which hostnames will run this alert. | -| [`plugin`](#alert-line-plugin) | no | Restrict an alert or template to only a certain plugin. | -| [`module`](#alert-line-module) | no | Restrict an alert or template to only a certain module. | -| [`charts`](#alert-line-charts) | no | Restrict an alert or template to only certain charts. | -| [`lookup`](#alert-line-lookup) | yes | The database lookup to find and process metrics for the chart specified through `on`. | -| [`calc`](#alert-line-calc) | yes (see above) | A calculation to apply to the value found via `lookup` or another variable. | -| [`every`](#alert-line-every) | no | The frequency of the alert. | -| [`green`/`red`](#alert-lines-green-and-red) | no | Set the green and red thresholds of a chart. | -| [`warn`/`crit`](#alert-lines-warn-and-crit) | yes (see above) | Expressions evaluating to true or false, and when true, will trigger the alert. | -| [`to`](#alert-line-to) | no | A list of roles to send notifications to. | -| [`exec`](#alert-line-exec) | no | The script to execute when the alert changes status. | -| [`delay`](#alert-line-delay) | no | Optional hysteresis settings to prevent floods of notifications. | -| [`repeat`](#alert-line-repeat) | no | The interval for sending notifications when an alert is in WARNING or CRITICAL mode. | -| [`options`](#alert-line-options) | no | Add an option to not clear alerts. | -| [`host labels`](#alert-line-host-labels) | no | Restrict an alert or template to a list of matching labels present on a host. | -| [`chart labels`](#alert-line-chart-labels) | no | Restrict an alert or template to a list of matching labels present on a host. | -| [`summary`](#alert-line-summary) | no | A brief description of the alert. | -| [`info`](#alert-line-info) | no | A longer text field that provides more information of this alert | - -The `alarm` or `template` line must be the first line of any entity. - -#### Alert line `alarm` or `template` - -This line starts an alert or template based on the [entity type](#entity-types) you're interested in creating. - -**Alert:** - -```yaml -alarm: NAME -``` - -**Template:** - -```yaml -template: NAME -``` - -`NAME` can be any alpha character, with `.` (period) and `_` (underscore) as the only allowed symbols, but the names -cannot be `chart name`, `dimension name`, `family name`, or `chart variables names`. - -#### Alert line `on` - -This line defines the chart this alert should attach to. - -**Alerts:** - -```yaml -on: CHART -``` - -The value `CHART` should be the unique ID or name of the chart you're interested in, as shown on the dashboard. In the -image below, the unique ID is `system.cpu`. - - - -**Template:** - -```yaml -on: CONTEXT -``` - -The value `CONTEXT` should be the context you want this template to attach to. - -Need to find the context? Hover over the date on any given chart and look at the tooltip. In the image below, which -shows a disk I/O chart, the tooltip reads: `proc:/proc/diskstats, disk.io`. - -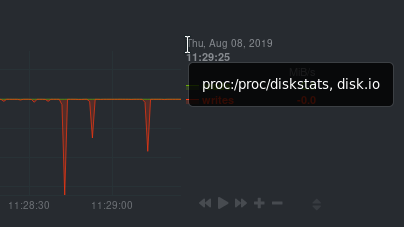 - -You're interested in what comes after the comma: `disk.io`. That's the name of the chart's context. - -If you create a template using the `disk.io` context, it will apply an alert to every disk available on your system. - -#### Alert line `class` - -This indicates the type of error (or general problem area) that the alert or template applies to. For example, `Latency` can be used for alerts that trigger on latency issues on network interfaces, web servers, or database systems. Example: - -```yaml -class: Latency -``` - -<details> -<summary>Netdata's stock alerts use the following `class` attributes by default:</summary> - -| Class | -|-------------| -| Errors | -| Latency | -| Utilization | -| Workload | - -</details> - -`class` will default to `Unknown` if the line is missing from the alert configuration. - -#### Alert line `type` - -Type can be used to indicate the broader area of the system that the alert applies to. For example, under the general `Database` type, you can group together alerts that operate on various database systems, like `MySQL`, `CockroachDB`, `CouchDB` etc. Example: - -```yaml -type: Database -``` - -<details> -<summary>Netdata's stock alerts use the following `type` attributes by default, but feel free to adjust for your own requirements.</summary> - -| Type | Description | -|-----------------|------------------------------------------------------------------------------------------------| -| Ad Filtering | Services related to Ad Filtering (like pi-hole) | -| Certificates | Certificates monitoring related | -| Cgroups | Alerts for cpu and memory usage of control groups | -| Computing | Alerts for shared computing applications (e.g. boinc) | -| Containers | Container related alerts (e.g. docker instances) | -| Database | Database systems (e.g. MySQL, PostgreSQL, etc) | -| Data Sharing | Used to group together alerts for data sharing applications | -| DHCP | Alerts for dhcp related services | -| DNS | Alerts for dns related services | -| Kubernetes | Alerts for kubernetes nodes monitoring | -| KV Storage | Key-Value pairs services alerts (e.g. memcached) | -| Linux | Services specific to Linux (e.g. systemd) | -| Messaging | Alerts for message passing services (e.g. vernemq) | -| Netdata | Internal Netdata components monitoring | -| Other | When an alert doesn't fit in other types. | -| Power Supply | Alerts from power supply related services (e.g. apcupsd) | -| Search engine | Alerts for search services (e.g. elasticsearch) | -| Storage | Class for alerts dealing with storage services (storage devices typically live under `System`) | -| System | General system alerts (e.g. cpu, network, etc.) | -| Virtual Machine | Virtual Machine software | -| Web Proxy | Web proxy software (e.g. squid) | -| Web Server | Web server software (e.g. Apache, ngnix, etc.) | -| Windows | Alerts for monitor of windows services | - -</details> - -If an alert configuration is missing the `type` line, its value will default to `Unknown`. - -#### Alert line `component` - -Component can be used to narrow down what the previous `type` value specifies for each alert or template. Continuing from the previous example, `component` might include `MySQL`, `CockroachDB`, `MongoDB`, all under the same `Database` type. Example: - -```yaml -component: MySQL -``` - -As with the `class` and `type` line, if `component` is missing from the configuration, its value will default to `Unknown`. - -#### Alert line `os` - -The alert or template will be used only if the operating system of the host matches this list specified in `os`. The -value is a space-separated list. - -The following example enables the entity on Linux, FreeBSD, and macOS, but no other operating systems. - -```yaml -os: linux freebsd macos -``` - -#### Alert line `hosts` - -The alert or template will be used only if the hostname of the host matches this space-separated list. - -The following example will load on systems with the hostnames `server` and `server2`, and any system with hostnames that -begin with `database`. It _will not load_ on the host `redis3`, but will load on any _other_ systems with hostnames that -begin with `redis`. - -```yaml -hosts: server1 server2 database* !redis3 redis* -``` - -#### Alert line `plugin` - -The `plugin` line filters which plugin within the context this alert should apply to. The value is a space-separated -list of [simple patterns](https://github.com/netdata/netdata/blob/master/libnetdata/simple_pattern/README.md). For example, -you can create a filter for an alert that applies specifically to `python.d.plugin`: - -```yaml -plugin: python.d.plugin -``` - -The `plugin` line is best used with other options like `module`. When used alone, the `plugin` line creates a very -inclusive filter that is unlikely to be of much use in production. See [`module`](#alert-line-module) for a -comprehensive example using both. - -#### Alert line `module` - -The `module` line filters which module within the context this alert should apply to. The value is a space-separated -list of [simple patterns](https://github.com/netdata/netdata/blob/master/libnetdata/simple_pattern/README.md). For -example, you can create an alert that applies only on the `isc_dhcpd` module started by `python.d.plugin`: - -```yaml -plugin: python.d.plugin -module: isc_dhcpd -``` - -#### Alert line `charts` - -The `charts` line filters which chart this alert should apply to. It is only available on entities using the -[`template`](#alert-line-alarm-or-template) line. -The value is a space-separated list of [simple patterns](https://github.com/netdata/netdata/blob/master/libnetdata/simple_pattern/README.md). For -example, a template that applies to `disk.svctm` (Average Service Time) context, but excludes the disk `sdb` from alerts: - -```yaml -template: disk_svctm_alert - on: disk.svctm - charts: !*sdb* * -``` - -#### Alert line `lookup` - -This line makes a database lookup to find a value. This result of this lookup is available as `$this`. - -The format is: - -```yaml -lookup: METHOD AFTER [at BEFORE] [every DURATION] [OPTIONS] [of DIMENSIONS] [foreach DIMENSIONS] -``` - -The full [database query API](https://github.com/netdata/netdata/blob/master/web/api/queries/README.md) is supported. In short: - -- `METHOD` is one of the available [grouping methods](https://github.com/netdata/netdata/blob/master/web/api/queries/README.md#grouping-methods) such as `average`, `min`, `max` etc. - This is required. - -- `AFTER` is a relative number of seconds, but it also accepts a single letter for changing - the units, like `-1s` = 1 second in the past, `-1m` = 1 minute in the past, `-1h` = 1 hour - in the past, `-1d` = 1 day in the past. You need a negative number (i.e. how far in the past - to look for the value). **This is required**. - -- `at BEFORE` is by default 0 and is not required. Using this you can define the end of the - lookup. So data will be evaluated between `AFTER` and `BEFORE`. - -- `every DURATION` sets the updated frequency of the lookup (supports single letter units as - above too). - -- `OPTIONS` is a space separated list of `percentage`, `absolute`, `min2max`, `unaligned`, - `match-ids`, `match-names`. Check the [badges](https://github.com/netdata/netdata/blob/master/web/api/badges/README.md) documentation for more info. - -- `of DIMENSIONS` is optional and has to be the last parameter. Dimensions have to be separated - by `,` or `|`. The space characters found in dimensions will be kept as-is (a few dimensions - have spaces in their names). This accepts Netdata simple patterns _(with `words` separated by - `,` or `|` instead of spaces)_ and the `match-ids` and `match-names` options affect the searches - for dimensions. - -- `foreach DIMENSIONS` is optional and works only with [templates](#alert-line-alarm-or-template), will always be the last parameter, and uses the same `,`/`|` - rules as the `of` parameter. Each dimension you specify in `foreach` will use the same rule - to trigger an alert. If you set both `of` and `foreach`, Netdata will ignore the `of` parameter - and replace it with one of the dimensions you gave to `foreach`. This option allows you to - [use dimension templates to create dynamic alerts](#use-dimension-templates-to-create-dynamic-alerts). - -The result of the lookup will be available as `$this` and `$NAME` in expressions. -The timestamps of the timeframe evaluated by the database lookup is available as variables -`$after` and `$before` (both are unix timestamps). - -#### Alert line `calc` - -A `calc` is designed to apply some calculation to the values or variables available to the entity. The result of the -calculation will be made available at the `$this` variable, overwriting the value from your `lookup`, to use in warning -and critical expressions. - -When paired with `lookup`, `calc` will perform the calculation just after `lookup` has retrieved a value from Netdata's -database. - -You can use `calc` without `lookup` if you are using [other available variables](#variables). - -The `calc` line uses [expressions](#expressions) for its syntax. - -```yaml -calc: EXPRESSION -``` - -#### Alert line `every` - -Sets the update frequency of this alert. This is the same to the `every DURATION` given -in the `lookup` lines. - -Format: - -```yaml -every: DURATION -``` - -`DURATION` accepts `s` for seconds, `m` is minutes, `h` for hours, `d` for days. - -#### Alert lines `green` and `red` - -Set the green and red thresholds of a chart. Both are available as `$green` and `$red` in expressions. If multiple -alerts define different thresholds, the ones defined by the first alert will be used. Eventually it will be visualized -on the dashboard, so only one set of them is allowed If you need multiple sets of them in different alerts, use -absolute numbers instead of `$red` and `$green`. - -Format: - -```yaml -green: NUMBER -red: NUMBER -``` - -#### Alert lines `warn` and `crit` - -Define the expression that triggers either a warning or critical alert. These are optional, and should evaluate to -either true or false (or zero/non-zero). - -The format uses Netdata's [expressions syntax](#expressions). - -```yaml -warn: EXPRESSION -crit: EXPRESSION -``` - -#### Alert line `to` - -This will be the first script parameter that will be executed when the alert changes its status. Its meaning is left up to -the `exec` script. - -The default `exec` script, `alarm-notify.sh`, uses this field as a space separated list of roles, which are then -consulted to find the exact recipients per notification method. - -Format: - -```yaml -to: ROLE1 ROLE2 ROLE3 ... -``` - -#### Alert line `exec` - -Script to be executed when the alert status changes. - -Format: - -```yaml -exec: SCRIPT -``` - -The default `SCRIPT` is Netdata's `alarm-notify.sh`, which supports all the notifications methods Netdata supports, -including custom hooks. - -#### Alert line `delay` - -This is used to provide optional hysteresis settings for the notifications, to defend against notification floods. These -settings do not affect the actual alert - only the time the `exec` script is executed. - -Format: - -```yaml -delay: [[[up U] [down D] multiplier M] max X] -``` - -- `up U` defines the delay to be applied to a notification for an alert that raised its status - (i.e. CLEAR to WARNING, CLEAR to CRITICAL, WARNING to CRITICAL). For example, `up 10s`, the - notification for this event will be sent 10 seconds after the actual event. This is used in - hope the alert will get back to its previous state within the duration given. The default `U` - is zero. - -- `down D` defines the delay to be applied to a notification for an alert that moves to lower - state (i.e. CRITICAL to WARNING, CRITICAL to CLEAR, WARNING to CLEAR). For example, `down 1m` - will delay the notification by 1 minute. This is used to prevent notifications for flapping - alerts. The default `D` is zero. - -- `multiplier M` multiplies `U` and `D` when an alert changes state, while a notification is - delayed. The default multiplier is `1.0`. - -- `max X` defines the maximum absolute notification delay an alert may get. The default `X` - is `max(U * M, D * M)` (i.e. the max duration of `U` or `D` multiplied once with `M`). - - Example: - - `delay: up 10s down 15m multiplier 2 max 1h` - - The time is `00:00:00` and the status of the alert is CLEAR. - - | time of event | new status | delay | notification will be sent | why | - |---------------|------------|---------------------|---------------------------|-------------------------------------------------------------------------------| - | 00:00:01 | WARNING | `up 10s` | 00:00:11 | first state switch | - | 00:00:05 | CLEAR | `down 15m x2` | 00:30:05 | the alert changes state while a notification is delayed, so it was multiplied | - | 00:00:06 | WARNING | `up 10s x2 x2` | 00:00:26 | multiplied twice | - | 00:00:07 | CLEAR | `down 15m x2 x2 x2` | 00:45:07 | multiplied 3 times. | - - So: - - - `U` and `D` are multiplied by `M` every time the alert changes state (any state, not just - their matching one) and a delay is in place. - - All are reset to their defaults when the alert switches state without a delay in place. - -#### Alert line `repeat` - -Defines the interval between repeating notifications for the alerts in CRITICAL or WARNING mode. This will override the -default interval settings inherited from health settings in `netdata.conf`. The default settings for repeating -notifications are `default repeat warning = DURATION` and `default repeat critical = DURATION` which can be found in -health stock configuration, when one of these interval is bigger than 0, Netdata will activate the repeat notification -for `CRITICAL`, `CLEAR` and `WARNING` messages. - -Format: - -```yaml -repeat: [off] [warning DURATION] [critical DURATION] -``` - -- `off`: Turns off the repeating feature for the current alert. This is effective when the default repeat settings has - been enabled in health configuration. -- `warning DURATION`: Defines the interval when the alert is in WARNING state. Use `0s` to turn off the repeating - notification for WARNING mode. -- `critical DURATION`: Defines the interval when the alert is in CRITICAL state. Use `0s` to turn off the repeating - notification for CRITICAL mode. - -#### Alert line `options` - -The only possible value for the `options` line is - -```yaml -options: no-clear-notification -``` - -For some alerts we need compare two time-frames, to detect anomalies. For example, `health.d/httpcheck.conf` has an -alert template called `web_service_slow` that compares the average http call response time over the last 3 minutes, -compared to the average over the last hour. It triggers a warning alert when the average of the last 3 minutes is twice -the average of the last hour. In such cases, it is easy to trigger the alert, but difficult to tell when the alert is -cleared. As time passes, the newest window moves into the older, so the average response time of the last hour will keep -increasing. Eventually, the comparison will find the averages in the two time-frames close enough to clear the alert. -However, the issue was not resolved, it's just a matter of the newer data "polluting" the old. For such alerts, it's a -good idea to tell Netdata to not clear the notification, by using the `no-clear-notification` option. - -#### Alert line `host labels` - -Defines the list of labels present on a host. See our [host labels guide](https://github.com/netdata/netdata/blob/master/docs/guides/using-host-labels.md) for -an explanation of host labels and how to implement them. - -For example, let's suppose that `netdata.conf` is configured with the following labels: - -```yaml -[host labels] - installed = 20191211 - room = server -``` - -And more labels in `netdata.conf` for workstations: - -```yaml -[host labels] - installed = 201705 - room = workstation -``` - -By defining labels inside of `netdata.conf`, you can now apply labels to alerts. For example, you can add the following -line to any alerts you'd like to apply to hosts that have the label `room = server`. - -```yaml -host labels: room = server -``` - -The `host labels` is a space-separated list that accepts simple patterns. For example, you can create an alert -that will be applied to all hosts installed in the last decade with the following line: - -```yaml -host labels: installed = 201* -``` - -See our [simple patterns docs](https://github.com/netdata/netdata/blob/master/libnetdata/simple_pattern/README.md) for more examples. - -#### Alert line `chart labels` - -Similar to host labels, the `chart labels` key can be used to filter if an alert will load or not for a specific chart, based on -whether these chart labels match or not. - -The list of chart labels present on each chart can be obtained from http://localhost:19999/api/v1/charts?all - -For example, each `disk_space` chart defines a chart label called `mount_point` with each instance of this chart having -a value there of which mount point it monitors. - -If you have an e.g. external disk mounted on `/mnt/disk1` and you don't wish any related disk space alerts running for -it (but you do for all other mount points), you can add the following to the alert's configuration: - -```yaml -chart labels: mount_point=!/mnt/disk1 * -``` - -The `chart labels` is a space-separated list that accepts simple patterns. If you use multiple different chart labels, -then the result is an OR between them. i.e. the following: - -```yaml -chart labels: mount_point=/mnt/disk1 device=sda -``` - -Will create the alert if the `mount_point` is `/mnt/disk1` or the `device` is `sda`. Furthermore, if a chart label name -is specified that does not exist in the chart, the chart won't be matched. - -See our [simple patterns docs](https://github.com/netdata/netdata/blob/master/libnetdata/simple_pattern/README.md) for more examples. - -#### Alert line `summary` - -The summary field contains a brief title of the alert. It is used as the subject for the notifications, and in -dashboard list of alerts. An example for the `ram_available` alert is: - -```yaml -summary: Available Ram -``` - -summary fields can contain special variables in their text that will be replaced during run-time to provide more specific -alert information. Current variables supported are: - -| variable | description | -|---------------------|-------------------------------------------------------------------| -| ${family} | Will be replaced by the family instance for the alert (e.g. eth0) | -| ${label:LABEL_NAME} | The variable will be replaced with the value of the chart label | - -For example, a summary field like the following: - -```yaml -summary: 1 minute received traffic overflow for ${label:device} -``` - -Will be rendered on the alert acting on interface `eth0` as: - -```yaml -summary: 1 minute received traffic overflow for eth0 -``` - -> Please note that variable names are case-sensitive. - -#### Alert line `info` - -The info field can contain a small piece of text describing the alert or template. This will be rendered in -notifications and UI elements whenever the specific alert is in focus. An example for the `ram_available` alert is: - -```yaml -info: Percentage of estimated amount of RAM available for userspace processes, without causing swapping -``` - -info fields can contain special variables in their text that will be replaced during run-time to provide more specific -alert information. Current variables supported are: - -| variable | description | -|---------------------|-------------------------------------------------------------------| -| ${family} | Will be replaced by the family instance for the alert (e.g. eth0) | -| ${label:LABEL_NAME} | The variable will be replaced with the value of the chart label | - -For example, an info field like the following: - -```yaml -info: average inbound utilization for the network interface ${family} over the last minute -``` - -Will be rendered on the alert acting on interface `eth0` as: - -```yaml -info: average inbound utilization for the network interface eth0 over the last minute -``` - -An alert acting on a chart that has a chart label named e.g. `target`, with a value of `https://netdata.cloud/`, -can be enriched as follows: - -```yaml -info: average ratio of HTTP responses with unexpected status over the last 5 minutes for the site ${label:target} -``` - -Will become: - -```yaml -info: average ratio of HTTP responses with unexpected status over the last 5 minutes for the site https://netdata.cloud/ -``` - -> Please note that variable names are case-sensitive. - -## Expressions - -Netdata has an internal infix expression parser under `libnetdata/eval`. This parses expressions and creates an internal -structure that allows fast execution of them. - -These operators are supported `+`, `-`, `*`, `/`, `<`, `==`, `<=`, `<>`, `!=`, `>`, `>=`, `&&`, `||`, `!`, `AND`, `OR`, `NOT`. -Boolean operators result in either `1` (true) or `0` (false). - -The conditional evaluation operator `?` is supported too. Using this operator IF-THEN-ELSE conditional statements can be -specified. The format is: `(condition) ? (true expression) : (false expression)`. So, Netdata will first evaluate the -`condition` and based on the result will either evaluate `true expression` or `false expression`. - -Example: `($this > 0) ? ($avail * 2) : ($used / 2)`. - -Nested such expressions are also supported (i.e. `true expression` and `false expression` can contain conditional -evaluations). - -Expressions also support the `abs()` function. - -Expressions can have variables. Variables start with `$`. Check below for more information. - -There are two special values you can use: - -- `nan`, for example `$this != nan` will check if the variable `this` is available. A variable can be `nan` if the - database lookup failed. All calculations (i.e. addition, multiplication, etc.) with a `nan` result in a `nan`. - -- `inf`, for example `$this != inf` will check if `this` is not infinite. A value or variable can be set to infinite - if divided by zero. All calculations (i.e. addition, multiplication, etc.) with a `inf` result in a `inf`. - -### Special use of the conditional operator - -A common (but not necessarily obvious) use of the conditional evaluation operator is to provide -[hysteresis](https://en.wikipedia.org/wiki/Hysteresis) around the critical or warning thresholds. This usage helps to -avoid bogus messages resulting from small variations in the value when it is varying regularly but staying close to the -threshold value, without needing to delay sending messages at all. - -An example of such usage from the default CPU usage alerts bundled with Netdata is: - -```yaml -warn: $this > (($status >= $WARNING) ? (75) : (85)) -crit: $this > (($status == $CRITICAL) ? (85) : (95)) -``` - -The above say: - -- If the alert is currently a warning, then the threshold for being considered a warning is 75, otherwise it's 85. - -- If the alert is currently critical, then the threshold for being considered critical is 85, otherwise it's 95. - -Which in turn, results in the following behavior: - -- While the value is rising, it will trigger a warning when it exceeds 85, and a critical alert when it exceeds 95. - -- While the value is falling, it will return to a warning state when it goes below 85, and a normal state when it goes - below 75. - -- If the value is constantly varying between 80 and 90, then it will trigger a warning the first time it goes above - 85, but will remain a warning until it goes below 75 (or goes above 85). - -- If the value is constantly varying between 90 and 100, then it will trigger a critical alert the first time it goes - above 95, but will remain a critical alert goes below 85 (at which point it will return to being a warning). - -## Variables - -You can find all the variables that can be used for a given chart, using -`http://NODE:19999/api/v1/alarm_variables?chart=CHART_NAME`, replacing `NODE` with the IP address or hostname for your -Agent dashboard. For example, [variables for the `system.cpu` chart of the -registry](https://registry.my-netdata.io/api/v1/alarm_variables?chart=system.cpu). - -> If you don't know how to find the CHART_NAME, you can read about it [here](https://github.com/netdata/netdata/blob/master/web/README.md#charts). - -Netdata supports 3 internal indexes for variables that will be used in health monitoring. - -<details><summary>The variables below can be used in both chart alerts and context templates.</summary> - -Although the `alarm_variables` link shows you variables for a particular chart, the same variables can also be used in -templates for charts belonging to a given [context](https://github.com/netdata/netdata/blob/master/web/README.md#contexts). The reason is that all charts of a given -context are essentially identical, with the only difference being the family that identifies a particular hardware or software instance. - -</details> - -- **chart local variables**. All the dimensions of the chart are exposed as local variables. The value of `$this` for - the other configured alerts of the chart also appears, under the name of each configured alert. - - Charts also define a few special variables: - - - `$last_collected_t` is the unix timestamp of the last data collection - - `$collected_total_raw` is the sum of all the dimensions (their last collected values) - - `$update_every` is the update frequency of the chart - - `$green` and `$red` the threshold defined in alerts (these are per chart - the charts inherits them from the first alert that defined them) - - Chart dimensions define their last calculated (i.e. interpolated) value, exactly as - shown on the charts, but also a variable with their name and suffix `_raw` that resolves - to the last collected value - as collected and another with suffix `_last_collected_t` - that resolves to unix timestamp the dimension was last collected (there may be dimensions - that fail to be collected while others continue normally). - -- **family variables**. Families are used to group charts together. For example all `eth0` - charts, have `family = eth0`. This index includes all local variables, but if there are - overlapping variables, only the first are exposed. - -- **host variables**. All the dimensions of all charts, including all alerts, in fullname. - Fullname is `CHART.VARIABLE`, where `CHART` is either the chart id or the chart name (both - are supported). - -- **special variables\*** are: - - - `$this`, which is resolved to the value of the current alert. - - - `$status`, which is resolved to the current status of the alert (the current = the last - status, i.e. before the current database lookup and the evaluation of the `calc` line). - This values can be compared with `$REMOVED`, `$UNINITIALIZED`, `$UNDEFINED`, `$CLEAR`, - `$WARNING`, `$CRITICAL`. These values are incremental, e.g. `$status > $CLEAR` works as - expected. - - - `$now`, which is resolved to current unix timestamp. - -## Alert statuses - -Alerts can have the following statuses: - -- `REMOVED` - the alert has been deleted (this happens when a SIGUSR2 is sent to Netdata - to reload health configuration) - -- `UNINITIALIZED` - the alert is not initialized yet - -- `UNDEFINED` - the alert failed to be calculated (i.e. the database lookup failed, - a division by zero occurred, etc.) - -- `CLEAR` - the alert is not armed / raised (i.e. is OK) - -- `WARNING` - the warning expression resulted in true or non-zero - -- `CRITICAL` - the critical expression resulted in true or non-zero - -The external script will be called for all status changes. - -## Example alerts - -Check the `health/health.d/` directory for all alerts shipped with Netdata. - -Here are a few examples: - -### Example 1 - check server alive - -A simple check if an apache server is alive: - -```yaml -template: apache_last_collected_secs - on: apache.requests - calc: $now - $last_collected_t - every: 10s - warn: $this > ( 5 * $update_every) - crit: $this > (10 * $update_every) -``` - -The above checks that Netdata is able to collect data from apache. In detail: - -```yaml -template: apache_last_collected_secs -``` - -The above defines a **template** named `apache_last_collected_secs`. -The name is important since `$apache_last_collected_secs` resolves to the `calc` line. -So, try to give something descriptive. - -```yaml - on: apache.requests -``` - -The above applies the **template** to all charts that have `context = apache.requests` -(i.e. all your apache servers). - -```yaml - calc: $now - $last_collected_t -``` - -- `$now` is a standard variable that resolves to the current timestamp. - -- `$last_collected_t` is the last data collection timestamp of the chart. - So this calculation gives the number of seconds passed since the last data collection. - -```yaml - every: 10s -``` - -The alert will be evaluated every 10 seconds. - -```yaml - warn: $this > ( 5 * $update_every) - crit: $this > (10 * $update_every) -``` - -If these result in non-zero or true, they trigger the alert. - -- `$this` refers to the value of this alert (e.g. the result of the `calc` line). - We could also use `$apache_last_collected_secs`. - -`$update_every` is the update frequency of the chart, in seconds. - -So, the warning condition checks if we have not collected data from apache for 5 -iterations and the critical condition checks for 10 iterations. - -### Example 2 - disk space - -Check if any of the disks is critically low on disk space: - -```yaml -template: disk_full_percent - on: disk.space - calc: $used * 100 / ($avail + $used) - every: 1m - warn: $this > 80 - crit: $this > 95 - repeat: warning 120s critical 10s -``` - -`$used` and `$avail` are the `used` and `avail` chart dimensions as shown on the dashboard. - -So, the `calc` line finds the percentage of used space. `$this` resolves to this percentage. - -This is a repeating alert and if the alert becomes CRITICAL it repeats the notifications every 10 seconds. It also -repeats notifications every 2 minutes if the alert goes into WARNING mode. - -### Example 3 - disk fill rate - -Predict if any disk will run out of space in the near future. - -We do this in 2 steps: - -Calculate the disk fill rate: - -```yaml - template: disk_fill_rate - on: disk.space - lookup: max -1s at -30m unaligned of avail - calc: ($this - $avail) / (30 * 60) - every: 15s -``` - -In the `calc` line: `$this` is the result of the `lookup` line (i.e. the free space 30 minutes -ago) and `$avail` is the current disk free space. So the `calc` line will either have a positive -number of GB/second if the disk is filling up, or a negative number of GB/second if the disk is -freeing up space. - -There is no `warn` or `crit` lines here. So, this template will just do the calculation and -nothing more. - -Predict the hours after which the disk will run out of space: - -```yaml - template: disk_full_after_hours - on: disk.space - calc: $avail / $disk_fill_rate / 3600 - every: 10s - warn: $this > 0 and $this < 48 - crit: $this > 0 and $this < 24 -``` - -The `calc` line estimates the time in hours, we will run out of disk space. Of course, only -positive values are interesting for this check, so the warning and critical conditions check -for positive values and that we have enough free space for 48 and 24 hours respectively. - -Once this alert triggers we will receive an email like this: - - - -### Example 4 - dropped packets - -Check if any network interface is dropping packets: - -```yaml -template: 30min_packet_drops - on: net.drops - lookup: sum -30m unaligned absolute - every: 10s - crit: $this > 0 -``` - -The `lookup` line will calculate the sum of the all dropped packets in the last 30 minutes. - -The `crit` line will issue a critical alert if even a single packet has been dropped. - -Note that the drops chart does not exist if a network interface has never dropped a single packet. -When Netdata detects a dropped packet, it will add the chart, and it will automatically attach this -alert to it. - -### Example 5 - CPU usage - -Check if user or system dimension is using more than 50% of cpu: - -```yaml -template: cpu_template - on: system.cpu - os: linux - lookup: average -1m foreach system,user - units: % - every: 10s - warn: $this > 50 - crit: $this > 80 -``` - -The `lookup` line will calculate the average CPU usage from system and user over the last minute. Because we have -the foreach in the `lookup` line, Netdata will create two independent alerts called `cpu_template_system` -and `dim_template_user` that will have all the other parameters shared among them. - -### Example 6 - CPU usage - -Check if all dimensions are using more than 50% of cpu: - -```yaml -template: cpu_template - on: system.cpu - os: linux - lookup: average -1m foreach * - units: % - every: 10s - warn: $this > 50 - crit: $this > 80 -``` - -The `lookup` line will calculate the average of CPU usage from system and user over the last minute. In this case -Netdata will create alerts for all dimensions of the chart. - -### Example 7 - Z-Score based alert - -Derive a "[Z Score](https://en.wikipedia.org/wiki/Standard_score)" based alert on `user` dimension of the `system.cpu` chart: - -```yaml - alarm: cpu_user_mean - on: system.cpu -lookup: mean -60s of user - every: 10s - - alarm: cpu_user_stddev - on: system.cpu -lookup: stddev -60s of user - every: 10s - - alarm: cpu_user_zscore - on: system.cpu -lookup: mean -10s of user - calc: ($this - $cpu_user_mean) / $cpu_user_stddev - every: 10s - warn: $this < -2 or $this > 2 - crit: $this < -3 or $this > 3 -``` - -Since [`z = (x - mean) / stddev`](https://en.wikipedia.org/wiki/Standard_score) we create two input alerts, one for `mean` and one for `stddev` and then use them both as inputs in our final `cpu_user_zscore` alert. - -### Example 8 - [Anomaly rate](https://github.com/netdata/netdata/blob/master/ml/README.md#anomaly-rate) based CPU dimensions alert - -Warning if 5 minute rolling [anomaly rate](https://github.com/netdata/netdata/blob/master/ml/README.md#anomaly-rate) for any CPU dimension is above 5%, critical if it goes above 20%: - -```yaml -template: ml_5min_cpu_dims - on: system.cpu - os: linux - hosts: * - lookup: average -5m anomaly-bit foreach * - calc: $this - units: % - every: 30s - warn: $this > (($status >= $WARNING) ? (5) : (20)) - crit: $this > (($status == $CRITICAL) ? (20) : (100)) - info: rolling 5min anomaly rate for each system.cpu dimension -``` - -The `lookup` line will calculate the average anomaly rate of each `system.cpu` dimension over the last 5 minues. In this case -Netdata will create alerts for all dimensions of the chart. - -### Example 9 - [Anomaly rate](https://github.com/netdata/netdata/blob/master/ml/README.md#anomaly-rate) based CPU chart alert - -Warning if 5 minute rolling [anomaly rate](https://github.com/netdata/netdata/blob/master/ml/README.md#anomaly-rate) averaged across all CPU dimensions is above 5%, critical if it goes above 20%: - -```yaml -template: ml_5min_cpu_chart - on: system.cpu - os: linux - hosts: * - lookup: average -5m anomaly-bit of * - calc: $this - units: % - every: 30s - warn: $this > (($status >= $WARNING) ? (5) : (20)) - crit: $this > (($status == $CRITICAL) ? (20) : (100)) - info: rolling 5min anomaly rate for system.cpu chart -``` - -The `lookup` line will calculate the average anomaly rate across all `system.cpu` dimensions over the last 5 minues. In this case -Netdata will create one alert for the chart. - -### Example 10 - [Anomaly rate](https://github.com/netdata/netdata/blob/master/ml/README.md#anomaly-rate) based node level alert - -Warning if 5 minute rolling [anomaly rate](https://github.com/netdata/netdata/blob/master/ml/README.md#anomaly-rate) averaged across all ML enabled dimensions is above 5%, critical if it goes above 20%: - -```yaml -template: ml_5min_node - on: anomaly_detection.anomaly_rate - os: linux - hosts: * - lookup: average -5m of anomaly_rate - calc: $this - units: % - every: 30s - warn: $this > (($status >= $WARNING) ? (5) : (20)) - crit: $this > (($status == $CRITICAL) ? (20) : (100)) - info: rolling 5min anomaly rate for all ML enabled dims -``` - -The `lookup` line will use the `anomaly_rate` dimension of the `anomaly_detection.anomaly_rate` ML chart to calculate the average [node level anomaly rate](https://github.com/netdata/netdata/blob/master/ml/README.md#node-anomaly-rate) over the last 5 minues. - -## Use dimension templates to create dynamic alerts - -In v1.18 of Netdata, we introduced **dimension templates** for alerts, which simplifies the process of -writing [alert entities](#health-entity-reference) for -charts with many dimensions. - -Dimension templates can condense many individual entities into one—no more copy-pasting one entity and changing the -`alarm`/`template` and `lookup` lines for each dimension you'd like to monitor. - -### The fundamentals of `foreach` - -> **Note**: works only with [templates](#alert-line-alarm-or-template). - -Our dimension templates update creates a new `foreach` parameter to the -existing [`lookup` line](#alert-line-lookup). This -is where the magic happens. - -You use the `foreach` parameter to specify which dimensions you want to monitor with this single alert. You can separate -them with a comma (`,`) or a pipe (`|`). You can also use -a [Netdata simple pattern](https://github.com/netdata/netdata/blob/master/libnetdata/simple_pattern/README.md) to create -many alerts with a regex-like syntax. - -The `foreach` parameter _has_ to be the last parameter in your `lookup` line, and if you have both `of` and `foreach` in -the same `lookup` line, Netdata will ignore the `of` parameter and use `foreach` instead. - -Let's get into some examples, so you can see how the new parameter works. - -> ⚠️ The following entities are examples to showcase the functionality and syntax of dimension templates. They are not -> meant to be run as-is on production systems. - -### Condensing entities with `foreach` - -Let's say you want to monitor the `system`, `user`, and `nice` dimensions in your system's overall CPU utilization. -Before dimension templates, you would need the following three entities: - -```yaml - alarm: cpu_system - on: system.cpu -lookup: average -10m of system - every: 1m - warn: $this > 50 - crit: $this > 80 - - alarm: cpu_user - on: system.cpu -lookup: average -10m of user - every: 1m - warn: $this > 50 - crit: $this > 80 - - alarm: cpu_nice - on: system.cpu -lookup: average -10m of nice - every: 1m - warn: $this > 50 - crit: $this > 80 -``` - -With dimension templates, you can condense these into a single template. Take note of the `lookup` line. - -```yaml -template: cpu_template - on: system.cpu - lookup: average -10m foreach system,user,nice - every: 1m - warn: $this > 50 - crit: $this > 80 -``` - -The `template` line specifies the naming scheme Netdata will use. You can use whatever naming scheme you'd like, with `.` -and `_` being the only allowed symbols. - -The `lookup` line has changed from `of` to `foreach`, and we're now passing three dimensions. - -In this example, Netdata will create three alerts with the names `cpu_template_system`, `cpu_template_user`, and -`cpu_template_nice`. Every minute, each alert will use the same database query to calculate the average CPU usage for -the `system`, `user`, and `nice` dimensions over the last 10 minutes and send out alerts if necessary. - -You can find these three alerts active by clicking on the **Alerts** button in the top navigation, and then clicking on -the **All** tab and scrolling to the **system - cpu** collapsible section. - - - -Let's look at some other examples of how `foreach` works, so you can best apply it in your configurations. - -### Using a Netdata simple pattern in `foreach` - -In the last example, we used `foreach system,user,nice` to create three distinct alerts using dimension templates. But -what if you want to quickly create alerts for _all_ the dimensions of a given chart? - -Use a [simple pattern](https://github.com/netdata/netdata/blob/master/libnetdata/simple_pattern/README.md)! One example of a simple pattern is a single wildcard -(`*`). - -Instead of monitoring system CPU usage, let's monitor per-application CPU usage using the `apps.cpu` chart. Passing a -wildcard as the simple pattern tells Netdata to create a separate alert for _every_ process on your system: - -```yaml - alarm: app_cpu - on: apps.cpu -lookup: average -10m percentage foreach * - every: 1m - warn: $this > 50 - crit: $this > 80 -``` - -This entity will now create alerts for every dimension in the `apps.cpu` chart. Given that most `apps.cpu` charts have -10 or more dimensions, using the wildcard ensures you catch every CPU-hogging process. - -To learn more about how to use simple patterns with dimension templates, see -our [simple patterns documentation](https://github.com/netdata/netdata/blob/master/libnetdata/simple_pattern/README.md). - -### Using `foreach` with alert templates - -Dimension templates also work -with [alert templates](#alert-line-alarm-or-template). -Alert templates help you create alerts for all the charts with a given context—for example, all the cores of your -system's CPU. - -By combining the two, you can create dozens of individual alerts with a single template entity. Here's how you would -create alerts for the `system`, `user`, and `nice` dimensions for every chart in the `cpu.cpu` context—or, in other -words, every CPU core. - -```yaml -template: cpu_template - on: cpu.cpu - lookup: average -10m percentage foreach system,user,nice - every: 1m - warn: $this > 50 - crit: $this > 80 -``` - -On a system with a 6-core, 12-thread Ryzen 5 1600 CPU, this one entity creates alerts on the following charts and -dimensions: - -- `cpu.cpu0` - - `cpu_template_user` - - `cpu_template_system` - - `cpu_template_nice` - -- `cpu.cpu1` - - `cpu_template_user` - - `cpu_template_system` - - `cpu_template_nice` - -- `cpu.cpu2` - - `cpu_template_user` - - `cpu_template_system` - - `cpu_template_nice` - -- ... - -- `cpu.cpu11` - - `cpu_template_user` - - `cpu_template_system` - - `cpu_template_nice` - -And how just a few of those dimension template-generated alerts look like in the Netdata dashboard. - - - -All in all, this single entity creates 36 individual alerts. Much easier than writing 36 separate entities in your -health configuration files! - -## Troubleshooting - -You can compile Netdata with [debugging](https://github.com/netdata/netdata/blob/master/daemon/README.md#debugging) and then set in `netdata.conf`: - -```yaml -[global] - debug flags = 0x0000000000800000 -``` - -Then check your `/var/log/netdata/debug.log`. It will show you how it works. Important: this will generate a lot of -output in debug.log. - -You can find the context of charts by looking up the chart in either `http://NODE:19999/netdata.conf` or -`http://NODE:19999/api/v1/charts`, replacing `NODE` with the IP address or hostname for your Agent dashboard. - -You can find how Netdata interpreted the expressions by examining the alert at -`http://NODE:19999/api/v1/alarms?all`. For each expression, Netdata will return the expression as given in its -config file, and the same expression with additional parentheses added to indicate the evaluation flow of the -expression. diff --git a/health/guides/adaptec_raid/adaptec_raid_ld_status.md b/health/guides/adaptec_raid/adaptec_raid_ld_status.md deleted file mode 100644 index 7da1cdd1..00000000 --- a/health/guides/adaptec_raid/adaptec_raid_ld_status.md +++ /dev/null @@ -1,37 +0,0 @@ -### Understand the alert - -This alert is related to the Adaptec RAID controller, which manages the logical device statuses on your RAID configuration. When this alert is triggered in a critical state, it means that a logical device state value is in a degraded or failed state, indicating that one or more disks in your RAID configuration have failed. - -### Troubleshoot the alert - -Data is priceless. Before taking any action, ensure to have necessary backups in place. Netdata is not liable for any loss or corruption of any data, database, or software. - -Your Adaptec RAID card will automatically start rebuilding a faulty hard drive when you replace it with a healthy one. Sometimes this operation may take some time or may not start automatically. - -#### 1. Verify that a rebuild is not in process - -Check if the rebuild process is already running: - -``` -root@netdata # arcconf GETSTATUS <Controller_num> -``` - -Replace `<Controller_num>` with the number of your RAID controller. - -#### 2. Check for idle/missing segments of logical devices - -Examine the output of the previous command to find any segments that are idle or missing. - -#### 3. Manually change your ld status - -If the rebuild process hasn't started automatically, change the logical device (ld) status manually. This action will trigger a rebuild on your RAID: - -``` -root@netdata # arcconf SETSTATE <Controller_num> LOGICALDRIVE <LD_num> OPTIMAL ADVANCED nocheck noprompt -``` - -Replace `<Controller_num>` with the number of your RAID controller and `<LD_num>` with the number of the logical device. - -### Useful resources - -1. [Microsemi Adaptec ARCCONF User's Guide](https://download.adaptec.com/pdfs/user_guides/microsemi_cli_smarthba_smartraid_v3_00_23484_ug.pdf) diff --git a/health/guides/adaptec_raid/adaptec_raid_pd_state.md b/health/guides/adaptec_raid/adaptec_raid_pd_state.md deleted file mode 100644 index 00c9d590..00000000 --- a/health/guides/adaptec_raid/adaptec_raid_pd_state.md +++ /dev/null @@ -1,66 +0,0 @@ -### Understand the Alert - -A RAID controller is a card or chip located between the operating system and a storage drive (usually a hard drive). This is an alert about the Adaptec raid controller. The Netdata Agent checks the physical device statuses which are managed by your raid controller. - -This alert is triggered in critical state when the physical device is offline. - -### Troubleshoot the Alert - -- Check the Offline Disk - -Use the `arcconf` CLI tool to identify which drive or drives are offline: - -``` -root@netdata # arcconf GETCONFIG 1 AL -``` - -This command will display the configuration of all the managed Adaptec RAID controllers in your system. Check the "DEVICE #" and "DEVICE_DEFINITION" fields for details about the offline devices. - -- Examine RAID Array Health - -Check the array health status to better understand the overall array's stability and functionality: - -``` -root@netdata # arcconf GETSTATUS 1 -``` - -This will provide an overview of your RAID controller's health status, including the operational mode, failure state, and rebuild progress (if applicable). - -- Replace the Offline Disk - -Before replacing an offline disk, ensure that you have a current backup of your data. Follow these steps to replace the drive: - -1. Power off your system. -2. Remove the offline drive. -3. Insert the new drive. -4. Power on your system. - -After the drive replacement, the Adaptec RAID card should automatically start rebuilding the faulty disk drive using the new disk. You can check the progress of the rebuild process with the `arcconf` command: - -``` -root@netdata # arcconf GETSTATUS 1 -``` - -- Monitor Rebuild Progress - -It's essential to monitor the RAID array's rebuild process to ensure it completes successfully. Use the `arcconf` command to verify the rebuild status: - -``` -root@netdata # arcconf GETSTATUS 1 -``` - -This command will display the progress and status of the rebuild process. Keep an eye on it until it's completed. - -- Verify RAID Array Health - -After the rebuild is complete, use the `arcconf` command again to verify the health status of the RAID array: - -``` -root@netdata # arcconf GETSTATUS 1 -``` - -Make sure that the RAID array's status is "Optimal" or "Ready" and that the replaced disk drive is now online. - -### Useful Resources - -1. [Adaptec Command Line Interface User’s Guide](https://download.adaptec.com/pdfs/user_guides/microsemi_cli_smarthba_smartraid_v3_00_23484_ug.pdf) diff --git a/health/guides/anomalies/anomalies_anomaly_flags.md b/health/guides/anomalies/anomalies_anomaly_flags.md deleted file mode 100644 index d4ffa164..00000000 --- a/health/guides/anomalies/anomalies_anomaly_flags.md +++ /dev/null @@ -1,30 +0,0 @@ -### Understand the alert - -This alert, `anomalies_anomaly_flags`, is triggered when the Netdata Agent detects more than 10 anomalies in the past 2 minutes. Anomalies are events or observations that are significantly different from the majority of the data, raising suspicions about potential issues. - -### What does an anomaly mean? - -An anomaly is an unusual pattern, behavior, or event in your system's operations. These occurrences are typically unexpected and can be either positive or negative. In the context of this alert, the anomalies are most likely related to performance issues, such as a sudden spike in CPU usage, disk I/O, or network activity. - -### Troubleshoot the alert - -1. Identify the source of the anomalies: - - To understand the cause of these anomalies, you should examine the various charts in Netdata dashboard for potential performance issues. Look for sudden spikes, drops, or other irregular patterns in CPU usage, memory usage, disk I/O, and network activity. - -2. Check for any application or system errors: - - Review system and application log files to detect any errors or warnings that may be related to the anomalies. Be sure to check logs of your applications, services, and databases for any error messages or unusual behavior. - -3. Monitor resource usage: - - You can use the Anomalies tab in Netdata to dive deeper into what could be triggering anomalies in your infrastructure. - -4. Adjust thresholds or address the underlying issue: - - If the anomalies are due to normal variations in your system's operation or expected spikes in resource usage, consider adjusting the threshold for this alert to avoid false positives. If the anomalies indicate an actual problem or point to a misconfiguration, take appropriate action to address the root cause. - -5. Observe the results: - - After implementing changes or adjustments, continue monitoring the system using Netdata and other tools to ensure the anomalies are resolved and do not persist. - diff --git a/health/guides/anomalies/anomalies_anomaly_probabilities.md b/health/guides/anomalies/anomalies_anomaly_probabilities.md deleted file mode 100644 index cea04a43..00000000 --- a/health/guides/anomalies/anomalies_anomaly_probabilities.md +++ /dev/null @@ -1,30 +0,0 @@ -### Understand the alert - -This alert, `anomalies_anomaly_probabilities`, is generated by the Netdata agent when the average anomaly probability over the last 2 minutes is 50. An anomaly probability is a value calculated by the machine learning (ML) component in Netdata, aiming to detect unusual events or behavior in system metrics. - -### What is anomaly probability? - -Anomaly probability is a percentage calculated by the Netdata's ML feature that represents the probability of an observed metric value being considered an anomaly. A higher anomaly probability indicates a higher chance that the system behavior is deviating from its historical patterns or expected behavior. - -### What does an average anomaly probability of 50 mean? - -An average anomaly probability of 50 indicates that there might be some unusual events, metrics, or behavior in your monitored system. This might not necessarily indicate an issue, but rather, it raises suspicious deviations in the system metrics that are worth investigating. - -### Troubleshoot the alert - -1. Investigate the unusual events or behavior - - The first step is to identify the metric(s) or series of metric values that are causing the alert. Look for changes in the monitored metrics or a combination of metrics that deviate significantly from their historical patterns. - -2. Check system performance and resource usage - - Use the overview and anomalies tab to explore the metrics that could be contributing to anomalies. - -3. Inspect system logs - - System logs can provide valuable information about unusual events or behaviors. Check system logs using tools like `journalctl`, `dmesg`, or `tail` for any error messages, warnings, or critical events that might be related to the anomaly. - -4. Review the alert settings - - In some cases, the alert may be caused by overly strict or sensitive settings, leading to the triggering of false positives. Review the settings and consider adjusting the anomaly probability threshold, if necessary. - diff --git a/health/guides/apcupsd/apcupsd_10min_ups_load.md b/health/guides/apcupsd/apcupsd_10min_ups_load.md deleted file mode 100644 index 4069de9f..00000000 --- a/health/guides/apcupsd/apcupsd_10min_ups_load.md +++ /dev/null @@ -1,22 +0,0 @@ -### Understand the alert - -This alert is related to your APC uninterruptible power supply (UPS) device. If you receive this alert, it means that your UPS is experiencing high load, which could result in it entering bypass mode or shutdown to protect the device. The alert is triggered in a warning state when the average UPS load is between 70-80% and in a critical state when it is between 85-95%. - -### Troubleshoot the alert - -Follow these steps to address the high load on your UPS device: - -1. **Identify devices connected to the UPS**: Make a list of all the devices connected to the UPS. This list could include computers, servers, routers, and other essential equipment. - -2. **Assess the importance of each device**: Prioritize the devices connected to the UPS based on their importance to your network infrastructure. Determine which devices are mission-critical and which ones can be temporarily disconnected without causing significant disruptions. - -3. **Disconnect non-critical devices**: Once you have assessed the importance of the connected devices, disconnect any non-critical devices to reduce the load on the UPS. This action will help ensure that the mission-critical devices continue to receive power during a utility failure. - -4. **Consider additional UPS capacity**: If you frequently receive this alert or are unable to disconnect enough devices to reduce the load on the UPS, consider adding additional UPS capacity to your infrastructure. This additional capacity could come in the form of additional UPS units or a larger UPS with a higher output capacity. - -5. **Monitor the UPS load**: After disconnecting non-critical devices or adding additional UPS capacity, continue monitoring the UPS load using the Netdata Agent to ensure the load stays within acceptable limits. If the alert persists, you may need to reevaluate your infrastructure and device connections. - -### Useful resources - -1. [APC UPS Management](https://www.schneider-electric.com/en/product-category/870_IDSof_0145_NET/!ut/p/z1/hZBNbsIwDMD3ejK_Sh4xWb1tgwEfkFLCVKrUYKngigoXrWtJ_gSCk_bm0RfbT707TIAx8WuuDIwdwmK28Q2YY3Agq3XkKAGwpTEgZUPAHD7HxAqcAkgxV7OuBHSkrBSV7eGzvdN1jQZSYhNnhP7YvfFGttb8j7LlPvTXSuC7V-q1DXce8XtWjZmfrniT7ufcTtT8AKaWHzA!!/dz/d5/L2dBISEvZ0FBIS9nQSEh/) -2. [Understanding the Different Types of UPS Systems](https://www.apc.com/us/en/faqs/FA157448/) diff --git a/health/guides/apcupsd/apcupsd_last_collected_secs.md b/health/guides/apcupsd/apcupsd_last_collected_secs.md deleted file mode 100644 index 7c8f8035..00000000 --- a/health/guides/apcupsd/apcupsd_last_collected_secs.md +++ /dev/null @@ -1,46 +0,0 @@ -### Understand the alert - -This alert is related to your American Power Conversion (APC) uninterruptible power supply (UPS) device. The Netdata Agent monitors the number of seconds since the last successful data collection by querying the `apcaccess` tool. If you receive this alert, it means that no data collection has taken place for some time, which might indicate a problem with the APC UPS device or connection. - -### Troubleshoot the alert - -1. Verify the `apcaccess` tool is installed and functioning properly - ``` - $ apcaccess status - ``` - This command should provide you with a status display of the UPS. If the command is not found, you may need to install the `apcaccess` tool. - -2. Check the APC UPS daemon - - a. Check the status of the APC UPS daemon - ``` - $ systemctl status apcupsd - ``` - - b. Check for obvious and common errors, such as wrong device path, incorrect permissions, or configuration issues in `/etc/apcupsd/apcupsd.conf`. - - c. If needed, restart the APC UPS daemon - ``` - $ systemctl restart apcupsd - ``` - -3. Inspect system logs - - Check the system logs for any error messages related to APC UPS or `apcupsd`, which might give more insights into the issue. - -4. Verify UPS Connection - - Ensure that the UPS device is properly connected to your server, both physically (USB/Serial) and in the configuration file (`/etc/apcupsd/apcupsd.conf`). - -5. Update Netdata configuration - - If the issue is still not resolved, you can try updating the Netdata configuration file for the `apcupsd_last_collected_secs` collector. - -6. Check your UPS device - - If all previous steps have been completed and the issue persists, your UPS device might be faulty. Consider contacting the manufacturer for support or replace the device with a known-good unit. - -### Useful resources - -1. [Netdata - APC UPS monitoring](https://learn.netdata.cloud/docs/data-collection/ups/apc-ups) -2. [`apcupsd` - Power management and control software for APC UPS](https://github.com/apcupsd/apcupsd) diff --git a/health/guides/apcupsd/apcupsd_ups_charge.md b/health/guides/apcupsd/apcupsd_ups_charge.md deleted file mode 100644 index 600520b5..00000000 --- a/health/guides/apcupsd/apcupsd_ups_charge.md +++ /dev/null @@ -1,45 +0,0 @@ -### Understand the alert - -This alert is related to the charge level of your American Power Conversion (APC) uninterruptible power supply (UPS) device. When the UPS charge level drops below a certain threshold, you receive an alert indicating that the system is running on battery and may shut down if external power is not restored soon. - -- Warning state: UPS charge < 100% -- Critical state: UPS charge < 50% - -The main purpose of a UPS is to provide a temporary power source to connected devices in case of a power outage. As the battery charge decreases, you need to either restore the power supply or prepare the equipment for a graceful shutdown. - -### Troubleshoot the alert - -1. Check the UPS charge level and status - - To investigate the current status and charge level of the UPS, you can use the `apcaccess` command which provides information about the APC UPS device. - - ``` - apcaccess - ``` - - Look for the `STATUS` and `BCHARGE` fields in the output. - -2. Restore the power supply (if possible) - - If the power outage is temporary or local (e.g. due to a tripped circuit breaker), try to restore the power supply to the UPS by fixing the issue or connecting the UPS to a different power source. - -3. Prepare for a graceful shutdown - - If you cannot restore power to the UPS, or if the battery charge is critically low, you should immediately prepare your machine and any connected devices for a graceful shutdown. This will help to avoid data loss or system corruption due to an abrupt shutdown. - - For Linux systems, you can execute the following command to perform a graceful shutdown: - - ``` - sudo shutdown -h +1 "UPS battery is low. The system will shut down in 1 minute." - ``` - - For Windows systems, open a command prompt with admin privileges and execute the following command to perform a graceful shutdown: - - ``` - shutdown /s /t 60 /c "UPS battery is low. The system will shut down in 1 minute." - ``` - -4. Monitor UPS and system logs - - Keep an eye on UPS and system logs to detect any issues with the power supply or UPS device. This can help you stay informed about the system's status and troubleshoot any potential problems. - diff --git a/health/guides/beanstalk/beanstalk_number_of_tubes.md b/health/guides/beanstalk/beanstalk_number_of_tubes.md deleted file mode 100644 index 8f14f07f..00000000 --- a/health/guides/beanstalk/beanstalk_number_of_tubes.md +++ /dev/null @@ -1,40 +0,0 @@ -### Understand the alert - -This alert monitors the current number of tubes on a Beanstalk server. If the number of tubes drops below 5, you will receive a warning. Tubes are used as queues for jobs in Beanstalk, and having a low number of tubes may indicate an issue with service configuration or job processing. - -### What are tubes in Beanstalk? - -Beanstalk is a simple, fast work queue service that allows you to distribute tasks among different workers. In Beanstalk, *tubes* are essentially queues for jobs. Each tube stores jobs with specific priorities, Time-to-run (TTR) values, and other relevant data. Workers can reserve jobs from specific tubes, process the jobs, and delete them when finished. - -### Troubleshoot the alert - -1. Check Beanstalk server status. - - Use the following command to display the current Beanstalk server status: - - ``` - beanstalkctl stats - ``` - - Look for the current number of tubes (`current-tubes`). If it is too low (below 5), proceed to the next step. - -2. Identify recently deleted tubes. - - Determine if any tubes have been deleted recently. Check your application logs, Beanstalk daemon logs, or discuss with your development team to find out if any tube deletion is intentional. - -3. Check for misconfigurations or code issues. - - Inspect your Beanstalk server configuration and verify that the expected tubes are correctly defined. Additionally, review the application code and deployment scripts to ensure that tubes are being created and used as intended. - -4. Check worker status and processing. - - Verify that your worker processes are running and processing jobs from the tubes correctly. If there are issues with worker processes, it may lead to unused or unprocessed tubes. - -5. Create missing tubes if necessary. - - If you've identified that some tubes are missing and need to be created, add the required tubes using your application code or Beanstalk configuration. - -### Useful resources - -1. [Beanstalk Introduction](https://beanstalkd.github.io/) -2. [Beanstalk Protocol Documentation](https://raw.githubusercontent.com/beanstalkd/beanstalkd/master/doc/protocol.txt) diff --git a/health/guides/beanstalk/beanstalk_server_buried_jobs.md b/health/guides/beanstalk/beanstalk_server_buried_jobs.md deleted file mode 100644 index 99d4f507..00000000 --- a/health/guides/beanstalk/beanstalk_server_buried_jobs.md +++ /dev/null @@ -1,32 +0,0 @@ -### Understand the alert - -This alert is related to the `Beanstalk` message queue system and is triggered when there are buried jobs in the queue across all tubes. A buried job is one that has encountered an issue during processing by the consumer, so it remains in the queue waiting for manual action. This alert is raised in a warning state if there are more than 0 buried jobs and in a critical state if there are more than 10. - -### What are buried jobs? - -Buried jobs are tasks that have faced an error or issue during processing by the consumer, and as a result, have been `buried`. This means these jobs remain in the queue, awaiting manual intervention for them to be processed again. The presence of buried jobs does not affect the processing of new jobs in the queue. - -### Troubleshoot the alert - -1. Identify the buried jobs: Use the `beanstalk-tool` to inspect the Beanstalk server and list the buried jobs in the tubes. If you don't have `beanstalk-tool`, install it using pip: - - ``` - pip install beanstalkc - beanstalk-tool <beanstalk server host>:<beanstalk server port> stats_tube <tube_name> - ``` - -2. Examine the buried jobs: To investigate the cause of the buried jobs, find related logs, either from the Beanstalk server or from the consumer application. Analyzing the logs can lead to the root cause of the problem. - -3. Fix the issue: Once you identify the cause, resolve the issue in either the consumer application, or if necessary, in the Beanstalk server configuration. - -4. Kick the buried jobs: After resolving the issue, you need to manually kick the buried jobs back into the queue for processing. Use the following command with `beanstalk-tool`: - - ``` - beanstalk-tool <beanstalk server host>:<beanstalk server port> kick <number_of_jobs_to_kick> --tube=<tube_name> - ``` - -5. Monitor the queue: After kicking the buried jobs, monitor the queue and ensure that the jobs are processed without encountering more errors. - -### Useful resources - -1. [Beanstalk Documentation](https://beanstalkd.github.io/) diff --git a/health/guides/beanstalk/beanstalk_tube_buried_jobs.md b/health/guides/beanstalk/beanstalk_tube_buried_jobs.md deleted file mode 100644 index 76a43cc6..00000000 --- a/health/guides/beanstalk/beanstalk_tube_buried_jobs.md +++ /dev/null @@ -1,30 +0,0 @@ -### Understand the alert - -This alert monitors the number of buried jobs in each beanstalkd tube. If you receive this alert, it means that there are jobs that have been buried, and you need to investigate the cause. The warning threshold is set at more than zero buried jobs, and the critical threshold is set at more than ten buried jobs. - -### What are buried jobs? - -In Beanstalkd, buried jobs are jobs that were moved to the buried state deliberately or jobs that have failed repeatedly. They're kept in a separate queue and will not be processed by workers until they're explicitly handled or deleted. - -### Troubleshoot the alert - -1. Check the Beanstalkd logs for any errors or pertinent information related to the buried jobs. You can find the logs in the `/var/log/beanstalkd.log` file (the default log file location) or any other custom location defined for Beanstalkd. - -2. Use the `beanstalk-console` or a similar tool to inspect the buried jobs to determine their causes. You can download `beanstalk-console` [here](https://github.com/ptrofimov/beanstalk_console). - -3. Review the applications or workers that are interacting with the affected tubes to find any possible issues or bugs. - -4. If the buried jobs are blocking the processing of other jobs, consider moving them to another tube with higher priority or increase the number of workers processing the tube. - -5. If the buried jobs are safe to delete or requeue, do so to clear the count and alleviate the alert. You can use the following commands to kick or delete jobs using the `beanstalk-cli`: - ``` - beanstalk-cli kick-job [<job-id>] - beanstalk-cli delete-job [<job-id>] - ``` - -6. If none of the steps above help mitigate the issue, consider contacting the sysadmin or developers of the application using Beanstalkd. - -### Useful resources - -1. [Beanstalkd Protocol](https://raw.githubusercontent.com/beanstalkd/beanstalkd/master/doc/protocol.txt) -2. [Beanstalk_console - a web-based beanstalk queue server console](https://github.com/ptrofimov/beanstalk_console) diff --git a/health/guides/boinc/boinc_active_tasks.md b/health/guides/boinc/boinc_active_tasks.md deleted file mode 100644 index efdb7b9e..00000000 --- a/health/guides/boinc/boinc_active_tasks.md +++ /dev/null @@ -1,44 +0,0 @@ -### Understand the alert - -This alert monitors the BOINC (Berkeley Open Infrastructure for Network Computing) client's average number of active tasks over the last 10 minutes. If you receive this alert, it means that there might be an issue with your BOINC tasks or client. - -### Troubleshoot the alert - -- Check the BOINC client logs - -1. Locate the BOINC client log file, usually in `/var/lib/boinc-client/`. -2. Inspect the log file for any issues or error messages related to task execution, connection, or client behavior. - -- Check the status of the BOINC client - -1. To check the status, run the following command: - - ``` - sudo /etc/init.d/boinc-client status - ``` - -2. If the client is not running, start it using: - - ``` - sudo /etc/init.d/boinc-client start - ``` - -- Restart the BOINC client - -1. Restart the BOINC client, in most of the Linux distros: - - ``` - sudo /etc/init.d/boinc-client restart - ``` - -- Ensure your system has adequate resources - -Monitoring and managing your computer resources (CPU, memory, disk space) can help ensure smooth operation of the BOINC client and its tasks. If your system is low on resources, consider freeing up space or upgrading your hardware. - -- Update the BOINC client - -Make sure your BOINC client is up-to-date by checking the official BOINC website (https://boinc.berkeley.edu/download.php) for the latest version. - -### Useful resources - -1. [BOINC User Manual](https://boinc.berkeley.edu/wiki/User_manual) diff --git a/health/guides/boinc/boinc_compute_errors.md b/health/guides/boinc/boinc_compute_errors.md deleted file mode 100644 index 8390686c..00000000 --- a/health/guides/boinc/boinc_compute_errors.md +++ /dev/null @@ -1,33 +0,0 @@ -### Understand the alert - -The `boinc_compute_errors` alert indicates that your system has experienced an increase in the average number of compute errors over the last 10 minutes when running BOINC tasks. It is important to identify the cause of these errors and take appropriate action to minimize the impact on your system. - -### Troubleshoot the alert - -1. Check the BOINC client logs - BOINC client logs can provide useful information about compute errors. The logs can usually be found in the `/var/lib/boinc-client/` directory. Look for any error messages or information that could indicate the cause of the issues. - -2. Verify the system requirements - Ensure that your system meets the minimum requirements to run the BOINC tasks. This includes checking the CPU, RAM, disk space, and any other device-specific requirements. If your system does not meet the requirements, you may need to upgrade your hardware or reduce the number of tasks you are running simultaneously. - -3. Check for software and hardware compatibility - Some BOINC tasks may have specific hardware or software requirements, such as GPU support or compatibility with certain operating systems. Check the BOINC project documentation for any specific requirements you may be missing. - -4. Update the BOINC client software - Make sure your BOINC client software is up-to-date, as outdated versions can cause errors or unexpected behavior. You can check for updates and download the latest version from the [official BOINC website](https://boinc.berkeley.edu/download.php). - -5. Restart the BOINC client - If the issue persists, try restarting the BOINC client following the steps provided in the alert: - - - Abort the running task - - Restart the BOINC client: - ``` - root@netdata # /etc/init.d/boinc-client restart - ``` - -6. Seek assistance from the BOINC community - If you continue to experience issues after following these troubleshooting steps, consider seeking assistance from the BOINC community through forums or mailing lists. - -### Useful resources - -1. [BOINC hardware and software requirements](https://boinc.berkeley.edu/wiki/System_requirements) diff --git a/health/guides/boinc/boinc_total_tasks.md b/health/guides/boinc/boinc_total_tasks.md deleted file mode 100644 index c14e15f8..00000000 --- a/health/guides/boinc/boinc_total_tasks.md +++ /dev/null @@ -1,32 +0,0 @@ -### Understand the alert - -This alert monitors the average number of total tasks for the BOINC system over the last 10 minutes. If you receive this alert, it means that there is a deviation in the number of total tasks for your BOINC system, which may indicate an issue with the projects, the client, or even the tasks themselves. - -### Troubleshoot the alert - -#### Verify the project status - -1. Verify that the projects you contribute to are not suspended. You can check if the project has queued tasks to be done on the [BOINC projects page](https://boinc.berkeley.edu/projects.php). - -2. Access your BOINC Manager, go to the _Projects_ tab, and check if the projects you contribute to are in the correct state (Active or Running). If a project is suspended, you can select it and click _Resume_ to reactivate it. - -#### Investigate task issues - -1. Access your BOINC Manager and go to the _Tasks_ tab to check the status of the current tasks. Look for any _Failed_, _Error_, or _Postponed_ tasks. - -2. If there are failed tasks, try to reset them by selecting the task, right-clicking on it, and choosing _Update_ or _Reset_. Be aware that resetting a task will discard any progress made on it. - -#### Restart the BOINC client - -1. For most Linux distributions: - - ``` - sudo /etc/init.d/boinc-client restart - ``` - -2. For other operating systems or custom installations, refer to the BOINC's documentation for restarting the client: https://boinc.berkeley.edu/wiki/Stop_or_restart_BOINC - -#### Check system resources - -BOINC tasks may fail or slow down if there is not enough system resources (CPU, RAM, or Disk Space) available. Monitor your system performance using tools like `top`, `free`, and `df`, and make adjustments if necessary to ensure that BOINC has enough resources to complete tasks. - diff --git a/health/guides/boinc/boinc_upload_errors.md b/health/guides/boinc/boinc_upload_errors.md deleted file mode 100644 index 80c0ad36..00000000 --- a/health/guides/boinc/boinc_upload_errors.md +++ /dev/null @@ -1,30 +0,0 @@ -### Understand the alert - -This alert indicates that your BOINC node is experiencing an increase in the average number of failed uploads over the last 10 minutes. Failed uploads can affect the overall efficiency of your BOINC setup and may result in lost work and wasted computational resources. - -### Troubleshoot the alert - -1. Check for a new BOINC client's version - - Verify if there's a new version of the BOINC client available for your system on the [BOINC client downloads page](https://boinc.berkeley.edu/download_all.php). If there's a new version available, download and install the _recommended_ version. - -2. Verify BOINC project configuration - - Ensure that your BOINC client is properly configured to work on the projects you're participating in. Double-check your account login credentials, project URLs, and other settings in the BOINC client. Refer to the [BOINC User Manual](https://boinc.berkeley.edu/wiki/User_manual) for more information on configuring your BOINC client. - -3. Check network connectivity - - Verify that your system has a stable network connection and there are no firewall or proxy issues that might be blocking your BOINC client from uploading files. If necessary, adjust your firewall settings or connect to a different network. - -4. Inspect BOINC client logs - - Consult the BOINC client logs to gain insight into the upload errors. The logs can be found in the client's data directory. Refer to the [BOINC log file documentation](https://boinc.berkeley.edu/wiki/Log_Files) for more information on how to read and analyze the logs. - -5. Contact project support - - If you're still experiencing upload issues after following the steps above, consider reaching out to the support forums or mailing lists of the relevant BOINC project. The project's support team might be able to offer assistance or guidance in resolving your issue. - -### Useful resources - -1. [BOINC User Manual](https://boinc.berkeley.edu/wiki/User_manual) -2. [BOINC Downloads](https://boinc.berkeley.edu/download_all.php) diff --git a/health/guides/btrfs/btrfs_allocated.md b/health/guides/btrfs/btrfs_allocated.md deleted file mode 100644 index 690d45d0..00000000 --- a/health/guides/btrfs/btrfs_allocated.md +++ /dev/null @@ -1,75 +0,0 @@ -### Understand the alert - -Btrfs is a modern copy on write (CoW) filesystem for Linux aimed at implementing advanced features while also focusing on fault tolerance, repair and easy administration. Btrfs is intended to address the lack of pooling, snapshots, checksums, and integral multi-device spanning in Linux file systems. - -Unlike most filesystems, Btrfs allocates disk space in two distinct stages. The first stage allocates chunks of physical disk space for usage by a particular type of filesystem blocks, either data blocks (which store actual file data), metadata blocks (which store inodes and other file metadata), and system blocks (which store metadata about the filesystem itself). The second stage then allocates actual blocks within those chunks for usage by the filesystem. This metric tracks space usage in the first allocation stage. - -The Netdata Agent monitors the percentage of allocated Btrfs physical disk space. - -### Troubleshoot the alert - -- Add more physical space - -Adding a new disk always depends on your infrastructure, disk RAID configuration, encryption, etc. An easy way to add a new disk to a filesystem is: - -1. Determine which disk you want to add and in which path - ``` - btrfs device add -f /dev/<new_disk> <path> - ``` - -2. If you get an error that the drive is already mounted, you might have to unmount - ``` - btrfs device add -f /dev/<new_disk> <path> - ``` -3. See the newly added disk - ``` - btrfs filesystem show - ``` -4. Balance the system to make use of the new drive. - ``` - btrfs filesystem balance <path> - ``` - -- Delete snapshots - -You can identify and delete snapshots that you no longer need. - -1. Find the snapshots for a specific path. - ``` - sudo btrfs subvolume list -s <path> - ``` - -2. Delete a snapshot that you do not need any more. - ``` - btrfs subvolume delete <path>/@some_dir-snapshot-test - ``` - -- Enable a compression mechanism - -1. Apply compression to existing files. This command will re-compress the `mount/point` path, with the `zstd` compression algorithm. - - ``` - btrfs filesystem defragment -r -v -czstd /mount/point - ``` - -- Enable a deduplication mechanism - -Using copy-on-write, Btrfs is able to copy files or whole subvolumes without actually copying the data. However, when a file is altered, a new proper copy is created. Deduplication takes this a step further, by actively identifying blocks of data which share common sequences and combining them into an extent with the same copy-on-write semantics. - -Tools dedicated to deduplicate a Btrfs formatted partition include duperemove, bees, and dduper. These projects are 3rd party, and it is strongly suggested that you check their status before you decide to use them. - -- Perform a balance - -Especially in a Btrfs with multiple disks, there might be unevenly allocated data/metadata into the disks. -``` -btrfs balance start -musage=10 -dusage=10 -susage=5 /mount/point -``` -This command will attempt to relocate data/metdata/system-data in empty or near-empty chunks (at most X% used, in this example), allowing the space to be reclaimed and reassigned between data and metadata. If the balance command ends with "Done, had to relocate 0 out of XX chunks", then you need to increase the "dusage/musage" percentage parameter until at least some chunks are relocated. - -### Useful resources - -1. [The Btrfs filesystem on Arch linux website](https://wiki.archlinux.org/title/btrfs) -2. [The Btrfs filesystem on kernel.org website](https://btrfs.wiki.kernel.org) -3. [duperemove](https://github.com/markfasheh/duperemove) -4. [bees](https://github.com/Zygo/bees) -5. [dduper](https://github.com/lakshmipathi/dduper) diff --git a/health/guides/btrfs/btrfs_data.md b/health/guides/btrfs/btrfs_data.md deleted file mode 100644 index 7782b2d8..00000000 --- a/health/guides/btrfs/btrfs_data.md +++ /dev/null @@ -1,30 +0,0 @@ -### Understand the alert - -This alert is triggered when the percentage of used Btrfs data space exceeds the configured threshold. Btrfs (B-tree file system) is a modern copy-on-write (CoW) filesystem for Linux which focuses on fault tolerance, repair, and easy administration. This filesystem also provides advanced features like snapshots, checksums, and multi-device spanning. - -### What does high Btrfs data usage mean? - -High Btrfs data usage indicates that a significant amount of the allocated space for data blocks in the filesystem is being used. This could be a result of many factors, such as large files, numerous smaller files, or multiple snapshots. - -### Troubleshoot the alert - -Before you attempt any troubleshooting, make sure you have backed up your data to prevent potential data loss or corruption. - -1. **Add more physical space**: You can add a new disk to the filesystem, depending on your infrastructure and disk RAID configuration. Remember to unmount the drive if it's already mounted, then use the `btrfs device add` command to add the new disk and balance the system. - -2. **Delete snapshots**: Review the snapshots in your Btrfs filesystem and delete any unnecessary snapshots. Use the `btrfs subvolume list` command to find snapshots and `btrfs subvolume delete` to remove them. - -3. **Enable compression**: By enabling compression, you can save disk space without deleting files or snapshots. Add the `compress=alg` mount option in your `fstab` configuration file or during the mount procedure, where `alg` is the compression algorithm you want to use (e.g., `zlib`, `lzo`, `zstd`). You can apply compression to existing files using the `btrfs filesystem defragment` command. - -4. **Enable deduplication**: Implement deduplication to identify and merge blocks of data with common sequences using copy-on-write semantics. You can use third-party tools dedicated to Btrfs deduplication, such as duperemove, bees, and dduper. However, research their stability and reliability before employing them. - -5. **Perform a balance**: If the data and metadata are unevenly allocated among disks, especially in Btrfs filesystems with multiple disks, you can perform a balance operation to reallocate space between data and metadata. Use the `btrfs balance` command with appropriate usage parameters to start the balance process. - -### Useful resources - -1. [Btrfs Wiki](https://btrfs.wiki.kernel.org) -2. [The Btrfs filesystem on the Arch Linux website](https://wiki.archlinux.org/title/btrfs) -3. [Ubuntu man pages for Btrfs commands](https://manpages.ubuntu.com/manpages/bionic/man8) -4. [duperemove](https://github.com/markfasheh/duperemove) -5. [bees](https://github.com/Zygo/bees) -6. [dduper](https://github.com/lakshmipathi/dduper)
\ No newline at end of file diff --git a/health/guides/btrfs/btrfs_device_corruption_errors.md b/health/guides/btrfs/btrfs_device_corruption_errors.md deleted file mode 100644 index 98fd4b44..00000000 --- a/health/guides/btrfs/btrfs_device_corruption_errors.md +++ /dev/null @@ -1,57 +0,0 @@ -### Understand the alert - -This alert monitors the `corruption_errs` metric in the `btrfs.device_errors` chart. If you receive this alert, it means that your system's BTRFS file system has encountered one or more corruption errors in the past 10 minutes. These errors indicate data inconsistencies on the file system that could lead to data loss or other issues. - -### What are BTRFS corruption errors? - -BTRFS (B-Tree File System) is a modern, fault-tolerant, and highly scalable file system used in several Linux distributions. Corruption errors in a BTRFS file system refer to inconsistencies in the data structures that the file system relies on to store and manage data. Such inconsistencies can stem from software bugs, hardware failures, or other causes. - -### Troubleshoot the alert - -1. Check for system messages: - - Review your system's kernel message log (`dmesg` output) for any BTRFS-related errors or warnings. These messages can provide insights into the cause of the corruption and help you diagnose the issue. - - ``` - dmesg | grep -i btrfs - ``` - -2. Run a file system check: - - Use the `btrfs scrub` command to scan the file system for inconsistencies and attempt to automatically repair them. Note that this command may take a long time to complete, depending on the size of your BTRFS file system. - - ``` - sudo btrfs scrub start /path/to/btrfs/mountpoint - ``` - - After the scrub finishes, check the status with: - - ``` - sudo btrfs scrub status /path/to/btrfs/mountpoint - ``` - -3. Assess your storage hardware - - In some cases, BTRFS corruption errors may be caused by failing storage devices, such as a disk drive nearing the end of its lifetime. Check the S.M.A.R.T. status of your disks using the `smartctl` tool to identify potential hardware issues. - - ``` - sudo smartctl -a /dev/sdX - ``` - - Replace `/dev/sdX` with the actual device path of your disk. - -4. Update your system - - Ensuring that your system has the latest kernel, BTRFS tools package, and other relevant updates can help prevent software-related corruption errors. - - For example, on Ubuntu or Debian-based systems, you can update with: - - ``` - sudo apt-get update - sudo apt-get upgrade - ``` - -5. Backup essential data - - As file system corruption might result in data loss, ensure that you have proper backups of any critical data stored on your BTRFS file system. Regularly back up your data to an external or secondary storage device. - diff --git a/health/guides/btrfs/btrfs_device_flush_errors.md b/health/guides/btrfs/btrfs_device_flush_errors.md deleted file mode 100644 index c9bb1b11..00000000 --- a/health/guides/btrfs/btrfs_device_flush_errors.md +++ /dev/null @@ -1,54 +0,0 @@ -### Understand the alert - -This alert indicates that `BTRFS` flush errors have been detected on your file system. If you receive this alert, it means that your system has encountered problems while flushing data from memory to disk, which may result in data corruption or data loss. - -### What is BTRFS? - -`BTRFS` (B-Tree File System) is a modern, copy-on-write (CoW) file system for Linux designed to address various weaknesses in traditional file systems. It provides advanced features like data pooling, snapshots, and checksums that enhance fault tolerance. - -### Troubleshoot the alert - -1. Verify the alert - -Check the `Netdata` dashboard or query the monitoring API to confirm that the alert is genuine and not a false positive. - -2. Review and analyze syslog - -Check your system's `/var/log/syslog` or `/var/log/messages`, looking for `BTRFS`-related errors. These messages will provide essential information about the cause of the flush errors. - -3. Confirm BTRFS status - -Run the following command to display the state of the BTRFS file system and ensure it is mounted and healthy: - -``` -sudo btrfs filesystem show -``` - -4. Check disk space - -Ensure your system has sufficient disk space allocated to the BTRFS file system. A full or nearly full disk might cause flush errors. You can use the `df -h` command to examine the available disk space. - -5. Check system I/O usage - -Use the `iotop` command to inspect disk I/O usage for any abnormally high activity, which could be related to the flush errors. - -``` -sudo iotop -``` - -6. Upgrade or rollback BTRFS version - -Verify that you are using a stable version of the BTRFS utilities and kernel module. If not, consider upgrading or rolling back to a more stable version. - -7. Inspect hardware health - -Inspect your disks and RAM for possible hardware problems, as these can cause flush errors. SMART data can help assess disk health (`smartctl -a /dev/sdX`), and `memtest86+` can be used to scrutinize RAM. - -8. Create backups - -Take backups of your critical BTRFS data immediately to avoid potential data loss due to flush errors. - -### Useful resources - -1. [BTRFS official website](https://btrfs.wiki.kernel.org/index.php/Main_Page) -2. [BTRFS utilities on GitHub](https://github.com/kdave/btrfs-progs) diff --git a/health/guides/btrfs/btrfs_device_generation_errors.md b/health/guides/btrfs/btrfs_device_generation_errors.md deleted file mode 100644 index b357b83e..00000000 --- a/health/guides/btrfs/btrfs_device_generation_errors.md +++ /dev/null @@ -1,52 +0,0 @@ -### Understand the alert - -This alert is about `BTRFS generation errors`. When you receive this alert, it means that your BTRFS file system has encountered errors during its operation. - -### What are BTRFS generation errors? - -BTRFS is a modern copy-on-write (CoW) filesystem, which is developed to address various weaknesses in traditional Linux file systems. It features snapshotting, checksumming, and performs background scrubbing to find and repair errors. - -A `BTRFS generation error` occurs when the file system encounters issues while updating the data and metadata associated with a snapshot or subvolume. This could be due to software bugs, hardware issues, or data corruption. - -### Troubleshoot the alert - -1. Verify the issue: Check your system logs for any BTRFS-related errors to further understand the problem. This can be done using the `dmesg` command: - - ``` - sudo dmesg | grep BTRFS - ``` - -2. Check the BTRFS filesystem status: Use the `btrfs filesystem` command to get information about your BTRFS filesystem, including the UUID, total size, used size, and device information: - - ``` - sudo btrfs filesystem show - ``` - -3. Perform a BTRFS scrub: Scrubbing is a process that scans the entire filesystem, verifies the data and metadata, and attempts to repair any detected errors. Run the following command to start a scrub operation: - - ``` - sudo btrfs scrub start -Bd /path/to/btrfs/mountpoint - ``` - - The `-B` flag will run the scrub in the background, and the `-d` flag will provide detailed information about the operation. - -4. Monitor scrub progress: You can monitor the scrub progress using the `btrfs scrub status` command: - - ``` - sudo btrfs scrub status /path/to/btrfs/mountpoint - ``` - -5. Analyze scrub results: The scrub operation will provide information about the total data scrubbed, the number of errors found, and the number of errors fixed. This information can help you determine the extent of the issue and any further action required. - -6. Address BTRFS issues: Depending on the nature of the errors, you may need to take further action, such as updating the BTRFS tools, updating your Linux kernel, or even replacing faulty hardware to resolve the errors. - -7. Set up a regular scrub schedule: You can schedule regular scrubs to keep your BTRFS filesystem healthy. This can be done using `cron`. For example, you can add the following line to `/etc/crontab` to run a scrub on the 1st of each month: - - ``` - 0 0 1 * * root btrfs scrub start -B /path/to/btrfs/mountpoint - ``` - -### Useful resources - -1. [BTRFS Wiki Homepage](https://btrfs.wiki.kernel.org/index.php/Main_Page) -2. [Btrfs Documentation](https://www.kernel.org/doc/Documentation/filesystems/btrfs.txt) diff --git a/health/guides/btrfs/btrfs_device_read_errors.md b/health/guides/btrfs/btrfs_device_read_errors.md deleted file mode 100644 index 684cd0be..00000000 --- a/health/guides/btrfs/btrfs_device_read_errors.md +++ /dev/null @@ -1,50 +0,0 @@ -### Understand the alert - -This alert monitors the number of BTRFS read errors on a device. If you receive this alert, it means that your system has encountered at least one BTRFS read error in the last 10 minutes. - -### What are BTRFS read errors? - -BTRFS (B-Tree File System) is a modern file system designed for Linux. BTRFS read errors are instances where the file system fails to read data from a device. This can occur due to various reasons like hardware failure, file system corruption, or disk problems. - -### Troubleshoot the alert - -1. Check system logs for BTRFS errors - - Review the output from the following command to identify any BTRFS errors: - ``` - sudo journalctl -k | grep -i BTRFS - ``` - -2. Identify the affected BTRFS device and partition - - List all BTRFS devices with their respective information by running the following command: - ``` - sudo btrfs filesystem show - ``` - -3. Perform a BTRFS filesystem check - - To check the integrity of the BTRFS file system, run the following command, replacing `<device>` with the affected device path: - ``` - sudo btrfs check --readonly <device> - ``` - Note: Be careful when using the `--repair` option, as it may cause data loss. It is recommended to take a backup before attempting a repair. - -4. Verify the disk health - - Check the disk health using SMART tools to determine if there are any hardware issues. This can be done by first installing `smartmontools` if not already installed: - ``` - sudo apt install smartmontools - ``` - Then running a disk health check on the affected device: - ``` - sudo smartctl -a <device> - ``` - -5. Analyze the read error patterns - - If the read errors are happening consistently or increasing, consider replacing the affected device with a new one or adding redundancy to the system by using RAID or BTRFS built-in features. - -### Useful resources - -1. [smartmontools documentation](https://www.smartmontools.org/) diff --git a/health/guides/btrfs/btrfs_device_write_errors.md b/health/guides/btrfs/btrfs_device_write_errors.md deleted file mode 100644 index cdf22172..00000000 --- a/health/guides/btrfs/btrfs_device_write_errors.md +++ /dev/null @@ -1,42 +0,0 @@ -### Understand the alert - -This alert is triggered when BTRFS (B-tree file system) encounters write errors on your system. BTRFS is a modern copy-on-write (COW) filesystem designed to address various weaknesses in traditional Linux file systems. If you receive this alert, it means that there have been issues with writing data to the file system. - -### What are BTRFS write errors? - -BTRFS write errors can occur when there are problems with the underlying storage devices, such as bad disks or data corruption. These errors may result in data loss or the inability to write new data to the file system. It is important to address these errors to prevent potential data loss and maintain the integrity of your file system. - -### Troubleshoot the alert - -- Check the BTRFS system status - -Execute the following command to get the current status of your BTRFS system: -``` -sudo btrfs device stats [Mount point] -``` -Replace `[Mount point]` with the actual mount point of your BTRFS file system. - -- Examine system logs for potential issues - -Check the system logs for any signs of issues with the BTRFS file system or underlying storage devices: -``` -sudo journalctl -u btrfs -``` - -- Check the health of the storage devices - -Use the `smartctl` tool to assess the health of your storage devices. For example, to check the device `/dev/sda`, use the following command: -``` -sudo smartctl -a /dev/sda -``` - -- Repair the BTRFS file system - -If there are issues with the file system, run the following command to repair it: -``` -sudo btrfs check --repair [Mount point] -``` -Replace `[Mount point]` with the actual mount point of your BTRFS file system. - -**WARNING:** The `--repair` option should be used with caution, as it may result in data loss under certain circumstances. It is recommended to back up your data before attempting to repair the file system. - diff --git a/health/guides/btrfs/btrfs_metadata.md b/health/guides/btrfs/btrfs_metadata.md deleted file mode 100644 index 6c44ee09..00000000 --- a/health/guides/btrfs/btrfs_metadata.md +++ /dev/null @@ -1,70 +0,0 @@ -### Understand the alert - -The `btrfs_metadata` alert calculates the percentage of used Btrfs metadata space for a Btrfs filesystem. If you receive this alert, it indicates that your Btrfs filesystem's metadata space is being utilized at a high rate. - -### Troubleshoot the alert - -**Warning: Data is valuable. Before performing any actions, make sure to take necessary backup steps. Netdata is not responsible for any loss or corruption of data, database, or software.** - -1. **Add more physical space** - - - Determine which disk you want to add and in which path: - ``` - root@netdata~ # btrfs device add -f /dev/<new_disk> <path> - ``` - - - If you get an error that the drive is already mounted, you might have to unmount: - ``` - root@netdata~ # btrfs device add -f /dev/<new_disk> <path> - ``` - - - Check the newly added disk: - ``` - root@netdata~ # btrfs filesystem show - ``` - - - Balance the system to make use of the new drive: - ``` - root@netdata~ # btrfs filesystem balance <path> - ``` - -2. **Delete snapshots** - - - List the snapshots for a specific path: - ``` - root@netdata~ # sudo btrfs subvolume list -s <path> - ``` - - - Delete an unnecessary snapshot: - ``` - root@netdata~ # btrfs subvolume delete <path>/@some_dir-snapshot-test - ``` - -3. **Enable a compression mechanism** - - Apply compression to existing files by modifying the `fstab` configuration file (or during the `mount` procedure) with the `compress=alg` option. Replace `alg` with `zlib`, `lzo`, `zstd`, or `no` (for no compression). For example, to re-compress the `/mount/point` path with `zstd` compression: - - ``` - root@netdata # btrfs filesystem defragment -r -v -czstd /mount/point - ``` - -4. **Enable a deduplication mechanism** - - Deduplication tools like duperemove, bees, and dduper can help identify blocks of data sharing common sequences and combine extents via copy-on-write semantics. Ensure you check the status of these 3rd party tools before using them. - - - [duperemove](https://github.com/markfasheh/duperemove) - - [bees](https://github.com/Zygo/bees) - - [dduper](https://github.com/lakshmipathi/dduper) - -5. **Perform a balance** - - Balance data/metadata/system-data in empty or near-empty chunks for Btrfs filesystems with multiple disks, allowing space to be reassigned: - - ``` - root@netdata # btrfs balance start -musage=50 -dusage=10 -susage=5 /mount/point - ``` - -### Useful resources - -1. [The Btrfs filesystem on Arch Linux website](https://wiki.archlinux.org/title/btrfs) -2. [The Btrfs filesystem on kernel.org website](https://btrfs.wiki.kernel.org)
\ No newline at end of file diff --git a/health/guides/btrfs/btrfs_system.md b/health/guides/btrfs/btrfs_system.md deleted file mode 100644 index 82d321ed..00000000 --- a/health/guides/btrfs/btrfs_system.md +++ /dev/null @@ -1,75 +0,0 @@ -### Understand the alert - -The `btrfs_system` alert monitors the percentage of used Btrfs system space. If you receive this alert, it means that your Btrfs system space usage has reached a critical level and could potentially cause issues on your system. - -### Troubleshoot the alert - -**Important**: Data is priceless. Before you perform any action, make sure that you have taken any necessary backup steps. Netdata is not liable for any loss or corruption of any data, database, or software. - -1. Add more physical space - - Adding a new disk always depends on your infrastructure, disk RAID configuration, encryption, etc. To add a new disk to a filesystem: - - - Determine which disk you want to add and in which path: - ``` - root@netdata~ # btrfs device add -f /dev/<new_disk> <path> - ``` - - If you get an error that the drive is already mounted, you might have to unmount: - ``` - root@netdata~ # btrfs device add -f /dev/<new_disk> <path> - ``` - - See the newly added disk: - ``` - root@netdata~ # btrfs filesystem show - Label: none uuid: d6b9d7bc-5978-2677-ac2e-0e68204b2c7b - Total devices 2 FS bytes used 192.00KiB - devid 1 size 10.01GiB used 536.00MiB path /dev/sda1 - devid 2 size 10.01GiB used 0.00B path /dev/sdb - ``` - - Balance the system to make use of the new drive: - ``` - root@netdata~ # btrfs filesystem balance <path> - ``` - -2. Delete snapshots - - You can identify and delete snapshots that you no longer need. - - - Find the snapshots for a specific path: - ``` - root@netdata~ # sudo btrfs subvolume list -s <path> - ``` - - Delete a snapshot that you do not need any more: - ``` - root@netdata~ # btrfs subvolume delete <path>/@some_dir-snapshot-test - ``` - -3. Enable a compression mechanism - - - Apply compression to existing files. This command will re-compress the `mount/point` path, with the `zstd` compression algorithm: - ``` - root@netdata # btrfs filesystem defragment -r -v -czstd /mount/point - ``` - -4. Enable a deduplication mechanism - - Tools dedicated to deduplicate a Btrfs formatted partition include duperemove, bees, and dduper. These projects are 3rd party, and it is strongly suggested that you check their status before you decide to use them. - - - [duperemove](https://github.com/markfasheh/duperemove) - - [bees](https://github.com/Zygo/bees) - - [dduper](https://github.com/lakshmipathi/dduper) - -5. Perform a balance - - Especially in a Btrfs with multiple disks, data/metadata might be unevenly allocated into the disks. - - ``` - root@netdata # btrfs balance start -musage=10 -dusage=10 -susage=50 /mount/point - ``` - - > This command will attempt to relocate data/metdata/system-data in empty or near-empty chunks (at most X% used, in this example), allowing the space to be reclaimed and reassigned between data and metadata. If the balance command ends with "Done, had to relocate 0 out of XX chunks", then you need to increase the "dusage/musage" percentage parameter until at least some chunks are relocated. - -### Useful resources - -1. [The Btrfs filesystem on Arch Linux website](https://wiki.archlinux.org/title/btrfs) -2. [The Btrfs filesystem on kernel.org website](https://btrfs.wiki.kernel.org)
\ No newline at end of file diff --git a/health/guides/ceph/ceph_cluster_space_usage.md b/health/guides/ceph/ceph_cluster_space_usage.md deleted file mode 100644 index 8dbe2e87..00000000 --- a/health/guides/ceph/ceph_cluster_space_usage.md +++ /dev/null @@ -1,53 +0,0 @@ -### Understand the alert - -The `ceph_cluster_space_usage` alert is triggered when the percentage of used disk space in your Ceph cluster reaches a high level. Ceph is a distributed storage system designed to provide excellent performance, reliability, and scalability. If the usage surpasses certain thresholds (warning: 85-90%, critical: 90-98%), this indicates high disk space utilization, which may affect the performance and reliability of your Ceph cluster. - -### Troubleshoot the alert - -Perform the following actions: - -1. Check the Ceph cluster status - - Run the following command to see the overall health of the Ceph cluster: - - ``` - ceph status - ``` - - Pay attention to the `HEALTH` status and the `cluster` section, which provides information about the used and total disk space. - -2. Review the storage utilization for each pool - - Run the following command to review the storage usage for each pool in the Ceph cluster: - - ``` - ceph df - ``` - - Identify the pools with high utilization and consider moving or removing data from these pools. - -3. Investigate high storage usage clients or applications - - Check the clients or applications that interact with the Ceph cluster and the associated file systems. You can use monitoring tools, disk usage analysis programs, or log analysis tools to identify any unusual patterns, such as excessive file creation, large file uploads, or high I/O operations. - -4. Add more storage or nodes to the cluster - - If the cluster is reaching its full capacity due to normal usage, consider adding more storage or nodes to the Ceph cluster. This can help prevent the cluster from becoming overloaded and maintain its performance and reliability. - - You can use the following commands to add more storage or nodes to the Ceph cluster: - - ``` - ceph osd create - ceph osd add - ``` - -5. Optimize data replication and placement - - The high disk usage might be a result of non-optimal data replication and distribution across the cluster. Review the Ceph replication and placement settings, and update the CRUSH map if needed to ensure better distribution of data. - -### Useful resources - -1. [Ceph Storage Cluster](https://docs.ceph.com/en/latest/architecture/#storage-cluster) -2. [Ceph Troubleshooting Guide](https://access.redhat.com/documentation/en-us/red_hat_ceph_storage/4/html/troubleshooting_guide/index) -3. [Managing Ceph Placement Groups](https://docs.ceph.com/en/latest/rados/operations/placement-groups/) -4. [Ceph: Adding and Removing OSDs](https://docs.ceph.com/en/latest/rados/operations/add-or-rm-osds/)
\ No newline at end of file diff --git a/health/guides/cgroups/cgroup_10min_cpu_usage.md b/health/guides/cgroups/cgroup_10min_cpu_usage.md deleted file mode 100644 index 0ba41363..00000000 --- a/health/guides/cgroups/cgroup_10min_cpu_usage.md +++ /dev/null @@ -1,5 +0,0 @@ -### Understand the alert - -The Netdata Agent calculates the average CPU utilization over the last 10 minutes. This alert indicates that your system is in high cgroup CPU utilization. The system will throttle the group CPU usage when the usage is over the limit. To fix this issue, try to increase the cgroup CPU limit. - -This alert is triggered in warning state when the average CPU utilization is between 75-80% and in critical state when it is between 85-95%.
\ No newline at end of file diff --git a/health/guides/cgroups/cgroup_ram_in_use.md b/health/guides/cgroups/cgroup_ram_in_use.md deleted file mode 100644 index 59440e0b..00000000 --- a/health/guides/cgroups/cgroup_ram_in_use.md +++ /dev/null @@ -1,5 +0,0 @@ -### Understand the alert - -The Netdata Agent calculates the percentage of used memory. This alert indicates high cgroup memory utilization. Out Of Memory (OOM) killer will kill some processes when the utilization reaches 100%. To fix this issue, try to increase the cgroup memory limit (if set). - -This alert is triggered in warning state when the percentage of used memory is between 80-90% and in critical state between 90-98%. diff --git a/health/guides/cgroups/k8s_cgroup_10min_cpu_usage.md b/health/guides/cgroups/k8s_cgroup_10min_cpu_usage.md deleted file mode 100644 index 3168e279..00000000 --- a/health/guides/cgroups/k8s_cgroup_10min_cpu_usage.md +++ /dev/null @@ -1,48 +0,0 @@ -### Understand the alert - -This alert calculates the average `cgroup CPU utilization` over the past 10 minutes in a Kubernetes cluster. If you receive this alert at the warning or critical levels, it means that your cgroup is heavily utilizing the available CPU resources. - -### What does cgroup CPU utilization mean? - -In Kubernetes, `cgroups` are a Linux kernel feature that helps to limit and isolate the resource usage (CPU, memory, disk I/O, etc.) of a collection of processes. The `cgroup CPU utilization` measures the percentage of available CPU resources consumed by the processes within a cgroup. - -### Troubleshoot the alert - -- Identify the over-utilizing cgroup - -Check the alert message for the specific cgroup that is causing high CPU utilization. - -- Determine the processes utilizing the most CPU resources in the cgroup - -To find the processes within the cgroup with high CPU usage, you can use `systemd-cgtop` on the Kubernetes nodes: - -``` -systemd-cgtop -m -1 -p -n10 -``` - -- Analyze the Kubernetes resource usage - -Use `kubectl top` to get an overview of the resource usage in your Kubernetes cluster: - -``` -kubectl top nodes -kubectl top pods -``` - -- Investigate the Kubernetes events and logs - -Examine the events and logs of the Kubernetes cluster and the specific resources that are causing the high CPU utilization. - -``` -kubectl get events --sort-by='.metadata.creationTimestamp' -kubectl logs <pod-name> -n <namespace> --timestamps -f -``` - -- Optimize the resource usage of the cluster - -You may need to scale your cluster by adding more resources, adjusting the resource limits, or optimizing the application code to minimize CPU usage. - -### Useful resources - -1. [Overview of a Pod](https://kubernetes.io/docs/concepts/workloads/pods/) -2. [Assign CPU Resources to Containers and Pods](https://kubernetes.io/docs/tasks/configure-pod-container/assign-cpu-resource/) diff --git a/health/guides/cgroups/k8s_cgroup_ram_in_use.md b/health/guides/cgroups/k8s_cgroup_ram_in_use.md deleted file mode 100644 index aec443b7..00000000 --- a/health/guides/cgroups/k8s_cgroup_ram_in_use.md +++ /dev/null @@ -1,42 +0,0 @@ -### Understand the alert - -This alert monitors the `RAM usage` in a Kubernetes cluster by calculating the ratio of the memory used by a cgroup to its memory limit. If the memory usage exceeds certain thresholds, the alert triggers and indicates that the system's memory resources are under pressure. - -### Troubleshoot the alert - -1. Check overall RAM usage in the cluster - - Use the `kubectl top nodes` command to check the overall memory usage on the cluster nodes: - ``` - kubectl top nodes - ``` - -2. Identify Pods with high memory usage - - Use the `kubectl top pods --all-namespaces` command to identify Pods consuming a high amount of memory: - ``` - kubectl top pods --all-namespaces - ``` - -3. Inspect logs for errors or misconfigurations - - Check the logs of Pods consuming high memory for any issues or misconfigurations: - ``` - kubectl logs -n <namespace> <pod_name> - ``` - -4. Inspect container resource limits - - Review the resource limits defined in the Pod's yaml file, particularly the `limits` and `requests` sections. If you're not setting limits on Pods, then consider setting appropriate limits to prevent running out of resources. - -5. Scale or optimize applications - - If high memory usage is expected and justified, consider scaling the application by adding replicas or increasing the allocated resources. - - If the memory usage is not justified, optimizing the application code or configurations may help reduce memory usage. - -### Useful resources - -1. [Kubernetes best practices: Organizing with Namespaces](https://kubernetes.io/docs/concepts/overview/working-with-objects/namespaces/) -2. [Managing Resources for Containers](https://kubernetes.io/docs/concepts/configuration/manage-resources-containers/) -3. [Configure Default Memory Requests and Limits](https://kubernetes.io/docs/tasks/administer-cluster/memory-default-namespace/)
\ No newline at end of file diff --git a/health/guides/cockroachdb/cockroachdb_open_file_descriptors_limit.md b/health/guides/cockroachdb/cockroachdb_open_file_descriptors_limit.md deleted file mode 100644 index ad2fa4ac..00000000 --- a/health/guides/cockroachdb/cockroachdb_open_file_descriptors_limit.md +++ /dev/null @@ -1,57 +0,0 @@ -### Understand the alert - -This alert indicates that the usage of file descriptors in your CockroachDB is reaching a high percentage against the soft-limit. High file descriptor utilization can cause issues, such as failures to open new files or establish network connections. - -### Troubleshoot the alert - -1. Check the current file descriptor limit and usage for CockroachDB: - - Use the `lsof` command to display information about all open file descriptors associated with the process running CockroachDB: - - ``` - lsof -p <PID> - ``` - - Replace `<PID>` with the process ID of CockroachDB. - - To display only the total number of open file descriptors, you can use this command: - - ``` - lsof -p <PID> | wc -l - ``` - -2. Monitor file descriptor usage: - - Regularly monitoring file descriptor usage can help you identify patterns and trends, making it easier to determine if adjustments are needed. You can use tools like `lsof` or `sar` to monitor file descriptor usage on your system. - -3. Adjust the file descriptors limit for the process: - - You can raise the soft-limit for the CockroachDB process by modifying the `ulimit` configuration: - - ``` - ulimit -n <new_limit> - ``` - - Replace `<new_limit>` with the desired value, which must be less than or equal to the system-wide hard limit. - - Note that changes made using `ulimit` only apply to the current shell session. To make the changes persistent, you should add the `ulimit` command to the CockroachDB service startup script or modify the system-wide limits in `/etc/security/limits.conf`. - -4. Adjust the system-wide file descriptors limit: - - If necessary, you can also adjust the system-wide limits for file descriptors in `/etc/security/limits.conf`. Edit this file as a root user, and add or modify the following lines: - - ``` - * soft nofile <new_soft_limit> - * hard nofile <new_hard_limit> - ``` - - Replace `<new_soft_limit>` and `<new_hard_limit>` with the desired values. You must restart the system or CockroachDB for the changes to take effect. - -5. Optimize CockroachDB configuration: - - Review the CockroachDB configuration and ensure that it's optimized for your workload. If appropriate, adjust settings such as cache size, query optimization, and memory usage to reduce the number of file descriptors needed. - -### Useful resources - -1. [CockroachDB recommended production settings](https://www.cockroachlabs.com/docs/v21.2/recommended-production-settings#file-descriptors-limit) -2. [Increasing file descriptor limits on Linux](https://www.tecmint.com/increase-set-open-file-limits-in-linux/) diff --git a/health/guides/cockroachdb/cockroachdb_unavailable_ranges.md b/health/guides/cockroachdb/cockroachdb_unavailable_ranges.md deleted file mode 100644 index ef495cb7..00000000 --- a/health/guides/cockroachdb/cockroachdb_unavailable_ranges.md +++ /dev/null @@ -1,51 +0,0 @@ -### Understand the alert - -This alert indicates that there are unavailable ranges in your CockroachDB cluster. Unavailable ranges occur when a majority of a range's replicas are on nodes that are unavailable. This can cause the entire range to be unable to process queries. - -### Troubleshoot the alert - -1. Check for dead or unavailable nodes - - Use the `./cockroach node status` command to list the status of all nodes in your cluster. Look for nodes that are marked as dead or unavailable and try to bring them back online. - - ``` - ./cockroach node status --certs-dir=<your_cert_directory> - ``` - -2. Inspect the logs - - CockroachDB logs can provide valuable information about issues that may be affecting your cluster. Check the logs for errors or warnings related to unavailable ranges using `grep`: - - ``` - grep -i 'unavailable range' /path/to/cockroachdb/logs - ``` - -3. Check replication factor - - Make sure your cluster's replication factor is set to an appropriate value. A higher replication factor can help tolerate node failures and prevent unavailable ranges. You can check the replication factor by running the following SQL query: - - ``` - SHOW CLUSTER SETTING kv.range_replicas; - ``` - - To set the replication factor, run the following SQL command: - - ``` - SET CLUSTER SETTING kv.range_replicas=<desired_replication_factor>; - ``` - -4. Investigate and resolve network issues - - Network issues can cause nodes to become unavailable and lead to unavailable ranges. Check the status of your network and any firewalls, load balancers, or other network components that may be affecting connectivity between nodes. - -5. Monitor and manage hardware resources - - Insufficient hardware resources, such as CPU, memory, or disk space, can cause nodes to become unavailable. Monitor your nodes' resource usage and ensure that they have adequate resources to handle the workload. - -6. Consider rebalancing the cluster - - Rebalancing the cluster can help distribute the load more evenly across nodes and reduce the number of unavailable ranges. See the [CockroachDB documentation](https://www.cockroachlabs.com/docs/stable/training/manual-rebalancing.html) for more information on manual rebalancing. - -### Useful resources - -1. [CockroachDB troubleshooting guide](https://www.cockroachlabs.com/docs/stable/cluster-setup-troubleshooting.html#db-console-shows-under-replicated-unavailable-ranges) diff --git a/health/guides/cockroachdb/cockroachdb_underreplicated_ranges.md b/health/guides/cockroachdb/cockroachdb_underreplicated_ranges.md deleted file mode 100644 index e8269599..00000000 --- a/health/guides/cockroachdb/cockroachdb_underreplicated_ranges.md +++ /dev/null @@ -1,41 +0,0 @@ -### Understand the alert - -This alert is related to CockroachDB, a scalable and distributed SQL database. When you receive this alert, it means that there are under-replicated ranges in your database cluster. Under-replicated ranges can impact the availability and fault tolerance of your database, leading to potential data loss or unavailability in case of node failures. - -### What are under-replicated ranges? - -In a CockroachDB cluster, data is split into small chunks called ranges. These ranges are then replicated across multiple nodes to ensure fault tolerance and high availability. The desired replication factor determines the number of replicas for each range. - -When a range has fewer replicas than the desired replication factor, it is considered as "under-replicated". This situation can occur if nodes are unavailable or if the cluster is in the process of recovering from failures. - -### Troubleshoot the alert - -1. Access the CockroachDB Admin UI - - Access the Admin UI by navigating to the URL `http://<any-node-ip>:8080` on any of your cluster nodes. - -2. Check the 'Replication Status' in the dashboard - - In the Admin UI, check the 'Under-replicated Ranges' metric on the main 'Dashboard' or 'Metrics' page. - -3. Inspect the logs of your CockroachDB nodes - - Look for any error messages or issues that could be causing under-replication. For example, you may see errors related to node failures or network issues. - -4. Check cluster health and capacity - - Make sure that all nodes in the cluster are running and healthy. You can do this by running the command `cockroach node status`. Consider adding more nodes or increasing the capacity if your nodes are overworked. - -5. Verify replication factor configuration - - Check your cluster's replication factor configuration to ensure it is set to an appropriate value. The default replication factor is 3, which can tolerate one failure. You can view and change it using the [`zone configurations`](https://www.cockroachlabs.com/docs/stable/configure-replication-zones.html). - -6. Consider decommissioning problematic nodes - - If specific nodes are causing under-replication, consider decommissioning them to allow the cluster to automatically rebalance the ranges. Follow the [decommissioning guide](https://www.cockroachlabs.com/docs/stable/remove-nodes.html) in the CockroachDB documentation. - -### Useful resources - -1. [CockroachDB: Troubleshoot Under-replicated and Unavailable Ranges](https://www.cockroachlabs.com/docs/stable/cluster-setup-troubleshooting.html#db-console-shows-under-replicated-unavailable-ranges) -2. [CockroachDB: Configuring Replication Zones](https://www.cockroachlabs.com/docs/stable/configure-replication-zones.html) -3. [CockroachDB: Decommission a Node](https://www.cockroachlabs.com/docs/stable/remove-nodes.html)
\ No newline at end of file diff --git a/health/guides/cockroachdb/cockroachdb_used_storage_capacity.md b/health/guides/cockroachdb/cockroachdb_used_storage_capacity.md deleted file mode 100644 index ac1bc000..00000000 --- a/health/guides/cockroachdb/cockroachdb_used_storage_capacity.md +++ /dev/null @@ -1,46 +0,0 @@ -### Understand the Alert - -This alert indicates high storage capacity utilization in CockroachDB. - -### Definition of "size" on CockroachDB: - -The maximum size allocated to the node. When this size is reached, CockroachDB attempts to rebalance data to other nodes with available capacity. When there's no capacity elsewhere, this limit will be exceeded. Also, data may be written to the node faster than the cluster can rebalance it away; in this case, as long as capacity is available elsewhere, CockroachDB will gradually rebalance data down to the store limit. - -### Troubleshoot the Alert - -- Increase the space available for CockroachDB data - -If you had previously set a limit, then you can use the option `--store=path<YOUR PATH>,size=<SIZE>` to increase the amount of available space. Make sure to replace the "YOUR PATH" with the actual store path and "SIZE" with the new size you want to set CockroachDB to. - -Note: If you haven't set a limit on the size, then the entire drive's size will be used. In this case, you will see that the drive is full. Clearing some space or upgrading to a drive with a larger capacity are potential solutions. - -- Inspect the disk usage by tables and indexes - -CockroachDB provides the `experimental_disk_usage` builtin SQL function that allows you to check the disk usage by tables and indexes within a given database. This can help you identify the main storage consumers in your cluster. - -To run this command, first connect to your CockroachDB instance with `cockroach sql`, then execute the following query: - -```sql -SELECT * FROM [SHOW experimental_disk_usage('<database_name>')]; -``` - -Make sure to replace `<database_name>` with the actual name of the database you want to inspect. This will return a list of tables and indexes with their respective disk usage. - -- Rebalance the cluster data to other nodes with available capacity - -CockroachDB automatically rebalances data across nodes by default. If the data rebalancing is not happening fast enough, you can try to speed up this process by [adjusting `zone configurations`](https://www.cockroachlabs.com/docs/stable/configure-replication-zones.html) or by [increasing the default rebalancing rate](https://www.cockroachlabs.com/docs/stable/cluster-settings.html#kv_range_replication_rate_bytes_per_second). - -- Purge old, unnecessary data - -Inspect your data and consider purging old or unnecessary data from the database. Be cautious while performing this operation and double-check the data you intend to remove. - -- Archive old data - -If the data cannot be purged, consider archiving it in a more compact format or moving it to a separate database or storage system to reduce the storage usage on the affected CockroachDB node. - - -## Useful resources - -1. [CockroachDB Size](https://www.cockroachlabs.com/docs/v21.2/cockroach-start#store) -2. [CockroachDB Docs](https://www.cockroachlabs.com/docs/stable/ui-storage-dashboard.html) - diff --git a/health/guides/cockroachdb/cockroachdb_used_usable_storage_capacity.md b/health/guides/cockroachdb/cockroachdb_used_usable_storage_capacity.md deleted file mode 100644 index ec00dbb9..00000000 --- a/health/guides/cockroachdb/cockroachdb_used_usable_storage_capacity.md +++ /dev/null @@ -1,63 +0,0 @@ -### Understand the alert - -This alert indicates that the usable storage space allocated for your CockroachDB is being highly utilized. If the percentage of used space exceeds 85%, the alert raises a warning, and if it exceeds 95%, the alert becomes critical. High storage utilization can lead to performance issues and potential data loss if not properly managed. - -### Troubleshoot the alert - -1. Check the current storage utilization - -To understand the current utilization, you can use SQL commands to query the `crdb_internal.kv_store_status` table. - -```sql -SELECT node_id, store_id, capacity, used, available -FROM crdb_internal.kv_store_status; -``` - -This query will provide information about the available and used storage capacity of each node in your CockroachDB cluster. - -2. Identify tables and databases with high storage usage - -Use the following command to list the top databases in terms of storage usage: - -```sql -SELECT database_name, sum(data_size_int) as total_size -FROM crdb_internal.tables -WHERE database_name != 'crdb_internal' -GROUP BY database_name -ORDER BY total_size DESC -LIMIT 10; -``` - -Additionally, you can list the top tables in terms of storage usage: - -```sql -SELECT database_name, table_name, data_size -FROM crdb_internal.tables -WHERE database_name != 'crdb_internal' -ORDER BY data_size_int DESC -LIMIT 10; -``` - -3. Optimize storage usage - -Based on your findings from steps 1 and 2, consider the following actions: - -- Delete unneeded data from tables with high storage usage. -- Apply data compression to reduce the overall storage consumption. -- Archive old data or move it to external storage. - -4. Add more storage to the nodes - -If necessary, increase the storage allocated to your CockroachDB cluster by adding more space to each node. - -- To increase the usable storage capacity, modify the `--store` flag when restarting your CockroachDB nodes. Set the new size by replacing `<YOUR_PATH>` with the actual store path and `<SIZE>` with the desired new size: - - ``` - --store=path=<YOUR_PATH>,size=<SIZE> - ``` - -5. Add more nodes to the cluster - -If increasing the storage capacity of your existing nodes isn't enough, consider adding more nodes to your CockroachDB cluster. By adding more nodes, you can distribute storage more evenly and prevent single points of failure due to storage limitations. - -Refer to the [CockroachDB documentation](https://www.cockroachlabs.com/docs/stable/start-a-node.html) on how to add a new node to a cluster.
\ No newline at end of file diff --git a/health/guides/consul/consul_autopilot_health_status.md b/health/guides/consul/consul_autopilot_health_status.md deleted file mode 100644 index 42ccab5a..00000000 --- a/health/guides/consul/consul_autopilot_health_status.md +++ /dev/null @@ -1,53 +0,0 @@ -### Understand the alert - -This alert checks the health status of the Consul cluster regarding its autopilot functionality. If you receive this alert, it means that the Consul datacenter is experiencing issues, and its health status has been reported as `unhealthy` by the Consul server. - -### What is Consul autopilot? - -Consul's autopilot feature provides automatic management and stabilization features for Consul server clusters, ensuring that the clusters remain in a healthy state. These features include server health monitoring, automatic dead server reaping, and stable server introduction. - -### What does unhealthy mean? - -An unhealthy Consul cluster could experience issues regarding its operations, services, leader elections, and cluster consistency. In this alert scenario, the cluster health functionality is not working correctly, and it could lead to stability and performance problems. - -### Troubleshoot the alert - -Here are some steps to troubleshoot the consul_autopilot_health_status alert: - -1. Check the logs of the Consul server to identify any error messages or warning signs. The logs will often provide insights into the underlying problems. - - ``` - journalctl -u consul - ``` - -2. Inspect the Consul health status using the Consul CLI or API: - - ``` - consul operator autopilot get-config - ``` - - Using the Consul HTTP API: - ``` - curl http://<consul_server>:8500/v1/operator/autopilot/health - ``` - -3. Verify the configuration of Consul servers, check the `retry_join` and addresses of the Consul servers in the configuration file: - - ``` - cat /etc/consul.d/consul.hcl | grep retry_join - ``` - -4. Ensure that there is a sufficient number of Consul servers and that they are healthy. The `consul members` command will show the status of cluster members: - - ``` - consul members - ``` - -5. Check the network connectivity between Consul servers by running network diagnostics like ping and traceroute. - -6. Review Consul documentation to gain a deeper understanding of the autopilot health issues and potential configuration problems. - - -### Useful resources - -- [Consul CLI reference](https://www.consul.io/docs/commands) diff --git a/health/guides/consul/consul_autopilot_server_health_status.md b/health/guides/consul/consul_autopilot_server_health_status.md deleted file mode 100644 index 687c2bb1..00000000 --- a/health/guides/consul/consul_autopilot_server_health_status.md +++ /dev/null @@ -1,48 +0,0 @@ -### Understand the alert - -The `consul_autopilot_server_health_status` alert triggers when a Consul server in your service mesh is marked `unhealthy`. This can affect the overall stability and performance of the service mesh. Regular monitoring and addressing unhealthy servers are crucial in maintaining a smooth functioning environment. - -### What is Consul? - -`Consul` is a service mesh solution that provides a full-featured control plane with service discovery, configuration, and segmentation functionalities. It is used to connect, secure, and configure services across any runtime platform and public or private cloud. - -### Troubleshoot the alert - -Follow the steps below to identify and resolve the issue of an unhealthy Consul server: - -1. Check Consul server logs - - Inspect the logs of the unhealthy server to identify the root cause of the issue. You can find logs typically in `/var/log/consul` or use `journalctl` with Consul: - - ``` - journalctl -u consul - ``` - -2. Verify connectivity - - Ensure that the unhealthy server can communicate with other servers in the datacenter. Check for any misconfigurations or network issues. - -3. Review server resources - - Monitor the resource usage of the unhealthy server (CPU, memory, disk I/O, network). High resource usage can impact the server's health status. Use tools like `top`, `htop`, `iotop`, or `nload` to monitor the resources. - -4. Restart the Consul server - - If the issue persists and you cannot identify the root cause, try restarting the Consul server: - - ``` - sudo systemctl restart consul - ``` - -5. Refer to Consul's documentation - - Consult the official [Consul troubleshooting documentation](https://developer.hashicorp.com/consul/tutorials/datacenter-operations/troubleshooting) for further assistance. - -6. Inspect the Consul UI - - Check the Consul UI for the server health status and any additional information related to the unhealthy server. You can find the Consul UI at `http://<consul-server-ip>:8500/ui/`. - -### Useful resources - -1. [Consul Documentation](https://www.consul.io/docs) -2. [Running Consul as a Systemd Service](https://learn.hashicorp.com/tutorials/consul/deployment-guide#systemd-service) diff --git a/health/guides/consul/consul_client_rpc_requests_exceeded.md b/health/guides/consul/consul_client_rpc_requests_exceeded.md deleted file mode 100644 index eab01e82..00000000 --- a/health/guides/consul/consul_client_rpc_requests_exceeded.md +++ /dev/null @@ -1,38 +0,0 @@ -### Understand the alert - -This alert triggers when the rate of rate-limited RPC (Remote Procedure Call) requests made by a Consul server within the specified datacenter has exceeded a certain threshold. If you receive this alert, it means that your Consul server is experiencing an increased number of rate-limited RPC requests, which may affect its performance and availability. - -### What is Consul? - -Consul is a service mesh solution used for service discovery, configuration, and segmentation. It provides a distributed platform to build robust, scalable, and secured services while simplifying network infrastructure. - -### What are RPC requests? - -Remote Procedure Call (RPC) is a protocol that allows a computer to execute a procedure on another computer across a network. In the context of Consul, RPC requests are used for communication between Consul servers and clients. - -### Troubleshoot the alert - -1. Check the Consul server logs for any relevant error messages or warnings. These logs can provide valuable information on the cause of the increased RPC requests. - - ``` - journalctl -u consul - ``` - -2. Monitor the Consul server's resource usage, such as CPU and memory utilization, to ensure that it is not running out of resources. High resource usage may cause an increase in rate-limited RPC requests. - - ``` - top -o +%CPU - ``` - -3. Analyze the Consul client's usage patterns and identify any misconfigured services or clients contributing to the increased RPC requests. Identify any services that may be sending a high number of requests per second or are not appropriately rate-limited. - -4. Review the Consul rate-limiting configurations to ensure that they are set appropriately based on the expected workload. Adjust the rate limits if necessary to better accommodate the workload. - -5. If the issue persists, consider scaling up the Consul server resources or deploying more Consul servers to handle increased traffic and prevent performance issues. - -### Useful resources - -1. [Consul Official Documentation](https://www.consul.io/docs/) -2. [Consul Rate Limiting Guide](https://developer.hashicorp.com/consul/docs/agent/limits) -3. [Understanding Remote Procedure Calls (RPC)](https://www.smashingmagazine.com/2016/09/understanding-rest-and-rpc-for-http-apis/) -4. [Troubleshooting Consul](https://developer.hashicorp.com/consul/tutorials/datacenter-operations/troubleshooting) diff --git a/health/guides/consul/consul_client_rpc_requests_failed.md b/health/guides/consul/consul_client_rpc_requests_failed.md deleted file mode 100644 index 7d8cb331..00000000 --- a/health/guides/consul/consul_client_rpc_requests_failed.md +++ /dev/null @@ -1,39 +0,0 @@ -### Understand the alert - -This alert is triggered when the number of failed RPC (Remote Procedure Call) requests made by the Consul server in a datacenter surpasses a specific threshold. Consul is a service mesh solution and is responsible for discovering, configuring, and segmenting services in distributed systems. - -### What are RPC requests? - -Remote Procedure Call (RPC) is a protocol that allows one computer to execute remote procedures (subroutines) on another computer. In the context of Consul, clients make RPC requests to servers to obtain information about the service configurations or to execute actions. - -### What does it mean when RPC requests fail? - -When Consul's client RPC requests fail, it means that there is an issue in the communication between the Consul client and the server. It could be due to various reasons like network issues, incorrect configurations, high server load, or even software bugs. - -### Troubleshoot the alert - -1. Verify the connectivity between Consul clients and servers. - - Check the network connections between the Consul client and the server. Ensure that the required ports are open and the network is functioning correctly. You can use tools like `ping`, `traceroute`, and `telnet` to verify connectivity. - -2. Check Consul server logs. - - Analyze the Consul server's logs to look for any error messages or unusual patterns related to RPC requests. Server logs can be found in the default Consul log directory, usually `/var/log/consul`. - -3. Review Consul client and server configurations. - - Ensure that Consul client and server configurations are correct and in accordance with the best practices. You can find more information about Consul's configuration recommendations [here](https://learn.hashicorp.com/tutorials/consul/reference-architecture?in=consul/production-deploy). - -4. Monitor server load and resources. - - High server load or resource constraints can cause RPC request failures. Monitor your Consul servers' CPU, memory, and disk usage. If you find any resource bottlenecks, consider adjusting the server's resource allocation or scaling your Consul servers horizontally. - -5. Update Consul to the latest version. - - Software bugs can lead to RPC request failures. Ensure that your Consul clients and servers are running the latest version of Consul. Check the [Consul releases page](https://github.com/hashicorp/consul/releases) for the latest version. - -### Useful resources - -1. [Consul official documentation](https://www.consul.io/docs) -2. [Consul Reference Architecture](https://learn.hashicorp.com/tutorials/consul/reference-architecture?in=consul/production-deploy) -3. [Troubleshooting Consul guide](https://developer.hashicorp.com/consul/tutorials/datacenter-operations/troubleshooting) diff --git a/health/guides/consul/consul_gc_pause_time.md b/health/guides/consul/consul_gc_pause_time.md deleted file mode 100644 index c4408234..00000000 --- a/health/guides/consul/consul_gc_pause_time.md +++ /dev/null @@ -1,23 +0,0 @@ -### Understand the alert - -This alert calculates the time spent in stop-the-world garbage collection (GC) pauses on a Consul server node within a one-minute interval. Consul is a distributed service mesh software providing service discovery, configuration, and segmentation functionality. If you receive this alert, it means that the Consul server is experiencing an increased amount of time in GC pauses, which may lead to performance degradation of your service mesh. - -### What are garbage collection pauses? - -Garbage collection (GC) in Consul is a mechanism to clean up unused memory resources and improve the overall system performance. During a GC pause, all running processes in Consul server are stopped to allow the garbage collection process to complete. If the duration of GC pauses is too high, it indicates that the Consul server might be under memory pressure, which can affect the overall performance of the system. - -### Troubleshoot the alert - -1. **Check the Consul server logs**: Examine the Consul server's logs for any errors or warnings related to memory pressure, increased heap usage, or GC pauses. You can typically find the logs in `/var/log/consul`. - -2. **Monitor Consul server metrics**: Check the Consul server's memory usage, heap usage and GC pause metrics using or Netdata. This can help you identify the cause of increased GC pause time. - -3. **Optimize Consul server configuration**: Ensure that your Consul server is properly configured based on your system resources and workload. Review and adjust the [Consul server configuration parameters](https://www.consul.io/docs/agent/options) as needed. - -4. **Reduce memory pressure**: If you have identified memory pressure as the root cause, consider adding more memory resources to your Consul server or adjusting the Consul server's memory limits. - -5. **Update Consul server**: Make sure that your Consul server is running the latest version, which can include optimizations and performance improvements. - -### Useful resources - -- [Consul Server Configuration Parameters](https://www.consul.io/docs/agent/options) diff --git a/health/guides/consul/consul_license_expiration_time.md b/health/guides/consul/consul_license_expiration_time.md deleted file mode 100644 index 3f86b084..00000000 --- a/health/guides/consul/consul_license_expiration_time.md +++ /dev/null @@ -1,50 +0,0 @@ -### Understand the alert - -This alert checks the Consul Enterprise license expiration time. It triggers a warning if the license expiration time is less than 14 days, and critical if it's less than 7 days. - -_consul.license_expiration_time_: Monitors the remaining time in seconds until the Consul Enterprise license expires. - -### What is Consul? - -Consul is a service mesh solution that enables organizations to discover services and safely process network traffic across dynamic, distributed environments. - -### Troubleshoot the alert - -1. Check the current license expiration time - - You can check the remaining license expiration time for your Consul Enterprise instance using the Consul API: - - ``` - curl http://localhost:8500/v1/operator/license - ``` - - Look for the `ExpirationTime` field in the returned JSON output. - -2. Renew the license - - If your license is about to expire, you will need to acquire a new license. Contact [HashiCorp Support](https://support.hashicorp.com/) to obtain and renew the license key. - -3. Apply the new license - - You can apply the new license key either by restarting Consul with the new key specified via the `CONSUL_LICENSE` environment variable or the `license_path` configuration option, or by updating the license through the Consul API: - - ``` - curl -X PUT -d @new_license.json http://localhost:8500/v1/operator/license - ``` - - Replace `new_license.json` with the path to a file containing the new license key in JSON format. - -4. Verify the new license expiration time - - After applying the new license, you can check the new license expiration time using the Consul API again: - - ``` - curl http://localhost:8500/v1/operator/license - ``` - - Ensure that the `ExpirationTime` field shows the new expiration time. - -### Useful resources - -1. [Consul License Documentation](https://www.consul.io/docs/enterprise/license) -2. [HashiCorp Support](https://support.hashicorp.com/) diff --git a/health/guides/consul/consul_node_health_check_status.md b/health/guides/consul/consul_node_health_check_status.md deleted file mode 100644 index 44b431ed..00000000 --- a/health/guides/consul/consul_node_health_check_status.md +++ /dev/null @@ -1,34 +0,0 @@ -### Understand the alert - -This alert is triggered when a Consul node health check status indicates a failure. Consul is a service mesh solution for service discovery and configuration. If you receive this alert, it means that the health check for a specific service on a node within the Consul cluster has failed. - -### What does the health check status mean? - -Consul performs health checks to ensure the services registered within the cluster are functioning as expected. The health check status represents the result of these checks, with a non-zero value indicating a failed health check. A failed health check can potentially cause downtime or degraded performance for the affected service. - -### Troubleshoot the alert - -1. Check the alert details: The alert information provided should include the `check_name`, `node_name`, and `datacenter` affected. Note these details as they will be useful in further troubleshooting. - -2. Verify the health check status in Consul: To confirm the health check failure, access the Consul UI or use the Consul command-line tool to query the health status of the affected service and node: - - ``` - consul members - ``` - - ``` - consul monitor - ``` - -3. Investigate the failed service: Once you confirm the health check failure, start investigating the specific service affected. Check logs, resource usage, configuration files, and other relevant information to identify the root cause of the failure. - -4. Fix the issue: Based on your investigation, apply the necessary fixes to the service or its configuration. This may include restarting the service, adjusting resource allocation, or fixing any configuration errors. - -5. Verify service health: After applying the required fixes, verify the health status of the service once again through the Consul UI or command-line tool. If the service health check status has returned to normal (zero value), the issue has been resolved. - -6. Monitor for any recurrence: Keep an eye on the service, node, and overall Consul cluster health to ensure the issue does not reappear and to catch any other potential problems. - -### Useful resources - -1. [Consul documentation](https://www.consul.io/docs/) -2. [Service and Node Health](https://www.consul.io/api-docs/health) diff --git a/health/guides/consul/consul_raft_leader_last_contact_time.md b/health/guides/consul/consul_raft_leader_last_contact_time.md deleted file mode 100644 index baa6ed46..00000000 --- a/health/guides/consul/consul_raft_leader_last_contact_time.md +++ /dev/null @@ -1,40 +0,0 @@ -### Understand the alert - -This alert monitors the time since the Consul Raft leader server was last able to contact its follower nodes. If the time since the last contact exceeds the warning or critical thresholds, the alert will be triggered. High values indicate a potential issue with the Consul Raft leader's connection to its follower nodes. - -### Troubleshoot the alert - -1. Check Consul logs - -Inspect the logs of the Consul leader server and follower nodes for any errors or relevant information. You can find the logs in `/var/log/consul` by default. - -2. Verify Consul agent health - -Ensure that the Consul agents running on the leader and follower nodes are healthy. Use the following command to check the overall health: - - ``` - consul members - ``` - -3. Review networking connectivity - -Check the network connectivity between the leader and follower nodes. Verify the nodes are reachable, and there are no firewalls or security groups blocking the necessary ports. Consul uses these ports by default: - - - Server RPC (8300) - - Serf LAN (8301) - - Serf WAN (8302) - - HTTP API (8500) - - DNS Interface (8600) - -4. Monitor Consul server's resource usage - -Ensure that the Consul server isn't facing any resource constraints, such as high CPU, memory, or disk usage. Use system monitoring tools like `top`, `vmstat`, or `iotop` to observe resource usage and address bottlenecks. - -5. Verify the Consul server configuration - -Examine the Consul server's configuration file (usually located at `/etc/consul/consul.hcl`) and ensure that there are no errors, inconsistencies, or misconfigurations with server addresses, datacenter names, or communication settings. - -### Useful resources - -1. [Consul Docs: Troubleshooting](https://developer.hashicorp.com/consul/tutorials/datacenter-operations/troubleshooting) -2. [Consul Docs: Agent Configuration](https://www.consul.io/docs/agent/options) diff --git a/health/guides/consul/consul_raft_leadership_transitions.md b/health/guides/consul/consul_raft_leadership_transitions.md deleted file mode 100644 index 59eb3e73..00000000 --- a/health/guides/consul/consul_raft_leadership_transitions.md +++ /dev/null @@ -1,54 +0,0 @@ -### Understand the alert - -This alert triggers when there is a `leadership transition` in the `Consul` service mesh. If you receive this alert, it means that server `${label:node_name}` in datacenter `${label:datacenter}` has become the new leader. - -### What does consul_raft_leadership_transitions mean? - -Consul is a service mesh solution that provides service discovery, configuration, and segmentation functionality. It uses the Raft consensus algorithm to maintain a consistent data state across the cluster. A leadership transition occurs when the current leader node loses its leadership status and a different node takes over. - -### What causes leadership transitions? - -Leadership transitions in Consul can be caused by various reasons, such as: - -1. Network communication issues between the nodes. -2. High resource utilization on the leader node, causing it to miss heartbeat messages. -3. Nodes crashing or being intentionally shut down. -4. A forced leadership transition triggered by an operator. - -Frequent leadership transitions may lead to service disruptions, increased latency, and reduced availability. Therefore, it's essential to identify and resolve the root cause promptly. - -### Troubleshoot the alert - -1. Check the Consul logs for indications of network issues or node failures: - - ``` - journalctl -u consul.service - ``` - Alternatively, you can check the Consul log file, which is usually located at `/var/log/consul/consul.log`. - -2. Inspect the health and status of the Consul cluster using the `consul members` command: - - ``` - consul members - ``` - This command lists all cluster members and their roles, including the new leader node. - -3. Determine if there's high resource usage on the affected nodes by monitoring CPU, memory, and disk usage: - - ``` - top - ``` - -4. Examine network connectivity between nodes using tools like `ping`, `traceroute`, or `mtr`. - -5. If the transitions are forced by operators, review the changes made and their impact on the cluster. - -6. Consider increasing the heartbeat timeout configuration to allow the leader more time to respond, especially if high resource usage is causing frequent leadership transitions. - -7. Review Consul's documentation on [consensus and leadership](https://developer.hashicorp.com/consul/docs/architecture/consensus) and [operation and maintenance](https://developer.hashicorp.com/consul/docs/guides) to gain insights into best practices and ways to mitigate leadership transitions. - -### Useful resources - -1. [Consul: Service Mesh Overview](https://www.consul.io/docs/intro) -2. [Consul: Understanding Consensus and Leadership](https://developer.hashicorp.com/consul/docs/architecture/consensus) -3. [Consul: Installation, Configuration, and Maintenance](https://developer.hashicorp.com/consul/docs/guides) diff --git a/health/guides/consul/consul_raft_thread_fsm_saturation.md b/health/guides/consul/consul_raft_thread_fsm_saturation.md deleted file mode 100644 index 12c5f7df..00000000 --- a/health/guides/consul/consul_raft_thread_fsm_saturation.md +++ /dev/null @@ -1,42 +0,0 @@ -### Understand the alert - -This alert monitors the `consul_raft_thread_fsm_saturation` metric, which represents the saturation of the `FSM Raft` goroutine in Consul, a service mesh. If you receive this alert, it indicates that the Raft goroutine on a specific Consul server is becoming saturated. - -### What is Consul? - -Consul is a distributed service mesh that provides a full-featured control plane with service discovery, configuration, and segmentation functionalities. It enables organizations to build and operate large-scale, dynamic, and resilient systems. The Raft FSM goroutine is responsible for executing finite state machine (FSM) operations on the Consul servers. - -### What does FSM Raft goroutine saturation mean? - -Saturation of the FSM Raft goroutine means that it is spending more time executing operations, which may cause delays in Consul's ability to process requests and manage the overall service mesh. High saturation levels can lead to performance issues, increased latency, or even downtime for your Consul deployment. - -### Troubleshoot the alert - -1. Identify the Consul server and datacenter with the high Raft goroutine saturation: - - The alert has labels `label:node_name` and `label:datacenter`, indicating the affected Consul server and its respective datacenter. - -2. Examine Consul server logs: - - Check the logs of the affected Consul server for any error messages or indications of high resource usage. This can provide valuable information on the cause of the saturation. - -3. Monitor Consul cluster performance: - - Use Consul's built-in monitoring tools to keep an eye on your Consul cluster's health and performance. For instance, you may monitor Raft metrics via the Consul `/v1/agent/metrics` API endpoint. - -4. Scale your Consul infrastructure: - - If the increased saturation is due to high demand, scaling your Consul infrastructure by adding more servers or increasing the resources available to existing servers can help mitigate the issue. - -5. Review and optimize Consul configuration: - - Review your Consul configuration and make any necessary optimizations to ensure the best performance. For instance, you could adjust the [Raft read and write timeouts](https://www.consul.io/docs/agent/options). - -6. Investigate and resolve any underlying issues causing the saturation: - - Look for any factors contributing to the increased load on the FSM Raft goroutine and address those issues. This may involve reviewing application workloads, network latency, or hardware limitations. - -### Useful resources - -1. [Consul Telemetry](https://www.consul.io/docs/agent/telemetry) -2. [Consul Configuration - Raft](https://www.consul.io/docs/agent/options#raft) diff --git a/health/guides/consul/consul_raft_thread_main_saturation.md b/health/guides/consul/consul_raft_thread_main_saturation.md deleted file mode 100644 index 7f33627d..00000000 --- a/health/guides/consul/consul_raft_thread_main_saturation.md +++ /dev/null @@ -1,41 +0,0 @@ -### Understand the alert - -This alert triggers when the main Raft goroutine's saturation percentage reaches a certain threshold. If you receive this alert, it means that your Consul server is experiencing high utilization of the main Raft goroutine. - -### What is Consul? - -Consul is a service discovery, configuration, and orchestration solution developed by HashiCorp. It is used in microservice architectures and distributed systems to make services aware and discoverable by other services. Raft is a consensus-based algorithm used for maintaining the state of the Consul servers. - -### What is the main Raft goroutine? - -The main Raft goroutine is responsible for carrying out consensus-related tasks in the Consul server. It ensures the consistency and reliability of the server's state. High saturation of this goroutine can lead to performance issues in the Consul server cluster. - -### Troubleshoot the alert - -1. Verify the current status of the Consul server. - Check the health status and logs of the Consul server using the following command: - ``` - consul monitor - ``` - -2. Monitor Raft metrics. - Use the Consul telemetry feature to collect and analyze Raft performance metrics. Consult the [Consul official documentation](https://www.consul.io/docs/agent/telemetry) on setting up telemetry. - -3. Review the server's resources. - Confirm whether the server hosting the Consul service has enough resources (CPU, memory, and disk space) to handle the current load. Upgrade the server resources or adjust the Consul configurations accordingly. - -4. Inspect the Consul server's log files. - Analyze the log files to identify any errors or issues that could be affecting the performance of the main Raft goroutine. - -5. Monitor network latency between Consul servers. - High network latency can affect the performance of the Raft algorithm. Use monitoring tools like `ping` or `traceroute` to measure the latency between the Consul servers. - -6. Check for disruptions in the Consul cluster. - Investigate possible disruptions caused by external factors, such as server failures, network partitioning or misconfigurations in the cluster. - -### Useful resources - -1. [Consul: Service Mesh for Microservices Networking](https://www.consul.io/) -2. [Consul Documentation](https://www.consul.io/docs) -3. [Consul Telemetry](https://www.consul.io/docs/agent/telemetry) -4. [Understanding Raft Consensus Algorithm](https://raft.github.io/) diff --git a/health/guides/consul/consul_service_health_check_status.md b/health/guides/consul/consul_service_health_check_status.md deleted file mode 100644 index e9da2508..00000000 --- a/health/guides/consul/consul_service_health_check_status.md +++ /dev/null @@ -1,35 +0,0 @@ -### Understand the alert - -This alert is triggered when the `health check status` of a service in a `Consul` service mesh changes to a `warning` or `critical` state. It occurs when a service health check for a specific service `${label:service_name}` fails on a server `${label:node_name}` in a datacenter `${label:datacenter}`. - -### What is Consul? - -`Consul` is a service mesh solution developed by HashiCorp that can be used to connect and secure services across dynamic, distributed infrastructure. It maintains a registry of service instances, performs health checks, and offers a flexible and high-performance service discovery mechanism. - -### What is a service health check? - -A service health check is a way to determine whether a particular service in a distributed system is running correctly, reachable, and responsive. It is an essential component of service discovery and can be used to assess the overall health of a distributed system. - -### Troubleshoot the alert - -1. Check the health status of the service that triggered the alert in the Consul UI. - - Access the Consul UI and navigate to the affected service's details page. Look for the health status information and the specific health check that caused the alert. - -2. Inspect the logs of the service that failed the health check. - - Access the logs of the affected service and look for any error messages or events that might have caused the health check to fail. Depending on the service, this might be application logs, system logs, or container logs (if the service is running in a container). - -3. Identify and fix the issue causing the health check failure. - - Based on the information from the logs and your knowledge of the system, address the issue that's causing the health check to fail. This might involve fixing a bug in the service, resolving a connection issue, or making a configuration change. - -4. Verify that the health check status has returned to a healthy state. - - After addressing the issue, monitor the service in the Consul UI and confirm that its health check status has returned to a healthy state. If the issue persists, continue investigating and resolving any underlying causes until the health check is successful. - -### Useful resources - -1. [Consul Introduction](https://www.consul.io/intro) -2. [Consul Health Check Documentation](https://www.consul.io/docs/discovery/checks) -3. [HashiCorp Learn: Consul Service Monitoring](https://learn.hashicorp.com/tutorials/consul/service-monitoring-and-alerting?in=consul/developer-discovery)
\ No newline at end of file diff --git a/health/guides/cpu/10min_cpu_iowait.md b/health/guides/cpu/10min_cpu_iowait.md deleted file mode 100644 index b05530e8..00000000 --- a/health/guides/cpu/10min_cpu_iowait.md +++ /dev/null @@ -1,36 +0,0 @@ -### Understand the alert - -This alarm calculates the average time of `iowait` through 10 minute interval periods. `iowait` is the percentage of time where there has been at least one I/O request in progress while the CPU has been idle. - -I/O -at a process level- is the use of the read and write services, such as reading data from a physical drive. - -It's important to note that during the time a process waits on I/O, the system can schedule other processes, but `iowait` is measured specifically while the CPU is idle. - -A common example of when this alert might be triggered would be when your CPU requests some data and the device responsible for it can't deliver it fast enough. As a result the CPU (in the next clock interrupt) is idle, so you -encounter `iowait`. If this persists for some time and the average from the metrics we gather exceeds the value that is being checked in the `.conf` file, then the alert is raised because the CPU is being bottlenecked by your system’s disks. - -### Troubleshooting Section - -- Check for main I/O related processes and hardware issues - -Generally, this issue is caused by having slow hard drives that cannot keep up with the speed of your CPU. You can see the percentage of `iowait` by going to your node on Netdata Cloud and clicking the `iowait` dimension under the Total CPU Utilization chart. - -- You can use `vmstat` (or `vmstat 1`, to set a delay between updates in seconds) - -The `procs` column, shows the number of processes blocked waiting for I/O to complete. - -After that, you can use `ps` and specifically `ps -eo s,user,cmd | grep ^[D]` to fetch the processes that their state code starts with `D` which means uninterruptible sleep (usually IO). - -- It could be helpful to close any of the main consumer processes, but Netdata strongly suggests knowing exactly what processes you are closing and being certain that they are not necessary. - -- If you see that you don't have a lot of processes that you can terminate (or you need them for your workflow), then you would have to upgrade your system’s drives; if you have an HDD, upgrading to an SSD or an NVME drive would make a great impact on this metric. - -### Are you operating a database? - -In a database environment, you would want to optimize your operations. Check for potential inserts on large data sets, keeping in mind that `write` operations take more time than `read`. You should also search for - complex requests, like large joins and queries over a big data set. These can introduce `iowait` and need to be optimized. - -### Useful resources - -- [What exactly is "iowait"?](https://serverfault.com/questions/12679/can-anyone-explain-precisely-what-iowait-is) - diff --git a/health/guides/cpu/10min_cpu_usage.md b/health/guides/cpu/10min_cpu_usage.md deleted file mode 100644 index 17e153f6..00000000 --- a/health/guides/cpu/10min_cpu_usage.md +++ /dev/null @@ -1,37 +0,0 @@ -### Understand the alert - -This alarm calculates an average on CPU utilization over a period of 10 minutes, **excluding** `iowait`, `nice` and `steal` values. - -*Note that on FreeBSD, the alert excludes only `nice`. - -`iowait` is the percentage of time the CPU waits on a disk for an I/O; it happens when the former is getting bottlenecked by the latter. At this point the CPU is being idle, waiting only on the I/O. - -`nice` value of a processor is the time it has spent on running low priority processes. Low priority processes are those with a 'nice' value greater than 0 (on UNIX-like systems, a higher ‘nice’ value indicates a lower priority). - -`steal`, in a virtual machine, is the percentage of time that particular virtual CPU has to wait for an available host CPU to run on. If this metric goes up, it means that your VM is not getting the processing power it needs. - -### Troubleshooting Section - -- Processes slowing down your CPU - -There are two primary cases in which this alarm is raised, and determining which applies to you requires understanding your own scenario. - -1. High CPU utilization with high `nice` value means that the system is running through all the low priority processes, and if some high priority process needs CPU time, it can get it at any time. -2. High CPU utilization with low `nice` value means that the CPU is used on high priority processes and new ones will not be able to take CPU time, and they will have to wait. - -The latter scenario is worth investigating if there is a process slowing down your CPU. We suggest you go to your node on Netdata Cloud and click the `nice` dimension under the `Total CPU Utilization` chart to see the value. You can then check per process CPU usage using `top`: - -If you're using Linux: -``` -root@netdata~ # top -o +%CPU -i -``` - -And for FreeBSD: -``` -root@netdata~ # top -o cpu -I -``` - -Here, you can see which processes are the main cpu consumers on the `CPU` column. - -It would be helpful to close any of the main consumer processes, but Netdata strongly suggests knowing exactly what processes you are closing and being certain that they are not necessary. - diff --git a/health/guides/cpu/20min_steal_cpu.md b/health/guides/cpu/20min_steal_cpu.md deleted file mode 100644 index e87c6f05..00000000 --- a/health/guides/cpu/20min_steal_cpu.md +++ /dev/null @@ -1,18 +0,0 @@ -### Understand the alert - -This alarm calculates average CPU `steal` time over the last 20 minutes - -`steal`, in a virtual machine, is the percentage of time that particular virtual CPU has to wait for an available host CPU to run on. If this metric goes up, it means that your VM is not getting the processing power it needs. - -### Troubleshoot the alert - -Check for CPU quota and host issues. - -Generally, if `steal` is high, it could mean one of the following: - -- Another VM on the host system is hogging the CPU. -- System services on the host system are monopolizing the CPU (for example, system updates). -- The host CPUs are over-committed (you have more virtual CPUs assigned to VMs than the host system has physical CPUs) and too many VMs need CPU time simultanously. -- The VM itself has a CPU quota that is too low. - -So in the end you can increase the CPU resources of that particular VM, and if the alert persists, move the guest to a different *physical* server. diff --git a/health/guides/dbengine/10min_dbengine_global_flushing_errors.md b/health/guides/dbengine/10min_dbengine_global_flushing_errors.md deleted file mode 100644 index 4e388eb2..00000000 --- a/health/guides/dbengine/10min_dbengine_global_flushing_errors.md +++ /dev/null @@ -1,13 +0,0 @@ -### Understand the alert - -The Database Engine works like a traditional database. It dedicates a certain amount of RAM to data caching and indexing, while the rest of the data resides compressed on disk. Unlike other memory modes, the amount of historical metrics stored is based on the amount of disk space you allocate and the effective compression ratio, not a fixed number of metrics collected. - -By using both RAM and disk space, the database engine allows for long-term storage of per-second metrics inside of the Netdata Agent itself. - -Netdata monitors the number of pages deleted due to failure to flush data to disk in the last 10 minutes. In this situation some metric data was dropped to unblock data collection. To remedy this issue, reduce disk load or use -faster disks. This alert is triggered in critical state when the number deleted pages is greater than 0. - -### Useful resources - -[Read more about Netdata DB engine](https://learn.netdata.cloud/docs/agent/database/engine) - diff --git a/health/guides/dbengine/10min_dbengine_global_flushing_warnings.md b/health/guides/dbengine/10min_dbengine_global_flushing_warnings.md deleted file mode 100644 index 1029e7f6..00000000 --- a/health/guides/dbengine/10min_dbengine_global_flushing_warnings.md +++ /dev/null @@ -1,15 +0,0 @@ -### Understand the alert - -The Database Engine works like a traditional database. It dedicates a certain amount of RAM to data caching and indexing, while the rest of the data resides compressed on disk. Unlike other memory modes, the amount of historical metrics stored is based on the amount of disk space you allocate and the effective compression ratio, not a fixed number -of metrics collected. - -By using both RAM and disk space, the database engine allows for long-term storage of per-second metrics inside of the Netdata Agent itself. - -Netdata monitors the number of times when `dbengine` dirty pages were over 50% of the instance page cache in the last 10 minutes. In this situation, the metric data are at risk of not being stored in the database. To remedy this issue, reduce disk load or use faster disks. - -This alert is triggered in warn state when the number of `dbengine` dirty pages which were over 50% of the instance is greater than 0. - -### Useful resources - -[Read more about Netdata DB engine](https://learn.netdata.cloud/docs/agent/database/engine) - diff --git a/health/guides/dbengine/10min_dbengine_global_fs_errors.md b/health/guides/dbengine/10min_dbengine_global_fs_errors.md deleted file mode 100644 index 446289a9..00000000 --- a/health/guides/dbengine/10min_dbengine_global_fs_errors.md +++ /dev/null @@ -1,14 +0,0 @@ -### Understand the alert - -The Database Engine works like a traditional database. It dedicates a certain amount of RAM to data caching and indexing, while the rest of the data resides compressed on disk. Unlike other memory modes, the amount of historical metrics stored is based on the amount of disk space you allocate and the effective compression ratio, not a fixed number of metrics collected. - -By using both RAM and disk space, the database engine allows for long-term storage of per-second metrics inside of the Netdata agent itself. - -Netdata monitors the number of filesystem errors in the last 10 minutes. The Dbengine is experiencing filesystem errors (too many open files, wrong permissions, etc.) - -This alert is triggered in warning state when the number of filesystem errors is greater than 0. - -### Useful resources - -[Read more about Netdata DB engine](https://learn.netdata.cloud/docs/agent/database/engine) - diff --git a/health/guides/dbengine/10min_dbengine_global_io_errors.md b/health/guides/dbengine/10min_dbengine_global_io_errors.md deleted file mode 100644 index c47004f4..00000000 --- a/health/guides/dbengine/10min_dbengine_global_io_errors.md +++ /dev/null @@ -1,14 +0,0 @@ -### Understand the alert - -The Database Engine works like a traditional database. It dedicates a certain amount of RAM to data caching and indexing, while the rest of the data resides compressed on disk. Unlike other memory modes, the amount of historical metrics stored is based on the amount of disk space you allocate and the effective compression ratio, not a fixed number of metrics collected. - -By using both RAM and disk space, the database engine allows for long-term storage of per-second metrics inside of the Netdata Agent itself. - -The Netdata Agent monitors the number of IO errors in the last 10 minutes. The dbengine is experiencing I/O errors (CRC errors, out of space, bad disk, etc.). - -This alert is triggered in critical state when the number of IO errors is greater that 0. - -### Useful resources - -[Read more about Netdata DB engine](https://learn.netdata.cloud/docs/agent/database/engine) - diff --git a/health/guides/disks/10min_disk_backlog.md b/health/guides/disks/10min_disk_backlog.md deleted file mode 100644 index 9b0a275b..00000000 --- a/health/guides/disks/10min_disk_backlog.md +++ /dev/null @@ -1,10 +0,0 @@ -### Understand the alert - -This alert presents the average backlog size of the disk raising this alarm over the last 10 minutes. - -This alert is escalated to warning when the metric exceeds the size of 5000. - -### What is "disk backlog"? - -Backlog is an indication of the duration of pending disk operations. On every I/O event the system is multiplying the time spent doing I/O since the last update of this field with the number of pending operations. While not accurate, this metric can provide an indication of the expected completion time of the operations in progress. - diff --git a/health/guides/disks/10min_disk_utilization.md b/health/guides/disks/10min_disk_utilization.md deleted file mode 100644 index 41a987a4..00000000 --- a/health/guides/disks/10min_disk_utilization.md +++ /dev/null @@ -1,28 +0,0 @@ -### Understand the alert - -This alert presents the average percentage of time the disk was busy over the last 10 minutes. If you receive this it indicates high disk load and that the disk spent most of the time servicing -read or write requests. - -This alert is triggered in a warning state when the metric exceeds 98%. - -This metric is the same as the %util column on the command `iostat -x`. - -### Troubleshoot the alert - -- Check per-process disk usage to find the top consumers (If you got this alert for a device serving requests in parallel, you can ignore it) - -On Linux use `iotop` to see which processes are the main Disk I/O consumers on the `IO` column. - ``` - sudo iotop - ``` - Using this, you can see which processes are the main Disk I/O consumers on the `IO` column. - -On FreeBSD use `top` - ``` - top -m io -o total - ``` -### Useful resources - -1. [Two traps in iostat: %util and svctm](https://brooker.co.za/blog/2014/07/04/iostat-pct.html) - -2. `iotop` is a useful tool, similar to `top`, used to monitor Disk I/O usage, if you don't have it, then [install it](https://www.tecmint.com/iotop-monitor-linux-disk-io-activity-per-process/) diff --git a/health/guides/disks/bcache_cache_dirty.md b/health/guides/disks/bcache_cache_dirty.md deleted file mode 100644 index 11b74e52..00000000 --- a/health/guides/disks/bcache_cache_dirty.md +++ /dev/null @@ -1,74 +0,0 @@ -### Understand the Alert - -`bcache` is a cache in the block layer of the Linux Kernel. **It allows fast storage devices**, as SSDs (Solid State Drives), **to act as a cache for slower storage devices**, such as HDDs (Hard Disk Drives). As a result, **hybrid volumes are made with performance improvements**. Generally, a cache device is divided up into `buckets`, matching the physical disk's erase blocks. - -This alert indicates that your SSD cache is too small, and overpopulated with data. - -You can view `bcache_cache_dirty` as the `bcache` analogous metric to `dirty memory`. `dirty memory` is memory that has been changed but has not yet been written out to disk. For example, you make a change to a file but do not save it. These temporary changes are stored in memory, waiting to be written to disk. So `dirty` data on `bcache` is data that is stored on the cache disk and waits to be written to the backing device (Normally your HDD). - -`dirty` data is data in the cache that has not been written to the backing device (normally your HDD). So when the system shuts down, the cache device and the backing device are not safe to be separated. -`metadata` in general, is data that provides information about other data. - -### Troubleshoot the Alert - -- Upgrade your cache's capacity - -This alert is raised when there is more than 70% *(for warning status)* of your cache populated by `dirty` data and `metadata`, it means that your current cache device doesn't have the capacity to support your workflow. Using a bigger -capacity device as cache can solve the problem. - -- Monitor cache usage regularly - -Keep an eye on the cache usage regularly to understand the pattern of how your cache gets filled up with dirty data and metadata. This can help you better manage the cache and take proactive measures before facing a performance bottleneck. - - To monitor cache usage, use `cat` command on the cache device's sysfs directory like this: - - ``` - cat /sys/fs/bcache/<CACHE_DEV_UUID>/cache0/bcache/stats_five_minute/cache_hit_ratio - ``` - - Replace `<CACHE_DEV_UUID>` with your cache device's UUID. - -- Periodically write dirty data to the backing device - -If the cache becomes frequently filled with dirty data, you can try periodically writing dirty data to the backing device to create more space in the cache. This can especially help if your caching device isn't frequently reaching its full capacity. - - To perform this, you can use the `cron` job scheduler to run a command that flushes dirty data to the HDD periodically. Add the following line to your crontab: - - ``` - */5 * * * * echo writeback > /sys/fs/bcache/<CACHE_DEV_UUID>/cache0/bcache/writeback_rate_debug - ``` - - Replace `<CACHE_DEV_UUID>` with your cache device's UUID. This configuration will flush the dirty data to the backing device every 5 minutes. - -- Check for I/O bottlenecks - -If you experience performance issues with bcache, it's essential to identify the cause, which could be I/O bottlenecks. Look for any I/O errors or an overloaded I/O subsystem that may be affecting your cache device's performance. - - To check I/O statistics, you can use tools like `iotop`, `iostat` or `vmstat`: - - ```bash - iotop - iostat -x -d -z -t 5 5 # run 5 times with a 5-second interval between each report - vmstat -d - ``` - - Analyze the output and look for any signs of a bottleneck, such as excessive disk utilization, slow transfer speeds, or high I/O wait times. - -- Optimize cache configuration - -Review your current cache configuration and make sure it's optimized for your system's workload. In some cases, adjusting cache settings could help improve the hit ratio and reduce the amount of dirty data. - - To view the bcache settings: - - ``` - cat /sys/fs/bcache/<CACHE_DEV_UUID>/cache0/bcache/* - ``` - - Replace `<CACHE_DEV_UUID>` with your cache device's UUID. - - You can also make changes to the cache settings by echoing the new values to the corresponding sysfs files. Please refer to the [Cache Settings section in the Bcache documentation](https://www.kernel.org/doc/Documentation/bcache.txt) for more details. - -### Useful resources - -1. [Bcache documentation](https://www.kernel.org/doc/Documentation/bcache.txt) -2. [Arch Linux Wiki: Bcache](https://wiki.archlinux.org/title/bcache) diff --git a/health/guides/disks/bcache_cache_errors.md b/health/guides/disks/bcache_cache_errors.md deleted file mode 100644 index 5256c480..00000000 --- a/health/guides/disks/bcache_cache_errors.md +++ /dev/null @@ -1,66 +0,0 @@ -### Understand the alert - -This alert is triggered when the number of read races in the last minute on a `bcache` system has increased. A read race occurs when a `bucket` is reused and invalidated while it's being read from the cache. In this situation, the data is reread from the slower backing device. - -### What is bcache? - -`bcache` is a cache within the block layer of the Linux kernel. It enables fast storage devices, such as SSDs (Solid State Drives), to act as a cache for slower storage devices like HDDs (Hard Disk Drives). This creates hybrid volumes with improved performance. A cache device is usually divided into `buckets` that match the physical disk's erase blocks. - -### Troubleshoot the alert - -1. Verify the current `bcache` cache errors: - - ``` - grep bcache_cache_errors /sys/fs/bcache/*/stats_total/* - ``` - - This command will show the total number of cache errors for all `bcache` devices. - -2. Identify the affected backing device: - - You can determine the affected backing device by checking the `/sys/fs/bcache` directory. Look for the symbolic link that points to the problematic device. - - ``` - ls -l /sys/fs/bcache - ``` - - This command will show the list of devices with corresponding names. - -3. Monitor the cache device's performance: - - Use `iostat` to check the cache device's I/O performance. - - ``` - iostat -x -h -p /dev/YOUR_CACHE_DEVICE - ``` - - Note that you should replace `YOUR_CACHE_DEVICE` with the actual cache device name. - -4. Check the utilization of the cache and backing devices: - - Use the following commands to check the utilization percentage of the cache and backing devices: - - ``` - # for the cache device (/dev/YOUR_CACHE_DEVICE) - cat /sys/block/YOUR_CACHE_DEVICE/bcache/utilization - - # for the backing device (/dev/YOUR_BACKING_DEVICE) - cat /sys/block/YOUR_BACKING_DEVICE/bcache/utilization - ``` - - Replace `YOUR_CACHE_DEVICE` and `YOUR_BACKING_DEVICE` with the respective device names. - -5. Optimize the cache: - - - If the cache utilization is high, consider increasing the cache size or adding more cache devices. - - If the cache device is heavily utilized, consider upgrading it to a faster SSD. - - In case the read races persist, consider using a [priority caching strategy](https://www.kernel.org/doc/html/latest/admin-guide/bcache.html#priority-caching). - - You may also need to review your system's overall I/O load and adjust your caching strategy accordingly. - -### Useful resources - -1. [Bcache: Caching beyond just RAM](https://lwn.net/Articles/394672/) -2. [Kernel Documentation - Bcache](https://www.kernel.org/doc/html/latest/admin-guide/bcache.html) -3. [Arch Linux Wiki - Bcache](https://wiki.archlinux.org/title/bcache) -4. [Wikipedia - Bcache](https://en.wikipedia.org/wiki/Bcache) diff --git a/health/guides/disks/disk_inode_usage.md b/health/guides/disks/disk_inode_usage.md deleted file mode 100644 index 3c916106..00000000 --- a/health/guides/disks/disk_inode_usage.md +++ /dev/null @@ -1,23 +0,0 @@ -### Understand the alert - -This alarm presents the percentage of used `inodes` storage of a particular disk. - -The number of `inodes` indicates the number of files and folders you have. An `inode` is a data structure, containing metadata about a file. All filenames are internally mapped to respective `inode` numbers, so if you have a -lot of files, it means there are a lot of `inodes`. - -If the alarm is raised, it means that your storage device is running out of `inode` space. Each disk has a particular **limitation on the amount of `inodes` it can store**, determined by its size. - -Many modern filesystems use dynamically allocated `inodes` instead of a static table. These should not be presented on the charts associated with this alarm, and should not ever trigger it. If such a filesystem **does** trigger this alarm, and it's constantly reporting max `inode` usage, it's probably a bug in the filesystem driver. Some such filesystems incorrectly report having max `inode` count when they should not because they have no max limit, and in turn they trigger a false positive alarm. - -### Troubleshoot the alert - -Clear cache files or delete unnecessary files and folders - -- To reduce the amount of how many `inodes` you store currently, you can clear your cache, trash any unnecessary files and folders in your system. - -We strongly suggest that you practice a high degree of caution when cleaning up drives, and removing files, make sure that you are certain that you delete only unnecessary files. - -### Useful resources - -[Linux Inodes](https://www.javatpoint.com/linux-inodes) -[Understanding UNIX / Linux filesystem Inodes](https://www.cyberciti.biz/tips/understanding-unixlinux-filesystem-inodes.html)
\ No newline at end of file diff --git a/health/guides/disks/disk_space_usage.md b/health/guides/disks/disk_space_usage.md deleted file mode 100644 index 14663942..00000000 --- a/health/guides/disks/disk_space_usage.md +++ /dev/null @@ -1,19 +0,0 @@ -### Understand the alert - -This alarm presents the percentage of used space of a particular disk. If it is close to 100%, it means that your storage device is running out of space. If the particular disk raising the alarm is full, the system could experience slowdowns and even crashes. - -### Troubleshoot the alert - -Clean or upgrade the drive. - -If your storage device is full and the alert is raised, there are two paths you can tend to: - -- Cleanup your drive, remove any unnecessary files (files on the trash directory, cache files etc.) to free up space. Some areas that are safe to delete, are: - - Files under `/var/cache` - - Old logs in `/var/log` - - Old crash reports in `/var/crash` or `/var/dump` - - The `.cache` directory in user home directories - -- If your workflow requires all the space that is currently used, then you might want to look into upgrading the disk that raised the alarm, because its capacity is small for your demands. - -Netdata strongly suggests that you are careful when cleaning up drives, and removing files, make sure that you are certain that you delete only unnecessary files.
\ No newline at end of file diff --git a/health/guides/dns_query/dns_query_query_status.md b/health/guides/dns_query/dns_query_query_status.md deleted file mode 100644 index f47b8ade..00000000 --- a/health/guides/dns_query/dns_query_query_status.md +++ /dev/null @@ -1,33 +0,0 @@ -### Understand the alert - -This alert is triggered when the success rate of DNS requests of a specific type to a specified server starts to fail. The alert checks the DNS `query_status` and warns if the success rate is not `1`, indicating unsuccessful DNS queries. - -### What is a DNS query? - -A DNS query is a request for information from a client machine to a DNS server, typically to resolve domain names (such as www.example.com) to IP addresses. A successful query will return the matching IP address, while an unsuccessful query may result from various issues, such as DNS server problems or network connectivity issues. - -### Troubleshoot the alert - -1. Check the DNS server status and logs - - Verify if the DNS server (mentioned in the alert `${label:server}`) is up and running. Inspect the server logs for any error messages or suspicious activity. - -2. Examine network connectivity - - Make sure that your system can communicate with the specified DNS server. Use standard network troubleshooting tools, such as `traceroute`, to identify possible network issues between the client machine and the DNS server. - -3. Inspect the DNS query type - - This alert is specific to the DNS request type `${label:record_type}`. Check if this particular type of request is causing the issue, or if the problem is widespread across all DNS queries. Understanding the scope of the issue can help narrow down the possible causes. - -4. Analyze local DNS resolver configuration - - Examine your system's `/etc/resolv.conf` file and make sure that the specified DNS server is configured correctly. Review any recent changes in the resolver configuration. - -5. Monitor success rate improvements - - After resolving the issue, keep an eye on the alert to ensure that the success rate returns to `1`, indicating successful DNS requests. - -### Useful resources - -1. [DNS Query Types](https://www.cloudflare.com/learning/dns/dns-records/) diff --git a/health/guides/dnsmasq/dnsmasq_dhcp_dhcp_range_utilization.md b/health/guides/dnsmasq/dnsmasq_dhcp_dhcp_range_utilization.md deleted file mode 100644 index d259ae40..00000000 --- a/health/guides/dnsmasq/dnsmasq_dhcp_dhcp_range_utilization.md +++ /dev/null @@ -1,50 +0,0 @@ -### Understand the alert - -This alert indicates that the number of leased IP addresses in your DHCP range, managed by dnsmasq, is close to the total number of provisioned DHCP addresses. The alert will be triggered in a warning state when the percentage of leased IP addresses is between 80-90% and in a critical state when it is between 90-95%. - -### What is DHCP? - -Dynamic Host Configuration Protocol (DHCP) is a network management protocol that dynamically assigns IP addresses and other configuration information to devices connected to the network. It helps network administrators to manage the IP address allocation process efficiently. - -### What is dnsmasq? - -`dnsmasq` is a lightweight, easy to configure DNS forwarder, DHCP server, and TFTP server. It is designed to provide DNS and optionally, DHCP, services to a small-scale network. Dnsmasq can serve the names of local machines which are not in the global DNS. - -### Troubleshoot the alert - -1. Check the current DHCP lease utilization - -To see the current percentage of DHCP leases in use, run the following command: - -``` -cat /var/lib/misc/dnsmasq.leases | wc -l -``` - -2. Verify the configured DHCP range - -Check the `/etc/dnsmasq.conf` file to ensure that the DHCP range is configured correctly: - -``` -grep -i "dhcp-range" /etc/dnsmasq.conf -``` - -Make sure that the range provides enough IP addresses for the number of devices in your network. - -3. Increase the DHCP range - -If required, increase the number of available IP addresses within the DHCP range by modifying the `/etc/dnsmasq.conf` file, expanding the range and/or decreasing the lease time. - -After modifying the configuration, restart the dnsmasq service to apply the changes: - -``` -sudo systemctl restart dnsmasq -``` - -4. Monitor the DHCP lease utilization - -Keep monitoring the DHCP lease utilization to ensure that the new range and lease settings are sufficient for your network's needs. - -### Useful resources - -1. [The Dnsmasq Homepage](http://www.thekelleys.org.uk/dnsmasq/doc.html) -2. [Ubuntu Community Help Wiki: Dnsmasq](https://help.ubuntu.com/community/Dnsmasq) diff --git a/health/guides/docker/docker_container_unhealthy.md b/health/guides/docker/docker_container_unhealthy.md deleted file mode 100644 index bdad2648..00000000 --- a/health/guides/docker/docker_container_unhealthy.md +++ /dev/null @@ -1,49 +0,0 @@ -### Understand the alert - -This alert, `docker_container_unhealthy`, is triggered when the health status of a Docker container is marked as unhealthy. If you receive this alert, it means that one of your Docker containers is not functioning properly, which can affect the services or applications running inside the container. - -### What does container health status mean? - -The container health status is a Docker feature that allows you to define custom health checks to verify the proper functioning of your containers. If a container has a health check defined, Docker will execute it at regular intervals to monitor the container's health. If the health check fails a specific number of times in a row, Docker will mark the container as unhealthy, and this alert will be triggered. - -### Troubleshoot the alert - -1. Identify the affected container: - - Find the container name in the alert's info field: `${label:container_name} docker container health status is unhealthy`. Use this container name in the following steps. - -2. Check the logs of the affected container: - - Use the `docker logs` command to view the logs of the unhealthy container. This may provide information on what caused the container to become unhealthy. - - ``` - docker logs <container_name> - ``` - -3. Inspect the container's health check configuration: - - Use the `docker inspect` command to view the health check settings for the affected container. Look for any misconfigurations that could lead to the container being marked as unhealthy. - - ``` - docker inspect <container_name> --format='{{json .Config.Healthcheck}}' - ``` - -4. Check the container's health status history: - - Use the `docker inspect` command again to review the health check history for the affected container. - - ``` - docker inspect <container_name> --format='{{json .State.Health}}' - ``` - -5. Investigate and fix container issues: - - Based on the information gathered from the previous steps, investigate and fix any issues with the container's service, configuration, or resources. You might need to restart the container or reconfigure its health check settings. - - ``` - docker restart <container_name> - ``` - -### Useful resources - -1. [Docker's HEALTHCHECK instruction](https://stackoverflow.com/questions/38546755/how-to-use-dockers-healthcheck-instruction) diff --git a/health/guides/elasticsearch/elasticsearch_cluster_health_status_red.md b/health/guides/elasticsearch/elasticsearch_cluster_health_status_red.md deleted file mode 100644 index 494a7853..00000000 --- a/health/guides/elasticsearch/elasticsearch_cluster_health_status_red.md +++ /dev/null @@ -1,55 +0,0 @@ -### Understand the alert - -This alert is triggered when the Elasticsearch cluster health status turns `RED`. If you receive this alert, it means that there is a problem that needs immediate attention, such as data loss or one or more primary and replica shards are not allocated to the cluster. - -### Elasticsearch Cluster Health Status - -Elasticsearch cluster health status provides an indication of the cluster's overall health, based on the state of its shards. The status can be `green`, `yellow`, or `red`: - -- `Green`: All primary and replica shards are allocated. -- `Yellow`: All primary shards are allocated, but some replica shards are not. -- `Red`: One or more primary shards are not allocated, leading to data loss. - -### Troubleshoot the alert - -1. Check the Elasticsearch cluster health using the `_cat` API: - -``` -curl -XGET 'http://localhost:9200/_cat/health?v' -``` - -Examine the output to understand the current health status, the number of nodes and shards, and any unassigned shards. - -2. To get more details on the unassigned shards, use the `_cat/shards` API: - -``` -curl -XGET 'http://localhost:9200/_cat/shards?v' -``` - -Look for shards with the status `UNASSIGNED`. - -3. Identify the root cause of the issue, such as: - - - A node has left the cluster or failed, causing the primary shard to become unassigned. - - Insufficient disk space is available, preventing shards from being allocated. - - Cluster settings or shard allocation settings are misconfigured. - -4. Take appropriate action based on the root cause: - - - Ensure all Elasticsearch nodes are running and connected to the cluster. - - Add more nodes or increase disk space as needed. - - Review and correct cluster and shard allocation settings. - -5. Monitor the health status as the cluster recovers: - -``` -curl -XGET 'http://localhost:9200/_cat/health?v' -``` - -If the health status turns `YELLOW` or `GREEN`, the cluster is no longer in the `RED` state. - -### Useful resources - -1. [Elasticsearch Cluster Health](https://www.elastic.co/guide/en/elasticsearch/reference/current/cluster-health.html) -2. [Fixing Elasticsearch Cluster Health Status "RED"](https://www.elastic.co/guide/en/elasticsearch/guide/current/_cluster_health.html) -3. [Elasticsearch Shard Allocation](https://www.elastic.co/guide/en/elasticsearch/reference/current/shards-allocation.html)
\ No newline at end of file diff --git a/health/guides/elasticsearch/elasticsearch_cluster_health_status_yellow.md b/health/guides/elasticsearch/elasticsearch_cluster_health_status_yellow.md deleted file mode 100644 index 2f8bf854..00000000 --- a/health/guides/elasticsearch/elasticsearch_cluster_health_status_yellow.md +++ /dev/null @@ -1,57 +0,0 @@ -### Understand the alert - -The `elasticsearch_cluster_health_status_yellow` alert triggers when the Elasticsearch cluster's health status is `yellow` for longer than 10 minutes. This may indicate potential issues in the cluster, like unassigned or missing replicas. The alert class is `Errors`, and the type is `SearchEngine`. - -### What does the health status mean? - -In Elasticsearch, cluster health status can be one of three colors: - -- Green: All primary shards and replicas are active and properly assigned to each index. -- Yellow: All primary shards are active, but one or more replicas are unassigned or missing. -- Red: One or more primary shards are unassigned or missing. - -### Troubleshoot the alert - -1. Check the Elasticsearch cluster health. - -You can check the health of the Elasticsearch cluster using the `/_cluster/health` API endpoint: - -``` -curl -XGET 'http://localhost:9200/_cluster/health?pretty' -``` - -2. Identify the unassigned or missing replicas. - -You can check for any unassigned or missing shards using the `/_cat/shards` API endpoint: - -``` -curl -XGET 'http://localhost:9200/_cat/shards?v&h=index,shard,prirep,state' -``` - -3. Check Elasticsearch logs for any errors or warnings: - -``` -sudo journalctl --unit elasticsearch -``` - -4. Check disk space on all Elasticsearch nodes. Insufficient disk space may lead to unassigned or missing replicas: - -``` -df -h -``` - -5. Ensure Elasticsearch is properly configured. - -Check the `elasticsearch.yml` configuration file on all nodes for any misconfigurations or errors: - -``` -sudo nano /etc/elasticsearch/elasticsearch.yml -``` - -6. Review the Elasticsearch documentation on [Cluster-Level Shard Allocation and Routing Settings](https://www.elastic.co/guide/en/elasticsearch/reference/current/allocation-awareness.html) to understand how to properly assign and balance shards. - -### Useful resources - -1. [Elasticsearch Cluster Health](https://www.elastic.co/guide/en/elasticsearch/reference/current/cluster-health.html) -2. [Elasticsearch Shards](https://www.elastic.co/guide/en/elasticsearch/reference/current/cat-shards.html) -3. [Allocation Awareness in Elasticsearch](https://www.elastic.co/guide/en/elasticsearch/reference/current/allocation-awareness.html)
\ No newline at end of file diff --git a/health/guides/elasticsearch/elasticsearch_node_index_health_red.md b/health/guides/elasticsearch/elasticsearch_node_index_health_red.md deleted file mode 100644 index 1e2877d1..00000000 --- a/health/guides/elasticsearch/elasticsearch_node_index_health_red.md +++ /dev/null @@ -1,49 +0,0 @@ -### Understand the alert - -This alert is triggered when the health status of an Elasticsearch node index turns `red`. If you receive this alert, it means that at least one primary shard and its replicas are not allocated to any node, and the data in the index is potentially at risk. - -### What does a red index health status mean? - -In Elasticsearch, the index health status can be green, yellow, or red: - -- Green: All primary and replica shards are allocated and active. -- Yellow: All primary shards are active, but not all replicas are allocated due to the lack of available nodes. -- Red: At least one primary shard and its replicas are not allocated, which means the cluster can't serve all the incoming data, and data loss is possible. - -### Troubleshoot the alert - -1. Check the cluster health - - Use the Elasticsearch `_cluster/health` endpoint to check the health status of your cluster: - ``` - curl -X GET "localhost:9200/_cluster/health?pretty" - ``` - -2. Identify the unassigned shards - - Use the Elasticsearch `_cat/shards` endpoint to view the status of all shards in your cluster: - ``` - curl -X GET "localhost:9200/_cat/shards?h=index,shard,prirep,state,unassigned.reason&pretty" - ``` - -3. Check Elasticsearch logs - - Examine the Elasticsearch logs for any error messages or alerts related to shard allocation. The log file is usually located at `/var/log/elasticsearch/`. - -4. Resolve shard allocation issues - - Depending on the cause of the unassigned shards, you may need to perform actions such as: - - - Add more nodes to the cluster to distribute the load evenly. - - Reallocate shards manually using the Elasticsearch `_cluster/reroute` API. - - Adjust shard allocation settings in the Elasticsearch `elasticsearch.yml` configuration file. - -5. Recheck the cluster health - - After addressing the issues found in the previous steps, use the `_cluster/health` endpoint again to check if the health status of the affected index has improved. - -### Useful resources - -1. [Elasticsearch: Cluster Health](https://www.elastic.co/guide/en/elasticsearch/reference/current/cluster-health.html) -2. [Elasticsearch: Shards and Replicas](https://www.elastic.co/guide/en/elasticsearch/reference/current/_basic_concepts.html#shards-and-replicas) -3. [Elasticsearch: Shard Allocation and Cluster-Level Settings](https://www.elastic.co/guide/en/elasticsearch/reference/current/shards-allocation.html)
\ No newline at end of file diff --git a/health/guides/elasticsearch/elasticsearch_node_indices_search_time_fetch.md b/health/guides/elasticsearch/elasticsearch_node_indices_search_time_fetch.md deleted file mode 100644 index e0bcc112..00000000 --- a/health/guides/elasticsearch/elasticsearch_node_indices_search_time_fetch.md +++ /dev/null @@ -1,49 +0,0 @@ -### Understand the alert - -This alert is triggered when the Elasticsearch node's average `search_time_fetch` exceeds the warning or critical thresholds over a 10-minute window. The `search_time_fetch` measures the time spent fetching data from shards during search operations. If you receive this alert, it means your Elasticsearch search performance is degraded, and fetches are running slowly. - -### Troubleshoot the alert - -1. Check the Elasticsearch cluster health - -Run the following command to check the health of your Elasticsearch cluster: - -``` -curl -XGET 'http://localhost:9200/_cluster/health?pretty' -``` - -Look for the `status` field in the output, which indicates the overall health of the cluster: - -- green: All primary and replica shards are active and allocated. -- yellow: All primary shards are active, but not all replica shards are active. -- red: Some primary shards are not active. - -2. Identify slow search queries - -Run the following command to gather information on slow search queries: - -``` -curl -XGET 'http://localhost:9200/_nodes/stats/indices/search?pretty' -``` - -Look for the `query`, `fetch`, and `take` fields in the output, which indicate the time taken by different parts of the search operation. - -3. Check Elasticsearch node resources - -Ensure the Elasticsearch node has sufficient resources (CPU, memory, disk space, and disk I/O). Use system monitoring tools like `top`, `htop`, `vmstat`, and `iostat` to analyze the resource usage on the Elasticsearch node. - -4. Optimize search queries - -If slow search queries are identified in Step 2, consider optimizing them for better performance. Some techniques for optimizing Elasticsearch search performance include using filters, limiting result set size, and disabling expensive operations like sorting and faceting when not needed. - -5. Review Elasticsearch configuration - -Check your Elasticsearch configuration to ensure it is optimized for search performance. Verify settings such as index refresh intervals, query caches, and field data caches. Consult the Elasticsearch documentation for best practices on configuration settings. - -6. Consider horizontal scaling - -If your Elasticsearch node is experiencing high search loads regularly, consider adding more nodes to distribute the load evenly across the cluster. - -### Useful resources - -1. [Elasticsearch Performance Tuning](https://www.elastic.co/guide/en/elasticsearch/reference/current/tune-for-search-speed.html) diff --git a/health/guides/elasticsearch/elasticsearch_node_indices_search_time_query.md b/health/guides/elasticsearch/elasticsearch_node_indices_search_time_query.md deleted file mode 100644 index 3a82a64a..00000000 --- a/health/guides/elasticsearch/elasticsearch_node_indices_search_time_query.md +++ /dev/null @@ -1,44 +0,0 @@ -### Understand the alert - -This alert is triggered when the average search time for Elasticsearch queries has been higher than the defined warning thresholds. If you receive this alert, it means that your search performance is degraded, and queries are running slower than usual. - -### What does search performance mean? - -Search performance in Elasticsearch refers to how quickly and efficiently search queries are executed, and the respective results are returned. Good search performance is essential for providing fast and relevant results in applications and services relying on Elasticsearch for their search capabilities. - -### What causes degraded search performance? - -Several factors can cause search performance degradation, including: - -- High system load, causing CPU, memory or disk I/O bottlenecks -- Poorly optimized search queries -- High query rate, resulting in a large number of concurrent queries -- Insufficient hardware or resources allocated to Elasticsearch - -### Troubleshoot the alert - -1. Check the Elasticsearch logs for any error messages or warnings: - - ``` - cat /var/log/elasticsearch/elasticsearch.log - ``` - -2. Monitor the system resources (CPU, memory, and disk I/O) using tools like `top`, `vmstat`, and `iotop`. Determine if there are any resource bottlenecks affecting the search performance. - -3. Analyze and optimize the slow search queries by using the Elasticsearch [Slow Log](https://www.elastic.co/guide/en/elasticsearch/reference/current/index-modules-slowlog.html). - -4. Evaluate the cluster health status by running the following Elasticsearch API command: - - ``` - curl -XGET 'http://localhost:9200/_cluster/health?pretty' - ``` - - Check for any issues that may be impacting the search performance. - -5. Assess the number of concurrent queries and, if possible, reduce the query rate or distribute the load among additional Elasticsearch nodes. - -6. If the issue persists, consider scaling up your Elasticsearch deployment or allocating additional resources to the affected nodes to improve their performance. - -### Useful resources - -1. [Tune for Search Speed - Elasticsearch Guide](https://www.elastic.co/guide/en/elasticsearch/reference/current/tune-for-search-speed.html) diff --git a/health/guides/entropy/lowest_entropy.md b/health/guides/entropy/lowest_entropy.md deleted file mode 100644 index b53aed2c..00000000 --- a/health/guides/entropy/lowest_entropy.md +++ /dev/null @@ -1,30 +0,0 @@ -### Understand the alert - -This alert presents the minimum amount of entropy in the kernel entropy pool in the last 5 minutes. Low entropy can lead to a reduction in the quality of random numbers produced by `/dev/random` and `/dev/urandom`. - -The Netdata Agent checks for the minimum entropy value in the last 5 minutes. The alert gets raised into warning if the value < 100, and cleared if the value > 200. - -For further information on how our alerts are calculated, please have a look at our [Documentation](https://learn.netdata.cloud/docs/agent/health/reference#expressions). - -### What is entropy and why do we need it? - -Entropy is similar to "randomness". A Linux system gathers "real" random numbers by keeping an eye on different events: network activity, hard drive rotation speeds, hardware random number generator (if available), key-clicks, and so on. It feeds those to the kernel entropy pool, which is used by `/dev/random`. - -Encryption and cryptography applications require random numbers to operate. A function or an algorithm that produces numbers -*that seem to be random*- is very predictable, if you know what function is used. - -In real life, we use our surroundings and our thoughts to produce truly random numbers. A computer can't really do this by itself, so it gathers numbers from a lot of sources. For example, it can get the CO2 levels in a room from a sensor on the system and use that as a random number. - -This way all the values are random and there is no pattern to be found among them. - -### Troubleshoot the alert - -The best tool to troubleshoot the lowest entropy alert is with `rng-tools`. - -If `rng-tools` are not available for your platform, or you run into trouble, you can use the tool `haveged` as an alternative. - -### Useful resources - -1. [Entropy](https://unixhealthcheck.com/blog?id=472) -2. [rng-tools](https://github.com/nhorman/rng-tools) -3. [How to add more entropy to improve cryptographic randomness on Linux](https://www.techrepublic.com/article/how-to-add-more-entropy-to-improve-cryptographic-randomness-on-linux/) -4. [Haveged Installation - Archlinux Wiki](https://wiki.archlinux.org/title/Haveged#Installation) diff --git a/health/guides/exporting/exporting_last_buffering.md b/health/guides/exporting/exporting_last_buffering.md deleted file mode 100644 index 4b13fe76..00000000 --- a/health/guides/exporting/exporting_last_buffering.md +++ /dev/null @@ -1,29 +0,0 @@ -### Understand the alert - -This alert is related to the Netdata Exporting engine, which calculates the number of seconds since the last successful buffering of exporting data. If you receive this alert, it means the exporting engine failed to buffer metrics for a while, and some metrics were lost during exporting. There might be issues with the exporting destination being down or unreachable. - -### Troubleshoot the alert - -1. Check the exporting destination status and accessibility: If the exporting destination (e.g. a remote server or database) is down or unreachable, your priority should be to fix the connection issue or bring the destination back up. - -2. Investigate short-term network availability problems: Short-term network connectivity issues might cause temporary errors in the exporting process. You may want to check and monitor your network to confirm this is the case and fix any issues. - -3. Increase the `buffer on failures` value in `exporting.conf`: You can try to prevent short-term problems from causing alert issues by increasing the `buffer on failures` value in the `exporting.conf` file. To do this, edit the configuration file, find the parameter `buffer on failures`, and increase its value. - - ``` - [exporting:global] - buffer on failures = new_value - ``` - Replace `new_value` with the desired number that matches your system requirements. - -4. Restart the Netdata Agent: After modifying the `exporting.conf` file, don't forget to restart the Netdata Agent for changes to take effect. Use the following command to restart the agent: - - ``` - sudo systemctl restart netdata - ``` - -5. Monitor the `exporting_last_buffering` alert: After applying the changes, keep monitoring the `exporting_last_buffering` alert to check if the issue is resolved. If the alert continues, further investigate possible issues with the exporting engine or destination. - -### Useful resources - -1. [Netdata Exporting Engine](https://learn.netdata.cloud/docs/exporting-data-to-other-systems/exporting-reference) diff --git a/health/guides/exporting/exporting_metrics_sent.md b/health/guides/exporting/exporting_metrics_sent.md deleted file mode 100644 index f17f593c..00000000 --- a/health/guides/exporting/exporting_metrics_sent.md +++ /dev/null @@ -1,46 +0,0 @@ -### Understand the alert - -The `exporting_metrics_sent` alert is triggered when the Netdata Agent fails to send all metrics to the configured external database server. This could be due to the exporting destination being down, unreachable, or short-term network availability problems. - -### Troubleshoot the alert - -To troubleshoot this alert, follow these steps: - -1. Verify the exporting destination status: - - - Make sure the external database server is up and running. - - Check if there are any issues with the server, such as high CPU usage, low memory, or a full disk. - -2. Check the network connection between the Netdata Agent and the external database server: - - - Use tools like `ping` or `traceroute` to test the connection. - - Check for any firewall rules that may be blocking the connection. - -3. Increase the `buffer on failures` in `exporting.conf`: - - - Open the `exporting.conf` file, which is typically located at `/etc/netdata/exporting.conf`. - - - Increase the value of the `buffer on failures` setting to allow for more metrics to be stored when network/connectivity issues occur. For example, if the current setting is `10000`, try increasing it to `20000` or higher, depending on your server's available memory. - - ``` - [exporting:global] - buffer on failures = 20000 - ``` - - - Save and exit the file. - - - Restart the Netdata Agent to apply the changes. - -4. Review the Netdata Agent logs: - - - Check for any error messages or warnings related to the exporting engine in the Netdata Agent logs (`/var/log/netdata/error.log`). - - - Use the information from the logs to troubleshoot any issues you find. - -5. Ensure your configuration settings are correct: - - - Double-check your exporting configuration settings (located in `/etc/netdata/exporting.conf`) to ensure they match the requirements of your external database server. - -### Useful resources - -1. [Netdata Exporting Engine documentation](https://learn.netdata.cloud/docs/exporting-data-to-other-systems/exporting-reference) diff --git a/health/guides/gearman/gearman_workers_queued.md b/health/guides/gearman/gearman_workers_queued.md deleted file mode 100644 index cf9c481e..00000000 --- a/health/guides/gearman/gearman_workers_queued.md +++ /dev/null @@ -1,43 +0,0 @@ -### Understand the alert - -This alert is related to the Gearman application framework. If you receive this alert, it means that the average number of queued jobs in the last 10 minutes is significantly high, indicating that more workers may be needed to maintain an efficient workflow. - -### What is Gearman? - -Gearman is an open-source, distributed job scheduling framework that allows applications to distribute processing tasks among multiple worker machines. It is useful to parallelize tasks and manage workloads between different systems. - -### Troubleshoot the alert - -1. Check the status of Gearman with the following command: - - ``` - gearadmin --status - ``` - -2. Analyze the output and identify queues with a high number of jobs: - - Example output: - - ``` - queue1 50000 10 0 - queue2 65000 20 0 - ``` - - In this example, `queue1` and `queue2` have a high number of queued jobs (50,000 and 65,000), with 10 and 20 workers working on them respectively. - -3. Increase the number of workers: - - To increase the number of workers, you may need to start additional worker instances or adjust the configurable number of workers in your Gearman deployment. For instance, if you use a script to start workers, you can update this script and start more instances. - -4. Monitor the Gearman metrics: - - Continue to monitor the metrics for some time to ensure that the additional workers are effectively reducing the number of queued jobs. - -5. If necessary, further optimize the Gearman deployment: - - If the problem persists, you may need to analyze the queues in further detail, such as looking into possible bottlenecks, inefficient operations, or other performance-related factors. - -### Useful resources - -1. [Monitoring Gearman with Netdata](https://www.netdata.cloud/gearman-monitoring/) -2. [Gearman Documentation](http://gearman.org/documentation/) diff --git a/health/guides/geth/geth_chainhead_diff_between_header_block.md b/health/guides/geth/geth_chainhead_diff_between_header_block.md deleted file mode 100644 index 18d20e3d..00000000 --- a/health/guides/geth/geth_chainhead_diff_between_header_block.md +++ /dev/null @@ -1,44 +0,0 @@ -### Understand the alert - -The `geth_chainhead_diff_between_header_block` alert is generated by the Netdata Agent when monitoring an Ethereum node using the Geth client. The alert is triggered when there is a significant difference between the chain head header and the actual block number. This indicates that your Ethereum node is out of sync with the rest of the network, and you may experience issues when trying to interact with the blockchain. - -### Troubleshoot the alert - -1. **Check the sync status of your Ethereum node**: To determine the current sync status of your Ethereum node, execute the following command in the Geth console: - - ``` - eth.syncing - ``` - - If your node is syncing, you'll see information about the syncing progress. If it's not syncing, the command will return `false`. - -2. **Restart Geth**: If your node is not syncing, try restarting Geth with the appropriate command for your operating system. For example: - - ``` - sudo systemctl restart geth - ``` - - If Geth isn't running as a system service, you may need to restart it manually. Ensure you're using the correct command-line flags and options. - -3. **Check Geth logs**: Inspect the Geth logs for any issues or errors that may provide insight into the problem. You can find the logs in the default log directory or use the `--log-dir` flag to specify a custom log directory. To view the logs in real-time, run: - - ``` - tail -f /path/to/your/log/directory/geth.log - ``` - -4. **Ensure your system time is accurate**: An incorrect system time can cause syncing issues. Make sure your system clock is accurate and synchronized with an NTP server: - - ``` - sudo ntpdate -s time.nist.gov - ``` - -5. **Upgrade Geth**: Ensure you are running the latest version of Geth. Upgrading to the latest version can resolve issues and improve synchronization. You can find the latest release on the [Geth GitHub repository](https://github.com/ethereum/go-ethereum/releases). - -6. **Check your network connection**: Verify that your node has a stable and reliable network connection. If you're on a shared network, consider increasing the bandwidth or moving the node to a dedicated network. - -### Useful resources - -1. [Geth Documentation](https://geth.ethereum.org/docs/) -2. [Ethereum Stack Exchange](https://ethereum.stackexchange.com/) -3. [Netdata Ethereum Monitoring Guide](https://blog.netdata.cloud/how-to-monitor-the-geth-node-in-under-5-minutes/) -4. [Geth GitHub Repository](https://github.com/ethereum/go-ethereum) diff --git a/health/guides/haproxy/haproxy_backend_server_status.md b/health/guides/haproxy/haproxy_backend_server_status.md deleted file mode 100644 index 3d95921e..00000000 --- a/health/guides/haproxy/haproxy_backend_server_status.md +++ /dev/null @@ -1,46 +0,0 @@ -### Understand the alert - -The `haproxy_backend_server_status` alert is triggered when one or more backend servers that are managed by HAProxy are inaccessible or offline. HAProxy is a reverse-proxy that provides high availability, load balancing, and proxying for TCP and HTTP-based applications. If you receive this alert, it means that there may be a problem with your backend server(s), and incoming requests could face delays or not be processed correctly. - -### Troubleshoot the alert - -1. **Check the HAProxy backend server status** - - You can check the status of each individual backend server by accessing the HAProxy Statistics Report. By default, this report can be accessed on the HAProxy server using the URL: - - ``` - http://<Your-HAProxy-Server-IP>:9000/haproxy_stats - ``` - - Replace `<Your-HAProxy-Server-IP>` with the IP address of your HAProxy server. If you have configured a different port for the statistics report, use that instead of `9000`. - - In the report, look for any backend server(s) with a `DOWN` status. - -2. **Investigate the problematic backend server(s)** - - For each of the backend servers that are in a `DOWN` status, check the availability and health of the server. Make sure that the server is running, and check its resources (CPU, memory, disk space, network) to identify any potential issues. - -3. **Validate the HAProxy configuration** - - As mentioned in the provided guide, it is essential to validate the correctness of the HAProxy configuration file. If you haven't already, follow the steps in the guide to check for any configuration errors or warnings. - -4. **Check for recent changes** - - If the backend servers were previously working correctly, inquire about any recent changes to the infrastructure, such as software updates or configuration changes. - -5. **Restart the HAProxy service** - - If the backend server(s) seem to be healthy, but the alert still persists, try restarting the HAProxy service: - - ``` - sudo systemctl restart haproxy - ``` - -6. **Monitor the alert and backend server status** - - After applying any changes or restarting the HAProxy service, monitor the alert and the backend server status in the HAProxy Statistics Report to see if the issue has been resolved. - -### Useful resources - -1. [HAProxy Configuration Manual](https://cbonte.github.io/haproxy-dconv/2.0/configuration.html) -2. [HAProxy Log Customization](https://www.haproxy.com/blog/introduction-to-haproxy-logging/) diff --git a/health/guides/haproxy/haproxy_backend_status.md b/health/guides/haproxy/haproxy_backend_status.md deleted file mode 100644 index 47be09c7..00000000 --- a/health/guides/haproxy/haproxy_backend_status.md +++ /dev/null @@ -1,49 +0,0 @@ -### Understand the alert - -This alert monitors the average number of failed HAProxy backends over the last 10 seconds. If you receive this alert in a critical state, it means that one or more HAProxy backends are inaccessible or offline. - -HAProxy is a reverse-proxy that provides high availability, load balancing, and proxying for TCP and HTTP-based applications. A backend in HAProxy is a set of servers that receive forwarded requests and are defined in the backend section of the configuration. - -### Troubleshoot the alert - -- Check the HAProxy configuration file for errors - - Making changes in the configuration file may introduce errors. Always validate the correctness of the configuration file. In most Linux distros, you can run the following check: - - ``` - haproxy -c -f /etc/haproxy/haproxy.cfg - ``` - -- Check the HAProxy service for errors - - 1. Use `journalctl` and inspect the log: - - ``` - journalctl -u haproxy.service --reverse - ``` - -- Check the HAProxy log - - 1. By default, HAProxy logs under `/var/log/haproxy.log`: - - ``` - cat /var/log/haproxy.log | grep 'emerg\|alert\|crit\|err\|warning\|notice' - ``` - - You can also search for log messages with `info` and `debug` tags. - -- Investigate the backend servers - - 1. Verify that the backend servers are online and accepting connections. - 2. Check the backend server logs for any errors or issues. - 3. Ensure that firewall rules or security groups are not blocking traffic from HAProxy to the backend servers. - -- Review the HAProxy load balancing algorithm and configuration - - 1. Analyze the load balancing algorithm used in the configuration to ensure it is suitable for your setup. - 2. Check for any misconfigurations, such as incorrect server addresses, ports, or weights. - -### Useful resources - -1. [The Four Essential Sections of an HAProxy Configuration](https://www.haproxy.com/blog/the-four-essential-sections-of-an-haproxy-configuration/) -2. [HAProxy Explained in DigitalOcean](https://www.digitalocean.com/community/tutorials/an-introduction-to-haproxy-and-load-balancing-concepts)
\ No newline at end of file diff --git a/health/guides/hdfs/hdfs_capacity_usage.md b/health/guides/hdfs/hdfs_capacity_usage.md deleted file mode 100644 index 666dcdc2..00000000 --- a/health/guides/hdfs/hdfs_capacity_usage.md +++ /dev/null @@ -1,42 +0,0 @@ -### Understand the alert - -This alert calculates the percentage of used space capacity across all DataNodes in the Hadoop Distributed File System (HDFS). If you receive this alert, it means that your HDFS DataNodes space capacity utilization is high. - -The alert is triggered into warning when the percentage of used space capacity across all DataNodes is between 70-80% and in critical when it is between 80-90%. - -### Troubleshoot the alert - -Data is priceless. Before you perform any action, make sure that you have taken any necessary backup steps. Netdata is not liable for any loss or corruption of any data, database, or software. - -#### Check your Disk Usage across the cluster - -1. Inspect the Disk Usage for each DataNode: - - ``` - root@netdata # hadoop dfsadmin -report - ``` - - If all the DataNodes are in Disk pressure, you should consider adding more disk space. Otherwise, you can perform a balance of data between the DataNodes. - -2. Perform a balance: - - ``` - root@netdata # hdfs balancer –threshold 15 - ``` - - This means that the balancer will balance data by moving blocks from over-utilized to under-utilized nodes, until each DataNode’s disk usage differs by no more than plus or minus 15 percent. - -#### Investigate high disk usage - -1. Review your Hadoop applications, jobs, and scripts that write data to HDFS. Identify the ones with excessive disk usage or logging. - -2. Optimize or refactor these applications, jobs, or scripts to reduce their disk usage. - -3. Delete any unnecessary or temporary files from HDFS, if safe to do so. - -4. Consider data compression or deduplication strategies, if applicable, to reduce storage usage in HDFS. - -### Useful resources - -1. [Apache Hadoop on Wikipedia](https://en.wikipedia.org/wiki/Apache_Hadoop) -2. [HDFS architecture](https://hadoop.apache.org/docs/r1.2.1/hdfs_design.html)
\ No newline at end of file diff --git a/health/guides/hdfs/hdfs_dead_nodes.md b/health/guides/hdfs/hdfs_dead_nodes.md deleted file mode 100644 index 9c65a0c6..00000000 --- a/health/guides/hdfs/hdfs_dead_nodes.md +++ /dev/null @@ -1,44 +0,0 @@ -### Understand the Alert - -The Netdata Agent monitors the number of DataNodes that are currently dead. Receiving this alert indicates that there are dead DataNodes in your HDFS cluster. The NameNode characterizes a DataNode as dead if no heartbeat message is exchanged for approximately 10 minutes. Any data that was registered to a dead DataNode is not available to HDFS anymore. - -This alert is triggered into critical when the number of dead DataNodes is 1 or more. - -### Troubleshoot the Alert - -1. Fix corrupted or missing blocks. - - ``` - root@netdata # hadoop dfsadmin -report - ``` - - Inspect the output and check which DataNode is dead. - -2. Connect to the DataNode and check the log of the DataNode. You can also check for errors in the system services. - - ``` - root@netdata # systemctl status hadoop - ``` - - Restart the service if needed. - - -3. Verify that the network connectivity between NameNode and DataNodes is functional. You can use tools like `ping` and `traceroute` to confirm the connectivity. - -4. Check the logs of the dead DataNode(s) for any issues. Log location may vary depending on your installation, but you can typically find them in the `/var/log/hadoop-hdfs/` directory. Analyze the logs to identify any errors or issues that may have caused the DataNode to become dead. - - ``` - root@netdata # tail -f /var/log/hadoop-hdfs/hadoop-hdfs-datanode-*.log - ``` - -5. If the DataNode service is not running or has crashed, attempt to restart it. - - ``` - root@netdata # systemctl restart hadoop - ``` - -### Useful resources - -1. [Hadoop Commands Guide](https://hadoop.apache.org/docs/current/hadoop-project-dist/hadoop-common/CommandsManual.html) - -Remember that troubleshooting and resolving issues, especially on a production environment, requires a good understanding of the system and its architecture. Proceed with caution and always ensure data backup and environmental safety before performing any action. diff --git a/health/guides/hdfs/hdfs_missing_blocks.md b/health/guides/hdfs/hdfs_missing_blocks.md deleted file mode 100644 index 49002880..00000000 --- a/health/guides/hdfs/hdfs_missing_blocks.md +++ /dev/null @@ -1,47 +0,0 @@ -### Understand the alert - -This alert monitors the number of missing blocks in a Hadoop Distributed File System (HDFS). If you receive this alert, it means that there is at least one missing block in one of the DataNodes. This issue could be caused by a problem with the underlying storage or filesystem of a DataNode. - -### Troubleshooting the alert - -#### Fix corrupted or missing blocks - -Before you perform any action, make sure that you have taken any necessary backup steps. Netdata is not liable for any loss or corruption of any data, database, or software. - -1. Identify which files are facing issues. - -```sh -root@netdata # hdfs fsck -list-corruptfileblocks -``` - -Inspect the output and track the path(s) to the corrupted files. - -2. Determine where the file's blocks might live. If the file is larger than your block size, it consists of multiple blocks. - -```sh -root@netdata # hdfs fsck <path_to_corrupted_file> -locations -blocks -files -``` - -This command will print out locations for every "problematic" block. - -3. Search in the corresponding DataNode and the NameNode's logs for the machine or machines on which the blocks lived. Try looking for filesystem errors on those machines. Use `fsck`. - -4. If there are files or blocks that you cannot fix, you must delete them so that the HDFS becomes healthy again. - -- For a specific file: - -```sh -root@netdata # hdfs fs -rm <path_to_file_with_unrecoverable_blocks> -``` - -- For all the "problematic" files: - -```sh -hdfs fsck / -delete -``` - -### Useful resources - -1. [Apache Hadoop on Wikipedia](https://en.wikipedia.org/wiki/Apache_Hadoop) -2. [HDFS Architecture](https://hadoop.apache.org/docs/r1.2.1/hdfs_design.html) -3. [Man Pages of fsck](https://linux.die.net/man/8/fsck)
\ No newline at end of file diff --git a/health/guides/hdfs/hdfs_num_failed_volumes.md b/health/guides/hdfs/hdfs_num_failed_volumes.md deleted file mode 100644 index bdb23f24..00000000 --- a/health/guides/hdfs/hdfs_num_failed_volumes.md +++ /dev/null @@ -1,44 +0,0 @@ -### Understand the alert - -This alert is triggered when the number of failed volumes in your Hadoop Distributed File System (HDFS) cluster increases. A failed volume may be due to hardware failure or misconfiguration, such as duplicate mounts. When a single volume fails on a DataNode, the entire node may go offline depending on the `dfs.datanode.failed.volumes.tolerated` setting for your cluster. This can lead to increased network traffic and potential performance degradation as the NameNode needs to copy any under-replicated blocks lost on that node. - -### Troubleshoot the alert - -#### 1. Identify which DataNode has a failing volume - -Use the `dfsadmin -report` command to identify the DataNodes that are offline: - -```bash -root@netdata # dfsadmin -report -``` - -Find any nodes that are not reported in the output of the command. If all nodes are listed, you'll need to run the next command for each DataNode. - -#### 2. Review the volumes status - -Use the `hdfs dfsadmin -getVolumeReport` command, specifying the DataNode hostname and port: - -```bash -root@netdata # hdfs dfsadmin -getVolumeReport datanodehost:port -``` - -#### 3. Inspect the DataNode logs - -Connect to the affected DataNode and check its logs using `journalctl -xe`. If you have the Netdata Agent running on the DataNodes, you should be able to identify the problem. You may also receive alerts about the disks and mounts on this system. - -#### 4. Take necessary actions - -Based on the information gathered in the previous steps, take appropriate actions to resolve the issue. This may include: - -- Repairing or replacing faulty hardware. -- Fixing misconfigurations such as duplicate mounts. -- Ensuring that the HDFS processes are running on the affected DataNode. -- Ensuring that the affected DataNode is properly communicating with the NameNode. - -**Note**: When working with HDFS, it's essential to have proper backups of your data. Netdata is not responsible for any loss or corruption of data, database, or software. - -### Useful resources - -1. [Apache Hadoop on Wikipedia](https://en.wikipedia.org/wiki/Apache_Hadoop) -2. [HDFS architecture](https://hadoop.apache.org/docs/r1.2.1/hdfs_design.html) -3. [HDFS 3.3.1 commands guide](https://hadoop.apache.org/docs/current/hadoop-project-dist/hadoop-hdfs/HDFSCommands.html) diff --git a/health/guides/hdfs/hdfs_stale_nodes.md b/health/guides/hdfs/hdfs_stale_nodes.md deleted file mode 100644 index 71ca50f9..00000000 --- a/health/guides/hdfs/hdfs_stale_nodes.md +++ /dev/null @@ -1,46 +0,0 @@ -### Understand the alert - -The `hdfs_stale_nodes` alert is triggered when there is at least one stale DataNode in the Hadoop Distributed File System (HDFS) due to missed heartbeats. A stale DataNode is one that has not been reachable for `dfs.namenode.stale.datanode.interval` (default is 30 seconds). Stale DataNodes are avoided and marked as the last possible target for a read or write operation. - -### Troubleshoot the alert - -1. Identify the stale node(s) - - Run the following command to generate a report on the state of the HDFS cluster: - - ``` - hadoop dfsadmin -report - ``` - - Inspect the output and look for any stale DataNodes. - -2. Check the DataNode logs and system services status - - Connect to the identified stale DataNode and check the log of the DataNode for any issues. Also, check the status of the system services. - - ``` - systemctl status hadoop - ``` - - If required, restart the HDFS service: - - ``` - systemctl restart hadoop - ``` - -3. Monitor the HDFS cluster - - After resolving issues identified in the logs or restarting the service, continue to monitor the HDFS cluster to ensure the problem is resolved. Re-run the `hadoop dfsadmin -report` command to check if the stale DataNode status has been cleared. - -4. Ensure redundant data storage - - To protect against data loss or unavailability, HDFS stores data in multiple nodes, providing fault tolerance. Make sure that the replication factor for your HDFS cluster is set correctly, typically with a factor of 3, so that data is stored on three different nodes. A higher replication factor will increase data redundancy and reliability. - -5. Review HDFS cluster configuration - - Examine the HDFS cluster's configuration settings to ensure that they are appropriate for your specific use case and hardware setup. Identifying performance bottlenecks, such as slow or unreliable network connections, can help avoid stale DataNodes in the future. - -### Useful resources - -1. [Apache Hadoop on Wikipedia](https://en.wikipedia.org/wiki/Apache_Hadoop) -2. [HDFS Architecture](https://hadoop.apache.org/docs/r1.2.1/hdfs_design.html)
\ No newline at end of file diff --git a/health/guides/httpcheck/httpcheck_web_service_bad_content.md b/health/guides/httpcheck/httpcheck_web_service_bad_content.md deleted file mode 100644 index 0a5961ca..00000000 --- a/health/guides/httpcheck/httpcheck_web_service_bad_content.md +++ /dev/null @@ -1,30 +0,0 @@ -### Understand the alert - -The Netdata Agent monitors your HTTP endpoints. You can specify endpoints that the agent will monitor in Agent's Go module under `go.d/httpcheck.conf`. You can also specify the expected response pattern. This HTTP endpoint will send in the `response_match` option. If the endpoint's response does not match the `response_match` pattern, then the Agent marks the response as unexpected. - -The Netdata Agent calculates the average ratio of HTTP responses with unexpected content over the last 5 minutes. - -This alert is escalated to warning if the percentage of unexpected content is greater than 10% and then raised to critical if it is greater than 40%. - -### Troubleshoot the alert - -Check the actual response and the expected response. - -1. Try to implement a request with a verbose result: - -``` -curl -v <your_http_endpoint>:<port>/<path> -``` - -2. Compare it with the expected response. - -Check your configuration under `go.d/httpcheck.conf`: - -``` -cd /etc/netdata # Replace this path with your Netdata config directory -sudo ./edit-config go.d/httpcheck.conf -``` - -### Useful resources - -1. [HTTP endpoint monitoring with Netdata](https://learn.netdata.cloud/docs/agent/collectors/go.d.plugin/modules/httpcheck)
\ No newline at end of file diff --git a/health/guides/httpcheck/httpcheck_web_service_bad_status.md b/health/guides/httpcheck/httpcheck_web_service_bad_status.md deleted file mode 100644 index bd9c1434..00000000 --- a/health/guides/httpcheck/httpcheck_web_service_bad_status.md +++ /dev/null @@ -1,21 +0,0 @@ -### Understand the alert - -The `httpcheck_web_service_bad_status` alert is generated by the Netdata Agent when monitoring the status of an HTTP web service using the `httpcheck` collector. This alert is triggered when the HTTP web service returns a non-successful status code (anything other than 2xx or 3xx), indicating that there is an issue with the web service, preventing it from responding to requests as expected. - -### Troubleshoot the alert - -1. **Verify the target URL**: Ensure that the target URL configured in the `httpcheck` collector is correct and accessible. Check for any typos or incorrect domain names. - -2. **Check the actual response status and the expected response status**: Try to implement a request with a verbose result: - -``` -root@netdata # curl -v <your_http_endpoint>:<port>/<path> -``` - -3. **Verify server resources**: Ensure that your server has enough resources (CPU, RAM, disk space) to handle the current workload. High resource utilization can lead to web service issues. You can use Netdata's dashboard to monitor the server resources in real-time. - -4. **Check server configuration**: Review the configuration files of the web service for any misconfigurations or settings that may be causing the issue. For example, incorrect permissions, wrong file paths, or improper configurations can lead to bad status codes. - -### Useful resources - -1. [HTTP endpoint monitoring with Netdata](https://learn.netdata.cloud/docs/agent/collectors/go.d.plugin/modules/httpcheck) diff --git a/health/guides/httpcheck/httpcheck_web_service_no_connection.md b/health/guides/httpcheck/httpcheck_web_service_no_connection.md deleted file mode 100644 index 0f36803f..00000000 --- a/health/guides/httpcheck/httpcheck_web_service_no_connection.md +++ /dev/null @@ -1,35 +0,0 @@ -### Understand the alert - -This alert monitors the percentage of failed HTTP requests to a specific URL in the last 5 minutes. If you receive this alert, it means that your web service experienced connection issues. - -### Troubleshoot the alert - -1. Verify HTTP service status - -Check if the web service is running and accepting requests. If the service is down, restart it and monitor the situation. - -2. Review server logs - -Examine the logs of the web server hosting the HTTP service. Look for any errors or warning messages that may provide more information about the cause of the connection issues. - -3. Check network connectivity - -If the server hosting the HTTP service is experiencing connectivity issues, it can lead to failed requests. Ensure that the server has stable network connectivity. - -4. Monitor server resources - -Inspect the server's resource usage to check if it is running out of resources, such as CPU, memory, or disk space. If the server is running low on resources, it can cause the HTTP service to malfunction. In this case, free up resources or upgrade the server. - -5. Review client connections - -It is also possible that the clients are having connectivity issues. Make sure that the clients are in a good network condition and can connect to the server without any issues. - -6. Test the HTTP service - -Perform HTTP requests to the service manually or using monitoring tools to measure response times and verify if the issue persists. - -### Useful resources - -1. [Apache Log Files](https://httpd.apache.org/docs/2.4/logs.html) -2. [NGINX Log Files](https://docs.nginx.com/nginx/admin-guide/monitoring/logging/) -3. [HTTP status codes](https://developer.mozilla.org/en-US/docs/Web/HTTP/Status) diff --git a/health/guides/httpcheck/httpcheck_web_service_slow.md b/health/guides/httpcheck/httpcheck_web_service_slow.md deleted file mode 100644 index aad2cc8d..00000000 --- a/health/guides/httpcheck/httpcheck_web_service_slow.md +++ /dev/null @@ -1,18 +0,0 @@ -### Understand the alert - -The Netdata Agent monitors your HTTP endpoints. You can specify endpoints the Agent will monitor in the Agent's Go module under `go.d/httpcheck.conf`. -The Agent calculates the average response time for every HTTP request made to the endpoint being monitored per hour. The Agent also calculates the average response time in a 3-min window. - -The Netdata Agent compares these two (average) values. If there is a significant increase in 3-min average, then it will trigger a warning alert when the response time 3-min average is at least twice as much as 1-hour average. The alert will escalate to critical when the response time 3-min average reaches three times the average amount per hour. - -### Troubleshoot the alert - -To troubleshoot this issue, check for: - -- Network congestion in your system's network and/or in the remote endpoint's network. -- If the endpoint is managed by you, then check the system load. - -### Useful resources - -1. [HTTP endpoint monitoring with Netdata](https://learn.netdata.cloud/docs/agent/collectors/go.d.plugin/modules/httpcheck) - diff --git a/health/guides/httpcheck/httpcheck_web_service_timeouts.md b/health/guides/httpcheck/httpcheck_web_service_timeouts.md deleted file mode 100644 index 03e300d1..00000000 --- a/health/guides/httpcheck/httpcheck_web_service_timeouts.md +++ /dev/null @@ -1,39 +0,0 @@ -### Understand the alert - -This alert is triggered when the percentage of timed-out HTTP requests to a specific URL goes above a certain threshold in the last 5 minutes. The alert levels are determined by the following percentage thresholds: - -- Warning: 10% to 40% -- Critical: 40% or higher - -The alert is designed to notify you about potential issues with the accessed HTTP endpoint. - -### What does HTTP request timeout mean? - -An HTTP request timeout occurs when a client (such as a web browser) sends a request to a webserver but does not receive a response within the specified time period. This can lead to a poor user experience, as the user may be unable to access the requested content or services. - -### Troubleshoot the alert - -- Verify the issue - -Check the HTTP endpoint to see if it is responsive and reachable. You can use tools like `curl` or online services like [https://www.isitdownrightnow.com/](https://www.isitdownrightnow.com/) to check the availability of the website or service. - -- Analyze server logs - -Examine the server logs for any error messages or unusual patterns of behavior that may indicate a root cause for the timeout issue. For web servers such as Apache or Nginx, look for log files located in the `/var/log` directory. - -- Check resource usage - -High resource usage, such as CPU, memory, or disk I/O, can cause HTTP request timeouts. Use tools like `top`, `vmstat`, or `iotop` to identify resource-intensive processes. Address any performance bottlenecks by resizing the server, optimizing performance, or distributing the load across multiple servers. - -- Review server configurations - -Make sure your web server configurations are optimized for performance. For instance: - - 1. Ensure that the `KeepAlive` feature is enabled and properly configured. - 2. Make sure that your server's timeout settings are appropriate for the type of traffic and workload it experiences. - 3. Confirm that your server is correctly configured for the number of concurrent connections it handles. - -- Verify network configurations - -Examine the network configurations for potential issues that can lead to HTTP request timeouts. Check for misconfigured firewalls or faulty load balancers that may be interfering with traffic to the HTTP endpoint. - diff --git a/health/guides/httpcheck/httpcheck_web_service_unreachable.md b/health/guides/httpcheck/httpcheck_web_service_unreachable.md deleted file mode 100644 index bb6f51bf..00000000 --- a/health/guides/httpcheck/httpcheck_web_service_unreachable.md +++ /dev/null @@ -1,33 +0,0 @@ -### Understand the alert - -The Netdata agent monitors your HTTP endpoints. You can specify endpoints the Agent will monitor in the Agent's Go module under `go.d/httpcheck.conf`. - -If your system fails to connect to your endpoint, or if the request to that endpoint times out, then the Agent will mark the requests and log them as "unreachable". - -The Netdata Agent calculates the ratio of these requests over the last 5 minutes. This alert is escalated to warning when the ratio is greater than 10% and then raised to critical when it is greater than 40%. - -### Troubleshoot the alert - -To troubleshoot this error, check the following: - -- Verify that your system has access to the particular endpoint. - - - Check for basic connectivity to known hosts. - - Make sure that requests and replies both to and from the endpoint are allowed in the firewall settings. Ensure they're allowed on both your end as well as the endpoint's side. - -- Verify that your DNS can resolve endpoints. - - Check your current DNS (for example in linux you can use the host command): - - ``` - host -v <your_endpoint> - ``` - - - If the HTTP endpoint is suppose to be public facing endpoint, try an alternative DNS (for example Cloudflare's DNS): - - ``` - host -v <your_endpoint> 1.1.1.1 - ``` - -### Useful resources - -1. [HTTP endpoint monitoring with Netdata](https://learn.netdata.cloud/docs/agent/collectors/go.d.plugin/modules/httpcheck)
\ No newline at end of file diff --git a/health/guides/httpcheck/httpcheck_web_service_up.md b/health/guides/httpcheck/httpcheck_web_service_up.md deleted file mode 100644 index be17fadd..00000000 --- a/health/guides/httpcheck/httpcheck_web_service_up.md +++ /dev/null @@ -1,44 +0,0 @@ -### Understand the alert - -The `httpcheck_web_service_up` alert monitors the liveness status of an HTTP endpoint by checking its response over the past minute. If the success percentage is below 75%, this alert will trigger, indicating that the web service may be experiencing issues. - -### What does an HTTP endpoint liveness status mean? - -An HTTP endpoint is like a door where clients make requests to access web services or APIs. The liveness status reveals whether the service is available and responding to client requests. Ideally, this success percentage should be near 100%, indicating that the endpoint is consistently accessible. - -### Troubleshoot the alert - -1. Check logs for any errors or warnings related to the web server or application. - - Depending on your web server or application, look for log files that may provide insights into the causes of the issues. Some common log locations are: - - - Apache: `/var/log/apache2/` - - Nginx: `/var/log/nginx/` - - Node.js: Check your application-specific log location. - -2. Examine server resources such as CPU, memory, and disk usage. - - High resource usage can cause web services to become slow or unresponsive. Use system monitoring tools like `top`, `htop`, or `free` to check the resource usage. - -3. Test the HTTP endpoint manually. - - You can use tools like `curl`, `wget`, or `httpie` to send requests to the HTTP endpoint and inspect the responses. Examine the response codes, headers, and contents to spot any problems. - - Example using `curl`: - - ``` - curl -I http://example.com/some/endpoint - ``` - -4. Check for network issues between the monitoring agent and the HTTP endpoint. - - Use tools like `ping`, `traceroute`, or `mtr` to check for network latency or packet loss between the monitoring agent and the HTTP endpoint. - -5. Review the web server or application configuration. - - Ensure the web server and application configurations are correct and not causing issues. Look for misconfigurations, incorrect settings, or other issues that may affect the liveness of the HTTP endpoint. - -### Useful resources - -1. [Monitoring Linux Performance with vmstat and iostat](https://www.tecmint.com/linux-performance-monitoring-with-vmstat-and-iostat-commands/) -2. [16 Useful Bandwidth Monitoring Tools to Analyze Network Usage in Linux](https://www.tecmint.com/linux-network-bandwidth-monitoring-tools/) diff --git a/health/guides/ioping/ioping_disk_latency.md b/health/guides/ioping/ioping_disk_latency.md deleted file mode 100644 index cc4fdc69..00000000 --- a/health/guides/ioping/ioping_disk_latency.md +++ /dev/null @@ -1,46 +0,0 @@ -### Understand the alert - -This alert presents the average `I/O latency` over the last 10 seconds. `I/O latency` is the time that is required to complete a single I/O operation on a block device. - -This alert might indicate that your disk is under high load, or that the disk is slow. - -### Troubleshoot the alert - -1. Check per-process I/O usage: - - Use `iotop` to see the processes that are the main I/O consumers: - - ``` - sudo iotop - ``` - - If you don't have `iotop` installed, then [install it](https://www.tecmint.com/iotop-monitor-linux-disk-io-activity-per-process/) - -2. Analyze the running processes: - - Investigate the top I/O consumers and determine if these processes are expected to consume that much I/O, or if there might be an issue with these processes. - -3. Minimize the load by closing any unnecessary main consumer processes: - - If you find that any unnecessary or unexpected processes are heavily utilizing your disk, try stopping or closing those processes to reduce the load on the disk. Always double-check if the process you want to close is necessary. - -4. Verify your disk health: - - Make sure your disk is not facing any hardware issues or failures. For this, you can use the `smartmontools` package, which contains the `smartctl` utility. If it's not installed, you can [install it](https://www.smartmontools.org/wiki/Download). - - To check the disk health, run: - - ``` - sudo smartctl -a /dev/sdX - ``` - - Replace `/dev/sdX` with the correct disk device identifier (for example, `/dev/sda`). - -5. Consider upgrading your disk: - - If your disk consistently experiences high latency and you have already addressed any performance issues with the running processes, consider upgrading your disk to a faster drive (e.g., replace an HDD with an SSD). - -### Useful resources - -1. [iotop - Monitor Linux Disk I/O Activity](https://www.tecmint.com/iotop-monitor-linux-disk-io-activity-per-process/) -2. [smartmontools - SMART monitoring tools](https://www.smartmontools.org/) diff --git a/health/guides/ipc/semaphore_arrays_used.md b/health/guides/ipc/semaphore_arrays_used.md deleted file mode 100644 index d12dacd4..00000000 --- a/health/guides/ipc/semaphore_arrays_used.md +++ /dev/null @@ -1,46 +0,0 @@ -### Understand the alert - -This alarm monitors the percentage of used `System V IPC semaphore arrays (sets)`. If you receive this alert, it means that your system has a high utilization of `IPC semaphore arrays`, which can affect application performance. - -### Troubleshoot the alert - -1. Check the current usage of semaphore arrays - - Use the `ipcs -u` command to display a summary of the current usage of semaphore arrays on your system. Look for the "allocated semaphores" section, which indicates the number of semaphore arrays being used. - - ``` - ipcs -u - ``` - -2. Identify processes using semaphore arrays - - Use the `ipcs -s` command to list all active semaphore arrays and their associated process IDs (PIDs). This information can help you identify which processes are using semaphore arrays. - - ``` - ipcs -s - ``` - -3. Investigate and optimize processes using semaphore arrays - - Based on the information from the previous step, investigate the processes that are using semaphore arrays. If any of these processes can be optimized or terminated to free up semaphore arrays, do so carefully after ensuring that they are not critical to your system. - -4. Adjust the semaphore limit on your system - - If the semaphore array usage is still high after optimizing processes, you may need to increase the semaphore limit on your system. As mentioned earlier, you can adjust the limit in the `/proc/sys/kernel/sem` file. - - ``` - vi /proc/sys/kernel/sem - ``` - - Edit the fourth field to increase the max semaphores limit. Save the file and exit. To apply the changes, run: - - ``` - sysctl -p - ``` - - Please note that increasing the limit might consume more system resources. Monitor your system closely to ensure that it remains stable after making these changes. - -### Useful resources - -1. [Interprocess Communication](https://docs.oracle.com/cd/E19455-01/806-4750/6jdqdfltn/index.html) -2. [IPC: Semaphores](https://users.cs.cf.ac.uk/Dave.Marshall/C/node26.html) diff --git a/health/guides/ipc/semaphores_used.md b/health/guides/ipc/semaphores_used.md deleted file mode 100644 index 145ef0ad..00000000 --- a/health/guides/ipc/semaphores_used.md +++ /dev/null @@ -1,48 +0,0 @@ -### Understand the alert - -This alert monitors the percentage of allocated `System V IPC semaphores`. If you receive this alert, it means that your system is experiencing high IPC semaphore utilization, and a lack of available semaphores can affect application performance. - -### Troubleshoot the alert - -1. Identify processes using IPC semaphores - - You can use the `ipcs` command to display information about allocated semaphores. Run the following command to display a list of active semaphores: - - ``` - ipcs -s - ``` - - The output will show the key, ID, owner's UID, permissions, and other related information for each semaphore. - -2. Analyze process usage of IPC semaphores - - You can use `ps` or `top` commands to analyze which processes are using the IPC semaphores. This can help you identify if any process is causing high semaphore usage. - - ``` - ps -eo pid,cmd | grep [process-name] - ``` - - Replace `[process-name]` with the name of the process you suspect is related to the semaphore usage. - -3. Adjust semaphore limits if necessary - - If you determine that the high semaphore usage is a result of an inadequately configured limit, you can update the limits using the following steps: - - - Check the current semaphore limits as mentioned earlier, using the `ipcs -ls` command. - - To increase the limit to a more appropriate value, edit the `/proc/sys/kernel/sem` file. The second field in the file represents the maximum number of semaphores that can be allocated per array. - - ``` - echo "32000 64000 1024000000 500" > /proc/sys/kernel/sem - ``` - - This command doubles the number of semaphores per array. Make sure to adjust the value according to your system requirements. - -4. Monitor semaphore usage after changes - - After making the necessary changes, continue to monitor semaphore usage to ensure that the changes were effective in resolving the issue. If the issue persists, further investigation may be required to identify the root cause. - -### Useful resources - -1. [Interprocess Communication](https://docs.oracle.com/cd/E19455-01/806-4750/6jdqdfltn/index.html) -2. [IPC: Semaphores](https://users.cs.cf.ac.uk/Dave.Marshall/C/node26.html) -3. [Linux Kernel Documentation - IPC Semaphores](https://www.kernel.org/doc/Documentation/ipc/semaphore.txt)
\ No newline at end of file diff --git a/health/guides/ipfs/ipfs_datastore_usage.md b/health/guides/ipfs/ipfs_datastore_usage.md deleted file mode 100644 index 65c84c8b..00000000 --- a/health/guides/ipfs/ipfs_datastore_usage.md +++ /dev/null @@ -1,53 +0,0 @@ -### Understand the alert - -This alert is related to the InterPlanetary File System (IPFS) distributed file system. It calculates the percentage of used IPFS datastore space. When you receive this alert, it means that your IPFS storage repository space is highly utilized. - -### What does high datastore usage mean? - -High datastore usage means your IPFS storage is close to its capacity. This can affect the system's performance and stability. It is essential to keep an eye on IPFS storage usage to ensure smooth functioning and avoid running out of storage. - -### Troubleshoot the alert - -1. Check IPFS datastore usage - - To check the current IPFS datastore storage utilization, use the `ipfs repo stat` command: - - ``` - ipfs repo stat - ``` - -2. Identify large files and folders within the datastore - - To find the largest files and folders within your IPFS datastore, use the following command: - - ``` - ipfs pin ls --type=recursive | xargs -n1 -I {} echo -n "{} " && ipfs object stat {} | head -n1 | awk '{print $2}' - ``` - -3. Clean up IPFS datastore - - You can clean up and remove files that are no longer needed from your datastore using `ipfs pin rm` and `ipfs repo gc` commands. Be cautious while removing data to avoid losing any essential files. - - For example: - - ``` - ipfs pin rm <CID> - ipfs repo gc - ``` - -4. Consider increasing the size of your datastore - - If your datastore is continuously getting filled, you might need to increase its capacity to ensure smooth operation. This can be done by adjusting the `Datastore.StorageMax` configuration setting in the `config` file, which is typically located in the `.ipfs` folder. - - ``` - ipfs config Datastore.StorageMax <new size> - ``` - -5. Monitor datastore usage over time - - Regularly monitor your IPFS datastore usage using `ipfs repo stat` command to stay informed about its storage utilization and plan for any necessary adjustments. - -### Useful resources - -1. [IPFS Documentation](https://docs.ipfs.io/) -2. [IPFS resize datastore](https://github.com/ipfs/go-ipfs/blob/master/docs/config.md#datastorestoragemax) diff --git a/health/guides/ipmi/ipmi_events.md b/health/guides/ipmi/ipmi_events.md deleted file mode 100644 index 284abd4c..00000000 --- a/health/guides/ipmi/ipmi_events.md +++ /dev/null @@ -1,38 +0,0 @@ -### Understand the alert - -This alert is triggered when there are events recorded in the IPMI System Event Log (SEL). These events can range from critical, warning, and informational events. The alert enters a warning state when the number of events in the IPMI SEL exceeds 0, meaning there are recorded events that may require your attention. - -### What is IPMI SEL? - -The Intelligent Platform Management Interface (IPMI) System Event Log (SEL) is a log that records events related to hardware components and firmware on a server. These events can provide insight into potential issues with the server's hardware or firmware, which could impact the server's overall performance or stability. - -### Troubleshoot the alert - -1. **Use `ipmitool` to view the IPMI SEL events:** - - You can view the System Event Log using the `ipmitool` command. If you don't have `ipmitool` installed, you might need to install it first. Once `ipmitool` is installed, use the following command to list the SEL events: - - ``` - ipmitool sel list - ``` - - This command will display the recorded events with their respective timestamp, event ID, and a brief description. - -2. **Identify and resolve issues:** - - Analyze the events listed to identify any critical or warning events that may require immediate attention. You may need to refer to your server's hardware documentation or firmware updates to resolve the issue. - -3. **Clear the IPMI SEL events (optional):** - - If you have resolved the issues or if the events listed are no longer relevant, you can clear the IPMI SEL events using the following command: - - ``` - ipmitool sel clear - ``` - - Note: Clearing the SEL events may cause you to lose important historical information related to your hardware components and firmware. Be cautious when using this command, and ensure that you have resolved any critical issues before clearing the event log. - -### Useful resources - -1. [IPMITOOL GitHub Repository](https://github.com/ipmitool/ipmitool) -2. [IPMITOOL Manual Page](https://linux.die.net/man/1/ipmitool) diff --git a/health/guides/ipmi/ipmi_sensors_states.md b/health/guides/ipmi/ipmi_sensors_states.md deleted file mode 100644 index e7521a30..00000000 --- a/health/guides/ipmi/ipmi_sensors_states.md +++ /dev/null @@ -1,41 +0,0 @@ -### Understand the alert - -This alert is related to the IPMI (Intelligent Platform Management Interface) sensors in your system. IPMI is a hardware management interface used for monitoring server health and collecting information on various hardware components. The alert is triggered when any of the IPMI sensors detect conditions that are outside the normal operating range, and are in a warning or critical state. - -### Troubleshoot the alert - -1. Check IPMI sensor status: - - To check the status of IPMI sensors, you can use the `ipmi-sensors` command with appropriate flags. For instance: - - ``` - sudo ipmi-sensors --output-sensor-state - ``` - - This command will provide you with detailed information on the current state of each sensor, allowing you to determine which ones are in a warning or critical state. - -2. Analyze sensor data: - - Based on the output obtained in the previous step, identify the sensors that are causing the alert. Take note of their current values and thresholds. - - To obtain more detailed information, you can also use the `-v` (verbose) flag with the command: - - ``` - sudo ipmi-sensors -v --output-sensor-state - ``` - -3. Investigate the cause of the issue: - - Once you have identified the sensors in a non-nominal state, start investigating the root cause of the issue. This may involve checking the hardware components, system logs, or contacting your hardware vendor for additional support. - -4. Resolve the issue: - - Based on your investigation, take the necessary steps to resolve the issue. This may include replacing faulty hardware, addressing configuration errors, or applying firmware updates. - -5. Verify resolution: - - After addressing the issue, use the `ipmi-sensors` command to check the status of the affected sensors. Ensure that they have returned to the nominal state, and no additional warning or critical conditions are being reported. - -### Useful resources - -1. ["ipmi-sensors" manual page](https://www.gnu.org/software/freeipmi/manpages/man8/ipmi-sensors.8.html) diff --git a/health/guides/kubelet/kubelet_10s_pleg_relist_latency_quantile_05.md b/health/guides/kubelet/kubelet_10s_pleg_relist_latency_quantile_05.md deleted file mode 100644 index 595fae8a..00000000 --- a/health/guides/kubelet/kubelet_10s_pleg_relist_latency_quantile_05.md +++ /dev/null @@ -1,35 +0,0 @@ -### Troubleshoot the alert - -1. Check Kubelet logs - To diagnose issues with the PLEG relist process, look at the Kubelet logs. The following command can be used to fetch the logs from the affected node: - - ``` - kubectl logs -n kube-system <node_name> - ``` - - Look for any error messages related to PLEG or container runtime. - -2. Check container runtime status - Monitor the health status and performance of the container runtime (e.g. Docker, containerd) by running the appropriate commands like `docker ps`, `docker info` or `ctr version` and `ctr info`. Check container runtime logs for any issues as well. - -3. Inspect node resources - Verify if the node is overloaded or under excessive pressure by checking the CPU, memory, disk, and network resources. Use tools like `top`, `vmstat`, `df`, and `iostat`. You can also use the Kubernetes `kubectl top node` command to view resource utilization on your nodes. - -4. Limit maximum Pods per node - To avoid overloading nodes in your cluster, consider limiting the maximum number of Pods that can run on a single node. You can follow these steps to update the max Pods value: - - - Edit the Kubelet configuration file (usually located at `/etc/kubernetes/kubelet.conf` or `/var/lib/kubelet/config.yaml`) on the affected node. - - Change the value of the `maxPods` parameter to a more appropriate number. The default value is 110. - - Restart the Kubelet service with `systemctl restart kubelet` or `service kubelet restart`. - - Check the Kubelet logs to ensure the new value is effective. - -5. Check Pod eviction thresholds - Review the Pod eviction thresholds defined in the Kubelet configuration, which might cause Pods to be evicted due to resource pressure. Adjust the threshold values if needed. - -6. Investigate Pods causing high relisting latency - Analyze the Pods running on the affected node and identify any Pods that might be causing high PLEG relist latency. These could be Pods with a large number of containers or high resource usage. Consider optimizing or removing these Pods if they are not essential to your workload. - -### Useful resources - -1. [Kubelet CLI in Kubernetes official docs](https://kubernetes.io/docs/reference/command-line-tools-reference/kubelet/) -2. [PLEG mechanism explained in Redhat's blogspot](https://developers.redhat.com/blog/2019/11/13/pod-lifecycle-event-generator-understanding-the-pleg-is-not-healthy-issue-in-kubernetes/) diff --git a/health/guides/kubelet/kubelet_10s_pleg_relist_latency_quantile_09.md b/health/guides/kubelet/kubelet_10s_pleg_relist_latency_quantile_09.md deleted file mode 100644 index 05c03064..00000000 --- a/health/guides/kubelet/kubelet_10s_pleg_relist_latency_quantile_09.md +++ /dev/null @@ -1,58 +0,0 @@ -### Understand the alert - -This alert indicates that the average relisting latency of the Pod Lifecycle Event Generator (PLEG) in Kubelet over the last 10 seconds compared to the last minute (quantile 0.9) has increased significantly. This can cause the node to become unavailable (NotReady) due to a "PLEG is not healthy" event. - -### Troubleshoot the alert - -1. Check for high node resource usage - - First, ensure that the node does not have an overly high number of Pods. High resource usage could increase the PLEG relist latency, leading to poor Kubelet performance. You can check the current number of running Pods on a node using the following command: - - ``` - kubectl get pods --all-namespaces -o wide | grep <node-name> - ``` - -2. Check Kubelet logs for errors - - Inspect the Kubelet logs for any errors that might be causing the increased PLEG relist latency. You can check the Kubelet logs using the following command: - - ``` - sudo journalctl -u kubelet - ``` - - Look for any errors associated with PLEG or the container runtime, such as Docker or containerd. - -3. Check container runtime health - - If you find any issues in the Kubelet logs related to the container runtime, investigate the health of the container runtime, such as Docker or containerd, and its logs to identify any issues: - - - For Docker, you can check its health using: - - ``` - sudo docker info - sudo journalctl -u docker - ``` - - - For containerd, you can check its health using: - - ``` - sudo ctr version - sudo journalctl -u containerd - ``` - -4. Adjust the maximum number of Pods per node - - If you have configured your cluster manually (e.g., with `kubeadm`), you can update the value of max Pods in the Kubelet configuration file. The default file location is `/var/lib/kubelet/config.yaml`. Change the `maxPods` value according to your requirements and restart the Kubelet service: - - ``` - sudo systemctl restart kubelet - ``` - -5. Monitor the PLEG relist latency - - After making any necessary changes, continue monitoring the PLEG relist latency to ensure the issue has been resolved. - -### Useful resources - -1. [Kubelet CLI in Kubernetes official docs](https://kubernetes.io/docs/reference/command-line-tools-reference/kubelet/) -2. [PLEG mechanism explained in Redhat's blogspot](https://developers.redhat.com/blog/2019/11/13/pod-lifecycle-event-generator-understanding-the-pleg-is-not-healthy-issue-in-kubernetes#)
\ No newline at end of file diff --git a/health/guides/kubelet/kubelet_10s_pleg_relist_latency_quantile_099.md b/health/guides/kubelet/kubelet_10s_pleg_relist_latency_quantile_099.md deleted file mode 100644 index 76f1123e..00000000 --- a/health/guides/kubelet/kubelet_10s_pleg_relist_latency_quantile_099.md +++ /dev/null @@ -1,58 +0,0 @@ -### Understand the alert - -This alert is related to the Kubernetes Kubelet, which is the primary node agent responsible for ensuring containers run in a Pod. The alert specifically relates to the Pod Lifecycle Event Generator (PLEG) module, which is responsible for adjusting the container runtime state and maintaining the Pod's cache. When there is a significant increase in the relisting time for PLEG, you'll receive a `kubelet_10s_pleg_relist_latency_quantile_099` alert. - -### Troubleshoot the alert - -Follow the steps below to troubleshoot this alert: - -1. Check the container runtime health status - - If you are using Docker as the container runtime, run the following command: - - ``` - sudo docker info - ``` - - Check for any reported errors or issues. - - If you are using a different container runtime like containerd or CRI-O, refer to the respective documentation for health check commands. - -2. Check Kubelet logs for any errors. - - You can do this by running the following command: - - ``` - sudo journalctl -u kubelet -n 1000 - ``` - - Look for any relevant error messages or warnings in the output. - -3. Validate that the node is not overloaded with too many Pods. - - Run the following commands: - - ``` - kubectl get nodes - kubectl describe node <node_name> - ``` - - Adjust the max number of Pods per node if needed, by editing the Kubelet configuration file `/etc/systemd/system/kubelet.service.d/10-kubeadm.conf`, adding the `--max-pods=<NUMBER>` flag, and restarting Kubelet: - - ``` - sudo systemctl daemon-reload - sudo systemctl restart kubelet - ``` - -4. Check for issues related to the underlying storage or network. - - Inspect the Node's storage and ensure there are no I/O limitations or bottlenecks causing the increased latency. Also, check for network-related issues that could affect the communication between the Kubelet and the container runtime. - -5. Verify the performance and health of the Kubernetes API server. - - High workload on the API server could affect the Kubelet's ability to communicate and process Pod updates. Check the API server logs and metrics to find any performance bottlenecks or errors. - -### Useful resources - -1. [Kubelet CLI in Kubernetes official docs](https://kubernetes.io/docs/reference/command-line-tools-reference/kubelet/) -2. [PLEG mechanism explained in Redhat's blogspot](https://developers.redhat.com/blog/2019/11/13/pod-lifecycle-event-generator-understanding-the-pleg-is-not-healthy-issue-in-kubernetes#)
\ No newline at end of file diff --git a/health/guides/kubelet/kubelet_1m_pleg_relist_latency_quantile_05.md b/health/guides/kubelet/kubelet_1m_pleg_relist_latency_quantile_05.md deleted file mode 100644 index b448c4d9..00000000 --- a/health/guides/kubelet/kubelet_1m_pleg_relist_latency_quantile_05.md +++ /dev/null @@ -1,59 +0,0 @@ -### Understand the alert - -This alert is related to Kubernetes and is triggered when the average `Pod Lifecycle Event Generator (PLEG)` relisting latency over the last minute is higher than the expected threshold (quantile 0.5). If you receive this alert, it means that the kubelet is experiencing some latency issues, which may affect the scheduling and management of your Kubernetes Pods. - -### What is PLEG? - -The Pod Lifecycle Event Generator (PLEG) is a component within the kubelet responsible for keeping track of changes (events) to the Pod and updating the kubelet's internal status. This ensures that the kubelet can successfully manage and schedule Pods on the Kubernetes node. - -### What does relisting latency mean? - -Relisting latency refers to the time taken by the PLEG to detect, process, and update the kubelet about the events or changes in a Pod's lifecycle. High relisting latency can lead to delays in the kubelet reacting to these changes, which can affect the overall functioning of the Kubernetes cluster. - -### Troubleshoot the alert - -1. Check the kubelet logs for any errors or warnings related to PLEG: - - ``` - sudo journalctl -u kubelet - ``` - - Look for any logs related to PLEG delays, issues, or timeouts. - -2. Restart the kubelet if necessary: - - ``` - sudo systemctl restart kubelet - ``` - - Sometimes, restarting the kubelet can resolve sporadic latency issues. - -3. Monitor the Kubernetes node's resource usage (CPU, Memory, Disk) using `kubectl top nodes`: - - ``` - kubectl top nodes - ``` - - If the node's resource usage is too high, consider scaling your cluster or optimizing workloads. - -4. Check the overall health of your Kubernetes cluster: - - ``` - kubectl get nodes - kubectl get pods --all-namespaces - ``` - - These commands will help you identify any issues with other nodes or Pods in your cluster. - -5. Investigate the specific Pods experiencing latency in PLEG: - - ``` - kubectl describe pod <pod_name> -n <namespace> - ``` - - Look for any signs of the Pod being stuck in a pending state, startup issues, or container crashes. - -### Useful resources - -1. [Kubernetes Kubelet - PLEG](https://kubernetes.io/docs/concepts/overview/components/#kubelet) -2. [Kubernetes Troubleshooting](https://kubernetes.io/docs/tasks/debug-application-cluster/troubleshooting/) diff --git a/health/guides/kubelet/kubelet_1m_pleg_relist_latency_quantile_09.md b/health/guides/kubelet/kubelet_1m_pleg_relist_latency_quantile_09.md deleted file mode 100644 index 6c71f1cf..00000000 --- a/health/guides/kubelet/kubelet_1m_pleg_relist_latency_quantile_09.md +++ /dev/null @@ -1,45 +0,0 @@ -### Understand the alert - -This alert calculates the average Pod Lifecycle Event Generator (PLEG) relisting latency over the period of one minute, using the 0.9 quantile. This alert is related to Kubelet, a critical component in the Kubernetes cluster that ensures the correct running of containers inside pods. If you receive this alert, it means that the relisting latency has increased in your Kubernetes cluster, possibly affecting the performance of your workloads. - -### What does PLEG relisting latency mean? - -In Kubernetes, PLEG is responsible for keeping track of container lifecycle events, such as container start, stop, or pause. It periodically relists these events and updates the Kubernetes Pod status, ensuring the scheduler and other components know the correct state of the containers. An increased relisting latency could lead to slower updates on Pod status and overall degraded performance. - -### What does 0.9 quantile mean? - -The 0.9 quantile represents the value below which 90% of the latencies are. An alert based on the 0.9 quantile suggests that 90% of relisting latencies are below the specified threshold, meaning that the remaining 10% are experiencing increased latency, which could lead to issues in your cluster. - -### Troubleshoot the alert - -1. Check Kubelet logs for errors or warnings related to PLEG: - - Access the logs of the Kubelet component running on the affected node: - - ``` - sudo journalctl -u kubelet - ``` - -2. Monitor the overall performance of your Kubernetes cluster: - - Use `kubectl top nodes` to check the resource usage of your nodes and identify any bottlenecks, such as high CPU or memory consumption. - -3. Check the status of Pods: - - Use `kubectl get pods --all-namespaces` to check the status of all Pods in your cluster. Look for Pods in an abnormal state (e.g., Pending, CrashLoopBackOff, or Terminating), which could be related to high PLEG relisting latency. - -4. Analyze Pod logs for issues: - - Investigate the logs of the affected Pods to understand any issues with the container lifecycle events: - - ``` - kubectl logs <pod-name> -n <namespace> - ``` - -5. Review the Kubelet configuration: - - Ensure that your Kubelet configuration is set up correctly to handle your workloads. If necessary, adjust the settings to improve PLEG relisting performance. - -### Useful resources - -1. [Kubernetes Troubleshooting Guide](https://kubernetes.io/docs/tasks/debug-application-cluster/debug-cluster/) diff --git a/health/guides/kubelet/kubelet_1m_pleg_relist_latency_quantile_099.md b/health/guides/kubelet/kubelet_1m_pleg_relist_latency_quantile_099.md deleted file mode 100644 index 39e03162..00000000 --- a/health/guides/kubelet/kubelet_1m_pleg_relist_latency_quantile_099.md +++ /dev/null @@ -1,36 +0,0 @@ -### Understand the alert - -This alert calculates the average Pod Lifecycle Event Generator (PLEG) relisting latency over the last minute with a quantile of 0.99 in microseconds. If you receive this alert, it means that the Kubelet's PLEG latency is high, which can slow down your Kubernetes cluster. - -### What does PLEG latency mean? - -Pod Lifecycle Event Generator (PLEG) is a component of the Kubelet that watches for container events on the system and generates events for a pod's lifecycle. High PLEG latency indicates a delay in processing these events, which can cause delays in pod startup, termination, and updates. - -### Troubleshoot the alert - -1. Check the overall Kubelet performance and system load: - - a. Run `kubectl get nodes` to check the status of the nodes in your cluster. - b. Investigate the node with high PLEG latency using `kubectl describe node <NODE_NAME>` to view detailed information about resource usage and events. - c. Use monitoring tools like `top`, `htop`, or `vmstat` to check for high CPU, memory, or disk usage on the node. - -2. Look for problematic pods or containers: - - a. Run `kubectl get pods --all-namespaces` to check the status of all pods across namespaces. - b. Use `kubectl logs <POD_NAME> -n <NAMESPACE>` to check the logs of the pods in the namespace. - c. Investigate pods with high restart counts, crash loops, or other abnormal statuses. - -3. Verify Kubelet configurations and logs: - - a. Check the Kubelet configuration on the node. Look for any misconfigurations or settings that could cause high latency. - b. Check Kubelet logs using `journalctl -u kubelet` for more information about PLEG events and errors. - -4. Consider evaluating your workloads and scaling your cluster: - - a. If you have multiple nodes experiencing high PLEG latency or if the overall load on your nodes is consistently high, you might need to scale your cluster. - b. Evaluate your workloads and adjust resource requests and limits to make the best use of your available resources. - -### Useful resources - -1. [Understanding the Kubernetes Kubelet](https://kubernetes.io/docs/concepts/overview/components/#kubelet) -2. [Troubleshooting Kubernetes Clusters](https://kubernetes.io/docs/tasks/debug-application-cluster/troubleshooting/) diff --git a/health/guides/kubelet/kubelet_node_config_error.md b/health/guides/kubelet/kubelet_node_config_error.md deleted file mode 100644 index 695a479c..00000000 --- a/health/guides/kubelet/kubelet_node_config_error.md +++ /dev/null @@ -1,56 +0,0 @@ -### Understand the alert - -This alert, `kubelet_node_config_error`, is related to the Kubernetes Kubelet component. If you receive this alert, it means that there is a configuration-related error in one of the nodes in your Kubernetes cluster. - -### What is Kubernetes Kubelet? - -Kubernetes Kubelet is an agent that runs on each node in a Kubernetes cluster. It ensures that containers are running in a pod and manages the lifecycle of those containers. - -### Troubleshoot the alert - -1. Identify the node with the configuration error - - The alert should provide information about the node experiencing the issue. You can also use the `kubectl get nodes` command to list all nodes in your cluster and their statuses: - - ``` - kubectl get nodes - ``` - -2. Check the Kubelet logs on the affected node - - The logs for Kubelet can be found on each node of your cluster. Login to the affected node and check its logs using either `journalctl` or the log files in `/var/log/`. - - ``` - journalctl -u kubelet - ``` - or - ``` - sudo cat /var/log/kubelet.log - ``` - - Look for any error messages related to the configuration issue or other problems. - -3. Review and update the node configuration - - Based on the error messages you found in the logs, review the Kubelet configuration on the affected node. You might need to update the `kubelet-config.yaml` file or other related files specific to your setup. - - If any changes are made, don't forget to restart the Kubelet service on the affected node: - - ``` - sudo systemctl restart kubelet - ``` - -4. Check the health of the cluster - - After the configuration issue is resolved, make sure to check the health of your cluster using `kubectl`: - - ``` - kubectl get nodes - ``` - - Ensure that all nodes are in a `Ready` state and no errors are reported for the affected node. - -### Useful resources - -1. [Kubernetes Documentation: Kubelet](https://kubernetes.io/docs/concepts/overview/components/#kubelet) -2. [Kubernetes Troubleshooting Guide](https://kubernetes.io/docs/tasks/debug-application-cluster/troubleshooting/)
\ No newline at end of file diff --git a/health/guides/kubelet/kubelet_operations_error.md b/health/guides/kubelet/kubelet_operations_error.md deleted file mode 100644 index 870993b5..00000000 --- a/health/guides/kubelet/kubelet_operations_error.md +++ /dev/null @@ -1,61 +0,0 @@ -### Understand the alert - -This alert indicates that there is an increase in the number of Docker or runtime operation errors in your Kubernetes cluster's kubelet. A high number of errors can affect the overall stability and performance of your cluster. - -### What are Docker or runtime operation errors? - -Docker or runtime operation errors are errors that occur while the kubelet is managing container-related operations. These errors can be related to creating, starting, stopping, or deleting containers in your Kubernetes cluster. - -### Troubleshoot the alert - -1. Check kubelet logs: - - You need to inspect the kubelet logs of the affected nodes to find more information about the reported errors. SSH into the affected node and use the following command to stream the kubelet logs: - - ``` - journalctl -u kubelet -f - ``` - - Look for any error messages or patterns that could indicate a problem. - -2. Inspect containers' logs: - - If an error is related to a specific container, you can inspect the logs of that container using the following command: - - ``` - kubectl logs <container_name> -n <namespace> - ``` - - Replace `<container_name>` and `<namespace>` with the appropriate values. - -3. Check Docker or runtime logs: - - On the affected node, check Docker or container runtime logs for any issues: - - - For Docker, use: `journalctl -u docker` - - For containerd, use: `journalctl -u containerd` - - For CRI-O, use: `journalctl -u crio` - -4. Examine Kubernetes events: - - Run the following command to see recent events in your cluster: - - ``` - kubectl get events - ``` - - Look for any error messages or patterns that could indicate a kubelet or container-related problem. - -5. Verify resource allocation: - - Ensure that the node has enough resources available (such as CPU, memory, and disk space) for the containers running on it. You can use commands like `kubectl describe node <node_name>` or monitor your cluster resources using Netdata. - -6. Investigate other issues: - - If the above steps didn't reveal the cause of the errors, investigate other potential causes, such as network issues, filesystem corruption, hardware problems, or misconfigurations. - -### Useful resources - -1. [Kubernetes Debugging and Troubleshooting](https://kubernetes.io/docs/tasks/debug-application-cluster/debug-cluster/) -2. [Troubleshoot the Kubelet](https://kubernetes.io/docs/tasks/debug-application-cluster/debug-application-introspection/) -3. [Access Clusters Using the Kubernetes API](https://kubernetes.io/docs/tasks/administer-cluster/access-cluster-api/)
\ No newline at end of file diff --git a/health/guides/kubelet/kubelet_token_requests.md b/health/guides/kubelet/kubelet_token_requests.md deleted file mode 100644 index 28d70241..00000000 --- a/health/guides/kubelet/kubelet_token_requests.md +++ /dev/null @@ -1,44 +0,0 @@ -### Understand the alert - -This alert is related to Kubernetes Kubelet token requests. It monitors the number of failed `Token()` requests to an alternate token source. If you receive this alert, it means that your system is experiencing an increased rate of token request failures. - -### What does a token request in Kubernetes mean? - -In Kubernetes, tokens are used for authentication purposes when making requests to the API server. The Kubelet uses tokens to authenticate itself when it needs to access cluster information or manage resources on the API server. - -### Troubleshoot the alert - -- Investigate the reason behind the failed token requests - -1. Check the Kubelet logs for any error messages or warnings related to the token requests. You can use the following command to view the logs: - - ``` - journalctl -u kubelet - ``` - - Look for any entries related to `Token()` request failures or authentication issues. - -2. Verify the alternate token source configuration - - Review the Kubelet configuration file, usually located at `/etc/kubernetes/kubelet/config.yaml`. Check the `authentication` and `authorization` sections to ensure all the required settings have been correctly configured. - - Make sure that the specified alternate token source is available and working correctly. - -3. Check the API server logs - - Inspect the logs of the API server to identify any issues that may prevent the Kubelet from successfully requesting tokens. Use the following command to view the logs: - - ``` - kubectl logs -n kube-system kube-apiserver-<YOUR_NODE_NAME> - ``` - - Look for any entries related to authentication, especially if they are connected to the alternate token source. - -4. Monitor kubelet_token_requests metric - - Keep an eye on the `kubelet_token_requests` metric using the Netdata dashboard or a monitoring system of your choice. If the number of failed requests continues to increase, this might indicate an underlying issue that requires further investigation. - -### Useful resources - -1. [Understanding Kubernetes authentication](https://kubernetes.io/docs/reference/access-authn-authz/authentication/) -2. [Kubelet configuration reference](https://kubernetes.io/docs/reference/config-api/kubelet-config.v1beta1/) diff --git a/health/guides/linux_power_supply/linux_power_supply_capacity.md b/health/guides/linux_power_supply/linux_power_supply_capacity.md deleted file mode 100644 index 10ee32f4..00000000 --- a/health/guides/linux_power_supply/linux_power_supply_capacity.md +++ /dev/null @@ -1,18 +0,0 @@ -### Understand the alert - -The `linux_power_supply_capacity` alert is triggered when the remaining power supply capacity of a Linux system is low. A warning state occurs when the capacity falls below 10%, and a critical state occurs when it falls below 5%. This alert indicates that the system may run out of power and shut down soon. - -### Troubleshoot the alert - -1. **Restore power**: Connect the system to a power source to recharge the battery and prevent an unexpected shutdown. - -2. **Check battery health**: Inspect the health of the system's battery. If the capacity is consistently low or degrading, consider replacing the battery. - -3. **Consider a UPS**: If your system experiences frequent power interruptions, you may want to integrate an uninterruptible power supply (UPS) to provide temporary power and prevent system shutdowns. - -4. **Monitor power supply metrics**: Keep an eye on power supply metrics, such as remaining capacity and charge/discharge rate, to ensure the system is functioning optimally. - -### Useful resources - -1. [Battery Health Monitoring on Linux](https://wiki.archlinux.org/title/Laptop#Battery) -2. [Monitoring Power Supply on Linux](https://askubuntu.com/questions/69556/how-to-check-battery-status-using-terminal) diff --git a/health/guides/load/load_average_1.md b/health/guides/load/load_average_1.md deleted file mode 100644 index 1f33f8ff..00000000 --- a/health/guides/load/load_average_1.md +++ /dev/null @@ -1,51 +0,0 @@ -### Understand the alert - -This alarm calculates the system `load average` (`CPU` and `I/O` demand) over the period of one minute. If you receive this alarm, it means that your system is `overloaded`. - -### What does "load average" mean? - -The term `system load average` on a Linux machine, measures the **number of threads that are currently working and those waiting to work** (CPU, disk, uninterruptible locks). So simply stated: **System load average measures the number of threads that aren't idle.** - -### What does "overloaded" mean? - -Let's look at a single core CPU system and think of its core count as car lanes on a bridge. A car represents a process in this example: - -- On a 0.5 load average, the traffic on the bridge is fine, it is at 50% of its capacity. -- If the load average is at 1, then the bridge is full, and it is utilized 100%. -- If the load average gets to 2 (remember we are on a single core machine), it means that there is one car lane that is passing the bridge. However, there is **another** full car lane that waits to pass the bridge. - -So this is how you can imagine CPU load, but keep in mind that `load average` counts also I/O demand, so there is an analogous example there. - -### Troubleshoot the alert - -- Determine if the problem is CPU load or I/O load - -To get a report about your system statistics, use `vmstat` (or `vmstat 1`, to set a delay between updates in seconds): - -The `procs` column, shows: -r: The number of runnable processes (running or waiting for run time). -b: The number of processes blocked waiting for I/O to complete. - -- Check per-process CPU/disk usage to find the top consumers - -1. To see the processes that are the main CPU consumers, use the task manager program `top` like this: - - ``` - top -o +%CPU -i - ``` - -2. Use `iotop`: - `iotop` is a useful tool, similar to `top`, used to monitor Disk I/O usage, if you don't have it, then [install it](https://www.tecmint.com/iotop-monitor-linux-disk-io-activity-per-process/) - ``` - sudo iotop - ``` - -3. Minimize the load by closing any unnecessary main consumer processes. We strongly advise you to double-check if the process you want to close is necessary. - -### Useful resources - -1. [UNIX Load Average Part 1: How It Works](https://www.helpsystems.com/resources/guides/unix-load-average-part-1-how-it-works) -2. [UNIX Load Average Part 2: Not Your Average Average](https://www.helpsystems.com/resources/guides/unix-load-average-part-2-not-your-average-average) -3. [Understanding Linux CPU Load](https://scoutapm.com/blog/understanding-load-averages) -4. [Linux Load Averages: Solving the Mystery](https://www.brendangregg.com/blog/2017-08-08/linux-load-averages.html) -5. [Understanding Linux Process States](https://access.redhat.com/sites/default/files/attachments/processstates_20120831.pdf) diff --git a/health/guides/load/load_average_15.md b/health/guides/load/load_average_15.md deleted file mode 100644 index ba8b1e3e..00000000 --- a/health/guides/load/load_average_15.md +++ /dev/null @@ -1,55 +0,0 @@ -### Understand the alert - -This alarm calculates the system `load average` (CPU and I/O demand) over the period of fifteen minutes. If you receive this alarm, it means that your system is "overloaded." - -The alert gets raised into warning if the metric is 2 times the expected value and cleared if the value is 1.75 times the expected value. - -For further information on how our alerts are calculated, please have a look at our [Documentation](https://learn.netdata.cloud/docs/agent/health/reference#expressions). - -### What does "load average" mean? - -The term `system load average` on a Linux machine, measures the **number of threads that are currently working and those waiting to work** (CPU, disk, uninterruptible locks). So simply stated: **System load average measures the number of threads that aren't idle.** - -### What does "overloaded" mean? - -Let's look at a single core CPU system and think of its core count as car lanes on a bridge. A car represents a process in this example: - -- On a 0.5 load average, the traffic on the bridge is fine, it is at 50% of its capacity. -- If the load average is at 1, then the bridge is full, and it is utilized 100%. -- If the load average gets to 2 (remember we are on a single core machine), it means that there is one car lane that is passing the bridge. However, there is **another** full car lane that waits to pass the bridge. - -So this is how you can imagine CPU load, but keep in mind that `load average` counts also I/O demand, so there is an analogous example there. - -### Troubleshoot the alert - -- Determine if the problem is CPU load or I/O load - -To get a report about your system statistics, use `vmstat` (or `vmstat 1`, to set a delay between updates in seconds): - -The `procs` column, shows: -r: The number of runnable processes (running or waiting for run time). -b: The number of processes blocked waiting for I/O to complete. - -- Check per-process CPU/disk usage to find the top consumers - -1. To see the processes that are the main CPU consumers, use the task manager program `top` like this: - - ``` - top -o +%CPU -i - ``` - -2. Use `iotop`: - `iotop` is a useful tool, similar to `top`, used to monitor Disk I/O usage, if you don't have it, then [install it](https://www.tecmint.com/iotop-monitor-linux-disk-io-activity-per-process/) - ``` - sudo iotop - ``` - -3. Minimize the load by closing any unnecessary main consumer processes. We strongly advise you to double-check if the process you want to close is necessary. - -### Useful resources - -1. [UNIX Load Average Part 1: How It Works](https://www.helpsystems.com/resources/guides/unix-load-average-part-1-how-it-works) -2. [UNIX Load Average Part 2: Not Your Average Average](https://www.helpsystems.com/resources/guides/unix-load-average-part-2-not-your-average-average) -3. [Understanding Linux CPU Load](https://scoutapm.com/blog/understanding-load-averages) -4. [Linux Load Averages: Solving the Mystery](https://www.brendangregg.com/blog/2017-08-08/linux-load-averages.html) -5. [Understanding Linux Process States](https://access.redhat.com/sites/default/files/attachments/processstates_20120831.pdf) diff --git a/health/guides/load/load_average_5.md b/health/guides/load/load_average_5.md deleted file mode 100644 index 6eacfcec..00000000 --- a/health/guides/load/load_average_5.md +++ /dev/null @@ -1,66 +0,0 @@ -### Understand the alert - -This alarm calculates the system `load average` (CPU and I/O demand) over the period of five minutes. If you receive this alarm, it means that your system is "overloaded." - -The alert gets raised into warning if the metric is 4 times the expected value and cleared if the value is 3.5 times the expected value. - -For further information on how our alerts are calculated, please have a look at our [Documentation](https://learn.netdata.cloud/docs/agent/health/reference#expressions). - - -### What does "load average" mean? - -The term `system load average` on a Linux machine, measures the **number of threads that are currently working and those waiting to work** (CPU, disk, uninterruptible locks). So simply stated: **System load average measures the number of threads that aren't idle.** - -### What does "overloaded" mean? - -Let's look at a single core CPU system and think of its core count as car lanes on a bridge. A car represents a process in this example: - -- On a 0.5 load average, the traffic on the bridge is fine, it is at 50% of its capacity. -- If the load average is at 1, then the bridge is full, and it is utilized 100%. -- If the load average gets to 2 (remember we are on a single core machine), it means that there is one car lane that is passing the bridge. However, there is **another** full car lane that waits to pass the bridge. - -So this is how you can imagine CPU load, but keep in mind that `load average` counts also I/O demand, so there is an analogous example there. - -### Useful resources - -1. [UNIX Load Average Part 1: How It Works](https://www.helpsystems.com/resources/guides/unix-load-average-part-1-how-it-works) -2. [UNIX Load Average Part 2: Not Your Average Average](https://www.helpsystems.com/resources/guides/unix-load-average-part-2-not-your-average-average) -3. [Understanding Linux CPU Load](https://scoutapm.com/blog/understanding-load-averages) -4. [Linux Load Averages: Solving the Mystery](https://www.brendangregg.com/blog/2017-08-08/linux-load-averages.html) -5. [Understanding Linux Process States](https://access.redhat.com/sites/default/files/attachments/processstates_20120831.pdf) - - -### Troubleshoot the alert - -- Determine if the problem is CPU or I/O bound - -First you need to check if you are running on a CPU load or an I/O load problem. - -1. To get a report about your system statistics, use `vmstat` (or `vmstat 1`, to set a delay between updates in seconds): - -The `procs` column, shows: -r: The number of runnable processes (running or waiting for run time). -b: The number of processes blocked waiting for I/O to complete. - -2. List your currently running processes using the `ps` command: - -The `grep` command will fetch the processes that their state code starts either with R (running or runnable (on run queue)) or D(uninterruptible sleep (usually IO)). - -3. Minimize the load by closing any unnecessary main consumer processes. We strongly advise you to double-check if the process you want to close is necessary. - -- Check per-process CPU/disk usage to find the top consumers - -1. To see the processes that are the main CPU consumers, use the task manager program `top` like this: - - ``` - top -o +%CPU -i - ``` - -2. Use `iotop`: - `iotop` is a useful tool, similar to `top`, used to monitor Disk I/O usage, if you don't have it, then [install it](https://www.tecmint.com/iotop-monitor-linux-disk-io-activity-per-process/) - ``` - sudo iotop - ``` - -3. Minimize the load by closing any unnecessary main consumer processes. We strongly advise you to double-check if the process you want to close is necessary. - diff --git a/health/guides/load/load_cpu_number.md b/health/guides/load/load_cpu_number.md deleted file mode 100644 index 250a6d06..00000000 --- a/health/guides/load/load_cpu_number.md +++ /dev/null @@ -1,48 +0,0 @@ -### Understand the alert - -This alert, `load_cpu_number`, calculates the base trigger point for load average alarms, which helps identify when the system is overloaded. The alert checks the maximum number of CPUs in the system over the past 1 minute. If there is only one CPU, the trigger is set at 2. - -### What does load average mean? - -The term `system load average` on a Linux machine measures the number of threads that are currently working and those waiting to work (CPU, disk, uninterruptible locks). In simpler terms, the load average measures the number of threads that aren't idle. - -### What does overloaded mean? - -An overloaded system is when the demand on the system's resources (CPUs, disks, etc.) is higher than its capacity to handle tasks. This can lead to increased wait times, slower processing, and in worst cases, system crashes. - -### Troubleshoot the alert - -1. Determine the current load average on the system: - - Use the `uptime` command in the terminal to see the current load average: - ``` - uptime - ``` - -2. Identify if the problem is CPU load or I/O load: - - Use `vmstat` (or `vmstat 1`, to set a delay between updates in seconds) to get a report on system statistics: - - The `procs` column shows: - r: The number of runnable processes (running or waiting for run time). - b: The number of processes blocked waiting for I/O to complete. - -3. Check per-process CPU/disk usage to find the top consumers: - - a. Use `top` to see the processes that are the main CPU consumers: - ``` - top -o +%CPU -i - ``` - - b. Use `iotop` to monitor Disk I/O usage (install it if not available): - ``` - sudo iotop - ``` - -4. Minimize the load by closing any unnecessary main consumer processes. Double-check if the process you want to close is necessary. - -### Useful resources - -1. [Unix Load Average Part 1: How It Works](https://www.helpsystems.com/resources/guides/unix-load-average-part-1-how-it-works) -2. [Unix Load Average Part 2: Not Your Average Average](https://www.helpsystems.com/resources/guides/unix-load-average-part-2-not-your-average-average) -3. [Understanding Linux Process States](https://access.redhat.com/sites/default/files/attachments/processstates_20120831.pdf)
\ No newline at end of file diff --git a/health/guides/mdstat/mdstat_disks.md b/health/guides/mdstat/mdstat_disks.md deleted file mode 100644 index c3daf961..00000000 --- a/health/guides/mdstat/mdstat_disks.md +++ /dev/null @@ -1,26 +0,0 @@ -### Understand the alert - -This alert presents the number of devices in the down state for the respective RAID array raising it. If you receive this alert, then the array is degraded and some array devices are missing. - -### What is a "degraded array" event? - -When a RAID array experiences the failure of one or more disks, it can enter degraded mode, a fallback mode that generally allows the continued usage of the array, but either loses the performance boosts of the RAID technique (such as a RAID-1 mirror across two disks when one of them fails; performance will fall back to that of a normal, single drive) or experiences severe performance penalties due to the necessity to reconstruct the damaged data from error correction data. - -### Troubleshoot the alert - -- Examine for faulty or offline devices - -Having a degraded array means that one or more devices are faulty or missing. To fix this issue, check for faulty devices by running: -``` -mdadm --detail <RAIDDEVICE> -``` -Replace "RAIDDEVICE" with the name of your RAID device. - -To recover the array, replace the faulty devices or bring back any offline devices. - -### Useful resources - -1. [Degraded Mode](https://en.wikipedia.org/wiki/Degraded_mode) -2. [Mdadm recover degraded array procedure](https://www.thomas-krenn.com/en/wiki/Mdadm_recover_degraded_Array_procedure) -3. [mdadm Manual page](https://linux.die.net/man/8/mdadm) -4. [mdadm cheat sheet](https://www.ducea.com/2009/03/08/mdadm-cheat-sheet/)
\ No newline at end of file diff --git a/health/guides/mdstat/mdstat_mismatch_cnt.md b/health/guides/mdstat/mdstat_mismatch_cnt.md deleted file mode 100644 index 7a156e38..00000000 --- a/health/guides/mdstat/mdstat_mismatch_cnt.md +++ /dev/null @@ -1,15 +0,0 @@ -### Understand the alert - -This alert presents the number of unsynchronized blocks for the RAID array in crisis. Receiving this alert indicates a high number of unsynchronized blocks for the RAID array. This might indicate that data on the array is corrupted. - -This alert is raised to warning when the metric exceeds 1024 unsynchronized blocks. - -### Troubleshoot the alert - -There is no standard approach to troubleshooting this alert because the reasons can be various. - -For example, one of the reasons might be a swap on the array, which is relatively harmless. However, this alert can also be triggered by hardware issues which can lead to many problems and inconsistencies between the disks. - -### Useful resources - -[Serverfault | Reasons for high mismatch_cnt on a RAID1/10 array](https://serverfault.com/questions/885565/what-are-raid-1-10-mismatch-cnt-0-causes-except-for-swap-file/885574#885574) diff --git a/health/guides/mdstat/mdstat_nonredundant_last_collected.md b/health/guides/mdstat/mdstat_nonredundant_last_collected.md deleted file mode 100644 index f76c6148..00000000 --- a/health/guides/mdstat/mdstat_nonredundant_last_collected.md +++ /dev/null @@ -1,55 +0,0 @@ -### Understand the alert - -This alert, `mdstat_nonredundant_last_collected`, is triggered when the Netdata Agent fails to collect data from the Multiple Device (md) driver for a certain period. The md driver is used to manage software RAID arrays in Linux. - -### What is the md driver? - -The md (multiple device) driver is responsible for managing software RAID arrays on Linux systems. It provides a way to combine multiple physical disks into a single logical disk, increasing capacity and providing redundancy, depending on the RAID level. Monitoring the status of these devices is crucial to ensure data integrity and redundancy. - -### Troubleshoot the alert - -1. Check the status of the md driver: - - To inspect the status of the RAID arrays managed by the md driver, use the `cat` command: - - ``` - cat /proc/mdstat - ``` - - This will display the status and configuration of all active RAID arrays. Look for any abnormal status, such as failed or degraded disks, and replace or fix them as needed. - -2. Verify the Netdata configuration: - - Ensure that the Netdata Agent is properly configured to collect data from the md driver. Open the `netdata.conf` configuration file found in `/etc/netdata/` or `/opt/netdata/etc/netdata/`, and look for the `[plugin:proc:/proc/mdstat]` section. - - Make sure that the `enabled` option is set to `yes`: - - ``` - [plugin:proc:/proc/mdstat] - # enabled = yes - ``` - - If you make any changes to the configuration, restart the Netdata Agent for the changes to take effect: - - ``` - sudo systemctl restart netdata - ``` - -3. Check the md driver data collection: - - After verifying the Netdata configuration, check if data collection is successful. On the Netdata dashboard, go to the "Disks" section, and look for "mdX" (where "X" is a number) in the list of available disks. If you can see the charts for your RAID array(s), it means data collection is working correctly. - -4. Investigate system logs: - - If the issue persists, check the system logs for any errors or messages related to the md driver or Netdata Agent. You can use `journalctl` for this purpose: - - ``` - journalctl -u netdata - ``` - - Look for any error messages or warnings that could indicate the cause of the problem. - -### Useful resources - -1. [Linux RAID: A Quick Guide](https://www.cyberciti.biz/tips/linux-raid-increase-resync-rebuild-speed.html) -2. [Netdata Agent Configuration Guide](https://learn.netdata.cloud/docs/agent/daemon/config) diff --git a/health/guides/megacli/megacli_adapter_state.md b/health/guides/megacli/megacli_adapter_state.md deleted file mode 100644 index 1202184e..00000000 --- a/health/guides/megacli/megacli_adapter_state.md +++ /dev/null @@ -1,29 +0,0 @@ -### Understand the alert - -This alert indicates that the status of a virtual drive on your MegaRAID controller is in a degraded state. A degraded state means that the virtual drive's operating condition is not optimal, and one of the configured drives has failed or is offline. - -### Troubleshoot the alert - -#### General approach - -1. Gather more information about your virtual drives in all adapters: - -``` -root@netdata # megacli –LDInfo -Lall -aALL -``` - -2. Check which virtual drive is in a degraded state and in which adapter. - -3. Consult the MegaRAID SAS Software User Guide [1]: - - 1. Section `2.1.16` to check what is going wrong with your drives. - 2. Section `7.18` to perform any action on drives. Focus on sections `7.18.2`, `7.18.6`, `7.18.7`, `7.18.8`, `7.18.11`, and `7.18.14`. - -### Warning - -Data is priceless. Before performing any action, make sure that you have taken any necessary backup steps. Netdata is not liable for any loss or corruption of any data, database, or software. - -### Useful resources - -1. [MegaRAID SAS Software User Guide [PDF download]](https://docs.broadcom.com/docs/12353236) -2. [MegaCLI commands cheatsheet](https://www.broadcom.com/support/knowledgebase/1211161496959/megacli-commands)
\ No newline at end of file diff --git a/health/guides/megacli/megacli_bbu_cycle_count.md b/health/guides/megacli/megacli_bbu_cycle_count.md deleted file mode 100644 index 14f1d22d..00000000 --- a/health/guides/megacli/megacli_bbu_cycle_count.md +++ /dev/null @@ -1,28 +0,0 @@ -### Understand the alert - -The `megacli_bbu_cycle_count` alert is related to the battery backup unit (BBU) of your MegaCLI controller. This alert is triggered when the average number of full recharge cycles during the BBU's lifetime exceeds a predefined threshold. High numbers of charge cycles can affect the battery's relative capacity. - -A warning state is triggered when the number of charge cycles is greater than 100, and a critical state is triggered when the number of charge cycles is greater than 500. - -### Troubleshoot the alert - -**Caution:** Before performing any troubleshooting steps, ensure that you have taken the necessary backup measures to protect your data. Netdata is not liable for any data loss or corruption. - -1. Gather information about the battery units for all of your adapters: - - ``` - megacli -AdpBbuCmd -GetBbuStatus -aALL - ``` - -2. Perform a battery check on the BBU with a low relative charge. Before taking any action, consult the manual's[section 7.14](https://docs.broadcom.com/docs/12353236): - - ``` - megacli -AdpBbuCmd -BbuLearn -aX // X is the adapter's number - ``` - -3. If necessary, replace the battery in question. - -### Useful resources - -1. [MegaRAID SAS Software User Guide (PDF download)](https://docs.broadcom.com/docs/12353236) -2. [MegaCLI commands cheatsheet](https://www.broadcom.com/support/knowledgebase/1211161496959/megacli-commands)
\ No newline at end of file diff --git a/health/guides/megacli/megacli_bbu_relative_charge.md b/health/guides/megacli/megacli_bbu_relative_charge.md deleted file mode 100644 index 74a03a3b..00000000 --- a/health/guides/megacli/megacli_bbu_relative_charge.md +++ /dev/null @@ -1,36 +0,0 @@ -### Understand the alert - -This alert is related to the disk array controller's battery backup unit (BBU) relative state of charge. If you receive this alert, it means that the battery backup unit's charge is low, which may affect your RAID controller's performance or lead to data loss in case of a power failure. - -### What does low BBU relative charge mean? - -A low BBU relative charge indicates that the state of charge is low compared to its design capacity. The relative state of charge is a percentage indication of the full charge capacity compared to its designed capacity. If the relative charge is constantly low, it may suggest that the battery is worn out and needs replacement. - -### Troubleshoot the alert - -1. Gather information about your battery units for all controllers: - - ``` - sudo megacli -AdpBbuCmd -GetBbuStatus -aALL - ``` - - This command will provide you with detailed information about the BBU status for each controller. - -2. Perform a manual battery calibration (learning cycle) on the battery with a low relative charge: - - ``` - sudo megacli -AdpBbuCmd -BbuLearn -aX - ``` - - Replace `X` with the controller's number. Please consult the [MegaRAID SAS Software User Guide](https://docs.broadcom.com/docs/12353236), section 7.14, before performing this action. - - A learning cycle discharges and recharges the battery, which can help recalibrate the battery and improve its relative state of charge. However, it may temporarily disable the write cache during this process. - -3. Monitor the BBU relative charge after the learning cycle. If the relative charge remains low, consider replacing the battery in question. Consult your hardware vendor's documentation for guidance on replacing the BBU. - -### Useful resources - -1. [MegaRAID SAS Software User Guide [pdf download]](https://docs.broadcom.com/docs/12353236) -2. [MegaCLI commands cheatsheet](https://www.broadcom.com/support/knowledgebase/1211161496959/megacli-commands) - -**Note**: Data is priceless. Before you perform any action, make sure that you have taken any necessary backup steps. Netdata is not liable for any loss or corruption of any data, database, or software.
\ No newline at end of file diff --git a/health/guides/megacli/megacli_pd_media_errors.md b/health/guides/megacli/megacli_pd_media_errors.md deleted file mode 100644 index 8988d09e..00000000 --- a/health/guides/megacli/megacli_pd_media_errors.md +++ /dev/null @@ -1,30 +0,0 @@ -### Understand the alert - -The `megacli_pd_media_errors` alert is triggered when there are media errors on the physical disks attached to the MegaCLI controller. A media error is an event where a storage disk was unable to perform the requested I/O operation due to problems accessing the stored data. This alert indicates that a bad sector was found on the drive during a patrol check or from a rebuild operation on a specific disk by the RAID adapter. Although this does not mean imminent disk failure, it is a warning, and you should monitor the affected disk. - -### Troubleshoot the alert - -**Data is priceless. Before you perform any action, make sure that you have taken any necessary backup steps. Netdata is not liable for any loss or corruption of any data, database, or software.** - -1. Gather more information about your virtual drives on all adapters: - - ``` - megacli –LDInfo -Lall -aALL - ``` - -2. Check which virtual drive is reporting media errors and in which adapter. - -3. Check the Bad block table for the virtual drive in question: - - ``` - megacli –GetBbtEntries -LX -aY // X: virtual drive, Y: the adapter - ``` - -4. Consult the MegaRAID SAS Software User Guide's section 7.17.11[^1] to recheck these block entries. **This operation removes any data stored on the physical drives. Back up the good data on the drives before making any changes to the configuration.** - -### Useful resources - -1. [MegaRAID SAS Software User Guide [PDF download]](https://docs.broadcom.com/docs/12353236) -2. [MegaCLI command cheatsheet](https://www.broadcom.com/support/knowledgebase/1211161496959/megacli-commands) - -[^1]: https://docs.broadcom.com/docs/12353236
\ No newline at end of file diff --git a/health/guides/megacli/megacli_pd_predictive_failures.md b/health/guides/megacli/megacli_pd_predictive_failures.md deleted file mode 100644 index 1aa7b0d2..00000000 --- a/health/guides/megacli/megacli_pd_predictive_failures.md +++ /dev/null @@ -1,29 +0,0 @@ -### Understand the alert - -This alert indicates that one or more physical disks attached to the MegaCLI controller are experiencing predictive failures. A predictive failure is a warning that a hard disk may fail in the near future, even if it's still working normally. The failure prediction relies on the self-monitoring and analysis technology (S.M.A.R.T.) built into the disk drive. - -### Troubleshoot the alert - -**Make sure you have taken necessary backup steps before performing any action. Netdata is not liable for any loss or corruption of data, databases, or software.** - -1. Identify the problematic drives: - - Use the following command to gather information about your virtual drives in all adapters: - - ``` - megacli –LDInfo -Lall -aALL - ``` - -2. Determine the virtual drive and adapter reporting media errors. - -3. Consult the MegaRAID SAS Software User Guide [1]: - - 1. Refer to Section 2.1.16 to check for issues with your drives. - 2. Refer to Section 7.18 to perform any appropriate actions on drives. Focus on Sections 7.18.2, 7.18.6, 7.18.7, 7.18.8, 7.18.11, and 7.18.14. - -4. Consider replacing the problematic disk(s) to prevent imminent failures and potential data loss. - -### Useful resources - -1. [MegaRAID SAS Software User Guide (PDF download)](https://docs.broadcom.com/docs/12353236) -2. [MegaCLI commands cheatsheet](https://www.broadcom.com/support/knowledgebase/1211161496959/megacli-commands)
\ No newline at end of file diff --git a/health/guides/memcached/memcached_cache_fill_rate.md b/health/guides/memcached/memcached_cache_fill_rate.md deleted file mode 100644 index ec276b3a..00000000 --- a/health/guides/memcached/memcached_cache_fill_rate.md +++ /dev/null @@ -1,41 +0,0 @@ -### Understand the alert - -This alert, `memcached_cache_fill_rate`, measures the average rate at which the Memcached cache fills up (positive value) or frees up (negative value) space over the last hour. The units are in `KB/hour`. If you receive this alert, it means that your Memcached cache is either filling up or freeing up space at a noticeable rate. - -### What is Memcached? - -Memcached is a high-performance, distributed memory object caching system used to speed up web applications by temporarily storing frequently-used data in RAM. It reduces the load on the database and improves performance by minimizing the need for repeated costly database queries. - -### Troubleshoot the alert - -1. Check the current cache usage: - -You can view the current cache usage using the following command, where `IP` and `PORT` are the Memcached server's IP address and port number: - -``` -echo "stats" | nc IP PORT -``` - -Look for the `bytes` and `limit_maxbytes` fields in the output to see the current cache usage and the maximum cache size allowed, respectively. - -2. Identify heavy cache users: - -Find out which applications or services are generating a significant number of requests to Memcached. You may be able to optimize them to reduce cache usage. You can check Memcached logs for more details about requests and operations. - -3. Optimize cache storage: - -If the cache is filling up too quickly, consider optimizing your cache storage policies. For example, you can adjust the expiration times of stored items, prioritize essential data, or use a more efficient caching strategy. - -4. Increase the cache size: - -If needed, you can increase the cache size to accommodate a higher fill rate. To do this, stop the Memcached service and restart it with the `-m` option, specifying the desired memory size in megabytes: - -``` -memcached -d -u memcached -m NEW_SIZE -l IP -p PORT -``` - -Replace `NEW_SIZE` with the desired cache size in MB. - -### Useful resources - -1. [Memcached Official Site](https://memcached.org/) diff --git a/health/guides/memcached/memcached_cache_memory_usage.md b/health/guides/memcached/memcached_cache_memory_usage.md deleted file mode 100644 index 2a14f01f..00000000 --- a/health/guides/memcached/memcached_cache_memory_usage.md +++ /dev/null @@ -1,35 +0,0 @@ -### Understand the alert - -This alert indicates the percentage of used cached memory in your Memcached instance. High cache memory utilization can lead to evictions and performance degradation. The warning state is triggered when the cache memory utilization is between 70-80%, and the critical state is triggered when it's between 80-90%. - -### What does cache memory utilization mean? - -Cache memory utilization refers to the percentage of memory used by Memcached for caching data. A high cache memory utilization indicates that your Memcached instance is close to its maximum capacity, and it may start evicting data to accommodate new entries, which can negatively impact performance. - -### Troubleshoot the alert - -1. **Monitor cache usage and evictions**: Use the following command to display the current cache usage and evictions metrics: - - ``` - echo "stats" | nc localhost 11211 - ``` - Look for the `bytes` and `evictions` metrics in the output. High evictions indicate that your cache size is insufficient for the current workload, and you may need to increase it. - -2. **Increase cache size**: To increase the cache size, edit the Memcached configuration file (usually `/etc/memcached.conf`) and update the value of the `-m` option. For example, to set the cache size to 2048 megabytes, update the configuration as follows: - - ``` - -m 2048 - ``` - Save the file and restart the Memcached service for the changes to take effect. - - ``` - sudo systemctl restart memcached - ``` - -3. **Optimize your caching strategy**: Review your caching strategy to ensure that you are only caching necessary data and using appropriate expiration times. Making updates that reduce the amount of cached data can help prevent high cache memory usage. - -4. **Consider cache sharding or partitioning**: If increasing the cache size or optimizing your caching strategy doesn't resolve the issue, you may need to consider cache sharding or partitioning. This approach involves using multiple Memcached instances, dividing the data across them, which can help distribute the load and reduce cache memory usage. - -### Useful resources - -1. [Memcached Official Documentation](https://memcached.org/) diff --git a/health/guides/memcached/memcached_out_of_cache_space_time.md b/health/guides/memcached/memcached_out_of_cache_space_time.md deleted file mode 100644 index 5f546553..00000000 --- a/health/guides/memcached/memcached_out_of_cache_space_time.md +++ /dev/null @@ -1,19 +0,0 @@ -### Understand the alert - -This alert indicates that the Memcached cache is running out of space and will likely become full soon, based on the data addition rate over the past hour. If the cache reaches 100% capacity, evictions may occur, resulting in a loss of cached data and decreased performance. - -### Troubleshoot the alert - -1. **Monitor cache usage**: Use the `stats` command in Memcached to check the current cache usage and the number of evictions. This will help you understand the severity of the issue and whether evictions are already happening. - -2. **Evaluate cache settings**: Review your Memcached configuration file (`/etc/memcached.conf` or `/etc/sysconfig/memcached`) and check the cache size setting (`-m` parameter). Ensure that the cache size is set appropriately based on your system's available memory and workload requirements. - -3. **Increase cache size**: If the cache is consistently running out of space, consider increasing the cache size by adjusting the `-m` parameter in the Memcached configuration file. Be cautious not to allocate too much memory, as this can cause other system processes to suffer. - -4. **Optimize cache usage**: Analyze the cache usage patterns of your applications and optimize their caching strategies. This may involve adjusting the cache TTL (time-to-live) settings, using different cache eviction policies, or implementing a more efficient caching mechanism. - -5. **Monitor application performance**: Check the performance of your applications that use Memcached to identify any issues or bottlenecks. If performance is degrading due to cache evictions, consider optimizing the applications or increasing cache capacity. - -### Useful resources - -1. [Memcached Configuration Options](https://github.com/memcached/memcached/wiki/ConfiguringServer) diff --git a/health/guides/memory/1hour_ecc_memory_correctable.md b/health/guides/memory/1hour_ecc_memory_correctable.md deleted file mode 100644 index 1893bbf7..00000000 --- a/health/guides/memory/1hour_ecc_memory_correctable.md +++ /dev/null @@ -1,37 +0,0 @@ -### Understand the alert - -This alert, `1hour_ecc_memory_correctable`, monitors the number of Error Correcting Code (ECC) correctable errors that occur within an hour. If you receive this alert, it means that there are ECC correctable errors in your system's memory. While it does not pose an immediate threat, it may indicate that a memory module is slowly deteriorating. - -### ECC Memory - -ECC memory is a type of computer data storage that can detect and correct the most common kinds of internal data corruption. It is used in systems that require high reliability and stability, such as servers or mission-critical applications. - -### Troubleshoot the alert - -1. Inspect the memory modules - - If the alert is triggered, start by physically checking the memory modules in the system. Ensure that the contacts are clean, and all modules are firmly seated in their respective slots. - -2. Perform a memory test - - Run a thorough memory test using a tool like Memtest86+. This will help identify if any memory chips have problems that can cause the ECC errors. - - ``` - sudo apt-get install memtester - sudo memtester 1024M 5 - ``` - - Replace `1024M` with the amount of memory you'd like to test (in MB) and `5` with the number of loops for the test. - -3. Monitor the errors - - Monitor the frequency of ECC correctable errors. Keep a record of when they occur and if there are any patterns or trends. If errors continue to occur, move to step 4. - -4. Replace faulty memory modules - - If ECC correctable errors persist, identify the memory modules with the highest error rates and consider replacing them as a preventive measure. This will help maintain the reliability and stability of your system. - -### Useful resources - -1. [Memtest86+ - Advanced Memory Diagnostic Tool](https://www.memtest.org/) -2. [How to Diagnose, Check, and Test for Bad Memory](https://www.computerhope.com/issues/ch001089.htm) diff --git a/health/guides/memory/1hour_ecc_memory_uncorrectable.md b/health/guides/memory/1hour_ecc_memory_uncorrectable.md deleted file mode 100644 index 509ff544..00000000 --- a/health/guides/memory/1hour_ecc_memory_uncorrectable.md +++ /dev/null @@ -1,27 +0,0 @@ -### Understand the alert - -This alert, `1hour_ecc_memory_uncorrectable`, indicates that there are ECC (Error-Correcting Code) uncorrectable errors detected in your system's memory within the last hour. ECC errors are caused by issues in the system's RAM (Random Access Memory). These uncorrectable errors are severe and may lead to system crashes or data corruption. - -### What are ECC errors? - -ECC memory is designed to detect and, in some cases, correct data corruption in the memory, preventing system crashes and providing overall system stability. ECC errors fall into two categories: - -1. **Correctable Errors**: These are errors that the ECC memory can detect and correct, preventing system crashes and ensuring data integrity. -2. **Uncorrectable Errors**: These are more severe errors that the ECC memory cannot correct, often requiring faulty memory modules to be replaced to prevent system crashes and data corruption. - -### Troubleshoot the alert - -- **Inspect the memory modules**: Power off the system and check the memory modules for any signs of damage or poor contact with the socket. Ensure that the memory modules are seated firmly and there is proper contact. - -- **Run memory diagnostics**: Run memory diagnostic tools, like [Memtest86+](https://www.memtest.org/) to identify any memory errors and verify the memory's health. If errors are detected, it's an indication that the memory modules need to be replaced. - -- **Replace faulty memory modules**: If uncorrectable errors continue occurring or if diagnostics identify faulty memory modules, consider replacing them. Before doing so, check if the memory modules are still covered under warranty. - -- **Check system logs**: Review system logs, such as Event Viewer on Windows or `/var/log` on Linux systems, for any related messages or errors that may help to diagnose the issue further. - -- **Update firmware**: Ensure your system's firmware and BIOS are up-to-date. Manufacturers often release stability and performance improvements that can potentially resolve or mitigate ECC errors. - - -### Useful resources - -1. [How to Check Memory Problems in Linux](https://www.cyberciti.biz/faq/linux-check-memory-usage/) diff --git a/health/guides/memory/1hour_memory_hw_corrupted.md b/health/guides/memory/1hour_memory_hw_corrupted.md deleted file mode 100644 index 1be03048..00000000 --- a/health/guides/memory/1hour_memory_hw_corrupted.md +++ /dev/null @@ -1,19 +0,0 @@ - -### Understand the alert -The Linux kernel keeps track of the system memory state. You can find the actual values it tracks in the [man pages](https://man7.org/linux/man-pages/man5/proc.5.html) under the `/proc/meminfo` subsection. One of the values that the kernel reports is the `HardwareCorrupted` , which is the amount of memory, in kibibytes (1024 bytes), with physical memory corruption problems, identified by the hardware and set aside by the kernel so it does not get used. - -The Netdata Agent monitors this value. This alert indicates that the memory is corrupted due to a hardware failure. While primarily the error may be due to a failing RAM chip, it can also be caused by incorrect seating or improper contact between the socket and memory module. - -### Troubleshoot the alert - -Most of the time uncorrectable errors will make your system reboot/shutdown in a state of panic. If not, that means that your tolerance level is high enough to not make the system go into panic. You must identify the defective module immediately. - -`memtester` is a userspace utility for testing the memory subsystem for faults. - -You may also receive this error as a result of incorrect seating or improper contact between the socket and RAM module. Check both before consider replacing the RAM module. - -### Useful resources - -1. [man pages /proc](https://man7.org/linux/man-pages/man5/proc.5.html) -2. [memtester homepage](https://pyropus.ca/software/memtester/) - diff --git a/health/guides/ml/ml_1min_node_ar.md b/health/guides/ml/ml_1min_node_ar.md deleted file mode 100644 index 1c3c007f..00000000 --- a/health/guides/ml/ml_1min_node_ar.md +++ /dev/null @@ -1,26 +0,0 @@ -### Understand the alert - -This alert is triggered when the [node anomaly rate](https://learn.netdata.cloud/docs/ml-and-troubleshooting/machine-learning-ml-powered-anomaly-detection#node-anomaly-rate) exceeds the threshold defined in the [alert configuration](https://github.com/netdata/netdata/blob/master/health/health.d/ml.conf) over the most recent 1 minute window evaluated. - -For example, with the default of `warn: $this > 1`, this means that 1% or more of the metrics collected on the node have across the most recent 1 minute window been flagged as [anomalous](https://learn.netdata.cloud/docs/ml-and-troubleshooting/machine-learning-ml-powered-anomaly-detection) by Netdata. - -### Troubleshoot the alert - -This alert is a signal that some significant percentage of metrics within your infrastructure have been flagged as anomalous accoring to the ML based anomaly detection models the Netdata agent continually trains and re-trains for each metric. This tells us something somewhere might look strange in some way. THe next step is to try drill in and see what metrics are actually driving this. - -1. **Filter for the node or nodes relevant**: First we need to reduce as much noise as possible by filtering for just those nodes that have the elevated node anomaly rate. Look at the `anomaly_detection.anomaly_rate` chart and group by `node` to see which nodes have an elevated anomaly rate. Filter for just those nodes since this will reduce any noise as much as possible. - -2. **Highlight the area of interest**: Highlight the timeframne of interest where you see an elevated anomaly rate. - -3. **Check the anomalies tab**: Check the [Anomaly Advisor](https://learn.netdata.cloud/docs/ml-and-troubleshooting/anomaly-advisor) ("Anomalies" tab) to see an ordered list of what metrics were most anomalous in the highlighted window. - -4. **Press the AR% button on Overview**: You can also press the "[AR%](https://blog.netdata.cloud/anomaly-rates-in-the-menu/)" button on the Overview or single node dashboard to see what parts of the menu have the highest chart anomaly rates. Pressing the AR% button should add some "pills" to each menu item and if you hover over it you will see that chart within each menu section that was most anomalous during the highlighted timeframe. - -5. **Use Metric Correlations**: Use [metric correlations](https://learn.netdata.cloud/docs/ml-and-troubleshooting/metric-correlations) to see what metrics may have changed most significantly comparing before to the highlighted timeframe. - -### Useful resources - -1. [Machine learning (ML) powered anomaly detection](https://learn.netdata.cloud/docs/ml-and-troubleshooting/machine-learning-ml-powered-anomaly-detection) -2. [Anomaly Advisor](https://learn.netdata.cloud/docs/ml-and-troubleshooting/anomaly-advisor) -3. [Metric Correlations](https://learn.netdata.cloud/docs/ml-and-troubleshooting/metric-correlations) -4. [Anomaly Rates in the Menu!](https://blog.netdata.cloud/anomaly-rates-in-the-menu/) diff --git a/health/guides/mysql/mysql_10s_slow_queries.md b/health/guides/mysql/mysql_10s_slow_queries.md deleted file mode 100644 index 17321844..00000000 --- a/health/guides/mysql/mysql_10s_slow_queries.md +++ /dev/null @@ -1,25 +0,0 @@ -### Understand the alert - -This alert presents the number of slow queries in the last 10 seconds. If you receive this, it indicates a high number of slow queries. - -The metric is raised in a warning state when the value is larger than 10. If the number of slow queries in the last 10 seconds exceeds 20, then the alert is raised in critical state. - -Queries are defined as "slow", if they have taken more than `long_query_time` seconds, a predefined variable. Also, the value is measured in real time, not CPU time. - -### Troubleshoot the alert - -- Determine which queries are the problem and try to optimise them - -To identify the slow queries, you can enable the slow-query log of MySQL: - -1. Locate the `my.cnf` file -2. Enable the slow-query log by setting the `slow_query_log variable` to `On`. -3. Enter a path where the log files should be stored in the `slow_query_log_file` variable. - -After you know which queries are the ones taking longer than preferred, you can use the `EXPLAIN` keyword to overview how many rows are accessed, what operations are being done etc. - -After you've found the cause for the slow queries, you can start optimizing your queries. Consider to use an index and think about how you can change the way you `JOIN` tables. Both of these methods aid to reduce the amount of data that is being accessed without it really being needed. - -### Useful resources -[SQL Query Optimisation](https://opensource.com/article/17/5/speed-your-mysql-queries-300-times) - diff --git a/health/guides/mysql/mysql_10s_table_locks_immediate.md b/health/guides/mysql/mysql_10s_table_locks_immediate.md deleted file mode 100644 index 7b375b43..00000000 --- a/health/guides/mysql/mysql_10s_table_locks_immediate.md +++ /dev/null @@ -1,46 +0,0 @@ -### Understand the alert - -This alert is triggered when the number of table immediate locks in MySQL increases within the last 10 seconds. Table locks are used to control concurrent access to tables, and immediate locks are granted when the requested lock is available. - -### What are table immediate locks? - -In MySQL, table immediate locks are a mechanism for managing concurrent access to tables. When a table lock is requested and is available, an immediate lock is granted, allowing the process to continue execution. This ensures that multiple processes can't modify the data simultaneously, which could cause data inconsistencies. - -### Troubleshoot the alert - -1. Identify the queries causing the table locks: - - You can use the following command to display the process list in MySQL, which will include information about the locks: - - ``` - SHOW FULL PROCESSLIST; - ``` - -2. Analyze the queries: - - Check the queries causing the table locks to determine if they are necessary, can be optimized, or should be terminated. To terminate a specific query, use the `KILL QUERY` command followed by the connection ID: - - ``` - KILL QUERY connection_id; - ``` - -3. Check table lock status: - - To get more information about the lock status, you can use the following command to display the lock status of all tables: - - ``` - SHOW OPEN TABLES WHERE in_use > 0; - ``` - -4. Optimize database queries and configurations: - - Improve query performance by optimizing the queries and indexing the tables. Additionally, check your MySQL configuration and adjust it if necessary to minimize the number of locks required. - -5. Monitor the lock situation: - - Keep monitoring the lock situation with the `SHOW FULL PROCESSLIST` command to see if the problem persists. If the issue is not resolved, consider increasing the MySQL lock timeout or seek assistance from a database administrator or the MySQL community. - -### Useful resources - -1. [MySQL Table Locking](https://dev.mysql.com/doc/refman/8.0/en/table-locking.html) -2. [MySQL Lock Information](https://dev.mysql.com/doc/refman/8.0/en/innodb-locking.html) diff --git a/health/guides/mysql/mysql_10s_table_locks_waited.md b/health/guides/mysql/mysql_10s_table_locks_waited.md deleted file mode 100644 index 1cac9e92..00000000 --- a/health/guides/mysql/mysql_10s_table_locks_waited.md +++ /dev/null @@ -1,37 +0,0 @@ -### Understand the alert - -This alert is triggered when there's a high number of `table locks waited` in the last 10 seconds for a MySQL database. Table locks prevent multiple processes from writing to a table at the same time, ensuring the integrity of the data. However, too many table locks waiting can indicate a performance issue, as it could mean that some queries are causing deadlocks or taking too long to complete. - -### Troubleshoot the alert - -1. Identify queries causing locks - - Use the following MySQL command to view the currently running queries and identify the ones causing the table locks: - - ``` - SHOW FULL PROCESSLIST; - ``` - -2. Examine locked tables - - Use the following command to find more information about the locked tables: - - ``` - SHOW OPEN TABLES WHERE In_use > 0; - ``` - -3. Optimize query performance - - Analyze the queries causing the table locks and optimize them to improve performance. This may include creating or modifying indexes, optimizing the SQL query structure, or adjusting the MySQL server configuration settings. - -4. Consider using InnoDB - - If your MySQL database is using MyISAM storage engine, consider switching to InnoDB storage engine to take advantage of row-level locking and reduce the number of table locks. - -5. Monitor MySQL performance - - Keep an eye on MySQL performance metrics such as table locks, query response times, and overall database performance to prevent future issues. Tools like the Netdata Agent can help in monitoring MySQL performance. - -### Useful resources - -1. [InnoDB Locking and Transaction Model](https://dev.mysql.com/doc/refman/8.0/en/innodb-locking-transaction-model.html) diff --git a/health/guides/mysql/mysql_10s_waited_locks_ratio.md b/health/guides/mysql/mysql_10s_waited_locks_ratio.md deleted file mode 100644 index 60c03059..00000000 --- a/health/guides/mysql/mysql_10s_waited_locks_ratio.md +++ /dev/null @@ -1,36 +0,0 @@ -### Understand the alert - -This alert indicates a high ratio of waited table locks in your MySQL database over the last 10 seconds. If you receive this alert, it means that there might be performance issues due to contention for table locks. - -### What are table locks? - -Table locks are a method used by MySQL to ensure data consistency and prevent multiple clients from modifying the same data at the same time. When a client attempts to modify data, it must first acquire a lock on the table. If the lock is not available, the client must wait until the lock is released by another client. - -### Troubleshoot the alert - -1. Identify problematic queries: - - Use the following command to display the queries that are causing table locks in your MySQL database: - - ``` - SHOW FULL PROCESSLIST; - ``` - - Look for queries with a state of `'Locked'` or `'Waiting for table lock'` and note down their details. - -2. Optimize your queries: - - Analyze the problematic queries identified in the previous step and try to optimize them. You can use `EXPLAIN` or other similar tools to get insights into the performance of the queries. - -3. Consider splitting your table(s): - - If the problem persists after optimizing the queries, consider splitting the large tables into smaller ones. This can help to reduce contention for table locks and improve performance. - -4. Use replication: - - Another solution to this issue is the implementation of MySQL replication, which can reduce contention for table locks by allowing read queries to be executed on replica servers rather than the primary server. - -### Useful resources - -1. [Documentation: Table Locking Issues](https://dev.mysql.com/doc/refman/5.7/en/table-locking.html) -2. [MySQL Replication](https://dev.mysql.com/doc/refman/8.0/en/replication.html) diff --git a/health/guides/mysql/mysql_connections.md b/health/guides/mysql/mysql_connections.md deleted file mode 100644 index 2f57fef2..00000000 --- a/health/guides/mysql/mysql_connections.md +++ /dev/null @@ -1,74 +0,0 @@ -### Understand the alert - -The `mysql_connections` alert indicates the percentage of used client connections compared to the maximum configured connections. When you receive this alert, it means your MySQL or MariaDB server is reaching its connection limit, which could lead to performance issues or failed connections for clients. - -### Troubleshoot the alert - -1. **Check the current connection usage** - - Use the following command to see the current used and total connections: - - ``` - mysql -u root -p -e "SHOW STATUS LIKE 'max_used_connections'; SHOW VARIABLES LIKE 'max_connections';" - ``` - - This will display the maximum number of connections used since the server was started and the maximum allowed number of connections (`max_connections`). - -2. **Monitor connections over time** - - You can monitor the connection usage over time using the following command: - - ``` - watch -n 1 "mysql -u root -p -e 'SHOW STATUS LIKE \"Threads_connected\";'" - ``` - - This will update the number of currently connected threads every second. - -3. **Identify connection-consuming processes** - - If connection usage is high, check which processes or clients are using connections: - - ``` - mysql -u root -p -e "SHOW PROCESSLIST;" - ``` - - This gives you an overview of the currently connected clients, their states, and queries being executed. - -4. **Optimize client connections** - - Analyze the processes using connections and ensure they close their connections properly when done, utilize connection pooling, and reduce the number of connections where possible. - -5. **Increase the connection limit (if necessary)** - - If you need to increase the `max_connections` value, follow these steps: - - - Log into MySQL from the terminal as shown in the troubleshooting section: - - ``` - mysql -u root -p - ``` - - - Check the current limit: - - ``` - show variables like "max_connections"; - ``` - - - Set a new limit temporarily: - - ``` - set global max_connections = "LIMIT"; - ``` - - Replace "LIMIT" with the desired new limit. - - - To set the limit permanently, locate the `my.cnf` file (typically under `/etc`, but it may vary depending on your installation) and append `max_connections = LIMIT` under the `[mysqld]` section. - - Replace "LIMIT" with the desired new limit, then restart the MySQL/MariaDB service. - -### Useful resources - -1. [How to Increase Max Connections in MySQL](https://ubiq.co/database-blog/how-to-increase-max-connections-in-mysql/) -2. [MySQL 5.7 Reference Manual: SHOW STATUS Syntax](https://dev.mysql.com/doc/refman/5.7/en/show-status.html) -3. [MySQL 5.7 Reference Manual: SHOW PROCESSLIST Syntax](https://dev.mysql.com/doc/refman/5.7/en/show-processlist.html) -4. [MySQL 5.7 Reference Manual: mysqld – The MySQL Server](https://dev.mysql.com/doc/refman/5.7/en/mysqld.html) diff --git a/health/guides/mysql/mysql_galera_cluster_size.md b/health/guides/mysql/mysql_galera_cluster_size.md deleted file mode 100644 index ebe5d64a..00000000 --- a/health/guides/mysql/mysql_galera_cluster_size.md +++ /dev/null @@ -1,50 +0,0 @@ -### Understand the alert - -This alert monitors the Galera cluster size and checks if there is a discrepancy between the current cluster size and the maximum size in the last 2 minutes. A warning is raised if the current size is larger, and a critical alert is raised if the current size is smaller than the maximum size in the last minute. - -### Troubleshoot the alert - -1. Check the network connectivity: - - Galera Cluster relies on persistent network connections. Review your system logs for any connectivity issues or network errors. If you find such issues, work with your network administrator to resolve them. - -2. Check the status of MySQL nodes: - - You can use the following query to examine the status of all nodes in the Galera cluster: - - ``` - SHOW STATUS LIKE 'wsrep_cluster_%'; - ``` - - Look for the `wsrep_cluster_size` and `wsrep_cluster_status` values, and analyze if there are any inconsistencies or issues. - -3. Review Galera logs: - - Inspect the logs of the Galera cluster for any errors, warnings or issues. The log files are usually located in `/var/log/mysql` or `/var/lib/mysql` directories. - -4. Check node synchronization: - - - Ensure that all nodes are synced by checking the `wsrep_local_state_comment` status variable. A value of 'Synced' indicates that the node is in sync with the cluster. - - ``` - SHOW STATUS LIKE 'wsrep_local_state_comment'; - ``` - - - If any node is not synced, check its logs to find the cause of the issue and resolve it. - -5. Restart nodes if necessary: - - If you find that a node is not working properly, you can try to restart the MySQL service on the affected node: - - ``` - sudo systemctl restart mysql - ``` - - Keep in mind that restarting a node can cause temporary downtime for applications connecting to that specific node. - -6. If the issue persists, consider contacting the Galera Cluster support team for assistance or consult the [Galera Cluster documentation](https://galeracluster.com/library/documentation/) for further guidance. - -### Useful resources - -1. [Galera Cluster Monitoring](https://galeracluster.com/library/training/tutorials/galera-monitoring.html) -2. [Galera Cluster Documentation](https://galeracluster.com/library/documentation/) diff --git a/health/guides/mysql/mysql_galera_cluster_size_max_2m.md b/health/guides/mysql/mysql_galera_cluster_size_max_2m.md deleted file mode 100644 index 0f14ca8a..00000000 --- a/health/guides/mysql/mysql_galera_cluster_size_max_2m.md +++ /dev/null @@ -1,40 +0,0 @@ -### Understand the alert - -This alert calculates the maximum size of the MySQL Galera cluster over a 2-minute period, starting from one minute ago. If you receive this alert, it means that there has been a significant change in the cluster size, which might affect the database's performance, stability, and data consistency. - -### What is MySQL Galera Cluster? - -MySQL Galera Cluster is a synchronous multi-master cluster for MySQL, built on the Galera replication plugin. It provides high-availability and improved performance for MySQL databases by synchronizing data across multiple nodes. - -### What does the cluster size mean? - -The cluster size refers to the number of nodes participating in a MySQL Galera Cluster. An optimal cluster size ensures that the database can handle more significant workloads, handle node failures, and perform automatic failovers. - -### Troubleshoot the alert - -- Determine the current cluster size - - 1. Connect to any node in the cluster and run the following SQL query: - - ``` - SHOW STATUS LIKE 'wsrep_cluster_size'; - ``` - - 2. The query will display the current number of nodes in the cluster. - -- Identify the cause of the cluster size change - - 1. Check the MySQL and Galera logs on all nodes to identify any issues, such as network connectivity issues, node crashes, or hardware problems. - - 2. Review the logs for events such as joining or leaving of the cluster nodes. Look for patterns that could lead to instability (e.g., frequent node join & leave events). - -- Resolve the issue - - 1. Fix any identified problems causing the cluster size change. This may involve monitoring and resolving any network issues, restarting failed nodes, or replacing faulty hardware. - - 2. If necessary, plan and execute a controlled reconfiguration of the Galera cluster to maintain the optimal cluster size. - -### Useful resources - -1. [Galera Cluster Documentation](https://galeracluster.com/library/documentation/) -2. [Monitoring Galera Cluster for MySQL or MariaDB](https://severalnines.com/database-blog/monitoring-galera-cluster-mysql-or-mariadb)
\ No newline at end of file diff --git a/health/guides/mysql/mysql_galera_cluster_state_crit.md b/health/guides/mysql/mysql_galera_cluster_state_crit.md deleted file mode 100644 index c1ac649e..00000000 --- a/health/guides/mysql/mysql_galera_cluster_state_crit.md +++ /dev/null @@ -1,46 +0,0 @@ -### Understand the alert - -The `mysql_galera_cluster_state_crit` alert is triggered when the Galera node state is either `Undefined`, `Joining`, or `Error`. This indicates that there is an issue with a Galera node in your MySQL Galera Cluster. - -### What is a MySQL Galera Cluster? - -MySQL Galera Cluster is a synchronous, multi-master database cluster that provides high availability, no data loss, and scalability for your MySQL databases. It uses Galera replication library and MySQL server to achieve these goals. - -### Troubleshoot the alert - -To troubleshoot the MySQL Galera Cluster State Critical alert, follow these steps: - -1. Inspect the MariaDB error log - - Check the MariaDB error log for any relevant error messages that can help identify the issue. - - ``` - sudo tail -f /var/log/mysql/error.log - ``` - -2. Check the Galera node's status - - Connect to the problematic MySQL node and check the Galera node status by running the following query: - - ``` - SHOW STATUS LIKE 'wsrep_%'; - ``` - - Take note of the value of `wsrep_local_state` and `wsrep_local_state_comment`. - -3. Diagnose the issue - - - If `wsrep_local_state` is 0 (`Undefined`), it means the node is not part of any cluster. - - If `wsrep_local_state` is 1 (`Joining`), it means the node is trying to connect or reconnect to the cluster. - - If `wsrep_local_state` is 5 (`Error`), it means the node has encountered a consistency error. - -4. Resolve the issue - - - For an `Undefined` state, check and fix the wsrep configuration settings and restart the node. - - For a `Joining` state, ensure that the node can communicate with the other nodes in the cluster and make sure that the cluster's state is healthy. Then, retry joining the node to the cluster. - - For an `Error` state, the node may need to be resynchronized with the cluster. Restart the mysqld process on the affected node, or you may need to perform a full state transfer to recover. - -5. Monitor the cluster - - After resolving the issue, monitor the cluster to ensure that all nodes are healthy and remain in-sync. - diff --git a/health/guides/mysql/mysql_galera_cluster_state_warn.md b/health/guides/mysql/mysql_galera_cluster_state_warn.md deleted file mode 100644 index e03ffa2e..00000000 --- a/health/guides/mysql/mysql_galera_cluster_state_warn.md +++ /dev/null @@ -1,43 +0,0 @@ -### Understand the alert - -This alert checks the state of a Galera node in a MySQL Galera cluster. If you receive this alert, it means that the node is either in the **Donor/Desynced** state or the **Joined** state, which can indicate potential issues within the cluster. - -### What does Donor/Desynced and Joined state mean? - -1. **Donor/Desynced**: When a node is in the Donor/Desynced state, it is providing a State Snapshot Transfer (SST) to another node in the cluster. During this time, the node is not synchronized with the rest of the cluster and cannot process any write or commit requests. - -2. **Joined**: In the Joined state, a node has completed the initial SST and is now catching up with any missing transactions through an Incremental State Transfer (IST). - -### Troubleshoot the alert - -1. Check the Galera cluster status with the following command: - - ``` - SHOW STATUS LIKE 'wsrep_%'; - ``` - -2. Verify if any node is in the Donor/Desynced or Joined state: - - ``` - SELECT VARIABLE_NAME, VARIABLE_VALUE FROM information_schema.GLOBAL_STATUS WHERE VARIABLE_NAME IN ('wsrep_local_state_comment', 'wsrep_cluster_status', 'wsrep_ready'); - ``` - -3. Identify the cause of the node state change. Some possible reasons are: - - - A new node has joined the cluster and requires an SST. - - A node has been restarted, and it is rejoining the cluster. - - A node experienced a temporary network issue and is now resynchronizing with the cluster. - -4. Monitor the progress of the resynchronization process using the `SHOW STATUS` command, as provided above, and wait for the node to reach the *Synced* state. - -5. If the node remains in the Donor/Desynced or Joined state for an extended period, investigate further to determine the cause of the issue: - - - Inspect the MySQL error log for any relevant messages. - - Check for network issues or connectivity problems between the nodes. - - Verify the cluster configuration and ensure all nodes have a consistent configuration. - -6. Contact your DBA for assistance if the issue persists, as they may need to perform additional investigation and troubleshooting. - -### Useful resources - -1. [Galera Cluster's Documentation](https://galeracluster.com/library/documentation/) diff --git a/health/guides/mysql/mysql_galera_cluster_status.md b/health/guides/mysql/mysql_galera_cluster_status.md deleted file mode 100644 index c5b07516..00000000 --- a/health/guides/mysql/mysql_galera_cluster_status.md +++ /dev/null @@ -1,39 +0,0 @@ -### Understand the alert - -This alert indicates the current status of the Galera node cluster component in your MySQL or MariaDB database. Receiving this alert means that there is a potential issue with the cluster, such as a network partition that has caused the cluster to split into multiple components. - -### Troubleshoot the alert - -1. **Check the status of the Galera cluster** - - First, you need to determine the current status of the cluster to understand the severity of the issue. Check the value of the alert. Refer to the table in the given alert description to see which state your cluster is in. - -2. **Verify cluster connectivity** - - If your cluster is in a non-primary state or disconnected, you should verify if all the nodes in your cluster can communicate with each other. You can use tools like `ping`, `traceroute`, or `mtr` to test connectivity between the cluster nodes. If there is a network issue, get in touch with your network administrator to resolve it. - -3. **Examine node logs** - - Check the logs on each node for any indication of issues or error messages that can help identify the root cause of the problem. The logs are usually located in the `/var/log/mysqld.log` file or in the `/var/log/mysql/error.log` file. Look for lines that contain "ERROR" or "WARNING" as a starting point. - -4. **Inspect Galera cluster settings** - - Analyze your Galera cluster configuration file (`/etc/my.cnf` or `/etc/mysql/my.cnf`) to make sure you have the correct settings, including the initial `wsrep_cluster_address` value, which defines the initial list of nodes in the cluster. If you find any misconfiguration, correct it and restart your database service. - -5. **Force a new primary component** - - If you have a split-brain scenario, where multiple parts of the cluster are claiming to be the primary component, you need to force a new primary component. To do this, you can use the `SET GLOBAL wsrep_provider_options='pc.bootstrap=YES';` statement on one of the nodes that has the most up-to-date data. This action will force that node to act as the new primary component. - -### Prevention - -To minimize the risks of cluster issues, ensure the following: - -1. Use reliable and redundant network connections between nodes. -2. Configure Galera cluster settings correctly. -3. Regularly monitor the cluster status and review logs. -4. Use the latest stable version of the Galera cluster software. - -### Useful resources - -1. [MariaDB Galera Cluster Documentation]( - https://mariadb.com/kb/en/getting-started-with-mariadb-galera-cluster/) diff --git a/health/guides/mysql/mysql_replication.md b/health/guides/mysql/mysql_replication.md deleted file mode 100644 index 50f7e543..00000000 --- a/health/guides/mysql/mysql_replication.md +++ /dev/null @@ -1,64 +0,0 @@ -### Understand the alert - -This alert is triggered when the replication status of a MySQL server is indicating a problem or failure. Replication is important for redundancy, data backup, or load balancing. Issues with replication threads can lead to data inconsistencies or potential loss of data. - -### Troubleshoot the alert - -1. Identify the failing thread: - - As mentioned above, use the appropriate command for your MySQL or MariaDB version to check the status of replication threads and determine which of them (I/O or SQL) is not running. - - For MySQL and MariaDB before v10.2.0, use: - - ``` - SHOW SLAVE STATUS\G - ``` - - For MariaDB v10.2.0+, use: - - ``` - SHOW ALL SLAVES STATUS\G - ``` - -2. Inspect the MySQL error log: - - The MySQL error log can provide valuable information about the possible cause of the replication issues. Check the log for any replication-related error messages: - - ``` - tail -f /path/to/mysql/error.log - ``` - - Replace `/path/to/mysql/error.log` with the correct path to the MySQL error log file. - -3. Check the source MySQL server: - - Replication issues can also originate from the source MySQL server. Make sure that the source server is properly configured and running, and that the binary logs are being written and flushed correctly. - - Refer to the [MySQL documentation](https://dev.mysql.com/doc/refman/5.7/en/replication-howto.html) for more information on configuring replication. - -4. Restart the replication threads: - - After identifying and resolving any issues found in the previous steps, you can try restarting the replication threads: - - ``` - STOP SLAVE; - START SLAVE; - ``` - - For MariaDB v10.2.0+ with multi-source replication, you may need to specify the connection name: - - ``` - STOP ALL SLAVES; - START ALL SLAVES; - ``` - -5. Verify the replication status: - - After restarting the replication threads, use the appropriate command from step 1 to verify that the threads are running, and that the replication is working as expected. - -### Useful resources - -1. [How To Set Up Replication in MySQL](https://www.digitalocean.com/community/tutorials/how-to-set-up-replication-in-mysql) -2. [MySQL Replication Administration and Status](https://dev.mysql.com/doc/refman/5.7/en/replication-administration-status.html) -3. [Replication Replica I/O Thread States](https://dev.mysql.com/doc/refman/5.7/en/replica-io-thread-states.html) -4. [Replication Replica SQL Thread States](https://dev.mysql.com/doc/refman/5.7/en/replica-sql-thread-states.html)
\ No newline at end of file diff --git a/health/guides/mysql/mysql_replication_lag.md b/health/guides/mysql/mysql_replication_lag.md deleted file mode 100644 index 9c57f810..00000000 --- a/health/guides/mysql/mysql_replication_lag.md +++ /dev/null @@ -1,30 +0,0 @@ -### Understand the alert - -This alert presents the number of seconds that the replica is behind the master. Receiving this means that the replication SQL thread is far behind processing the source binary log. A constantly high value (or an increasing one) indicates that the replica is unable to handle events from the source in a timely fashion. - -This alert is raised into warning when the metric exceeds 10 seconds. If the number of seconds that the replica is behind the master exceeds 30 seconds then the alert is raised into critical. - - -### Troubleshoot the alert - -- Query optimization and "log_slow_slave_statements" - -To minimize slave `SQL_THREAD` lag, focus on query optimization. The following logs will help you identify the problem: -1. Enable [log_slow_slave_statements](https://dev.mysql.com/doc/refman/8.0/en/replication-options-replica.html#sysvar_log_slow_slave_statements) to see queries executed by slave that take more than [long_query_time](https://dev.mysql.com/doc/refman/8.0/en/server-system-variables.html#sysvar_long_query_time). -2. To get more information about query performance, set the configuration option [log_slow_verbosity](https://www.percona.com/doc/percona-server/5.1/diagnostics/slow_extended.html?id=percona-server:features:slow_extended_51&redirect=2#log_slow_verbosity) to `full`. - -You can also read the Percona blog for a nice write-up about[MySQL replication slave lag](https://www.percona.com/blog/2014/05/02/how-to-identify-and-cure-mysql-replication-slave-lag/). - -### Useful resources - -1. [Replication in MySQL]( - https://www.digitalocean.com/community/tutorials/how-to-set-up-replication-in-mysql) -2. [MySQL Replication Slave Lag]( - https://www.percona.com/blog/2014/05/02/how-to-identify-and-cure-mysql-replication-slave-lag/) -3. [log_slow_slave_statements]( - https://dev.mysql.com/doc/refman/8.0/en/replication-options-replica.html#sysvar_log_slow_slave_statements) -4. [long_query_time]( - https://dev.mysql.com/doc/refman/8.0/en/server-system-variables.html#sysvar_long_query_time) -5. [log_slow_verbosity]( - https://www.percona.com/doc/percona-server/5.1/diagnostics/slow_extended.html?id=percona-server:features:slow_extended_51&redirect=2#log_slow_verbosity) - diff --git a/health/guides/net/10min_fifo_errors.md b/health/guides/net/10min_fifo_errors.md deleted file mode 100644 index 845ae6af..00000000 --- a/health/guides/net/10min_fifo_errors.md +++ /dev/null @@ -1,42 +0,0 @@ -### Understand the alert - -Between the IP stack and the Network Interface Controller (NIC) lies the driver queue. This queue is typically implemented as a FIFO ring buffer into the memory space allocated by the driver. The NIC receive frames and place them into memory as skb_buff data structures (SocKet Buffer). We can have queues (ingress queues) and transmitted (egress queues) but these queues do not contain any actual packet data. Each queue has a pointer to the devices associated with it, and to the skb_buff data structures that store the ingress/egress packets. The number of frames this queue can handle is limited. Queues fill up when an interface receives packets faster than kernel can process them. - -Netdata monitors the number of FIFO errors (number of times an overflow occurs in the ring buffer) for a specific network interface in the last 10 minutes. This alarm is triggered when the NIC is not able to handle the peak load of incoming/outgoing packets with the current ring buffer size. - -Not all NICs support FIFO queue operations. - -### More about SKB - -The SocKet Buffer (SKB), is the most fundamental data structure in the Linux networking code. Every packet sent or received is handled using this data structure. This is a large struct containing all the control information required for the packet (datagram, cell, etc). - -The struct sk_buff has the following fields to point to the specific network layer headers: - -- transport_header (previously called h) – This field points to layer 4, the transport layer (and can include tcp header or udp header or - icmp header, and more) - -- network_header (previously called nh) – This field points to layer 3, the network layer (and can include ip header or ipv6 header or arp - header). - -- mac_header (previously called mac) – This field points to layer 2, the link layer. - -- skb_network_header(skb), skb_transport_header(skb) and skb_mac_header(skb) - These return pointer to the header. - -### Troubleshoot the alert - -- Update the ring buffer size - -1. To view the maximum RX ring buffer size: - - ``` - ethtool -g enp1s0 - ``` - -2. If the values in the Pre-set maximums section are higher than in the Current hardware settings section, increase RX (or TX) ring buffer: - - ``` - enp1s0 rx 4080 - ``` - -3. Verify the change to make sure that you no longer receive the alarm when running the same workload. To make this permanently, you must consult your distribution guides. - diff --git a/health/guides/net/10min_netisr_backlog_exceeded.md b/health/guides/net/10min_netisr_backlog_exceeded.md deleted file mode 100644 index d40d2c9a..00000000 --- a/health/guides/net/10min_netisr_backlog_exceeded.md +++ /dev/null @@ -1,56 +0,0 @@ -### Understand the alert - -The `10min_netisr_backlog_exceeded` alert occurs when the `netisr_maxqlen` queue within FreeBSD's network kernel dispatch service reaches its maximum capacity. This queue stores packets received by interfaces and waiting to be processed by the destined subsystems or userland applications. When the queue is full, the system drops new packets. This alert indicates that the average number of dropped packets in the last minute has exceeded the netisr queue length. - -### Troubleshoot the alert - -1. **Increase the netisr_maxqlen value** - - a. Check the current value: - - ``` - root@netdata~ # sysctl net.route.netisr_maxqlen - net.route.netisr_maxqlen: 256 - ``` - - b. Increase the value by a factor of 4: - - ``` - root@netdata~ # sysctl -w net.route.netisr_maxqlen=1024 - ``` - - c. Verify the change and test with the same workload that triggered the alarm originally: - - ``` - root@netdata~ # sysctl net.route.netisr_maxqlen - net.route.netisr_maxqlen: 1024 - ``` - - d. If the change works for your system, make it permanent by adding this entry, `net.route.netisr_maxqlen=1024`, to `/etc/sysctl.conf`. - - e. Reload the sysctl settings: - - ``` - root@netdata~ # /etc/rc.d/sysctl reload - ``` - -2. **Monitor the system** - - After increasing the `netisr_maxqlen` value, continue to monitor your system's dropped packet statistics using tools like `netstat` to determine if the queue backlog situation has improved. If you are still experiencing high packet drop rates, you may need to further increase the `netisr_maxqlen` value, or explore other optimizations for your networking stack. - -3. **Check hardware and system resources** - - In some cases, overloaded or underpowered hardware may cause issues with packet processing. Ensure that your hardware (network cards, switches, routers, etc.) is performing optimally, and that your system has enough CPU and RAM resources to handle the traffic load. - -4. **Network traffic analysis** - - Analyze your network traffic using tools like `tcpdump`, `iftop`, or `iptraf` to identify specific traffic patterns or types causing the backlog issue. This analysis can help you optimize your network infrastructure or take actions to reduce unnecessary traffic. - -5. **Update FreeBSD version** - - Ensure that your FreeBSD system is up to date, as newer kernel versions may include performance improvements and optimizations for packet processing. Updating to a newer version might help resolve netisr backlog issues. - -### Useful resources - -1. [FreeBSD Performance Tuning](https://calomel.org/freebsd_network_tuning.html) -2. [FreeBSD Handbook: Tuning Kernel Limits](https://www.freebsd.org/doc/en_US.ISO8859-1/books/handbook/configtuning-kernel-limits.html) diff --git a/health/guides/net/10s_received_packets_storm.md b/health/guides/net/10s_received_packets_storm.md deleted file mode 100644 index 29e1f534..00000000 --- a/health/guides/net/10s_received_packets_storm.md +++ /dev/null @@ -1,23 +0,0 @@ -### Understand the alert - -This alert is triggered when there is a significant increase in the number of received packets within a 10-second interval. It indicates a potential packet storm, which may cause network congestion, dropped packets, and reduced performance. - -### Troubleshoot the alert - -1. **Check network utilization**: Monitor network utilization on the affected interface to identify potential bottlenecks, high bandwidth usage, or network saturation. - -2. **Identify the source**: Determine the source of the increased packet rate. This may be caused by a misconfigured application, a faulty network device, or a Denial of Service (DoS) attack. - -3. **Inspect network devices**: Check network devices such as routers, switches, and firewalls for potential issues, misconfigurations, or firmware updates that may resolve the problem. - -4. **Verify application behavior**: Ensure that the applications running on your network are behaving as expected and not generating excessive traffic. - -5. **Implement rate limiting**: If the packet storm is caused by a specific application or service, consider implementing rate limiting to control the number of packets being sent. - -6. **Monitor network security**: Check for signs of a DoS attack or other security threats, and take appropriate action to mitigate the risk. - -### Useful resources - -1. [Wireshark User's Guide](https://www.wireshark.org/docs/wsug_html_chunked/) -2. [Tcpdump Manual Page](https://www.tcpdump.org/manpages/tcpdump.1.html) -3. [Iperf - Network Bandwidth Measurement Tool](https://iperf.fr/) diff --git a/health/guides/net/1m_received_packets_rate.md b/health/guides/net/1m_received_packets_rate.md deleted file mode 100644 index 891e8bf3..00000000 --- a/health/guides/net/1m_received_packets_rate.md +++ /dev/null @@ -1,45 +0,0 @@ -### Understand the alert - -1m_received_packets_rate alert indicates the average number of packets received by the network interface on your system over the last minute. If you receive this alert, it signifies higher than usual network traffic incoming. - -### What do received packets mean? - -A received packet is a unit of data that is transmitted through the network interface to your system. Higher received packets rate means an increase in incoming network traffic to your system. It could be due to legitimate usage or could signal a potential issue such as a network misconfiguration, an attack, or a system malfunction. - -### Troubleshoot the alert - -1. Analyze the network throughput: Use the `nload` or `iftop` command to check the incoming traffic on your system's network interfaces. These commands display the current network traffic and will help you monitor the incoming data. - - ``` - sudo nload <network_interface> // or - sudo iftop -i <network_interface> - ``` - - Replace `<network_interface>` with your network interface (e.g., eth0). - -2. Check for specific processes consuming unusually high network bandwidth: Use the `netstat` command combined with `grep` to filter the results and find processes with high network traffic. - - ``` - sudo netstat -tunap | grep <network_interface> - ``` - - Replace `<network_interface>` with your network interface (e.g., eth0). - -3. Identify host-consuming bandwidth: After identifying the processes consuming a high network, you can trace back their respective hosts. Use the `tcpdump` command to capture live network traffic and analyze it for specific IP addresses causing the high packets rate. - - ``` - sudo tcpdump -n -i <network_interface> -c 100 - ``` - - Replace `<network_interface>` with your network interface (e.g., eth0). - -4. Mitigate the issue: Depending on the root cause, apply appropriate remedial actions. This may include: - - Adjusting application/service configuration to reduce network traffic - - Updating firewall rules to block undesired sources/IPs - - Ensuring network devices are appropriately configured - - Addressing system overload issues that hamper network performance - -### Useful resources - -1. [nload - Monitor Linux Network Traffic and Bandwidth Usage in Real Time](https://www.tecmint.com/nload-monitor-linux-network-traffic-bandwidth-usage/) -2. [An Introduction to the ss Command](http://www.binarytides.com/linux-ss-command/) diff --git a/health/guides/net/1m_received_traffic_overflow.md b/health/guides/net/1m_received_traffic_overflow.md deleted file mode 100644 index 270dd892..00000000 --- a/health/guides/net/1m_received_traffic_overflow.md +++ /dev/null @@ -1,24 +0,0 @@ -### Understand the alert - -Network interfaces are categorized primarily on the bandwidth they can operate (1 Gbps, 10 Gbps, etc). High network utilization occurs when the volume of data on a network link approaches the capacity of the link. Netdata agent -calculates the average outbound utilization for a specific network interface over the last minute. High outbound utilization increases latency and packet loss because packet bursts are buffered - -This alarm may indicate either network congestion or malicious activity. - -### Troubleshoot the alert - -- Prioritize important traffic - -Quality of service (QoS) is the use of routing prioritization to control traffic and ensure the performance of critical applications. QoS works best when low-priority traffic exists that can be dropped when congestion occurs. The higher-priority traffic must fit within the bandwidth limitations of the link or path. - -- Add more bandwidth - - - For **Cloud infrastructures**, adding bandwidth might be easy. It depends on your cloud infrastracture and your cloud provider. Some of them either offer you the service to upgrade machines to a higher bandwidth rate or upgrade you machine to a more powerful one with higher bandwidth rate. - - - For **Bare-metal** machines, you will need either a hardware upgrade or the addition of a network card using link aggregation to combine multiple network connections in parallel (e.g LACP). - -### Useful resources - -- [FireQOS](https://firehol.org/tutorial/fireqos-new-user/) is a traffic shaping helper. It has a very simple shell scripting language to express traffic shaping. - -- [`tcconfig`](https://tcconfig.readthedocs.io/en/latest/index.html) is a command wrapper that makes it easy to set up traffic control of network bandwidth/latency/packet-loss/packet-corruption/etc.
\ No newline at end of file diff --git a/health/guides/net/1m_sent_traffic_overflow.md b/health/guides/net/1m_sent_traffic_overflow.md deleted file mode 100644 index 376d578c..00000000 --- a/health/guides/net/1m_sent_traffic_overflow.md +++ /dev/null @@ -1,23 +0,0 @@ -### Understand the alert - -Network interfaces are categorized primarily on the bandwidth rate at which they can operate (1 Gbps, 10 Gbps, etc). High network utilization occurs when the volume of data on a network link approaches the capacity of the link. Netdata agent calculates the average outbound utilization for a specific network interface over the last minute. High outbound utilization increases latency and packet loss because packet bursts are buffered. - -This alarm may indicate either a network congestion or malicious activity. - -### Troubleshoot the alert - -- Prioritize important traffic - -Quality of service (QoS) is the use of mechanisms or technologies to control traffic and ensure the performance of critical applications. QoS works best when low-priority traffic exists that can be dropped when congestion occurs. The higher-priority traffic must fit within the bandwidth limitations of the link or path. - -- Add more bandwidth - - - For **Cloud infrastructures**, adding bandwidth might be easy. It depends on your cloud infrastracture and your cloud provider. Some of them either offer you the service to upgrade machines to a higher bandwidth rate or upgrade you machine to a more powerful one with higher bandwidth rate. - - - For **Bare-metal** machines, you will need either a hardware upgrade or the addition of a network card using link aggregation to combine multiple network connections in parallel (e.g LACP). - -### Useful resources - -- [FireQOS](https://firehol.org/tutorial/fireqos-new-user/) is a traffic shaping helper. It has a very simple shell scripting language to express traffic shaping. - -- [`tcconfig`](https://tcconfig.readthedocs.io/en/latest/index.html) is a command wrapper that makes it easy to set up traffic control of network bandwidth/latency/packet-loss/packet-corruption/etc.
\ No newline at end of file diff --git a/health/guides/net/inbound_packets_dropped.md b/health/guides/net/inbound_packets_dropped.md deleted file mode 100644 index e2519630..00000000 --- a/health/guides/net/inbound_packets_dropped.md +++ /dev/null @@ -1,58 +0,0 @@ -### Understand the alert - -This alert is triggered when the number of inbound dropped packets for a network interface exceeds a specified threshold during the last 10 minutes. A dropped packet means that the network device could not process the packet, hence it was discarded. - -### What are the common causes of dropped packets? - -1. Network Congestion: When the network traffic is too high, the buffer may overflow before the device can process the packets, causing some packets to be dropped. -2. Link Layer Errors: Packets can be dropped due to errors in the link layer causing frames to be corrupted. -3. Insufficient Resources: The network interface may fail to process incoming packets due to a lack of memory or CPU resources. - -### Troubleshoot the alert - -1. Check the overall system resources - - Run the `vmstat` command to get a report about your system statistics. - - ``` - vmstat 1 - ``` - - Check if the CPU or memory usage is high. If either is near full utilization, consider upgrading system resources or managing the load more efficiently. - -2. Check network interface statistics - - Run the `ifconfig` command to get more information on the network interface. - - ``` - ifconfig <INTERFACE> - ``` - - Look for the `RX dropped` field to confirm the number of dropped packets. - -3. Monitor network traffic - - Use `iftop` or `nload` to monitor the network traffic in real time. If you don't have these tools, install them: - - ``` - sudo apt install iftop nload - ``` - - ``` - iftop -i <INTERFACE> - nload <INTERFACE> - ``` - - Identify if there is unusually high traffic on the network interface. - -4. Check logs for any related errors - - Check the system logs for any errors related to the network interface or driver: - - ``` - sudo dmesg | grep -i "eth0" - sudo journalctl -u networking.service - ``` - - If you find any errors, you can research the specific problem and apply the necessary fixes. - diff --git a/health/guides/net/inbound_packets_dropped_ratio.md b/health/guides/net/inbound_packets_dropped_ratio.md deleted file mode 100644 index 7bc9ed8e..00000000 --- a/health/guides/net/inbound_packets_dropped_ratio.md +++ /dev/null @@ -1,52 +0,0 @@ -### Understand the alert - -Packet drops indicate that your system received some packets but could not process them. A sizeable amount of packet drops can consume significant amount of resources in your system. Some reasons that packets drops occurred in your system could be: - -- Your system receives packets with bad VLAN tags. -- The packets you are receiving are using a protocol that is unknown to your system. -- You receive IPv6 packets, but your system is not configured for IPv6. - -All these packets consume resources until being dropped (and for a short period after). For example, your NIC stores them in a ring-buffer until they are forwarded to the destined subsystem or userland application for further process. - -Netdata calculates the ratio of inbound dropped packets for your wired network interface over the last 10 minutes. - -### Identify VLANs in your interface - -There are cases in which traffic is routed to your host due to the existence of multiple VLAN in your network. - -1. Identify VLAN tagged packet in your interface. - -``` -tcpdump -i <your_interface> -nn -e vlan -``` - -2. Monitor the output of the `tcpdump`, identify VLANs which may exist. If no output is displayed, your interface probably uses traditional ethernet frames. - -3. Depending on your network topology, you may consider removing unnecessary VLANs from the switch trunk port toward your host. - -### Update the ring buffer size on your interface - -1. To view the maximum RX ring buffer size: - - ``` - ethtool -g enp1s0 - ``` - -2. If the values in the Pre-set maximums section are higher than in the current hardware settings section, increase RX - ring buffer: - - ``` - enp1s0 rx 4080 - ``` - -3. Verify the change to make sure that you no longer receive the alarm when running the same workload. To make this - permanently, you must consult your distribution guides. - - -### Inspect the packets your network interface receives - -Wireshark is a free and open-source packet analyzer. It is used for network troubleshooting, analysis, software and communications protocol development. - -### Useful resources - -[Read more about Wireshark here](https://www.wireshark.org/)
\ No newline at end of file diff --git a/health/guides/net/interface_inbound_errors.md b/health/guides/net/interface_inbound_errors.md deleted file mode 100644 index 6c8bcfcd..00000000 --- a/health/guides/net/interface_inbound_errors.md +++ /dev/null @@ -1,36 +0,0 @@ -- Troubleshoot errors related to network congestion - -Network congestion can cause packets to be dropped, leading to interface inbound errors. To determine if congestion is the issue, you can monitor the network for any signs of excessive workload or high utilization rates. - -1. Use `ifconfig` to check the network interface utilization: - ``` - ifconfig <your_interface> - ``` - -2. Check the network switch/router logs for any indication of high utilization, errors or warnings. - -3. Use monitoring tools like `iftop`, `nload`, or `iptraf` to monitor network traffic and identify any bottle-necks or usage spikes. - -If you find that congestion is causing the inbound errors, consider ways to alleviate the issue including upgrading your network infrastructure or load balancing the traffic. - -- Troubleshoot errors caused by faulty network equipment - -Faulty network devices, such as switches and routers, can introduce errors in packets. To identify the cause, you should review the logs and statistics of any network devices in the path of the communication between the sender and this system. - -1. Check the logs of the network equipment for any indications of errors, problems or unusual behavior. - -2. Review the error counters and statistics of the network equipment to identify any trends or issues. - -3. Consider replacing or upgrading faulty equipment if it is found to be responsible for inbound errors. - -- Troubleshoot errors caused by software or configuration issues - -Incorrect configurations or software issues can also contribute to interface inbound errors. Some steps to troubleshoot these potential causes are: - -1. Review the system logs for any errors or warnings related to the network subsystem. - -2. Ensure that the network interface is configured correctly, and proper drivers are installed and up-to-date. - -3. Examine the system's firewall and security settings to verify that there are no inappropriate blockings or restrictions that may be causing the errors. - -In conclusion, by following these troubleshooting steps, you should be able to identify and resolve the cause of interface inbound errors on your FreeBSD system. Remember to monitor the situation regularly and address any new issues that may arise to ensure a stable and efficient networking environment.
\ No newline at end of file diff --git a/health/guides/net/interface_outbound_errors.md b/health/guides/net/interface_outbound_errors.md deleted file mode 100644 index 194d8aba..00000000 --- a/health/guides/net/interface_outbound_errors.md +++ /dev/null @@ -1,42 +0,0 @@ -### Understand the alert - -This alert is triggered when there is a high number of outbound errors on a specific network interface in the last 10 minutes on a FreeBSD system. When you receive this alert, it means that the network interface is facing transmission-related issues, such as aborted, carrier, FIFO, heartbeat, or window errors. - -### Troubleshoot the alert - -1. Identify the network interface with the problem - Use `ifconfig` to get a list of all network interfaces and their error count: - ``` - ifconfig -a - ``` - Check the "Oerrs" (Outbound errors) field for each interface to find the one with the issue. - -2. Check the interface speed and duplex settings - The speed and duplex settings may mismatch between the network interface and the network equipment (like switches and routers) that it is connected to. Use `ifconfig` or `ethtool` to check these settings. - - With `ifconfig`: - ``` - ifconfig <interface_name> - ``` - - If required, adjust the speed and duplex settings using `ifconfig`: - ``` - ifconfig <interface_name> media <media_type> - ``` - `<media_type>` can be one of the following: 10baseT/UTP, 100baseTX, 1000baseTX, etc., and can include half-duplex or full-duplex. - Example: - ``` - ifconfig em0 media 1000baseTX mediaopt full-duplex - ``` - Ensure both the network interface and the connected device use the same settings. - -3. Check network cables and devices - Check the physical connections of the network cable to both the network interface and the network equipment it connects to. Replace the network cable if necessary. Additionally, verify if the issue is related to the connected network equipment (switches and routers). - -4. Analyze network traffic - Use tools like `tcpdump` or `Wireshark` to analyze the network traffic on the affected interface. This can give you insights into the root cause of the errors and help in troubleshooting device or network-related issues. - -### Useful resources - -1. [FreeBSD ifconfig man page](https://www.freebsd.org/cgi/man.cgi?ifconfig(8)) -2. [FreeBSD Handbook - Configuring the Network](https://www.freebsd.org/doc/handbook/config-network-setup.html) diff --git a/health/guides/net/interface_speed.md b/health/guides/net/interface_speed.md deleted file mode 100644 index 89f967c5..00000000 --- a/health/guides/net/interface_speed.md +++ /dev/null @@ -1,44 +0,0 @@ -### Understand the alert - -This alert indicates the current speed of the network interface `${label:device}`. If you receive this alert, it means that there is a significant change or reduction in the speed of your network interface. - -### What does interface speed mean? - -Interface speed refers to the maximum throughput an interface (network card or adapter) can support in terms of transmitting and receiving data. It is measured in Megabits per second (Mbit/s) and determines the performance of a network connection. - -### Troubleshoot the alert - -- Check the network interface speed. - -To see the interface speed and other information about the network interface, run the following command in the terminal: - -``` -ethtool ${label:device} -``` - -Replace `${label:device}` with your network interface name, e.g., `eth0` or `enp2s0`. - -- Confirm if there is a network congestion issue. - -High network traffic or congestion might cause reduced interface speed. Use the `iftop` utility to monitor the traffic on the network interface. If you don't have `iftop` installed, then [install it](https://www.binarytides.com/linux-commands-monitor-network/). - -Run the following command in the terminal: - -``` -sudo iftop -i ${label:device} -``` - -Replace `${label:device}` with your network interface name. - -- Verify cable connections and quality. - -Physical cable issues might cause reduced speed in the network interface. Check the connections and quality of the cables connecting your system to the network devices such as routers, switches, or hubs. - -- Update network drivers. - -Outdated network drivers can also lead to reduced speed in the network interface. Update the network drivers to the latest version to avoid any compatibility issues or performance degradations. - -- Check for EMI (Electromagnetic Interference). - -Network cables and devices located near power cables or electronic devices producing electromagnetic fields might experience reduced network interface speed. Make sure that your network cables and devices are not in proximity to potential sources of EMI. - diff --git a/health/guides/net/outbound_packets_dropped.md b/health/guides/net/outbound_packets_dropped.md deleted file mode 100644 index 49291d1d..00000000 --- a/health/guides/net/outbound_packets_dropped.md +++ /dev/null @@ -1,57 +0,0 @@ -### Understand the alert - -This alert tracks the number of dropped outbound packets on a specific network interface (`${label:device}`) within the last 10 minutes. If you receive this alert, it means that your system has experienced dropped outbound packets in the monitored network interface, which might indicate network congestion or other issues affecting network performance. - -### What are dropped packets? - -Dropped packets refer to network packets that are discarded or lost within a computer network during transmission. In general, this can be caused by various factors, such as network congestion, faulty hardware, misconfigured devices, or packet errors. - -### Troubleshoot the alert - -1. Identify the affected network interface: - -Check the alert message for the `${label:device}` placeholder. It indicates the network interface experiencing the dropped outbound packets. - -2. Verify network congestion or excessive traffic: - -Excessive traffic or network congestion can lead to dropped packets. To check network traffic, use the `nload` tool. If it isn't installed, you can follow the instructions given [here](https://www.howtoforge.com/tutorial/install-nload-on-linux/). - -```bash -nload ${label:device} -``` - -This will display the current network bandwidth usage on the specified interface. Look for unusually high or fluctuating usage patterns, which could indicate congestion or excessive traffic. - -3. Verify hardware issues: - -Check the network interface and related hardware components (such as the network card, cables, and switches) for visible damage, loose connections, or other issues. Replace any defective components as needed. - -4. Check network interface configuration: - -Review your network interface configuration to ensure that it is correctly set up. To do this, you can use the `ip` or `ifconfig` command. For example: - -```bash -ip addr show ${label:device} -``` - -or - -```bash -ifconfig ${label:device} -``` - -Verify that the IP address, subnet mask, and other network settings match your network configuration. - -5. Check system logs for networking errors: - -Review your system logs to identify any networking error messages that might provide more information on the cause of the dropped packets. - -```bash -grep -i "error" /var/log/syslog | grep "${label:device}" -``` - -6. Monitor your network for packet errors using tools like `tcpdump` or `wireshark`. - -### Useful resources - -1. [How to monitor network bandwidth and traffic in Linux](https://www.binarytides.com/linux-commands-monitor-network/) diff --git a/health/guides/net/outbound_packets_dropped_ratio.md b/health/guides/net/outbound_packets_dropped_ratio.md deleted file mode 100644 index 9b90a97b..00000000 --- a/health/guides/net/outbound_packets_dropped_ratio.md +++ /dev/null @@ -1,27 +0,0 @@ -### Understand the alert - -When we want to investigate the outbound traffic, the journey of a network packet starts at the application layer. - -Data are written (commonly) to a socket by a user program. The programmer may (raw sockets) or may not (datagram and stream sockets) have the possibility of absolute control over the data which is being sent through the network. The kernel will take the data which is written in a socket queue and allocate the necessary socket buffers. The kernel will try to forward the packets to their destination encapsulating the routing metadata (headers, checksums, fragmentation information) for each packet through a network interface. - -The Netdata Agent calculates the ratio of outbound dropped packets for a specific network interface over the last 10 minutes. Receiving this alarm means that packets were dropped on their way to transmission. - -This alert is triggered in warning state when the ratio of outbound dropped packets for a specific network interface over the last 10 minutes is more than 2%. - -The main reasons of outbound packet drops are: - -1. Link congestion -2. Overburdened devices -3. Defective hardware -4. Faulty network configuration -5. Restricted access from firewall rules - -### Troubleshoot the alert: - -Inspect the packets your network interface sends using Wireshark. - -Wireshark is a free and open-source packet analyzer. It is used for network troubleshooting, analysis, software and communications protocol development. - -### Useful resources - -[Read more about Wireshark here](https://www.wireshark.org/)
\ No newline at end of file diff --git a/health/guides/netdev/1min_netdev_backlog_exceeded.md b/health/guides/netdev/1min_netdev_backlog_exceeded.md deleted file mode 100644 index dc7b6a2c..00000000 --- a/health/guides/netdev/1min_netdev_backlog_exceeded.md +++ /dev/null @@ -1,44 +0,0 @@ -### Understand the alert - -The linux kernel contains queues where packets are stored after reception from a network interface controller before being processed by the next protocol stack. There is one netdev backlog queue per CPU core. netdev_max_backlog defines the maximum number of packets that can enter the queue. Queues fill up when an interface receives packets faster than kernel can process them. The default netdev_max_backlog value should be 1000. However this may not be enough in cases such as: - -- Multiple interfaces operating at 1Gbps, or even a single interface at 10Gbps. - -- Lower powered systems process very large amounts of network traffic. - -Netdata monitors the average number of dropped packets in the last minute due to exceeding the netdev backlog queue. - -### Troubleshoot the alert - -- Increase the netdev_max_backlog value - -1. Check your current value: - - ``` - root@netdata~ # sysctl net.core.netdev_max_backlog - net.core.netdev_max_backlog = 1000 - ``` - -2. Try to increase it by a factor of 2. - - ``` - root@netdata~ # sysctl -w net.core.netdev_max_backlog=2000 - ``` - -3. Verify the change and test with the same workload that triggered the alarm originally. - - ``` - root@netdata~ # sysctl net.core.netdev_max_backlog - net.core.netdev_max_backlog = 2000 - ``` - -4. If this change works for your system, you could make it permanently. - - Bump this `net.core.netdev_max_backlog=2000` entry under `/etc/sysctl.conf`. - -5. Reload the sysctl settings. - - ``` - root@netdata~ # sysctl -p - ``` - diff --git a/health/guides/netdev/1min_netdev_budget_ran_outs.md b/health/guides/netdev/1min_netdev_budget_ran_outs.md deleted file mode 100644 index 30539322..00000000 --- a/health/guides/netdev/1min_netdev_budget_ran_outs.md +++ /dev/null @@ -1,55 +0,0 @@ -### Understand the alert - -Your system communicates with the devices attached to it through interrupt requests. In a nutshell, when an interrupt occurs, the operating system stops what it was doing and starts addressing that interrupt. - -Network interfaces can receive thousands of packets per second. To avoid burying the system with thousands of interrupts, the Linux kernel uses the NAPI polling framework. In this way, we can replace hundreds of hardware interrupts with one poll by managing them with a few Soft Interrupt ReQuests (Soft IRQs). Ksoftirqd is a per-CPU kernel thread responsible for handling those unserved Soft Interrupt ReQuests (Soft IRQs). The Netdata agent inspects the average number of times Ksoftirqd ran out of netdev_budget or CPU time when there was still work to be done. This abnormality may cause packet overflow on the intermediate buffers and, as a result, drop packet on your network interfaces. - -The default value of the netdev_budget is 300. However, this may not be enough in some cases, such as: - -- Multiple interfaces operating at 1Gbps, or even a single interface at 10Gbps. - -- Lower powered systems processing very large amounts of network traffic. - -### NAPI polling mechanism. - -The design of NAPI allows the network driver to go into a polling mode, buffering the packets it receives into a ring-buffer, and raises a soft interrupt to start a NAPI polling cycle instead of being hard-interrupted for -every packet. Linux kernel through NAPI will poll data from the buffer until the netdev_budget_usecs times out or the number of packets reaches the netdev_budget limit. - -- netdev_budget_usecs variable defines the maximum number of microseconds in one NAPI polling cycle. -- netdev_budget variable defines the maximum number of packets taken from all interfaces in one polling cycle. - -### Troubleshoot the alert - -- Increase the netdev_budget value. - -1. Check your current value. - - ``` - root@netdata~ $ sysctl net.core.netdev_budget - net.core.netdev_budget = 300 - ``` - -2. Try to increase it gradually with increments of 100. - - ``` - root@netdata~ $ sysctl -w net.core.netdev_budget=400 - ``` - -3. Verify the change and test it with the same workload that triggered the alarm originally. If the problem still exists, try to - increment it again. - - ``` - root@netdata~ $ sysctl net.core.netdev_budget - net.core.netdev_budget = 400 - ``` - -4. If this change works for your system, you could make it permanently. - - Bump this `net.core.netdev_budget=<desired_value>` entry under `/etc/sysctl.conf` - - -5. Reload the sysctl settings. - - ``` - root@netdata~ $ sysctl -p - ```
\ No newline at end of file diff --git a/health/guides/netfilter/netfilter_conntrack_full.md b/health/guides/netfilter/netfilter_conntrack_full.md deleted file mode 100644 index 667f0e49..00000000 --- a/health/guides/netfilter/netfilter_conntrack_full.md +++ /dev/null @@ -1,43 +0,0 @@ -### Understand the alert - -This alert presents the percentage of used netfilter tracked connections. If you receive this alert, there is high utilization of the netfilter "connection tracking state" table size. - -Network delays and packet drops are expected when you are getting closer to 100%. - -- This alert gets raised to warning when the percentage exceeds 90%. -- If the metric exceeds 95%, then the alert gets raised to a critical state. - -### What is the "netfilter" framework? - -Netfilter is a framework provided by the Linux kernel that allows various networking-related operations to be implemented in the form of customized handlers. Netfilter offers various functions and operations for packet filtering, network address translation, and port translation, which provide the functionality required for directing packets through a network and prohibiting packets from reaching sensitive locations within a network. - -### Troubleshoot the alert - -- Table Size Limits - -You can see the table size by running: - -``` -cat /proc/sys/net/netfilter/nf_conntrack_count -``` - -You can see the table size limit by running: - -``` -cat /proc/sys/net/netfilter/nf_conntrack_max -``` - -Recommended Size: CONNTRACK_MAX = RAMSIZE (in bytes) / 16384 / (ARCH / 32). -Eg, If we have 8GB RAM in a x86_64 OS, we would use 8*1024^3/16384/2=262144. - -You can modify the table size limit by running: - -``` -sysctl -w net.netfilter.nf_conntrack_max=<YOUR DESIRED LIMIT HERE> -echo "net.netfilter.nf_conntrack_max=<YOUR DESIRED LIMIT HERE>" >> /etc/sysctl.conf -``` - -### Useful resources - -1. [Netfilter](https://en.wikipedia.org/wiki/Netfilter) -2. [Full Conntrack Table](https://morganwu277.github.io/2018/05/26/Solve-production-issue-of-nf-conntrack-table-full-dropping-packet/) diff --git a/health/guides/nvme/nvme_device_critical_warnings_state.md b/health/guides/nvme/nvme_device_critical_warnings_state.md deleted file mode 100644 index a12381bb..00000000 --- a/health/guides/nvme/nvme_device_critical_warnings_state.md +++ /dev/null @@ -1,36 +0,0 @@ -### Understand the alert - -This alert is triggered when an `NVMe device` experiences `critical warnings`. The alert is focusing on your `NVMe` (Non-Volatile Memory Express) SSD storage device which is designed for high-performance and low-latency storage. - -### What does critical warnings mean? - -A critical warning state indicates that the NVMe device has experienced an event, error, or condition which could negatively impact performance, data integrity or device longevity. This could result from a variety of reasons such as high temperature, hardware failures, internal errors, or device reaching end of life. - -### Troubleshoot the alert - -1. Identify the affected NVMe device(s): - -This alert provides information in the `info` field about the affected device. It should look like: "NVMe device ${label:device} has critical warnings", where `${label:device}` will be replaced with the actual device name. - -2. Check device SMART information: - -`SMART` (Self-Monitoring, Analysis, and Reporting Technology) provides detailed information about the current health and performance of your NVMe device. To check SMART information for the affected NVMe device, use `smartctl` command: - - ``` - sudo smartctl -a /dev/nvme0n1 - ``` - - Replace `/dev/nvme0n1` with the actual device name identified in step 1. - -3. Evaluate the SMART information for critical issues: - -Review the output of the `smartctl` command to identify the critical warnings or any other concerning attributes. You might see high temperature, high uncorrectable error counts, or high percent of used endurance. These values might help you diagnose the issue with your NVMe device. - -4. Take appropriate action based on SMART data: - -- If the temperature of the device is high, ensure proper cooling and airflow in the system. -- If the device is reaching its end of life, plan for a replacement or backup. -- If the device has high uncorrectable error counts, consider backing up critical data and contact the manufacturer for support, as this could indicate a possible hardware failure. - -Make sure to replace, stop the usage of, or seek support for the problematic NVMe device(s) depending on the analysis. - diff --git a/health/guides/pihole/pihole_blocklist_last_update.md b/health/guides/pihole/pihole_blocklist_last_update.md deleted file mode 100644 index d358e04c..00000000 --- a/health/guides/pihole/pihole_blocklist_last_update.md +++ /dev/null @@ -1,55 +0,0 @@ -### Understand the alert - -This alert indicates that the Pi-hole blocklist (Gravity) file hasn't been updated for an extended period of time. The blocklist file contains domains that have been processed by Pi-hole to filter ads and malicious content. An outdated blocklist may leave your system more vulnerable to unwanted content and threats. - -### Troubleshoot the alert - -1. **Check the current blocklist update status** - - To see how long it has been since the last update, you can use the following command: - - ``` - root@netdata~ # pihole -q -adlist - ``` - - This will display the timestamp of the last update. - -2. **Rebuild the blocklist** - - If the alert indicates that your blocklist file is outdated, it's essential to update it by running: - - ``` - root@netdata~ # pihole -g - ``` - - This command will download the necessary files and rebuild the blocklist. - -3. **Check for errors during the update** - - If you encounter any issues during the update, check the `/var/log/pihole.log` file for errors. You can also check the `/var/log/pihole-FTL.log` file for more detailed information on the update process. - -4. **Verify the blocklist update interval** - - To ensure that your blocklist file is updated regularly, make sure you configure a regular update interval. You can do this by editing the `cron` job for Pi-hole: - - ``` - root@netdata~ # crontab -e - ``` - - This will open an editor. Look for the line containing the `pihole -g` command and adjust the schedule accordingly. For example, to update the blocklist daily, add the following line: - - ``` - 0 0 * * * /usr/local/bin/pihole -g - ``` - - Save the file and exit the editor to apply the changes. - -5. **Monitor the blocklist update status** - - After performing the necessary troubleshooting steps, keep an eye on the `pihole_blocklist_last_update` alert to ensure that your blocklist file is updated as expected. - -### Useful resources - -1. [Pi-hole Blocklists](https://docs.pi-hole.net/database/gravity/) -2. [Rebuilding the Blocklist](https://docs.pi-hole.net/ftldns/blockingmode/) -3. [Pi-hole Documentation](https://docs.pi-hole.net/)
\ No newline at end of file diff --git a/health/guides/pihole/pihole_status.md b/health/guides/pihole/pihole_status.md deleted file mode 100644 index 57dd203f..00000000 --- a/health/guides/pihole/pihole_status.md +++ /dev/null @@ -1,54 +0,0 @@ -### Understand the alert - -This alert monitors if Pi-hole's ability of blocking unwanted domains is active. If you receive this alert, it means that your Pi-hole's ad filtering is currently disabled. - -### Troubleshoot the alert - -1. Check the status of Pi-hole - -To check the current status of Pi-hole, run the following command: -``` -pihole status -``` -This command will show if Pi-hole is active or disabled. - -2. Re-enable Pi-hole - -If Pi-hole is disabled as per the status, you can re-enable it by running the following command: - -``` -pihole enable -``` - -3. Confirm Pi-hole is enabled - -After running the previous command, run `pihole status` again to confirm that Pi-hole is now enabled and blocking unwanted domains. - -4. Check for errors or warnings - -If Pi-hole is still not enabled, take a look at the logs for any errors or warnings: - -``` -cat /var/log/pihole.log | grep -i error -cat /var/log/pihole.log | grep -i warning -``` - -5. Rebuild the blocklist - -If you still face issues, you can try rebuilding the blocklist by running: - -``` -pihole -g -``` - -6. Update Pi-hole - -If the problem persists, consider updating Pi-hole to the latest version: - -``` -pihole -up -``` - -### Useful resources - -1. [Pi-hole Official Documentation](https://docs.pi-hole.net/) diff --git a/health/guides/ping/ping_host_latency.md b/health/guides/ping/ping_host_latency.md deleted file mode 100644 index 59ea1be6..00000000 --- a/health/guides/ping/ping_host_latency.md +++ /dev/null @@ -1,48 +0,0 @@ -### Understand the alert - -This alert calculates the average latency (`ping round-trip time`) to a network host (${label:host}) over the last 10 seconds. If you receive this alert, it means there might be issues with your network connectivity or host responsiveness. - -### What does latency mean? - -Latency is the time it takes for a packet of data to travel from the sender to the receiver, and back from the receiver to the sender. In this case, we're measuring the latency using the `ping` command, which sends an ICMP echo request to the host and then waits for the ICMP echo reply. - -### Troubleshoot the alert - -1. Double-check the network connection: - - Verify the network connectivity between your system and the target host. Check if the host is accessible via other tools such as `traceroute` or `mtr`. - - ``` - traceroute ${label:host} - mtr ${label:host} - ``` - -2. Check for packet loss: - - Packet loss can make latency appear higher than it actually is. Use the `ping` command to check for packet loss: - - ``` - ping -c 10 ${label:host} - ``` - - Look for the percentage of packet loss in the output. - -3. Investigate the host: - - If no packet loss is detected and the network connection is stable, the problem might be related to the host itself. Check the host for overloaded resources, such as high CPU usage, disk I/O, or network traffic. - -4. Check DNS resolution: - - If the alert's `${label:host}` is a domain name, make sure that DNS resolution is working properly: - - ``` - nslookup ${label:host} - ``` - -5. Verify firewall and routing: - - Check if any firewall rules or routing policies might be affecting the network traffic between your system and the target host. - -### Useful resources - -1. [Using Ping and Traceroute to troubleshoot network connectivity](https://support.cloudflare.com/hc/en-us/articles/200169336-Using-Ping-and-Traceroute-to-troubleshoot-network-connectivity) diff --git a/health/guides/ping/ping_host_reachable.md b/health/guides/ping/ping_host_reachable.md deleted file mode 100644 index 75e24cbe..00000000 --- a/health/guides/ping/ping_host_reachable.md +++ /dev/null @@ -1,27 +0,0 @@ -### Understand the alert - -This `ping_host_reachable` alert checks the network reachability status of a specific host. When you receive this alert, it means that the host is either `up` (reachable) or `down` (unreachable). - -### What is network reachability? - -Network reachability refers to the ability of a particular host to communicate with other devices or systems within a network. In this alert, the reachability is monitored using the `ping` command, which sends packets to the host and checks for the response. The alert evaluates the packet loss percentage over a 30-second period. - -### Troubleshoot the alert - -1. Verify if the alert is accurate: Check if there are transient network issues or if there is a problem with the particular host. You can run the `ping` command manually to see if the packet loss percentage is consistent over time. - - ``` - ping -c 10 <host IP or domain> - ``` - -2. Check the network connectivity: Ensure there are no issues with the local network or the physical connections (switches, routers, etc.). Look for potential network bottlenecks, high traffic, and hardware failures that can affect reachability. - -3. Check the host's health: If the host is reachable, log in to the system and examine its performance, stability, and resource usage. Look for indicators of high system load, resource constraints, or unresponsive processes. - -4. Examine network security policies and firewalls: Network reachability can be affected by misconfigured firewalls or security policies. Ensure there are no restrictions blocking the communication between the monitoring system and the host. - -5. Analyze logs for any relevant information: Check system logs (e.g., `/var/log/syslog`) and application logs on both the monitoring system and the target host. Look for error messages, timeouts, or connectivity problems. - -### Useful resources - -1. [Understanding High Packet Loss in Networking](https://www.fiberplex.com/blog/understanding-high-packet-loss-in-networking) diff --git a/health/guides/ping/ping_packet_loss.md b/health/guides/ping/ping_packet_loss.md deleted file mode 100644 index 546ecb00..00000000 --- a/health/guides/ping/ping_packet_loss.md +++ /dev/null @@ -1,44 +0,0 @@ -### Understand the alert - -This alert calculates the `ping packet loss` percentage to the network host over the last 10 minutes. If you receive this alert, it means that your network is experiencing increased packet loss. - -### What does ping packet loss mean? - -Ping is a command used to test the reachability of a host on a network. It measures the round-trip-time (RTT) for packets sent from the source host to the destination host. Packet loss occurs when these packets are not successfully delivered to their destination. - -### Troubleshoot the alert - -1. Check for network congestion: - - Excessive network traffic can cause packet loss. Use tools like `iftop`, `nload`, or `bmon` to monitor your network bandwidth usage and identify possible congestion sources. - -2. Inspect the network hardware: - - Faulty network hardware like routers, switches, and cables can lead to packet loss. Examine the physical network hardware for possible issues and ensure that all devices are functioning properly. - -3. Test the connection to the destination host: - - Use the `ping` command to test the connection to the destination host: - - ``` - ping <destination_host> - ``` - - If you experience consistent packet loss, it may indicate an issue with the destination host or the network path leading to it. - -4. Check the destination host: - - If the destination host is under heavy load or experiencing issues, it may cause packet loss. Check the host's resources, such as CPU usage, memory usage, and disk space, and resolve any issues if necessary. - -5. Investigate possible packet loss causes: - - Some factors that can cause packet loss include network congestion, poor network equipment performance, corrupt data packets, or interference from other devices. Analyze your network traffic and pinpoint the cause of the packet loss. - -6. Rectify any identified issues: - - Once you've identified the cause of the packet loss, take appropriate measures to resolve it. This may involve updating network hardware, optimizing network traffic, or fixing issues with the destination host. - -### Useful resources - -1. [How to Troubleshoot Packet Loss](https://www.lifewire.com/how-to-troubleshoot-packet-loss-on-your-network-4685249) -2. [Diagnosing Network Issues with MTR](https://www.linode.com/community/questions/17967/diagnosing-network-issues-with-mtr) diff --git a/health/guides/portcheck/portcheck_connection_fails.md b/health/guides/portcheck/portcheck_connection_fails.md deleted file mode 100644 index 781cf7a0..00000000 --- a/health/guides/portcheck/portcheck_connection_fails.md +++ /dev/null @@ -1,32 +0,0 @@ -### Understand the alert - -This alert indicates that too many connections are failing to a specific TCP endpoint in the last 5 minutes. It suggests that the monitored service on that endpoint is most likely down, unreachable, or access is being denied by firewall/security rules. - -### Troubleshoot the alert - -1. Check the service - Investigate if the service at the endpoint (specific IP and port) is running as expected. Inspect service logs for issues, error messages, or indications of a shutdown event. - -2. Test the endpoint - Try to establish a connection to the flagged endpoint using tools like `telnet`, `curl`, or `nc`. These tools provide real-time feedback that can help identify problems with the endpoint: - - Example using `telnet`: - ``` - telnet IP_ADDRESS PORT_NUMBER - ``` - -3. Examine firewall and security group rules - Verify if there are any recent changes or newly added firewall/security group rules that might be causing the connectivity issues. Look for any rules that could be blocking the monitored port specifically or the IP range. - -4. Inspect network connectivity - Check the network connectivity between the Netdata Agent and the monitored endpoint. Ensure there are no intermittent network failures or high latency affecting the communication between the two. - -5. Examine the alert configuration - Validate the alert configuration in the `netdata.conf` file to confirm that the alert thresholds and monitored percentage of failed connections are set appropriately. - -6. Check resource utilization - High resource utilization might affect the availability of the monitored endpoint. Check if the system hosting the service has enough resources available (CPU, memory, and storage) to serve incoming requests. - -### Useful resources - -1. [How to use netcat (nc) command: Examples for network testing/debugging](https://www.nixcraft.com/t/how-to-use-netcat-nc-command-examples-for-network-testing-debugging/3332) diff --git a/health/guides/portcheck/portcheck_connection_timeouts.md b/health/guides/portcheck/portcheck_connection_timeouts.md deleted file mode 100644 index 5386f150..00000000 --- a/health/guides/portcheck/portcheck_connection_timeouts.md +++ /dev/null @@ -1,41 +0,0 @@ -### Understand the alert - -The `portcheck_connection_timeouts` alert calculates the average ratio of connection timeouts when trying to connect to a TCP endpoint over the last 5 minutes. If you receive this alert, it means that the monitored TCP endpoint is unreachable, potentially due to networking issues or an overloaded host/service. - -This alert triggers a warning state when the ratio of timeouts is between 10-40% and a critical state if the ratio is greater than 40%. - -### Troubleshoot the alert - -1. Check the network connectivity - - Use the `ping` command to check network connectivity between your system and the monitored TCP endpoint. - ``` - ping <tcp_endpoint_ip> - ``` - If the connectivity is intermittent or not established, it indicates network issues. Reach out to your network administrator for assistance. - -2. Check the status of the monitored TCP service - - Identify the service running on the monitored TCP endpoint by checking the port number. - - Use the `netstat` command to check the service status: - - ``` - netstat -tnlp | grep <port_number> - ``` - If the service is not running or unresponsive, restart the service or investigate further into the application logs for any issues. - -3. Verify the load on the TCP endpoint host - - Connect to the host and analyze its resource consumption (CPU, memory, disk I/O, and network bandwidth) with tools like `top`, `vmstat`, `iostat`, and `iftop`. - - Identify resource-consuming processes or applications and apply corrective measures (kill/restart the process, allocate more resources, etc.). - -4. Examine the firewall rules and security groups - - Ensure that there are no blocking rules or security groups for your incoming connections to the TCP endpoint. - - If required, update the rules or create new allow rules for the required ports and IP addresses. - -5. Check the Netdata configuration - - Review the Netdata configuration file `/etc/netdata/netdata.conf` to ensure the `portcheck` plugin settings are correctly configured for monitoring the TCP endpoint. - - If necessary, update and restart the Netdata agent. - -### Useful resources - -1. [Netstat Command in Linux](https://www.tecmint.com/20-netstat-commands-for-linux-network-management/) -2. [Iostat Command Usage and Examples](https://www.thomas-krenn.com/en/wiki/Iostat_command_usage_and_examples) -3. [Iftop Guide](https://www.tecmint.com/iftop-linux-network-bandwidth-monitoring-tool/) diff --git a/health/guides/portcheck/portcheck_service_reachable.md b/health/guides/portcheck/portcheck_service_reachable.md deleted file mode 100644 index 550db585..00000000 --- a/health/guides/portcheck/portcheck_service_reachable.md +++ /dev/null @@ -1,32 +0,0 @@ -### Understand the alert - -This alert checks if a particular TCP service on a specified host and port is reachable. If the average percentage of successful checks within the last minute is below 75%, it triggers an alert indicating the TCP service is not functioning properly. - -### Troubleshoot the alert - -- Verify if the problem is network-related or service-related - - 1. Check if the host and port are correct and the service is configured to listen on that specific port. - - 2. Use `ping` or `traceroute` to diagnose the connectivity issues between your machine and the host. - - 3. Use `telnet` or `nc` to check if the specific port on the host is reachable. For example, `telnet example.com port_number` or `nc example.com port_number`. - - 4. Check the network configuration, firewall settings, and routing rules on both the local machine and the target host. - -- Check if the TCP service is running and functioning properly - - 1. Check the service logs for any errors or issues that may prevent it from working correctly. - - 2. Restart the service and monitor its behavior. - - 3. Investigate if there are any recent changes in the service configuration or updates that may cause the issue. - - 4. Monitor system resources such as CPU, memory, and disk usage to ensure they are not causing any performance bottlenecks. - -- Optimize the service configuration - - 1. Review the service's performance-related configurations and fine-tune them, if necessary. - - 2. Check if there are any optimizations or best practices that can be applied to boost the service performance and reliability. - diff --git a/health/guides/postgres/postgres_acquired_locks_utilization.md b/health/guides/postgres/postgres_acquired_locks_utilization.md deleted file mode 100644 index d0b76eae..00000000 --- a/health/guides/postgres/postgres_acquired_locks_utilization.md +++ /dev/null @@ -1,43 +0,0 @@ -### Understand the alert - -This alert monitors the average `acquired locks utilization` over the last minute in PostgreSQL databases. If you receive this alert, it means that the acquired locks utilization for your system is near or above the warning threshold (15% or 20%). - -### What are acquired locks? - -In PostgreSQL, a lock is a mechanism used to control access to shared resources, such as database tables or rows. When multiple users or tasks are working with the database, locks help coordinate their activities and prevent conflicts. - -Acquired locks utilization refers to the percentage of locks currently in use in the system, compared to the total number of locks available. - -### Troubleshoot the alert - -1. Identify the most lock-intensive queries: - - You can use the following SQL query to get the list of most lock-intensive queries running on your PostgreSQL server: - - ``` - SELECT pid, locktype, mode, granted, client_addr, query_start, now() - query_start AS duration, query - FROM pg_locks l - JOIN pg_stat_activity a ON l.pid = a.pid - WHERE query != '<IDLE>' - ORDER BY duration DESC; - ``` - -2. Analyze the problematic queries and look for ways to optimize them, such as: - - a. Adding missing indexes for faster query execution. - b. Updating and optimizing query plans. - c. Adjusting lock types or lock levels, if possible. - -3. Check the overall health and performance of your PostgreSQL server: - - a. Monitor the CPU, memory, and disk usage. - b. Consider configuring the autovacuum settings to maintain your database's health. - -4. Monitor database server logs for any errors or issues. - -5. If the problem persists, consider adjusting the warning threshold (`warn` option), or even increasing the available locks in the PostgreSQL configuration (`max_locks_per_transaction`). - -### Useful resources - -1. [PostgreSQL Locks Monitoring](https://www.postgresql.org/docs/current/monitoring-locks.html) -2. [PostgreSQL Server Activity statistics](https://www.postgresql.org/docs/current/monitoring-stats.html) diff --git a/health/guides/postgres/postgres_db_cache_io_ratio.md b/health/guides/postgres/postgres_db_cache_io_ratio.md deleted file mode 100644 index d3932976..00000000 --- a/health/guides/postgres/postgres_db_cache_io_ratio.md +++ /dev/null @@ -1,51 +0,0 @@ -### Understand the alert - -The `postgres_db_cache_io_ratio` alert is related to PostgreSQL databases and measures the `cache hit ratio` in the last minute. If you receive this alert, it means that your database server cache is not as efficient as it should be, and your system is frequently reading data from disk instead of cache, causing possible slow performance and higher I/O workload. - -### What does cache hit ratio mean? - -Cache hit ratio is an indicator of how frequently the data required for a query is found in the cache instead of reading it directly from disk. Higher cache hit ratios mean increased query performance and less disk I/O, which can greatly impact your database performance. - -### Troubleshoot the alert - -1. Determine if the cache hit ratio issue is affecting your overall database performance using `htop`: - - ``` - htop - ``` - - Check the `Load average` gauge, if it's in the safe zone (green), the cache hit ratio issue might not be affecting overall performance. If it's in the yellow or red zone, further troubleshooting is necessary. - -2. Check per-database cache hit ratio: - - Run the following query to see cache hit ratios for each database: - ``` - SELECT dbname, (block_cache_hit_kb / (block_cache_miss_read_kb + block_cache_hit_kb)) * 100 AS cache_hit_ratio - FROM (SELECT datname as dbname, - sum(blks_read * 8.0 / 1024) as block_cache_miss_read_kb, - sum(blks_hit * 8.0 / 1024) as block_cache_hit_kb - FROM pg_stat_database - GROUP BY datname) T; - ``` - - Analyze the results to determine which databases have a low cache hit ratio. - -3. Analyze PostgreSQL cache settings: - - Check the cache settings in the `postgresql.conf` file. You may need to increase the `shared_buffers` parameter to allocate more memory for caching purposes, if there is available memory on the host. - - For example, set increased shared_buffers value: - ``` - shared_buffers = 2GB # Change the value according to your host's available memory. - ``` - - Restart the PostgreSQL service to apply the changes: - ``` - sudo systemctl restart postgresql - ``` - - Monitor the cache hit ratio to determine if the changes improved performance. It might take some time for the changes to take effect, so be patient and monitor the cache hit ratio and overall system health over time. - -### Useful resources - -1. [Tuning Your PostgreSQL Server](https://wiki.postgresql.org/wiki/Tuning_Your_PostgreSQL_Server) diff --git a/health/guides/postgres/postgres_db_deadlocks_rate.md b/health/guides/postgres/postgres_db_deadlocks_rate.md deleted file mode 100644 index 0b670b64..00000000 --- a/health/guides/postgres/postgres_db_deadlocks_rate.md +++ /dev/null @@ -1,39 +0,0 @@ -### Understand the alert - -This alert calculates the number of deadlocks in your PostgreSQL database in the last minute. If you receive this alert, it means that the number of deadlocks has surpassed the warning threshold (10 deadlocks per minute by default). - -### What are deadlocks? - -In a PostgreSQL database, a deadlock occurs when two or more transactions are waiting for one another to release a lock, causing a cyclical dependency. As a result, none of these transactions can proceed, and the database server may be unable to process other requests. - -### Troubleshoot the alert - -- Identify deadlock occurrences and problematic queries - -1. Check the PostgreSQL log for deadlock occurrence messages. You can typically find these logs in `/var/log/postgresql/` or `/pg_log/`. - - Look for messages like: `DETAIL: Process 12345 waits for ShareLock on transaction 67890; blocked by process 98765.` - -2. To find the problematic queries, examine the log entries before the deadlock messages. Most often, these entries will contain the SQL queries that led to the deadlocks. - -- Analyze and optimize the problematic queries - -1. Analyze the execution plans of the problematic queries using the `EXPLAIN` command. This can help you identify which parts of the query are causing the deadlock. - -2. Optimize the queries by rewriting them or by adding appropriate indices to speed up the processing time. - -- Avoid long-running transactions - -1. Long-running transactions increase the chances of deadlocks. Monitor your database for long-running transactions and try to minimize their occurrence. - -2. Set sensible lock timeouts to avoid transactions waiting indefinitely for a lock. - -- Review your application logic - -1. Inspect your application code for any circular dependencies that could lead to deadlocks. - -2. Use advisory locks when possible to minimize lock contention in the database. - -### Useful resources - -1. [PostgreSQL: Deadlocks](https://www.postgresql.org/docs/current/explicit-locking.html#LOCKING-DEADLOCKS) diff --git a/health/guides/postgres/postgres_db_transactions_rollback_ratio.md b/health/guides/postgres/postgres_db_transactions_rollback_ratio.md deleted file mode 100644 index b2f94fed..00000000 --- a/health/guides/postgres/postgres_db_transactions_rollback_ratio.md +++ /dev/null @@ -1,55 +0,0 @@ -### Understand the alert - -This alert calculates the `PostgreSQL database transactions rollback ratio` for the last five minutes. If you receive this alert, it means that the percentage of `aborted transactions` in the specified PostgreSQL database is higher than the defined threshold. - -### What does transactions rollback ratio mean? - -In a PostgreSQL database, the transactions rollback ratio represents the proportion of aborted transactions (those that roll back) in relation to the total number of transactions processed. A high rollback ratio may indicate issues with the application logic, database performance or excessive `deadlocks` causing transactions to be aborted frequently. - -### Troubleshoot the alert - -1. Check the PostgreSQL logs for any error messages or unusual activities related to transactions that might help identify the cause of the high rollback ratio. - - ``` - vi /var/log/postgresql/postgresql.log - ``` - - Replace `/var/log/postgresql/postgresql.log` with the appropriate path to your PostgreSQL log file. - -2. Investigate recent database changes or application code modifications that might have led to the increased rollback ratio. - -3. Examine the PostgreSQL database table and index statistics to identify potential performance bottlenecks. - - ``` - SELECT relname, seq_scan, idx_scan, n_tup_ins, n_tup_upd, n_tup_del, n_tup_hot_upd, n_live_tup, n_dead_tup, last_vacuum, last_analyze - FROM pg_stat_all_tables - WHERE schemaname = 'your_schema_name'; - ``` - - Replace `your_schema_name` with the appropriate schema name. - -4. Identify the most frequent queries that cause transaction rollbacks using pg_stat_statements view: - - ``` - SELECT substring(query, 1, 50) as short_query, calls, total_time, rows, 100.0 * shared_blks_hit/nullif(shared_blks_hit + shared_blks_read, 0) AS hit_percent - FROM pg_stat_statements - WHERE calls > 50 - ORDER BY (total_time / calls) DESC; - ``` - -5. Investigate database locks and deadlocks using pg_locks: - - ``` - SELECT database, relation::regclass, mode, transactionid AS tid, virtualtransaction AS vtid, pid, granted - FROM pg_catalog.pg_locks; - ``` - -6. Make necessary changes in the application logic or database configuration to resolve the issues causing a high rollback ratio. Consult a PostgreSQL expert, if needed. - -### Useful resources - -1. [Monitoring PostgreSQL - rollback ratio](https://www.postgresql.org/docs/current/monitoring-stats.html#MONITORING-STATS-VIEWS) -2. [PostgreSQL: Database Indexes](https://www.postgresql.org/docs/current/indexes.html) -3. [PostgreSQL: Deadlocks](https://www.postgresql.org/docs/current/explicit-locking.html#LOCK-BUILT-IN-DEADLOCK-AVOIDANCE) -4. [PostgreSQL: Log files](https://www.postgresql.org/docs/current/runtime-config-logging.html) -5. [PostgreSQL: pg_stat_statements module](https://www.postgresql.org/docs/current/pgstatstatements.html)
\ No newline at end of file diff --git a/health/guides/postgres/postgres_index_bloat_size_perc.md b/health/guides/postgres/postgres_index_bloat_size_perc.md deleted file mode 100644 index bd6e4ba0..00000000 --- a/health/guides/postgres/postgres_index_bloat_size_perc.md +++ /dev/null @@ -1,33 +0,0 @@ -### Understand the alert - -This alert monitors index bloat in a PostgreSQL database table. If you receive this alert, it indicates that the index is bloated and is taking up more disk space than necessary, which can lead to performance issues. - -### What does index bloat mean? - -In PostgreSQL, when a row is updated or deleted, the old row data remains in the index while the new data is added. Over time, this causes the index to grow in size (bloat), leading to increased disk usage and degraded query performance. This alert measures the bloat size percentage for each index in the specified database and table. - -### Troubleshoot the alert - -1. Identify the bloated index in your PostgreSQL database, as mentioned in the alert's info field (e.g. `db [database] table [table] index [index]`). - -2. Rebuild the bloated index: - - Use the `REINDEX` command to rebuild the bloated index. This will free up the space occupied by the old row data and help optimize query performance. - - ``` - REINDEX INDEX [index_name]; - ``` - - **Note:** `REINDEX` might lock the table for the time it takes to rebuild the index, so plan to run this command during maintenance periods or during low database usage periods. - -3. Monitor the index bloat size after rebuilding: - - After rebuilding the index, continue monitoring the index bloat size and performance to ensure the issue has been resolved. - - You can use tools like [pg_stat_statements](https://www.postgresql.org/docs/current/pgstatstatements.html) (a built-in PostgreSQL extension) and pg_stat_indexes (user-defined database views that collect index-related statistics) to keep an eye on your database's performance and catch any bloat issues before they negatively impact your PostgreSQL setup. - -### Useful resources - -1. [PostgreSQL documentation: REINDEX](https://www.postgresql.org/docs/current/sql-reindex.html) -2. [PostgreSQL documentation: pg_stat_statements](https://www.postgresql.org/docs/current/pgstatstatements.html) -3. [PostgreSQL documentation: Routine Vacuuming](https://www.postgresql.org/docs/current/routine-vacuuming.html) diff --git a/health/guides/postgres/postgres_table_bloat_size_perc.md b/health/guides/postgres/postgres_table_bloat_size_perc.md deleted file mode 100644 index 0edc21bb..00000000 --- a/health/guides/postgres/postgres_table_bloat_size_perc.md +++ /dev/null @@ -1,58 +0,0 @@ -### Understand the alert - -The `postgres_table_bloat_size_perc` alert measures the bloat size percentage in a PostgreSQL database table. If you receive this alert, it means that the bloat size in a particular table in your PostgreSQL database has crossed the warning or critical threshold. - -### What is bloat size? - -In PostgreSQL, bloat size refers to the wasted storage space caused by dead rows and unused space that accumulates in database tables over time. It is a result of frequent database operations (inserts, updates, and deletes), impacting database performance and storage footprint. - -### Troubleshoot the alert - -- Investigate the bloat size and impacted table - -To get a detailed report on bloated tables in your PostgreSQL database, use the [`pgstattuple`](https://www.postgresql.org/docs/current/pgstattuple.html) extension. First, install the extension if it isn't already installed: - - ``` - CREATE EXTENSION pgstattuple; - ``` - -Then, run the following query to find the bloated tables: - - ```sql - SELECT - schemaname, tablename, - pg_size_pretty(bloat_size) AS bloat_size, - round(bloat_ratio::numeric, 2) AS bloat_ratio - FROM ( - SELECT - schemaname, tablename, - bloat_size, table_size, (bloat_size / table_size) * 100 as bloat_ratio - FROM pgstattuple.schema_bloat - ) sub_query - WHERE bloat_ratio > 10 - ORDER BY bloat_ratio DESC; - ``` - -- Reclaim storage space - -Reducing the bloat size in PostgreSQL tables involves reclaiming wasted storage space. Here are two approaches: - - 1. **VACUUM**: The `VACUUM` command helps clean up dead rows and compact the space used by the table. Use the following command to clean up the impacted table: - - ``` - VACUUM VERBOSE ANALYZE <schema_name>.<table_name>; - ``` - - 2. **REINDEX**: If the issue persists after using `VACUUM`, consider REINDEXing the table. This command rebuilds the table's indexes, which can improve query performance and reduce bloat. It can be more intrusive than `VACUUM`, be sure you understand its implications before running: - - ``` - REINDEX TABLE <schema_name>.<table_name>; - ``` - -- Monitor the bloat size - -Continue monitoring the bloat size in your PostgreSQL tables by regularly checking the `postgres_table_bloat_size_perc` alert on Netdata. - -### Useful resources - -1. [How to monitor and fix Database bloats in PostgreSQL?](https://blog.netdata.cloud/postgresql-database-bloat/) diff --git a/health/guides/postgres/postgres_table_cache_io_ratio.md b/health/guides/postgres/postgres_table_cache_io_ratio.md deleted file mode 100644 index 382f8ee4..00000000 --- a/health/guides/postgres/postgres_table_cache_io_ratio.md +++ /dev/null @@ -1,32 +0,0 @@ -### Understand the alert - -This alert monitors the PostgreSQL table cache hit ratio, which is the percentage of database read requests that can be served from the cache without requiring I/O operations. If you receive this alert, it means your PostgreSQL table cache hit ratio is too low, indicating performance issues with the database. - -### What does PostgreSQL table cache hit ratio mean? - -The PostgreSQL table cache hit ratio is an important metric for analyzing the performance of a database. A high cache hit ratio means that most read requests are being served from the cache, reducing the need for disk I/O operations and improving overall database performance. On the other hand, a low cache hit ratio indicates that more I/O operations are required, which can lead to performance degradation. - -### Troubleshoot the alert - -To address the low cache hit ratio issue, follow these steps: - -1. Analyze database performance: - -Analyze the database performance to identify potential bottlenecks and areas for optimization. You can use PostgreSQL performance monitoring tools such as `pg_top`, `pg_stat_statements`, and `pg_stat_user_tables` to gather information about query execution, table access patterns, and other performance metrics. - -2. Optimize queries: - -Review and optimize complex or long-running SQL queries that may be causing performance issues. Utilize PostgreSQL features like `EXPLAIN` and `EXPLAIN ANALYZE` to analyze query execution plans and identify optimization opportunities. Indexing and query optimization can reduce I/O requirements and improve cache hit ratios. - -3. Increase shared_buffers: - -If you have a dedicated database server with sufficient memory, you can consider increasing the `shared_buffers` in your PostgreSQL configuration. This increases the amount of memory available to the PostgreSQL cache and can help improve cache hit ratios. Before making changes to the configuration, ensure that you analyze the existing memory usage patterns and leave enough free memory for other system processes and caching demands. - -4. Monitor cache hit ratios: - -Keep monitoring cache hit ratios after making changes to your configuration or optimization efforts. Depending on the results, you may need to adjust further settings, indexes, or queries to optimize database performance. - -### Useful resources - -1. [Tuning Your PostgreSQL Server](https://www.postgresql.org/docs/current/runtime-config-resource.html) -2. [Performance Monitoring and Tuning in PostgreSQL](https://learn.netdata.cloud/docs/agent/collectors/python.d.plugin/postgres#monitoring) diff --git a/health/guides/postgres/postgres_table_index_cache_io_ratio.md b/health/guides/postgres/postgres_table_index_cache_io_ratio.md deleted file mode 100644 index 5c5bb2bd..00000000 --- a/health/guides/postgres/postgres_table_index_cache_io_ratio.md +++ /dev/null @@ -1,45 +0,0 @@ -### Understand the alert - -This alert monitors the PostgreSQL table index cache hit ratio, specifically the average index cache hit ratio over the last minute, for a specific database and table. If you receive this alert, it means that your table index caching is not efficient and might result in slow database performance. - -### What does cache hit ratio mean? - -Cache hit ratio is the percentage of cache accesses to an existing item in the cache, compared to cache accesses to a non-existing item. A higher cache hit ratio means that your database entries are found in the cache more often, reducing the need to access the disk and consequently speeding up the execution times for database operations. - -### Troubleshoot the alert - -1. Check cache configuration settings - -- `shared_buffers`: This parameter sets the amount of shared memory used for the buffer pool, which is the most common caching mechanism. You can check its current value by running the following query: - - ``` - SHOW shared_buffers; - ``` - -- `effective_cache_size`: This parameter is used by the PostgreSQL query planner to estimate how much of the buffer pool data will be cached in the operating system's page cache. To check its current value, run: - - ``` - SHOW effective_cache_size; - ``` - -2. Analyze the query workload - -- Queries using inefficient indexes or not using indexes properly might contribute to a higher cache miss ratio. To find the most expensive queries, you can run: - - ``` - SELECT * FROM pg_stat_statements ORDER BY total_time DESC LIMIT 10; - ``` - -- Check if your database is using proper indexes. You can create a missing index based on your query plan or modify existing indexes to cover more cases. - -3. Increase cache size - -- If the cache settings are low and disk I/O is high, you might need to increase the cache size. Remember that increasing the cache size may also impact system memory usage, so monitor the changes and adjust the settings accordingly. - -4. Optimize storage performance - -- Verify that the underlying storage system performs well by monitoring disk latency and throughput rates. If required, consider upgrading the disk subsystem or using faster disks. - -### Useful resources - -1. [PostgreSQL Performance Tuning Guide](https://www.cybertec-postgresql.com/en/postgresql-performance-tuning/) diff --git a/health/guides/postgres/postgres_table_last_autoanalyze_time.md b/health/guides/postgres/postgres_table_last_autoanalyze_time.md deleted file mode 100644 index 1a7a3d79..00000000 --- a/health/guides/postgres/postgres_table_last_autoanalyze_time.md +++ /dev/null @@ -1,41 +0,0 @@ -### Understand the alert - -This alert is triggered when the time elapsed since a PostgreSQL table was last analyzed by the AutoVacuum daemon exceeds one week. AutoVacuum is responsible for recovering storage, optimizing the database, and updating statistics used by the PostgreSQL query planner. If you receive this alert, it indicates that one or more of your PostgreSQL tables have not been analyzed recently which may impact performance. - -### What is PostgreSQL table autoanalyze? - -In PostgreSQL, table autoanalyze is a process carried out by the AutoVacuum daemon. This process analyzes the table contents and gathers statistics for the query planner to help it make better decisions about optimizing your queries. Regular autoanalyze is crucial for maintaining good performance in your PostgreSQL database. - -### Troubleshoot the alert - -1. Check the current AutoVacuum settings: To verify if AutoVacuum is enabled and configured correctly in your PostgreSQL database, run the following SQL command: - - ```sql - SHOW autovacuum; - ``` - - If it returns `on`, AutoVacuum is enabled. Otherwise, enable AutoVacuum by modifying the `postgresql.conf` file, and set `autovacuum = on`. Then, restart the PostgreSQL service. - -2. Analyze the table manually: If AutoVacuum is enabled but the table has not been analyzed recently, you can manually analyze the table by running the following SQL command: - - ```sql - ANALYZE [VERBOSE] [schema_name.]table_name; - ``` - - Replace `[schema_name.]table_name` with the appropriate schema and table name. The optional `VERBOSE` keyword provides detailed information about the analyze process. - -3. Investigate any errors during autoanalyze: If AutoVacuum is enabled and running but you still receive this alert, check the PostgreSQL log files for any errors or issues related to the AutoVacuum process. Address any issues discovered in the logs. - -4. Monitor AutoVacuum activity: To get an overview of AutoVacuum activity, you can monitor the `pg_stat_progress_vacuum` view. Run the following SQL command to inspect the view: - - ```sql - SELECT * FROM pg_stat_progress_vacuum; - ``` - - Analyze the results to determine if there are any inefficiencies or issues with the AutoVacuum settings. - -### Useful resources - -1. [PostgreSQL: AutoVacuum](https://www.postgresql.org/docs/current/routine-vacuuming.html) -2. [PostgreSQL: Analyzing a Table](https://www.postgresql.org/docs/current/sql-analyze.html) -3. [PostgreSQL: Monitoring AutoVacuum Progress](https://www.postgresql.org/docs/current/progress-reporting.html#VACUUM-PART)
\ No newline at end of file diff --git a/health/guides/postgres/postgres_table_last_autovacuum_time.md b/health/guides/postgres/postgres_table_last_autovacuum_time.md deleted file mode 100644 index 8a79b0d3..00000000 --- a/health/guides/postgres/postgres_table_last_autovacuum_time.md +++ /dev/null @@ -1,50 +0,0 @@ -### Understand the alert - -This alert is related to the PostgreSQL database and checks the time since the last autovacuum operation occurred on a specific table. If you receive this alert, it means that the table has not been vacuumed by the autovacuum daemon for more than a week (7 days). - -### What is autovacuum in PostgreSQL? - -Autovacuum is a feature in PostgreSQL that automates the maintenance of the database by reclaiming storage, optimizing the performance of the database, and updating statistics. It operates on individual tables and performs the following tasks: - -1. Reclaims storage occupied by dead rows and updates the Free Space Map. -2. Optimizes the performance by updating statistics and executing the `ANALYZE` command. -3. Removes dead rows and updates the visibility map in order to reduce the need for vacuuming. - -### Troubleshoot the alert - -- Check the autovacuum status - -To check if the autovacuum daemon is running for the PostgreSQL instance, run the following SQL command: - - ``` - SHOW autovacuum; - ``` - -If the result is "off", then the autovacuum is disabled for the PostgreSQL instance. You can enable it by modifying the `postgresql.conf` configuration file and setting `autovacuum = on`. - -- Verify table-specific autovacuum settings - -Sometimes, autovacuum settings might be altered for individual tables. To check the autovacuum settings for the specific table mentioned in the alert, run the following SQL command: - - ``` - SELECT relname, reloptions FROM pg_class JOIN pg_namespace ON pg_namespace.oid = pg_class.relnamespace WHERE relname = '<table_name>' AND nspname = '<schema_name>'; - ``` - -Look for any custom `autovacuum_*` settings in the `reloptions` column and adjust them accordingly to allow the autovacuum daemon to run on the table. - -- Monitor the PostgreSQL logs - -Inspect the PostgreSQL logs for any error messages or unusual behavior related to autovacuum. The log file location depends on your PostgreSQL installation and configuration. - -- Manually vacuum the table - -If the autovacuum daemon has not run for a long time on the table, you can manually vacuum the table to reclaim storage and update statistics. To perform a manual vacuum, run the following SQL command: - - ``` - VACUUM (VERBOSE, ANALYZE) <schema_name>.<table_name>; - ``` - -### Useful resources - -1. [PostgreSQL: Autovacuum](https://www.postgresql.org/docs/current/runtime-config-autovacuum.html) -2. [PostgreSQL: Routine Vacuuming](https://www.postgresql.org/docs/current/routine-vacuuming.html) diff --git a/health/guides/postgres/postgres_table_toast_cache_io_ratio.md b/health/guides/postgres/postgres_table_toast_cache_io_ratio.md deleted file mode 100644 index c33a2373..00000000 --- a/health/guides/postgres/postgres_table_toast_cache_io_ratio.md +++ /dev/null @@ -1,39 +0,0 @@ -### Understand the alert - -This alert monitors the TOAST hit ratio (i.e., cached I/O efficiency) of a specific table in a PostgreSQL database. If the hit ratio is low, it indicates that the database is performing more disk I/O operations than needed for the table, which may cause performance issues. - -### What is TOAST? - -TOAST (The Oversized-Attribute Storage Technique) is a mechanism in PostgreSQL to efficiently store large data items. It allows you to store large values (such as text or binary data) in a separate table, improving the overall performance of the database. - -### What does the hit ratio mean? - -The hit ratio is the percentage of cache hits (successful reads from the cache) compared to total cache requests (hits + misses). A high hit ratio indicates that the data frequently needed is stored in the cache, resulting in fewer disk I/O operations and better performance. - -### Troubleshoot the alert - -1. Verify if the alert is accurate by checking the TOAST hit ratio in the affected PostgreSQL system. You can use the following query to retrieve the hit ratio of a specific table: - - ```sql - SELECT CASE - WHEN blks_hit + blks_read = 0 THEN 0 - ELSE 100 * blks_hit / (blks_hit + blks_read) - END as cache_hit_ratio - FROM pg_statio_user_tables - WHERE schemaname = 'your_schema' AND relname = 'your_table'; - ``` - - Replace `your_schema` and `your_table` with the appropriate values. - -2. Examine the table's indexes, and consider creating new indexes to improve query performance. Be cautious when creating indexes, as too many can negatively impact performance. - -3. Analyze the table's read and write patterns to determine if you need to adjust the cache settings, such as increasing the `shared_buffers` configuration value. - -4. Inspect the application's queries to see if any can be optimized to improve performance. For example, use EXPLAIN ANALYZE to determine if the queries are using indexes effectively. - -5. Monitor overall PostgreSQL performance with tools like pg_stat_statements or pg_stat_activity to identify potential bottlenecks and areas for improvement. - -### Useful resources - -1. [PostgreSQL TOAST Overview](https://www.postgresql.org/docs/current/storage-toast.html) -2. [Tuning Your PostgreSQL Server](https://wiki.postgresql.org/wiki/Tuning_Your_PostgreSQL_Server) diff --git a/health/guides/postgres/postgres_table_toast_index_cache_io_ratio.md b/health/guides/postgres/postgres_table_toast_index_cache_io_ratio.md deleted file mode 100644 index 6aeb3862..00000000 --- a/health/guides/postgres/postgres_table_toast_index_cache_io_ratio.md +++ /dev/null @@ -1,41 +0,0 @@ -### Understand the alert - -This alert monitors the `PostgreSQL` TOAST index cache hit ratio for a specific table in a database. A low hit ratio indicates a potential performance issue, as it means that a high number of cache misses are occurring. If you receive this alert, it suggests that your system is experiencing higher cache miss rates, which may lead to increased I/O load and reduced query performance. - -### What is TOAST? - -TOAST (The Oversized-Attribute Storage Technique) is a technique used by PostgreSQL to handle large data values. It allows PostgreSQL to store large records more efficiently by compressing and storing them separately from the main table. The TOAST index cache helps PostgreSQL efficiently access large data values, and a high cache hit ratio is desired for better performance. - -### Troubleshoot the alert - -- Check the current cache hit ratio - - Run the following query in the PostgreSQL prompt to see the current hit ratio: - - ``` - SELECT schemaname, relname, toastidx_scan, toastidx_fetch, 100 * (1 - (toastidx_fetch / toastidx_scan)) as hit_ratio - FROM pg_stat_all_tables - WHERE toastidx_scan > 0 and relname='${label:table}' and schemaname='${label:database}'; - ``` - -- Investigate the workload on the database - - Inspect the queries running on the database to determine if any specific queries are causing excessive cache misses. Use [`pg_stat_statements`](https://www.postgresql.org/docs/current/pgstatstatements.html) module to gather information on query performance. - -- Increase `work_mem` configuration value - - If the issue persists, consider increasing the `work_mem` value in the PostgreSQL configuration file (`postgresql.conf`). This parameter determines the amount of memory PostgreSQL can use for internal sort operations and hash tables, which may help reduce cache misses. - - Remember to restart the PostgreSQL server after making changes to the configuration file for the changes to take effect. - -- Optimize table structure - - Assess if the table design can be optimized to reduce the number of large data values or if additional indexes can be created to improve cache hit ratio. - -- Monitor the effect of increased cache miss ratios - - Keep an eye on overall database performance metrics, such as query execution times and I/O load, to determine the impact of increased cache miss ratios on database performance. - -### Useful resources - -1. [PostgreSQL: The TOAST Technique](https://www.postgresql.org/docs/current/storage-toast.html) diff --git a/health/guides/postgres/postgres_total_connection_utilization.md b/health/guides/postgres/postgres_total_connection_utilization.md deleted file mode 100644 index 266f4cbd..00000000 --- a/health/guides/postgres/postgres_total_connection_utilization.md +++ /dev/null @@ -1,45 +0,0 @@ -### Understand the alert - -This alert monitors the total `connection utilization` of a PostgreSQL database. If you receive this alert, it means that your `PostgreSQL` database is experiencing a high demand for connections. This can lead to performance degradation and, in extreme cases, could potentially prevent new connections from being established. - -### What does connection utilization mean? - -`Connection utilization` refers to the percentage of `database connections` currently in use compared to the maximum number of connections allowed by the PostgreSQL server. A high connection utilization implies that the server is handling a large number of concurrent connections, and its resources may be strained, leading to decreased performance. - -### Troubleshoot the alert - -1. Check the current connections to the PostgreSQL database: - - You can use the following SQL query to check the number of active connections for each database: - - ``` - SELECT datname, count(*) FROM pg_stat_activity GROUP BY datname; - ``` - - or use the following command to check the total connections to all databases: - - ``` - SELECT count(*) FROM pg_stat_activity; - ``` - -2. Identify the source of increased connections: - - To find out which user or application is responsible for the high connection count, you can use the following SQL query: - - ``` - SELECT usename, application_name, count(*) FROM pg_stat_activity GROUP BY usename, application_name; - ``` - - This query shows the number of connections per user and application, which can help you identify the source of the increased connection demand. - -3. Optimize connection pooling: - - If you are using an application server, such as `pgBouncer`, that supports connection pooling, consider adjusting the connection pool settings to better manage the available connections. This can help mitigate high connection utilization. - -4. Increase the maximum connections limit: - - If your server has the necessary resources, you may consider increasing the maximum number of connections allowed by the PostgreSQL server. To do this, modify the `max_connections` configuration parameter in the `postgresql.conf` file and then restart the PostgreSQL service. - -### Useful resources - -1. [PostgreSQL: max_connections](https://www.postgresql.org/docs/current/runtime-config-connection.html#GUC-MAX-CONNECTIONS) diff --git a/health/guides/postgres/postgres_txid_exhaustion_perc.md b/health/guides/postgres/postgres_txid_exhaustion_perc.md deleted file mode 100644 index 9c228495..00000000 --- a/health/guides/postgres/postgres_txid_exhaustion_perc.md +++ /dev/null @@ -1,33 +0,0 @@ -### Understand the alert - -This alert monitors the percentage of transaction ID (TXID) exhaustion in a PostgreSQL database, specifically the rate at which the system is approaching a `TXID wraparound`. If the alert is triggered, it means that your PostgreSQL database is more than 90% towards exhausting its available transaction IDs, and you should take action to prevent transaction ID wraparound. - -### What is TXID wraparound? - -In PostgreSQL, transaction IDs are 32-bit integers, and a new one is assigned to each new transaction. Once the system has used all possible 32-bit integers for transaction IDs, it wraps back around to the beginning, reusing previous transaction IDs. This wraparound can lead to data loss or database unavailability if transactions' tuple visibility information becomes muddled. - -### Troubleshoot the alert - -1. Check the number of remaining transactions before wraparound. Connect to your PostgreSQL database, and run the following SQL query: - - ```sql - SELECT datname, age(datfrozenxid) as age, current_limit FROM pg_database JOIN (SELECT setting AS current_limit FROM pg_settings WHERE name = 'autovacuum_vacuum_scale_factor') AS t1 ORDER BY age DESC; - ``` - -2. Vacuum the database to prevent transaction ID wraparound. Run the following command: - - ``` - vacuumdb --all --freeze - ``` - - The command `vacuumdb` reclaims storage, optimizes the database for better performance, and prevents transaction ID wraparound. - -3. Configure Autovacuum settings for long-term prevention. Adjust `autovacuum_vacuum_scale_factor`, `autovacuum_analyze_scale_factor`, `vacuum_cost_limit`, and `maintenance_work_mem` in the PostgreSQL configuration file `postgresql.conf`. Then, restart the PostgreSQL service for the changes to take effect. - - ``` - service postgresql restart - ``` - -### Useful resources - -1. [Preventing Transaction ID Wraparound Failures](https://www.postgresql.org/docs/current/routine-vacuuming.html#VACUUM-FOR-WRAPAROUND) diff --git a/health/guides/processes/active_processes.md b/health/guides/processes/active_processes.md deleted file mode 100644 index 75ddd827..00000000 --- a/health/guides/processes/active_processes.md +++ /dev/null @@ -1,16 +0,0 @@ -### Understand the alert - -This alert indicates that your system's Process ID (PID) space utilization is at high levels, meaning that there is a limited number of PIDs available for new processes. A warning state occurs when the percentage of used PIDs is between 85-90%, and a critical state occurs when it is between 90-95%. If the value reaches 100%, no new processes can be started. - -### Troubleshoot the alert - -1. **Identify high PID usage**: Use the `top` or `htop` command to identify processes with high PID usage. These processes may be causing the high PID space utilization. - -2. **Check for zombie processes**: Zombie processes are processes that have completed execution but still occupy a PID, leading to high PID space utilization. Use the `ps axo stat,ppid,pid,comm | grep -w defunct` command to identify zombie processes. If you find any, investigate their parent processes and, if necessary, restart or terminate them to release the occupied PIDs. - -3. **Monitor PID usage**: Continuously monitor your system's PID usage to understand normal behavior and identify potential issues before they become critical. You can use tools like Netdata for real-time monitoring. - -4. **Adjust PID limits**: If your system consistently experiences high PID space utilization, consider increasing the maximum number of PIDs allowed. On Linux systems, you can adjust the `kernel.pid_max` sysctl parameter. Make sure to set this value according to your system's capacity and workload requirements. - -5. **Optimize system performance**: Evaluate your system's workload and identify any specific processes or applications that are causing high PID usage. Optimize or limit these processes if necessary. Additionally, review your system's resource allocation and ensure there is sufficient capacity for process execution. - diff --git a/health/guides/qos/10min_qos_packet_drops.md b/health/guides/qos/10min_qos_packet_drops.md deleted file mode 100644 index b2e0d8c8..00000000 --- a/health/guides/qos/10min_qos_packet_drops.md +++ /dev/null @@ -1,38 +0,0 @@ -### Understand the alert - -This alert is triggered when there are `packet drops` within the last 10 minutes in your system's `Quality of Service` (`QoS`). If you receive this alert, it means your system's `network performance` may be suffering due to dropped packets. - -### What does packet drops mean? - -Packet drops refer to situations where one or more packets of data traveling across a computer network fail to reach their destination, often caused by network congestion or faulty hardware. Dropped packets can result in poor QoS, including degraded voice and video quality, or even data loss in severe cases. - -### Troubleshoot the alert - -- Check the network utilization, packet loss, and latency - - You can use the `netdata` dashboard to check the network utilization, packet loss, and latency. This will help you identify if there is any congestion or excessive usage in your network that could be causing the packet drops. - -- Examine the system logs - - Inspect your system logs to identify any potential hardware issues or network-related errors that could be causing the packet drops. You can use tools like `dmesg`, `journalctl`, or check the `/var/log` directory for log files. - -- Check for faulty hardware or misconfigurations - - Inspect your network devices, such as routers, switches, and network interfaces, for any signs of faulty hardware or misconfigurations that could be causing dropped packets. - -- Optimize your network configuration - - Review your network configuration for any settings that could be causing dropped packets, such as improper buffer sizes, incorrect QoS settings, or misconfigured packet handling mechanisms. - -- Update network device drivers or firmware - - Ensure that you are using the latest drivers and firmware for your network devices. Outdated or buggy drivers can sometimes cause packet drops. - -- Monitor the network continuously - - Regularly monitor the performance of your network to identify and address any issues that may be causing packet drops. You can use tools like `tc`, `ip`, `ifconfig`, and others for this purpose. - -### Useful resources - -1. [Netdata - Real-Time Performance Monitoring](https://www.netdata.cloud/) -2. [Linux Advanced Routing & Traffic Control](https://lartc.org/) diff --git a/health/guides/ram/oom_kill.md b/health/guides/ram/oom_kill.md deleted file mode 100644 index 69afb814..00000000 --- a/health/guides/ram/oom_kill.md +++ /dev/null @@ -1,89 +0,0 @@ -### Understand the alert - -The OOM Killer (Out of Memory Killer) is a process that the Linux kernel uses when the system is critically low on memory or a process reached its memory limits. As the name suggests, it has the duty to review all running processes and kill one or more of them in order to free up memory and keep the system running. - -Linux Kernel 4.19 introduced cgroup awareness of OOM killer implementation which adds an ability to kill a cgroup as a single unit and to guarantee the integrity of the workload. In a nutshell, cgroups allow the limitation of memory, disk I/O, and network usage for a group of processes. Furthermore, cgroups may set usage quotas, and prioritize a process group to receive more CPU time or memory than other groups. You can see more about cgroups in -the [cgroup man pages](https://man7.org/linux/man-pages/man7/cgroups.7.html) - -The Netdata Agent monitors the number of Out Of Memory (OOM) kills in the last 30 minutes. Receiving this alert indicates that some processes got killed by OOM Killer. - -### Troubleshoot the alert - -- Troubleshoot issues in the OOM killer - -The OOM Killer uses a heuristic system to choose a processes for termination. It is based on a score associated with each running application, which is calculated by `oom_badness()` call inside Linux kernel - -1. To identify which process/apps was killed from the OOM killer, inspect the logs: - -``` -dmesg -T | egrep -i 'killed process' -``` -The system response looks similar to this: -``` -Jan 7 07:12:33 mysql-server-01 kernel: Out of Memory: Killed process 3154 (mysqld). -``` - -2. To see the current `oom_score` (the priority in which OOM killer will act upon your processes) run the following script. -The script prints all running processes (by pid and name) with likelihood to be killed by the OOM killer (second column). -The greater the `oom_score` (second column) the more propably to be killed by OOM killer. - -``` -while read -r pid comm; do - printf '%d\t%d\t%s\n' "$pid" "$(cat /proc/$pid/oom_score)" "$comm"; -done < <(ps -e -o pid= -o comm=) | sort -k 2n -``` - -3. Adjust the `oom_score` to protect processes using the `choom` util from -the `util-linux` [package v2.33-rc1+](https://github.com/util-linux/util-linux/commit/8fa223daba1963c34cc828075ce6773ff01fafe3) - -``` -choom -p PID -n number -``` - -4. Once the settings work to your case, make the change permanent. In the unit file of your service, under the [Service] section, add the following value: `OOMScoreAdjust=<PREFFERRED_VALUE>` - -- Add a temporary swap file</summary> - -Keep in mind this requires creating a swap file in one of the disks. Performance of your system may be affected. - -1. Decide where your swapfile will live. It is strongly advised to allocate the swap file under in - the root directory. A swap file is like an extension of your RAM and it should be protected, far - from normal user accessible directories. Run the following command: - - ``` - dd if=/dev/zero of=<path_in_root> bs=1024 count=<size_in_bytes> - ``` - -2. Grant root only access to the swap file: - - ``` - chmod 600 <path_to_the_swap_file_you_created> - ``` - -3. Make it a Linux swap area: - - ``` - mkswap <path_to_the_swap_file_you_created> - ``` - -4. Enable the swap with the following command: - - ``` - swapon <path_to_the_swap_file_you_created> - ``` - -5. If you plan to use it a regular basis, you should update the `/etc/fstab` config. The entry you - will add would look like: - - ``` - /swap_file swap sw 0 0 - ``` - - For more information see the fstab manpage: `man fstab`. - - -### Useful resources - -1. [Linux Out of Memory Killer](https://neo4j.com/developer/kb/linux-out-of-memory-killer/) -2. [Memory Resource Controller in linux kernel](https://docs.kernel.org/admin-guide/cgroup-v1/memory.html?highlight=oom) -3. [OOM killer blogspot](https://www.psce.com/en/blog/2012/05/31/mysql-oom-killer-and-everything-related/) diff --git a/health/guides/ram/ram_available.md b/health/guides/ram/ram_available.md deleted file mode 100644 index f94bdf3b..00000000 --- a/health/guides/ram/ram_available.md +++ /dev/null @@ -1,30 +0,0 @@ -### Understand the alert - -This alarm shows the percentage of an estimated amount of RAM that is available for use in userspace processes without causing swapping. If this alarm gets raised it means that your system has low amount of available RAM memory, and it may affect the performance of running applications. - -- If there is no `swap` space available, the OOM Killer can start killing processes. - -- When a system runs out of RAM memory, it can store its inactive content in another storage's partition (e.g. your -main drive). The borrowed space is called `swap` or "swap space". - -- The OOM Killer (Out of Memory Killer) is a process that the Linux Kernel uses when the system is critically low on -RAM. As the name suggests, it has the duty to review all running processes and kill one or more of them in order -to free up RAM memory and keep the system running.<sup>[1](https://neo4j.com/developer/kb/linux-out-of-memory-killer/)</sup> - -### Troubleshoot the alert - -- Check per-process RAM usage to find the top consumers - -Linux: -``` -top -b -o +%MEM | head -n 22 -``` -FreeBSD: -``` -top -b -o res | head -n 22 -``` - -It would be helpful to close any of the main consumer processes, but Netdata strongly suggests knowing exactly what processes you are closing and being certain that they are not necessary. - -### Useful resources -[Linux Out of Memory Killer](https://neo4j.com/developer/kb/linux-out-of-memory-killer/) diff --git a/health/guides/ram/ram_in_use.md b/health/guides/ram/ram_in_use.md deleted file mode 100644 index 9c686daa..00000000 --- a/health/guides/ram/ram_in_use.md +++ /dev/null @@ -1,28 +0,0 @@ -### Understand the alert - -This alert shows the percentage of used RAM. If you receive this alert, there is high RAM utilization on the node. Running low on RAM memory, means that the performance of running applications might be affected. - -If there is no `swap` space available, the OOM Killer can start killing processes. - -When a system runs out of RAM, it can store it's inactive content in persistent storage (e.g. your main drive). The borrowed space is called `swap` or "swap space". - -The OOM Killer (Out of Memory Killer) is a process that the Linux Kernel uses when the system is critically low on RAM. As the name suggests, it has the duty to review all running processes and kill one or more of them in order -to free up RAM memory and keep the system running. - -### Troubleshoot the alert - -- Check per-process RAM usage to find the top consumers - -Linux: -``` -top -b -o +%MEM | head -n 22 -``` -FreeBSD: -``` -top -b -o res | head -n 22 -``` - -It would be helpful to close any of the main consumer processes, but Netdata strongly suggests knowing exactly what processes you are closing and being certain that they are not necessary. - -### Useful resources -[Linux Out of Memory Killer](https://neo4j.com/developer/kb/linux-out-of-memory-killer/) diff --git a/health/guides/redis/redis_bgsave_broken.md b/health/guides/redis/redis_bgsave_broken.md deleted file mode 100644 index 23ed75ff..00000000 --- a/health/guides/redis/redis_bgsave_broken.md +++ /dev/null @@ -1,23 +0,0 @@ -### Understand the alert - -This alert is triggered when the Redis server fails to save the RDB snapshot to disk. This can indicate issues with the disk, the Redis server itself, or other factors affecting the save operation. - -### Troubleshoot the alert - -1. **Check Redis logs**: Inspect the Redis logs to identify any error messages or issues related to the failed RDB save operation. You can typically find the logs in `/var/log/redis/redis-server.log`. - -2. **Verify disk space**: Ensure that your server has enough disk space available for the RDB snapshot. Insufficient disk space can cause the save operation to fail. - -3. **Check disk health**: Use disk health monitoring tools like `smartctl` to inspect the health of the disk where the RDB snapshot is being saved. - -4. **Review Redis configuration**: Check your Redis server's configuration file (`redis.conf`) for any misconfigurations or settings that may be causing the issue. Ensure that the `dir` and `dbfilename` options are correctly set. - -5. **Monitor server resources**: Monitor your server's resources, such as CPU and RAM usage, to ensure that they are not causing issues with the save operation. - -6. **Restart Redis**: If the issue persists, consider restarting the Redis server to clear any temporary issues or stuck processes. - -### Useful resources - -1. [Redis Configuration Documentation](https://redis.io/topics/config) -2. [Redis Persistence Documentation](https://redis.io/topics/persistence) -3. [Redis Troubleshooting Guide](https://redis.io/topics/problems) diff --git a/health/guides/redis/redis_bgsave_slow.md b/health/guides/redis/redis_bgsave_slow.md deleted file mode 100644 index 6a04bdf2..00000000 --- a/health/guides/redis/redis_bgsave_slow.md +++ /dev/null @@ -1,54 +0,0 @@ -### Understand the alert - -This alert, `redis_bgsave_slow`, indicates that the duration of the ongoing Redis RDB save operation is taking too long. This can be due to a large dataset size or a lack of CPU resources. As a result, Redis might stop serving clients for a few milliseconds, or even up to a second. - -### What is the Redis RDB save operation? - -Redis RDB (Redis Database) is a point-in-time snapshot of the dataset. It's a binary file that represents the dataset at the time of saving. The RDB save operation is the process of writing the dataset to disk, which occurs in the background. - -### Troubleshoot the alert - -1. Check the CPU usage - -Use the `top` command to see if the CPU usage is unusually high. - -```bash -top -``` - -If the CPU usage is high, identify the processes that are consuming the most CPU resources and determine if they are necessary. Minimize the load by closing unnecessary processes. - -2. Analyze the dataset size - -Check the size of your Redis dataset using the `INFO` command: - -```bash -redis-cli INFO | grep "used_memory_human" -``` - -If the dataset size is large, consider optimizing your data structure or implementing data management strategies, such as data expiration or partitioning. - -3. Monitor the Redis RDB save operation - -Use the following command to obtain the Redis statistics: - -```bash -redis-cli INFO | grep "rdb_last_bgsave_time_sec" -``` - -Review the duration of the RDB save operation (rdb_last_bgsave_time_sec). If the save operation takes an unusually long time or fails frequently, consider optimizing your Redis configuration or improving your hardware resources like CPU and disk I/O. - -4. Change the save operation frequency - -To limit the frequency of RDB save operations, adjust the `save` configuration directive in your Redis configuration file (redis.conf). For example, to save the dataset only after 300 seconds (5 minutes) and at least 10000 changes: - -``` -save 300 10000 -``` - -After modifying the configuration, restart the Redis service for the changes to take effect. - -### Useful resources - -1. [Redis Persistence](https://redis.io/topics/persistence) -2. [Redis configuration](https://redis.io/topics/config) diff --git a/health/guides/redis/redis_connections_rejected.md b/health/guides/redis/redis_connections_rejected.md deleted file mode 100644 index 78460246..00000000 --- a/health/guides/redis/redis_connections_rejected.md +++ /dev/null @@ -1,48 +0,0 @@ -### Understand the alert - -The `redis_connections_rejected` alert is triggered when the number of connections rejected by Redis due to the `maxclients` limit being reached in the last minute is greater than 0. This means that Redis is no longer able to accept new connections as it has reached its maximum allowed clients. - -### What does maxclients limit mean? - -The `maxclients` limit in Redis is the maximum number of clients that can be connected to the Redis instance at the same time. When the Redis server reaches its `maxclients` limit, any new connection attempts will be rejected. - -### Troubleshoot the alert - -1. Check the current number of connections in Redis: - - Use the `redis-cli` command-line tool to check the current number of clients connected to the Redis server: - - ``` - redis-cli client list | wc -l - ``` - -2. Check Redis configuration file for the maxclients setting: - - The `maxclients` value can be found in the Redis configuration file, usually called `redis.conf`. Open the file and search for `maxclients` to find the current limit. - - ``` - grep 'maxclients' /etc/redis/redis.conf - ``` - -3. Increase the maxclients limit. - - If necessary, increase the `maxclients` limit in the Redis configuration file (`redis.conf`), and then restart the Redis service to apply the changes: - - ``` - sudo systemctl restart redis - ``` - - _**Note**: Keep in mind that increasing the `maxclients` limit might cause increased memory consumption._ - -4. Inspect client connections. - - Determine if the connections are legitimate and needed for your application's requirements, or if some clients are connecting unnecessarily. Optimize your application or services as needed to reduce the number of unwanted connections. - -5. Monitor connection usage. - - Keep an eye on connection usage over time to better understand the trends and patterns in your system, and adjust the `maxclients` configuration accordingly. - -### Useful resources - -1. [Redis Clients documentation](https://redis.io/topics/clients) -2. [Redis configuration documentation](https://redis.io/topics/config) diff --git a/health/guides/redis/redis_master_link_down.md b/health/guides/redis/redis_master_link_down.md deleted file mode 100644 index 5a2d2429..00000000 --- a/health/guides/redis/redis_master_link_down.md +++ /dev/null @@ -1,50 +0,0 @@ -### Understand the alert - -The `redis_master_link_down` alert is triggered when there is a disconnection between a Redis master and its slave for more than 10 seconds. This alert indicates a potential problem with the replication process and can impact the data consistency across multiple instances. - -### Troubleshoot the alert - -1. Check the Redis logs - - Examine the Redis logs for any errors or issues regarding the disconnection between the master and slave instances. By default, Redis log files are located at `/var/log/redis/redis.log`. Look for messages related to replication, network errors or timeouts. - - ``` - grep -i "replication" /var/log/redis/redis.log - grep -i "timeout" /var/log/redis/redis.log - ``` - -2. Check the Redis replication status - - Connect to the Redis master using the `redis-cli` tool, and execute the `INFO` command to get the detailed information about the master instance: - - ``` - redis-cli - INFO REPLICATION - ``` - - Also, check the replication status on the slave instance. If you have access to the IP address and port of the slave, connect to it and run the same `INFO` command. - -3. Verify the network connection between the master and slave instances - - Test the network connectivity using `ping` and `telnet` or `nc` commands, ensuring that the connection between the master and slave instances is stable and there are no issues with firewalls or network policies. - - ``` - ping <slave_ip_address> - telnet <slave_ip_address> <redis_port> - ``` - -4. Restart the Redis instances (if needed) - - If Redis instances are experiencing issues or are unable to reconnect, consider restarting them. Be cautious as restarting instances might result in data loss or consistency issues. - - ``` - sudo systemctl restart redis - ``` - -5. Monitor the situation - - After addressing the potential issues, keep an eye on the Redis instances to ensure that the problem doesn't reoccur. - -### Useful resources - -1. [Redis Replication Documentation](https://redis.io/topics/replication) diff --git a/health/guides/retroshare/retroshare_dht_working.md b/health/guides/retroshare/retroshare_dht_working.md deleted file mode 100644 index d1e26ac1..00000000 --- a/health/guides/retroshare/retroshare_dht_working.md +++ /dev/null @@ -1,32 +0,0 @@ -### Understand the alert - -The `retroshare_dht_working` alert is related to the Retroshare service, which is a secure communication and file sharing platform. Retroshare uses a Distributed Hash Table (DHT) to manage the network of connected users. - -If you receive this alert, it means that the number of DHT peers for your Retroshare service is low. This can lead to slow communication and file sharing, impacting the performance of the service. - -### Troubleshoot the alert - -1. Check the Retroshare service status - -Make sure that the Retroshare service is running and has an active connection to the internet. You can verify this by checking the service logs or by accessing the Retroshare interface. - -2. Inspect the network configuration - -Verify that your Retroshare service can connect to the required ports for DHT (UDP) to function correctly. Also, ensure the ports are open in any firewall or security software. - -3. Increase the number of bootstrap nodes - -Retroshare requires a list of bootstrap nodes for the initial connection to the DHT network. If the current bootstrap nodes are not sufficient or unresponsive, try adding more bootstrap nodes to the list. - -4. Update your Retroshare software - -Older versions of the Retroshare service may not connect correctly and might have outdated DHT peers list. Ensure your Retroshare service is up-to-date and working with the latest version. - -5. Check the Retroshare community - -If you continue to experience issues with the DHT peer count, visit the Retroshare community forums or support channels to see if other users have encountered similar issues and whether any solutions are suggested. - -### Useful resources - -1. [Retroshare Official Website](https://retroshare.cc/) -2. [Retroshare GitHub Repository](https://github.com/RetroShare/RetroShare) diff --git a/health/guides/riakkv/riakkv_1h_kv_get_mean_latency.md b/health/guides/riakkv/riakkv_1h_kv_get_mean_latency.md deleted file mode 100644 index 7233423e..00000000 --- a/health/guides/riakkv/riakkv_1h_kv_get_mean_latency.md +++ /dev/null @@ -1,52 +0,0 @@ -### Understand the alert - -This alert calculates the average time between the reception of client `GET` requests and their subsequent responses in a `Riak KV` cluster over the last hour. If you receive this alert, it means that the average `GET` request latency in your Riak database has increased. - -### What does mean latency mean? - -Mean latency measures the average time taken between the start of a request and its completion, indicating the efficiency of the Riak system in processing `GET` requests. High mean latency implies slower processing times, which can negatively impact your application's performance. - -### Troubleshoot the alert - -- Check the system resources - -1. High latency might be related to resource bottlenecks on your Riak nodes. Check CPU, memory, and disk usage using `top` or `htop` tools. - ``` - top - ``` - or - ``` - htop - ``` - -2. If you find any resource constraint, consider scaling your Riak cluster or optimize resource usage by tuning the application configurations. - -- Investigate network issues - -1. Networking problems between the Riak nodes or the client and the nodes could cause increased latency. Check for network performance issues using `ping` or `traceroute`. - - ``` - ping node_ip_address - ``` - or - ``` - traceroute node_ip_address - ``` - -2. Investigate any anomalies or network congestion and address them accordingly. - -- Analyze Riak KV configurations - -1. Check Riak configuration settings, like read/write parameters and anti-entropy settings, for any misconfigurations. - -2. Re-evaluate and optimize settings for performance based on your application requirements. - -- Monitor application performance - -1. Analyze your application's request patterns and workload. High request rates or large amounts of data being fetched can cause increased latency. - -2. Optimize your application workload to reduce latency and distribute requests uniformly across the Riak nodes. - -### Useful resources - -1. [Riak KV documentation](https://riak.com/posts/technical/official-riak-kv-documentation-2.2/) diff --git a/health/guides/riakkv/riakkv_1h_kv_put_mean_latency.md b/health/guides/riakkv/riakkv_1h_kv_put_mean_latency.md deleted file mode 100644 index cc2cad28..00000000 --- a/health/guides/riakkv/riakkv_1h_kv_put_mean_latency.md +++ /dev/null @@ -1,37 +0,0 @@ -### Understand the alert - -The `riakkv_1h_kv_put_mean_latency` alert calculates the average time (in milliseconds) between the reception of client `PUT` requests and the subsequent responses to the clients over the last hour in a Riak KV database. If you receive this alert, it means that your Riak KV database is experiencing higher than normal latency in processing `PUT` requests. - -### What is Riak KV? - -Riak KV is a distributed NoSQL key-value data store designed to provide high availability, fault tolerance, operational simplicity, and scalability. The primary access method is through `PUT`, `GET`, `DELETE`, and `LIST` operations on keys. - -### What does `PUT` latency mean? - -`PUT` latency refers to the time it takes for the system to process a `PUT` request - from the moment the server receives the request until it sends a response back to the client. High `PUT` latency can impact the performance and responsiveness of applications relying on the Riak KV database. - -### Troubleshoot the alert - -- Check the Riak KV cluster health - - Use the `riak-admin cluster status` command to get an overview of the Riak KV cluster's health. Make sure there are no unreachable or down nodes in the cluster. - -- Verify the Riak KV node performance - - Use the `riak-admin status` command to display various statistics of the Riak KV nodes. Pay attention to the `node_put_fsm_time_mean` and `node_put_fsm_time_95` metrics, as they are related to `PUT` latency. - -- Inspect network conditions - - Use networking tools (e.g., `ping`, `traceroute`, `mtr`, `iftop`) to check for potential network latency issues between clients and the Riak KV servers. - -- Evaluate the workload - - If the client application is heavily write-intensive, consider optimizing it to reduce the number of write operations or increase the capacity of the Riak KV cluster to handle the load. - -- Review Riak KV logs - - Examine the Riak KV logs (`/var/log/riak/riak_kv.log` by default) for any error messages or unusual patterns that might be related to the increased `PUT` latency. - -### Useful resources - -1. [Riak KV Official Documentation](https://riak.com/docs/) diff --git a/health/guides/riakkv/riakkv_kv_get_slow.md b/health/guides/riakkv/riakkv_kv_get_slow.md deleted file mode 100644 index 05fd67ce..00000000 --- a/health/guides/riakkv/riakkv_kv_get_slow.md +++ /dev/null @@ -1,22 +0,0 @@ -### Understand the alert - -The `riakkv_kv_get_slow` alert is related to Riak KV, a distributed NoSQL key-value data store. This alert is triggered when the average processing time for GET requests significantly increases in the last 3 minutes compared to the average time over the last hour. If you receive this alert, it means that your Riak KV server is overloaded. - -### Troubleshoot the alert - -1. **Check Riak KV server load**: Investigate the current load on your Riak KV server. High CPU, memory, or disk usage can contribute to slow GET request processing times. Use monitoring tools like `top`, `htop`, `vmstat`, or `iotop` to identify any processes consuming excessive resources. - -2. **Analyze Riak KV logs**: Inspect the Riak KV logs for any error messages or warnings that could help identify the cause of the slow GET request processing times. The logs are typically located at `/var/log/riak` or `/var/log/riak_kv`. Look for messages related to timeouts, failures, or high latencies. - -3. **Monitor Riak KV metrics**: Check Riak KV metrics, such as read or write latencies, vnode operations, and disk usage, to identify possible bottlenecks contributing to the slow GET request processing times. Use tools like `riak-admin` or the Riak HTTP API to access these metrics. - -4. **Optimize query performance**: Analyze your application's Riak KV queries to identify any inefficient GET requests that could be contributing to slow processing times. Consider implementing caching mechanisms or adjusting Riak KV settings to improve query performance. - -5. **Evaluate hardware resources**: Ensure that your hardware resources are sufficient to handle the current load on your Riak KV server. If your server has insufficient resources, consider upgrading your hardware or adding additional nodes to your Riak KV cluster. - -### Useful resources - -1. [Riak KV documentation](https://riak.com/documentation/) -2. [Monitoring Riak KV with Netdata](https://learn.netdata.cloud/docs/agent/collectors/python.d.plugin/riakkv/) -3. [Riak Control: Monitoring and Administration Interface](https://docs.riak.com/riak/kv/2.2.3/configuring/reference/riak-vars/#riak-control) -4. [Riak KV Monitoring and Metrics](https://docs.riak.com/riak/kv/2.2.3/using/performance/monitoring/index.html) diff --git a/health/guides/riakkv/riakkv_kv_put_slow.md b/health/guides/riakkv/riakkv_kv_put_slow.md deleted file mode 100644 index 9bd314e7..00000000 --- a/health/guides/riakkv/riakkv_kv_put_slow.md +++ /dev/null @@ -1,43 +0,0 @@ -### Understand the alert - -The `riakkv_kv_put_slow` alert is triggered when the average processing time for PUT requests in Riak KV database increases significantly in comparison to the last hour's average, suggesting that the server is overloaded. - -### What does server overloaded mean? - -An overloaded server means that the server is unable to handle the incoming requests efficiently, leading to increased processing times and degraded performance. Sometimes, it might result in request timeouts or even crashes. - -### Troubleshoot the alert - -To troubleshoot this alert, follow the below steps: - -1. **Check current Riak KV performance** - - Use `riak-admin` tool's `status` command to check the current performance of the Riak KV node: - - ``` - riak-admin status - ``` - - Look for the following key performance indicators (KPIs) for PUT requests: - - riak_kv.put_fsm.time.95 (95th percentile processing time for PUT requests) - - riak_kv.put_fsm.time.99 (99th percentile processing time for PUT requests) - - riak_kv.put_fsm.time.100 (Maximum processing time for PUT requests) - - If any of these values are significantly higher than their historical values, it may indicate an issue with the node's performance. - -2. **Identify high-load operations** - - Examine the application logs or Riak KV logs for recent activity such as high volume of PUT requests, bulk updates or deletions, or other intensive database operations that could potentially cause the slowdown. - -3. **Investigate other system performance indicators** - - Check the server's CPU, memory, and disk I/O usage to identify any resource constraints that could be affecting the performance of the Riak KV node. - -4. **Review Riak KV configuration** - - Analyze the Riak KV configuration settings to ensure that they are optimized for your specific use case. Improperly configured settings can lead to performance issues. - -5. **Consider scaling the Riak KV cluster** - - If the current Riak KV cluster is not able to handle the increasing workload, consider adding new nodes to the cluster to distribute the load and improve performance. - diff --git a/health/guides/riakkv/riakkv_list_keys_active.md b/health/guides/riakkv/riakkv_list_keys_active.md deleted file mode 100644 index 38d42a37..00000000 --- a/health/guides/riakkv/riakkv_list_keys_active.md +++ /dev/null @@ -1,31 +0,0 @@ -### Understand the alert - -This alert indicates that currently there are active `list keys` operations in Finite State Machines (FSM) on your Riak KV database. Running `list keys` in Riak is a resource-intensive operation and can significantly affect the performance of the cluster, and it is not recommended for production use. - -### What are list keys operations in Riak? - -`List keys` operations in Riak involve iterating through all keys in a bucket to return a list of keys. The reason this is expensive in terms of resources is that Riak needs to traverse the entire dataset to generate a list of keys. As the dataset grows, the operation consumes more resources and takes longer to process the list, which can lead to reduced performance and scalability. - -### Troubleshoot the alert - -To address the `riakkv_list_keys_active` alert, follow these steps: - -1. Identify the processes and applications running `list keys` operations: - - Monitor your application logs and identify the processes or applications that are using these operations. You may need to enable additional logging to capture information related to `list keys`. - -2. Evaluate the necessity of `list keys` operations: - - Work with your development team and determine if there's a specific reason these operations are being used. If they are not necessary, consider replacing them with other, more efficient data retrieval techniques. - -3. Optimize data retrieval: - - If it is necessary to retrieve keys in your application, consider using an alternative strategy such as Secondary Indexes (2i) or implementing a custom solution tailored to your specific use case. - -4. Monitor the system: - - After making changes to your application, continue monitoring the active list key FSMs using Netdata to ensure that the number of active list keys operations is reduced. - -### Useful resources - -1. [Riak KV Operations](https://docs.riak.com/riak/kv/latest/developing/usage/operations/index.html) diff --git a/health/guides/riakkv/riakkv_vm_high_process_count.md b/health/guides/riakkv/riakkv_vm_high_process_count.md deleted file mode 100644 index 7fd79517..00000000 --- a/health/guides/riakkv/riakkv_vm_high_process_count.md +++ /dev/null @@ -1,31 +0,0 @@ -### Understand the alert - -The `riakkv_vm_high_process_count` alert is related to the Riak KV database. It warns you when the number of processes running in the Erlang VM is high. High process counts can result in performance degradation due to scheduling overhead. - -This alert is triggered in the warning state when the number of processes is greater than 10,000 and in the critical state when it is greater than 100,000. - -### Troubleshoot the alert - -1. Check the current number of processes in the Erlang VM. You can use the following command to see the active processes: - - ``` - riak-admin status | grep vnode_management_procs - ``` - -2. Check the Riak KV logs (/var/log/riak) to see if there are any error messages or stack traces. This can help you identify issues and potential bottlenecks in your system. - -3. Check the CPU, memory, and disk space usage on the system hosting the Riak KV database. High usage in any of these areas can also contribute to performance issues and the high process count. Use commands like `top`, `free`, and `df` to monitor these resources. - -4. Review your Riak KV configuration settings. You may need to adjust the `+P` and `+S` flags, which control the maximum number of processes and scheduler threads (respectively) that the Erlang runtime system can create. These settings can be found in the `vm.args` file. - - ``` - vim /etc/riak/vm.args - ``` - -5. If needed, optimize the Riak KV database by adjusting the configuration settings or by adding more resources to your system, such as RAM or CPU cores. - -6. Ensure that your application is not creating an excessive number of processes. You may need to examine your code and see if there are any ways to reduce the Riak KV process count. - -### Useful resources - -1. [Riak KV Documentation](http://docs.basho.com/riak/kv/2.2.3/) diff --git a/health/guides/scaleio/scaleio_sdc_mdm_connection_state.md b/health/guides/scaleio/scaleio_sdc_mdm_connection_state.md deleted file mode 100644 index 1e09b978..00000000 --- a/health/guides/scaleio/scaleio_sdc_mdm_connection_state.md +++ /dev/null @@ -1,43 +0,0 @@ -### Understand the alert - -The `scaleio_sdc_mdm_connection_state` alert indicates that your ScaleIO Data Client (SDC) is disconnected from the ScaleIO MetaData Manager (MDM). This disconnection can lead to potential performance issues or data unavailability in your storage infrastructure. - -### Troubleshoot the alert - -1. Check the connectivity between SDC and MDM nodes. - -Verify that the SDC and MDM nodes are reachable by performing a `ping` or using `traceroute` from the SDC node to the MDM node and vice versa. Network connectivity issues such as high latency or packet loss may cause the disconnection between SDC and MDM. - -2. Examine log files. - -Review the SDC and MDM log files to identify any error messages or warnings that can indicate the reason for the disconnection. Common log file locations are: - - - SDC logs: `/opt/emc/scaleio/sdc/logs/sdc.log` - - MDM logs: `/opt/emc/scaleio/mdm/logs/mdm.log` - -3. Check the status of ScaleIO services. - -Verify that the ScaleIO services are running on both the SDC and MDM nodes. You can check the service status with the following commands: - - - SDC service status: `sudo systemctl status scaleio-sdc` - - MDM service status: `sudo systemctl status scaleio-mdm` - -If any of the services are not running, start them and check the connection state again. - -4. Reconnect SDC to MDM. - -If the issue still persists after verifying the network connectivity and services' statuses, try to reconnect the SDC to MDM manually. Use the following command on the SDC node: - - ``` - sudo scli --reconnect_sdc --mdm_ip <MDM_IP_ADDRESS> - ``` - -Replace `<MDM_IP_ADDRESS>` with the IP address of your MDM node. - -5. Contact support. - -If the disconnection issue persists after trying the above steps, consider contacting technical support for assistance. - -### Useful resources - -1. [ScaleIO Troubleshooting](https://www.dell.com/support/home/en-us/product-support/product/scaleio) diff --git a/health/guides/scaleio/scaleio_storage_pool_capacity_utilization.md b/health/guides/scaleio/scaleio_storage_pool_capacity_utilization.md deleted file mode 100644 index 0f8a723b..00000000 --- a/health/guides/scaleio/scaleio_storage_pool_capacity_utilization.md +++ /dev/null @@ -1,34 +0,0 @@ -### Understand the alert - -The `scaleio_storage_pool_capacity_utilization` alert is related to storage capacity in ScaleIO, a software-defined storage solution. If you receive this alert, it means that the storage pool capacity utilization is high, potentially leading to performance issues or running out of space. - -### What does high storage pool capacity utilization mean? - -High storage pool capacity utilization means that the allocated storage space in the ScaleIO storage pool is being used at a high percentage. Warning and critical alerts are triggered at 80-90% and 90-98% utilization, respectively. When the storage pool capacity utilization is high, it may impact the performance of the system and may prevent new data from being stored, as available space is limited. - -### Troubleshoot the alert - -1. **Verify the storage pool capacity utilization** - - Check the Netdata dashboard or use Netdata API to verify the storage pool capacity utilization. Take note of the storage pools with high utilization. - -2. **Investigate storage usage** - - Inspect the storage usage in your environment, and determine which data or applications are consuming the most space. You can use tools like `du`, `df`, and `ncdu` to analyze disk usage. - -3. **Delete or move unnecessary files** - - If you found any unnecessary files or backup copies occupying large amounts of space, consider deleting them or moving them to different storage devices to free up space in the storage pool. - -4. **Optimize storage provisioning** - - Evaluate the storage provisioning for your applications, and ensure that appropriate storage space is allocated based on the actual needs. Adjust storage allocations if needed. - -5. **Consider expanding the storage pool** - - If the high storage pool capacity utilization is expected based on your application and data storage needs, consider expanding the storage pool by adding new devices or increasing the allocated storage space on the existing devices in the pool. - -6. **Monitor storage pool capacity utilization trends** - - Keep track of the storage pool capacity utilization trends and be proactive in addressing potential storage capacity issues in the future. - diff --git a/health/guides/sync/sync_freq.md b/health/guides/sync/sync_freq.md deleted file mode 100644 index bb104370..00000000 --- a/health/guides/sync/sync_freq.md +++ /dev/null @@ -1,46 +0,0 @@ -### Understand the alert - -This alert is triggered when the number of `sync()` system calls is greater than 6. The `sync()` system call writes any data buffered in memory out to disk, including modified superblocks, modified inodes, and delayed reads and writes. A higher number of `sync()` calls indicates that the system is often trying to flush buffered data to disk, which can cause performance issues. - -### Troubleshoot the alert - -1. Identify the process causing sync events - - Use `bpftrace` to identify which processes are causing the sync events. Make sure you have `bpftrace` installed on your system; if not, follow the instructions here: [Installing bpftrace](https://github.com/iovisor/bpftrace/blob/master/INSTALL.md) - - Run the `syncsnoop.bt` script from the `bpftrace` tools: - - ``` - sudo bpftrace /path/to/syncsnoop.bt - ``` - - This script will trace sync events and display the process ID (PID), process name, and the stack trace. - -2. Analyze the output - - Focus on processes with a high number of sync events, and investigate whether you can optimize these processes or reduce their impact on the system. - - - Check if these processes are essential to system functionality. - - Look for potential bugs or misconfigurations that may trigger undue `sync()` calls. - - Consider modifying the process itself to reduce disk I/O or change how it handles write operations. - -3. Monitor your system's I/O performance - - Keep an eye on overall I/O performance using tools like `iostat`, `iotop`, or `vmstat`. - - For example, you can use `iostat` to monitor disk I/O: - - ``` - iostat -xz 1 - ``` - - This command displays extended disk I/O statistics with a 1-second sampling interval. - - Check for high `await` values, which indicate the average time taken for I/O requests to be completed. Look for high `%util` values, representing the percentage of time the device was busy servicing requests. - -### Useful resources - -1. [sync man pages](https://man7.org/linux/man-pages/man2/sync.2.html) -2. [bpftrace GitHub repository](https://github.com/iovisor/bpftrace) -3. [syncsnoop example](https://github.com/iovisor/bpftrace/blob/master/tools/syncsnoop_example.txt) -4. [iostat man pages](https://man7.org/linux/man-pages/man1/iostat.1.html)
\ No newline at end of file diff --git a/health/guides/systemdunits/systemd_automount_unit_failed_state.md b/health/guides/systemdunits/systemd_automount_unit_failed_state.md deleted file mode 100644 index eb3024a9..00000000 --- a/health/guides/systemdunits/systemd_automount_unit_failed_state.md +++ /dev/null @@ -1,58 +0,0 @@ -### Understand the alert - -This alert is triggered when a `systemd` automount unit enters the `failed` state. It means that a mounted filesystem has failed or experienced an error and thus is not available for use. - -### What is an automount unit? - -An automount unit is a type of `systemd` unit that handles automounting filesystems. It defines when, where, and how a filesystem should be automatically mounted on the system. Automount units use the `.automount` file extension and are typically located in the `/etc/systemd/system` directory. - -### Troubleshoot the alert - -1. Identify the failed automount unit(s) - -To list all `systemd` automount units and their states, run the following command: - -``` -systemctl list-units --all --type=automount -``` - -Look for the unit(s) with a `failed` state. - -2. Check the automount unit file - -Examine the failed unit's configuration file in `/etc/systemd/system/` or `/lib/systemd/system/` (depending on your system). If there is an error in the configuration, fix it and reload the `systemd` configuration. - -``` -sudo systemctl daemon-reload -``` - -3. Check the journal for errors - -Use the `journalctl` command to check for any system logs related to the failed automount unit: - -``` -sudo journalctl -u [UnitName].automount -``` - -Replace `[UnitName]` with the name of the failed automount unit. Analyze the logs to identify the root cause of the failure. - -4. Attempt to restart the automount unit - -After identifying and addressing the cause of the failure, try to restart the automount unit: - -``` -sudo systemctl restart [UnitName].automount -``` - -Check the unit's status: - -``` -systemctl status [UnitName].automount -``` - -If it's in the `active` state, the issue has been resolved. - -### Useful resources - -1. [Arch Linux Wiki: systemd automount](https://wiki.archlinux.org/title/Fstab#systemd_automount) -2. [systemd automount unit file example](https://www.freedesktop.org/software/systemd/man/systemd.automount.html#Examples) diff --git a/health/guides/systemdunits/systemd_device_unit_failed_state.md b/health/guides/systemdunits/systemd_device_unit_failed_state.md deleted file mode 100644 index 8a7fc39d..00000000 --- a/health/guides/systemdunits/systemd_device_unit_failed_state.md +++ /dev/null @@ -1,65 +0,0 @@ -### Understand the alert - -This alert is triggered when a `systemd device unit` enters a `failed state`. If you receive this alert, it means that a device managed by `systemd` on your Linux system has encountered an issue and is currently in a non-operational state. - -### What is a systemd device unit? - -`Systemd` is a system and service manager for Linux operating systems. A `device unit` in `systemd` is a unit that encapsulates a device in the system's device tree (e.g., `/sys` directory). The device units are used to automatically discover and manage devices present on the system. - -### What does a failed state mean? - -A `failed state` implies that the device has encountered an issue and is currently non-operational. The problem could be related to hardware, driver, or configuration issues. - -### Troubleshoot the alert - -1. Identify the failed device unit: - - Check the `systemd` status for failed units using the following command: - - ``` - systemctl --failed --type=device - ``` - - This will show you the list of device units that are currently in a failed state. - -2. Check logs for errors: - - Use the `journalctl` command to check the logs for any error messages related to the failed device unit. For instance, if the failed unit is `example.device`, you can execute: - - ``` - journalctl -xe -u example.device - ``` - - This will show you the logs with any error messages that will help you identify the root cause of the failure. - -3. Fix the issue: - - Depending on the results from the previous steps, you might need to: - - - Check the hardware connections and make sure they are properly connected. - - Update or reinstall the device driver. - - Check and correct device configurations if needed. - -4. Restart the device unit: - - Once the issue has been fixed, restart the device unit using `systemctl`: - - ``` - sudo systemctl restart example.device - ``` - - Replace `example.device` with the specific device unit name. - -5. Validate the fix: - - Check if the device unit is now operational by executing the following command: - - ``` - systemctl status example.device - ``` - - This should show you that the device unit is now active and running properly. - -### Useful resources - -1. [Systemd Device Units](https://www.freedesktop.org/software/systemd/man/systemd.device.html) diff --git a/health/guides/systemdunits/systemd_mount_unit_failed_state.md b/health/guides/systemdunits/systemd_mount_unit_failed_state.md deleted file mode 100644 index 5840b7ce..00000000 --- a/health/guides/systemdunits/systemd_mount_unit_failed_state.md +++ /dev/null @@ -1,54 +0,0 @@ -### Understand the alert - -This alert is triggered when a `systemd` mount unit enters a `failed state`. If you receive this alert, it means that your system has encountered an issue with mounting a filesystem or a mount point. - -### What is a systemd mount unit? - -`systemd` is the init system used in most Linux distributions to manage services, processes, and system startup. A mount unit is a configuration file that describes how a filesystem or mount point should be mounted and managed by `systemd`. - -### What does a failed state mean? - -A `failed state` indicates that there was an issue with mounting the filesystem, or the mount point failed to function as expected. This can be caused by multiple factors, such as incorrect configuration, missing dependencies, or hardware issues. - -### Troubleshoot the alert - -- Identify the failed mount unit - - Check the status of your `systemd` mount units by running: - ``` - systemctl list-units --type=mount - ``` - Look for units with a `failed` state. - -- Check the journal logs - - To gain more insight into the issue, check the `systemd` journal logs for the failed mount unit: - ``` - journalctl -u [unit-name] - ``` - Replace `[unit-name]` with the actual name of the failed mount unit. - -- Verify the mount unit configuration - - Review the mount unit configuration file located at `/etc/systemd/system/[unit-name].mount`. Ensure that options such as the filesystem type, device, and mount point are correct. - -- Check system logs for hardware or filesystem issues - - Review the system logs (e.g., `/var/log/syslog` or `/var/log/messages`) for any hardware or filesystem related errors. Ensure that the device and mount point are properly connected and accessible. - -- Restart the mount unit - - If you have made any changes to the configuration or resolved a hardware issue, attempt to restart the mount unit by running: - ``` - systemctl restart [unit-name].mount - ``` - -- Seek technical support - - If the issue persists, consider reaching out to support, as there might be an underlying issue that needs to be addressed. - -### Useful resources - -1. [systemd.mount - Mount unit configuration](https://www.freedesktop.org/software/systemd/man/systemd.mount.html) -2. [systemctl - Control the systemd system and service manager](https://www.freedesktop.org/software/systemd/man/systemctl.html) -3. [journalctl - Query the systemd journal](https://www.freedesktop.org/software/systemd/man/journalctl.html)
\ No newline at end of file diff --git a/health/guides/systemdunits/systemd_path_unit_failed_state.md b/health/guides/systemdunits/systemd_path_unit_failed_state.md deleted file mode 100644 index 9a4749b6..00000000 --- a/health/guides/systemdunits/systemd_path_unit_failed_state.md +++ /dev/null @@ -1,61 +0,0 @@ -### Understand the alert - -This alert is triggered when a `systemd path unit` enters a `failed state`. Service units in a failed state indicate an issue with the service's startup, runtime, or shutdown, which can result in the service being marked as failed. - -### What is a systemd path unit? - -`systemd` is an init system and system manager that manages services and their dependencies on Linux systems. A `path unit` is a type of unit configuration file that runs a service in response to the existence or modification of files and directories. These units are used to monitor files and directories and trigger actions based on changes to them. - -### Troubleshoot the alert - -1. Identify the failed systemd path unit - -First, you need to identify which path unit is experiencing issues. To list all failed units: - - ``` - systemctl --state=failed - ``` - -Take note of the units indicated as 'path' in the output. - -2. Inspect the path unit status - -To get more details about the specific failed path unit, run: - - ``` - systemctl status <failed-path-unit> - ``` - -Replace `<failed-path-unit>` with the name of the failed path unit you identified previously. - -3. Review logs for the failed path unit - -To view the logs for the failed path unit, use the `journalctl` command: - - ``` - journalctl -u <failed-path-unit> - ``` - -Again, replace `<failed-path-unit>` with the name of the failed path unit. Review the logs to identify possible reasons for the failure. - -4. Reload the unit configuration (if necessary) - -If you discovered an issue in the unit configuration file and resolved it, reload the configuration by running: - - ``` - sudo systemctl daemon-reload - ``` - -5. Restart the failed path unit - -Once you have identified and resolved the issue causing the failed state, try to restart the path unit: - - ``` - sudo systemctl restart <failed-path-unit> - ``` - -Replace `<failed-path-unit>` with the name of the failed path unit. Then, monitor the path unit status to ensure it is running without issues. - -### Useful resources - -1. [Introduction to Systemd Units and Unit Files](https://www.digitalocean.com/community/tutorials/understanding-systemd-units-and-unit-files) diff --git a/health/guides/systemdunits/systemd_scope_unit_failed_state.md b/health/guides/systemdunits/systemd_scope_unit_failed_state.md deleted file mode 100644 index e080ae36..00000000 --- a/health/guides/systemdunits/systemd_scope_unit_failed_state.md +++ /dev/null @@ -1,57 +0,0 @@ -### Understand the alert - -This alert is triggered when a systemd scope unit enters a failed state. If you receive this alert, it means that one of your systemd scope units is not working properly and requires attention. - -### What is a systemd scope unit? - -Systemd is the system and service manager on modern Linux systems. It is responsible for managing and controlling system processes, services, and units. A scope unit is a type of systemd unit that groups several processes together in a single unit. It is used to organize and manage resources of a group of processes. - -### Troubleshoot the alert - -1. Identify the systemd scope unit in the failed state - -To list all the systemd scope units on the system, run the following command: - -``` -systemctl list-units --type=scope -``` - -Look for the units with a 'failed' state. - -2. Check the status of the systemd scope unit - -To get more information about the failed systemd scope unit, use the `systemctl status` command followed by the unit name: - -``` -systemctl status UNIT_NAME -``` - -This command will display the unit status, any error messages, and the last few lines of the unit logs. - -3. Consult the logs for further details - -To get additional information about the unit's failure, you can use the `journalctl` command for the specific unit: - -``` -journalctl -u UNIT_NAME -``` - -This command will display the logs of the systemd scope unit, allowing you to identify any issues or error messages. - -4. Restart the systemd scope unit - -If the issue appears to be temporary, try restarting the unit using the following command: - -``` -systemctl restart UNIT_NAME -``` - -This will attempt to stop the failed unit and start it again. - -5. Debug and fix the issue - -If the systemd scope unit keeps failing, refer to the documentation and logs to debug the issue and apply the necessary fixes. You might need to update the unit's configuration, fix application issues, or address system resource limitations. - -### Useful resources - -1. [Systemd - Understanding and Managing System Startup](https://access.redhat.com/documentation/en-us/red_hat_enterprise_linux/7/html/system_administrators_guide/chap-Managing_Services_with_systemd) diff --git a/health/guides/systemdunits/systemd_service_unit_failed_state.md b/health/guides/systemdunits/systemd_service_unit_failed_state.md deleted file mode 100644 index f7356799..00000000 --- a/health/guides/systemdunits/systemd_service_unit_failed_state.md +++ /dev/null @@ -1,66 +0,0 @@ -### Understand the alert - -This alert is triggered when a `systemd service unit` enters the `failed state`. If you receive this alert, it means that a critical service on your system has stopped working, and it requires immediate attention. - -### What is a systemd service unit? - -A `systemd service unit` is a simply stated, a service configuration file that describes how a specific service should be controlled and managed on a Linux system. It includes information about service dependencies, the order in which it should start, and more. Systemd is responsible for managing these services and making sure they are functioning as intended. - -### What does the failed state mean? - -When a `systemd service unit` enters the `failed state`, it indicates that the service has encountered a fault, such as an incorrect configuration file, crashing, or failing to start due to other dependencies. When this occurs, the service is rendered non-functional, and you should troubleshoot the issue to restore normal functionality. - -### Troubleshoot the alert - -1. Identify the failed service unit - - Use the following command to list all failed service units: - - ``` - systemctl --state=failed - ``` - - Take note of the failed service unit name as you will use it in the next steps. - -2. Check the service unit status - - Use the following command to investigate the status and any error messages: - - ``` - systemctl status <failed_service_unit> - ``` - - Replace `<failed_service_unit>` with the name of the failed service unit you identified earlier. - -3. Examine the logs for the failed service - - Use the following command to inspect the logs for any clues: - - ``` - journalctl -u <failed_service_unit> --since "1 hour ago" - ``` - - Adjust the `--since` parameter to view logs from a specific timeframe. - -4. Resolve the issue - - Based on the information gathered from the status and logs, try to resolve the issue causing the failure. This can involve updating configuration files, installing missing dependencies, or addressing issues with other services that the failed service unit depends on. - -5. Restart the service - - Once the issue has been addressed, restart the service to restore functionality: - - ``` - systemctl start <failed_service_unit> - ``` - - Verify that the service has started successfully: - - ``` - systemctl status <failed_service_unit> - ``` - -### Useful resources - -1. [Systemd: Managing Services (ArchWiki)](https://wiki.archlinux.org/title/Systemd#Managing_services) -2. [Troubleshooting Systemd Services (Digital Ocean)](https://www.digitalocean.com/community/tutorials/how-to-use-systemctl-to-manage-systemd-services-and-units) diff --git a/health/guides/systemdunits/systemd_slice_unit_failed_state.md b/health/guides/systemdunits/systemd_slice_unit_failed_state.md deleted file mode 100644 index d736f83f..00000000 --- a/health/guides/systemdunits/systemd_slice_unit_failed_state.md +++ /dev/null @@ -1,58 +0,0 @@ -### Understand the alert - -This alert is triggered when a `systemd slice unit` enters a `failed state`. Systemd slice units are a way to organize and manage system processes in a hierarchical manner. If you receive this alert, it means that there is an issue with a specific slice unit, which can be crucial for system stability and performance. - -### What does the failed state mean? - -A `failed state` in the context of systemd units means that the unit has encountered a problem and is not functioning properly. This could be caused by a variety of reasons, such as misconfiguration, dependency issues, or unhandled errors in the underlying service. - -### Troubleshoot the alert - -- Identify the problematic systemd slice unit. - - Run the following command to list all systemd units and their states: - - ```bash - systemctl --all - ``` - - Look for the units with the `failed` state in the output, and take note of the affected unit(s). - -- Investigate the specific issue with the failed unit. - - Use the `systemctl status` command followed by the unit name to get more information about the problem: - - ```bash - systemctl status <unit-name> - ``` - - The output will provide more details on the issue and may include error messages or log entries that can help identify the root cause. - -- Check the unit logs for additional clues. - - The `journalctl` command can be used to view the logs related to a specific unit by specifying the `-u` flag followed by the unit name: - - ```bash - journalctl -u <unit-name> - ``` - - Analyze the log entries for any reported errors or warnings that could be related to the failure. - -- Address the root cause of the issue. - - Based on the information gathered, take the necessary steps to resolve the issue with the failed unit. This may involve reconfiguring the unit, adjusting dependencies, or fixing the underlying service. - -- Restart the unit and verify its status. - - Once the issue has been resolved, restart the systemd unit using the `systemctl restart` command: - - ```bash - systemctl restart <unit-name> - ``` - - Afterwards, check the unit's status to confirm that it is no longer in a failed state and is functioning properly: - - ```bash - systemctl status <unit-name> - ``` - diff --git a/health/guides/systemdunits/systemd_socket_unit_failed_state.md b/health/guides/systemdunits/systemd_socket_unit_failed_state.md deleted file mode 100644 index 9d2d4366..00000000 --- a/health/guides/systemdunits/systemd_socket_unit_failed_state.md +++ /dev/null @@ -1,65 +0,0 @@ -### Understand the alert - -The `systemd_socket_unit_failed_state` alert is triggered when a `systemd` socket unit on your Linux server enters a failed state. This could indicate issues with the services that depend on these socket units, impacting their functionality or performance. - -### What is a systemd socket unit? - -`systemd` is the system and service manager for modern Linux systems. It initializes and manages the services on the system, ensuring a smooth boot process and operation. - -A socket unit is a special kind of `systemd` unit that encapsulates local and remote IPC (Inter-process communication) sockets. They are defined by .socket files and are used to start and manage services automatically when incoming traffic is received on socket addresses managed by the socket unit. - -### Troubleshoot the alert - -1. Identify the failed socket unit(s): - -To list all the socket units with their current state, run: - -``` -systemctl --state=failed --type=socket -``` - -This command will display the socket units in a failed state. - -2. Check the status of the failed socket unit: - -To view the detailed status of a particular failed socket unit, use: - -``` -systemctl status your_socket_unit.socket -``` - -Replace `your_socket_unit` with the name of the failed socket unit you're investigating. This will provide more information about the socket unit and possible error messages. - -3. Examine the logs: - -Check the logs for any errors or issues related to the failed socket unit: - -``` -journalctl -u your_socket_unit.socket -``` - -Replace `your_socket_unit` with the name of the failed socket unit you're investigating. This will display relevant logs for the socket unit. - -4. Restart the failed socket unit: - -Once the issue is identified and resolved, you can attempt to restart the failed socket unit: - -``` -systemctl restart your_socket_unit.socket -``` - -Replace `your_socket_unit` with the name of the failed socket unit you're investigating. This will attempt to restart the socket unit and put it into an active state. - -5. Monitor the socket unit: - -After restarting the socket unit, monitor its status to ensure it stays active and operational: - -``` -systemctl status your_socket_unit.socket -``` - -Replace `your_socket_unit` with the name of the failed socket unit you're investigating. Verify that the socket unit remains in an active state. - -### Useful resources - -1. [Sockets in Systemd Linux Operating System](https://www.freedesktop.org/software/systemd/man/systemd.socket.html) diff --git a/health/guides/systemdunits/systemd_swap_unit_failed_state.md b/health/guides/systemdunits/systemd_swap_unit_failed_state.md deleted file mode 100644 index 516156d0..00000000 --- a/health/guides/systemdunits/systemd_swap_unit_failed_state.md +++ /dev/null @@ -1,58 +0,0 @@ -### Understand the alert - -This alert monitors the state of your `systemd` swap units and is triggered when a swap unit is in the `failed` state. If you receive this alert, it means that you have an issue with one or more of your swap units managed by `systemd`. - -### What is a swap unit? - -A swap unit in Linux is a dedicated partition or a file on the filesystem (called a swap file) used for expanding system memory. When the physical memory (RAM) gets full, the Linux system swaps some of the least used memory pages to this swap space, allowing more applications to run without the need for extra physical memory. - -### What does the failed state mean? - -If a `systemd` swap unit is in the `failed` state, it means that there was an issue initializing or activating the swap space. This might be due to configuration issues, disk space limitations, or filesystem errors. - -### Troubleshoot the alert - -1. Check the status of the swap units: - - To list the swap units and their states, run the following command: - - ``` - systemctl list-units --type=swap - ``` - - Look for the failed swap units and note their names. - -2. Investigate the failed swap units: - - For each failed swap unit, check its status and any relevant messages by running: - - ``` - systemctl status <swap_unit_name> - ``` - - Replace `<swap_unit_name>` with the name of the failed swap unit. - -3. Check system logs: - - Examine the system logs for any errors or information related to the failed swap units with: - - ``` - journalctl -xeu <swap_unit_name> - ``` - -4. Identify the issue and take corrective actions: - - Based on the information from the previous steps, you may need to: - - - Adjust swap unit configurations - - Increase disk space or allocate a larger swap partition - - Resolve disk or filesystem issues - - Restart the swap units - -5. Verify that the swap units are working: - - After resolving the issue, ensure the swap units are active and running by repeating step 1. - -### Useful resources - -1. [systemd.swap — Swap unit configuration](https://www.freedesktop.org/software/systemd/man/systemd.swap.html) diff --git a/health/guides/systemdunits/systemd_target_unit_failed_state.md b/health/guides/systemdunits/systemd_target_unit_failed_state.md deleted file mode 100644 index 84340514..00000000 --- a/health/guides/systemdunits/systemd_target_unit_failed_state.md +++ /dev/null @@ -1,52 +0,0 @@ -### Understand the alert - -The `systemd_target_unit_failed_state` alert is triggered when a `systemd` target unit goes into a failed state. Systemd is the system and service manager for Linux, and target units are groups of systemd units that are organized for a specific purpose. If this alert is triggered, it means there is an issue with one of your systemd target units. - -### What does failed state mean? - -A systemd target unit in the failed state means that one or more units/tasks of that target, whether it's a service, or any other kind of systemd unit, have encountered an issue and cannot continue running. - -### Troubleshoot the alert - -1. First, you need to identify which systemd target unit is causing the alert. You can list all the failed units by running: - - ``` - systemctl --failed --all - ``` - -2. Once you have identified the problematic target unit, check its status for more information about the issue. Replace `<target_unit>` with the actual target unit name: - - ``` - systemctl status <target_unit> - ``` - -3. Look at the logs of the failed target unit to collect more details on the issue: - - ``` - journalctl -u <target_unit> - ``` - -4. Based on the information gathered in steps 2 and 3, troubleshoot and fix the problem(s) in your target unit. This may involve: - - Editing the unit file - - Checking the services and processes that compose the target - - Looking into configuration files and directories. - -5. Reload the systemctl daemon to apply any changes you made, then restart the target unit: - - ``` - sudo systemctl daemon-reload - sudo systemctl restart <target_unit> - ``` - -6. Verify that the target unit has been successfully restarted: - - ``` - systemctl is-active <target_unit> - ``` - -7. Continue monitoring the target unit to ensure that it remains stable and does not return to a failed state. - -### Useful resources - -1. [systemd man pages (targets)](https://www.freedesktop.org/software/systemd/man/systemd.target.html) -2. [systemd Targets - ArchWiki](https://wiki.archlinux.org/title/Systemd#Targets) diff --git a/health/guides/tcp/10s_ipv4_tcp_resets_received.md b/health/guides/tcp/10s_ipv4_tcp_resets_received.md deleted file mode 100644 index c17954f2..00000000 --- a/health/guides/tcp/10s_ipv4_tcp_resets_received.md +++ /dev/null @@ -1,67 +0,0 @@ -### Understand the alert - -TCP reset is an abrupt closure of the session. It causes the resources allocated to the connection to be immediately released and all other information about the connection is erased. - -The Netdata Agent monitors the average number of sent TCP RESETS over the last 10 seconds. This can indicate a port scan or that a service running on the system has crashed. Additionally, it's a result of a high number of sent TCP RESETS. Furthermore, it can also indicate a SYN reset attack. - -### More about TCP Resets - -TCP uses a three-way handshake to establish a reliable connection. The connection is full duplex, and both sides synchronize (SYN) and acknowledge (ACK) each other. The exchange of these four flags -is performed in three steps: SYN, SYN-ACK, and ACK. - -When an unexpected TCP packet arrives at a host, that host usually responds by sending a reset packet back on the same connection. A reset packet is one with no payload and with the RST bit set in the TCP header flags. There are a few circumstances in which a TCP packet might not be expected. The most common cases are: - -1. A TCP packet received on a port that is not open. -2. An aborting connection -3. Half opened connections -4. Time wait assassination -5. Listening endpoint Queue is Full -6. A TCP Buffer Overflow - -Basically, A TCP Reset usually occurs when a system receives data which doesn't agree with its view of the connection. - -### Troubleshoot the alert - -- Use tcpdump to capture the traffic and use Wireshark to inspect the network packets. You must stop the capture after a certain observation period (60s up to 5 minutes). This command will create a dump file which can be interpreted by Wireshark that contains all the TCP packets with RST flag set. - ``` - tcpdump -i any 'tcp[tcpflags] & (tcp-rst) == (tcp-rst)' -s 65535 -w output.pcap - ``` - -- Counter measure on malicious TCP resets - -SYN cookie is a technique used to resist IP address spoofing attacks. In particular, the use of SYN cookies allows a server to avoid dropping connections when the SYN queue fills up. - -Enable SYN cookies in Linux: - - 1. Check if your system has the SYN cookies service enabled. If the value is 1, then the service is enabled, if not proceed to step 2. - ``` - cat /proc/sys/net/ipv4/tcp_syncookies - ``` - - 2. Bump this `net.ipv4.tcp_syncookies=1` value under `/etc/sysctl.conf` - - 3. Apply the configuration - ``` - sysctl -p - ``` - -Enable SYN cookies in FreeBSD: - - 1. Check if your system has the SYN cookies service enabled. If the value is 1, then the service is enabled, if not proceed to step 2. - ``` - sysctl net.inet.tcp.syncookies_only - ``` - - 2. Bump this `net.inet.tcp.syncookies_only=1` value under `/etc/sysctl.conf` - - 3. Apply the configuration - ``` - /etc/rc.d/sysctl reload - ``` - -The use of SYN cookies does not break any protocol specifications, and therefore should be compatible with all TCP implementations. There are, however, a few caveats that take effect when SYN cookies are in use. - -### Useful resources - -1. [TCP reset explanation](https://www.pico.net/kb/what-is-a-tcp-reset-rst/) -2. [TCP 3-way handshake on wikipedia](https://en.wikipedia.org/wiki/Handshaking) diff --git a/health/guides/tcp/10s_ipv4_tcp_resets_sent.md b/health/guides/tcp/10s_ipv4_tcp_resets_sent.md deleted file mode 100644 index 9a941694..00000000 --- a/health/guides/tcp/10s_ipv4_tcp_resets_sent.md +++ /dev/null @@ -1,43 +0,0 @@ -### Understand the alert - -TCP reset is an abrupt closure of the session. It causes the resources allocated to the connection to be immediately released and all other information about the connection is erased. - -The Netdata Agent monitors the average number of sent TCP RESETS over the last 10 seconds. This can indicate a port scan or that a service running on the system has crashed. Additionally, it's a result of a high number of sent TCP RESETS. Furthermore, it can also indicate a SYN reset attack. - -### More about TCP Resets - -TCP uses a three-way handshake to establish a reliable connection. The connection is full duplex, and both sides synchronize (SYN) and acknowledge (ACK) each other. The exchange of these four flags -is performed in three steps: SYN, SYN-ACK, and ACK. - -When an unexpected TCP packet arrives at a host, that host usually responds by sending a reset packet back on the same connection. A reset packet is one with no payload and with the RST bit set in the TCP header flags. There are a few circumstances in which a TCP packet might not be expected. The most common cases are: - -1. A TCP packet received on a port that is not open. -2. An aborting connection -3. Half opened connections -4. Time wait assassination -5. Listening endpoint Queue is Full -6. A TCP Buffer Overflow - -Basically, A TCP Reset usually occurs when a system receives data which doesn't agree with its view of the connection. - -When your system cannot establish a connection it will retry by default `net.ipv4.tcp_syn_retries` times. - -### Troubleshoot the alert - -- Use tcpdump to capture the traffic and use Wireshark to inspect the network packets. You must stop the capture after a certain observation period (60s up to 5 minutes). This command will create a dump file which can be interpreted by Wireshark that contains all the TCP packets with RST flag set. - ``` - tcpdump -i any 'tcp[tcpflags] & (tcp-rst) == (tcp-rst)' -s 65535 -w output.pcap - ``` - -- Identify which application sends TCP resets - -1. Check the instances of `RST` events of the TCP protocol. Wireshark also displays the ports on which the two systems tried to establish the TCP connection, (XXXXXX -> XXXXXX). -2. To check which application is using this port, run the following code: - ``` - lsof -i:XXXXXX -P -n - ``` -### Useful resources - -1. [TCP reset explanation](https://www.pico.net/kb/what-is-a-tcp-reset-rst/) -2. [TCP 3-way handshake on wikipedia](https://en.wikipedia.org/wiki/Handshaking) -3. [Read more about Wireshark here](https://www.wireshark.org/)
\ No newline at end of file diff --git a/health/guides/tcp/1m_ipv4_tcp_resets_received.md b/health/guides/tcp/1m_ipv4_tcp_resets_received.md deleted file mode 100644 index 89f01f3c..00000000 --- a/health/guides/tcp/1m_ipv4_tcp_resets_received.md +++ /dev/null @@ -1,41 +0,0 @@ -### Understand the alert - -This alert, `1m_ipv4_tcp_resets_received`, calculates the average number of TCP RESETS received (`AttemptFails`) over the last minute on your system. If you receive this alert, it means that there is an increase in the number of TCP RESETS, which might indicate a problem with your networked applications or servers. - -### What does TCP RESET mean? - -`TCP RESET` is a signal that is sent from one connection end to the other when an ongoing connection is immediately terminated without an orderly close. This usually happens when a networked application encounters an issue, such as an incorrect connection request, invalid data packet, or a closed port. - -### Troubleshoot the alert - -1. Identify the top consumers of TCP RESETS: - - You can use the `ss` utility to list the TCP sockets and their states: - - ``` - sudo ss -tan - ``` - - Look for the `State` column to see which sockets have a `CLOSE-WAIT`, `FIN-WAIT`, `TIME-WAIT`, or `LAST-ACK` status. These states usually have a high number of TCP RESETS. - -2. Check the logs of the concerned applications: - - If you have identified the problematic applications or servers, inspect their logs for any error messages, warnings, or unusual activity related to network connection issues. - -3. Inspect the system logs: - - Check the system logs, such as `/var/log/syslog` on Linux or `/var/log/system.log` on FreeBSD, for any network-related issues. This could help you find possible reasons for the increased number of TCP RESETS. - -4. Monitor and diagnose network issues: - - Use tools like `tcpdump`, `wireshark`, or `iftop` to capture packets and observe network traffic. This can help you identify patterns that may be causing the increased number of TCP RESETS. - -5. Check for resource constraints: - - Ensure that your system's resources, such as CPU, memory, and disk space, are not under heavy load or reaching their limits. High resource usage could cause networked applications to behave unexpectedly, resulting in an increased number of TCP RESETS. - -### Useful resources - -1. [ss Utility - Investigate Network Connections & Sockets](https://www.binarytides.com/linux-ss-command/) -2. [Wireshark - A Network Protocol Analyzer](https://www.wireshark.org/) -3. [Monitoring Network Traffic with iftop](https://www.tecmint.com/iftop-linux-network-bandwidth-monitoring-tool/) diff --git a/health/guides/tcp/1m_ipv4_tcp_resets_sent.md b/health/guides/tcp/1m_ipv4_tcp_resets_sent.md deleted file mode 100644 index fa052e6b..00000000 --- a/health/guides/tcp/1m_ipv4_tcp_resets_sent.md +++ /dev/null @@ -1,37 +0,0 @@ -### Understand the alert - -This alert calculates the average number of TCP resets (`OutRsts`) sent by the host over the last minute. If you receive this alert, it means that your system is experiencing an unusually high rate of TCP resets, which might signal connection issues or potential attacks. - -### What is a TCP reset? - -A TCP reset (or RST packet) is a signal used in the Transmission Control Protocol (TCP) to abruptly close an active connection between two devices. It can be sent by either the client or server to inform the other party that they should consider the connection terminated. - -### Why are high numbers of TCP resets a concern? - -When there's a high rate of TCP resets sent by a host, it generally indicates problems in communication with other devices or services. This could be due to network latency, misconfigured firewalls, or aggressive timeouts causing connections to break. In some cases, it could also signal a potential Denial of Service (DoS) attack, where an attacker sends multiple resets to disrupt a service or network. - -### Troubleshoot the alert - -- Check the network performance - - Investigate if there are any network latency issues or congestion in your system. You can use tools like `ping`, `traceroute`, or `mtr` to check the network quality and connectivity to other hosts. - -- Analyze packet captures for communication issues - - Use a packet capture tool like `tcpdump` or `Wireshark` to capture and analyze network traffic during the period of high resets. Look for patterns or specific connections that are frequently terminated with a reset. This could help pinpoint misconfigured services, firewalls, or devices causing the issue. - -- Check firewall settings - - Ensure that your firewall settings are properly configured to allow necessary connections and not aggressively closing them. Look for rules related to connection timeouts, max connections, and SYN flood protection to see if they might be causing the resets. - -- Review system logs for errors - - Check system and application logs for any error messages or events that correlate to the time of the alert. This might give you more information about the cause of the issue. - -- Monitor for potential attacks - - If the above steps don't help determine the cause, consider monitoring your network and system for potential DoS attacks. Implement security measures such as rate-limiting and access control to protect your services and network from malicious traffic. - -### Useful resources - -1. [TCP Connection Resets and How to Troubleshoot Them](https://blog.wireshark.org/tcp/connection/resets/troubleshoot/) diff --git a/health/guides/tcp/1m_tcp_accept_queue_drops.md b/health/guides/tcp/1m_tcp_accept_queue_drops.md deleted file mode 100644 index 5926d24c..00000000 --- a/health/guides/tcp/1m_tcp_accept_queue_drops.md +++ /dev/null @@ -1,30 +0,0 @@ -### Understand the alert - -This alert presents the average number of dropped packets in the TCP accept queue over the last sixty seconds. If it is raised, then the system is dropping incoming TCP connections. This could also be an indication of accepted queue overflow, low memory, security issues, no route to a destination, etc. -- This alert gets raised to warning when the value is greater than 1 and less than 5. -- If the number of queue drops over the last minute exceeds 5, then the alert gets raised to critical. - -### TCP Accept Queue Drops - -The accept queue holds fully established TCP connections waiting to be handled by the listening application. It overflows when the server application fails to accept new connections at the rate they are coming in. - -### Troubleshooting Section - -- Check for queue overflows. - -If you receive this alert, then you can cross-check its results with the `1m_tcp_accept_queue_overflows` alert. If that alert is also in a warning or critical state, then the system is experiencing accept queue overflowing. To fix that you can do the following: - -1. Open the /etc/sysctl.conf file and look for the entry " net.ipv4.tcp_max_syn_backlog". - The `tcp_max_syn_backlog` is the maximal number of remembered connection requests (SYN_RECV), which have not received an acknowledgment from connecting client. -2. If the entry does not exist, then append the following default entry to the file; `net.ipv4.tcp_max_syn_backlog=1280`. Otherwise, adjust the limit to suit your needs. -3. Save your changes and run: - ``` - sysctl -p - ``` - -Note: Netdata strongly suggests knowing exactly what values you need before making system changes. - -### Useful resources - -1. [ip-sysctl.txt](https://www.kernel.org/doc/Documentation/networking/ip-sysctl.txt) -2. [Transmission Control Protocol](https://en.wikipedia.org/wiki/Transmission_Control_Protocol) diff --git a/health/guides/tcp/1m_tcp_accept_queue_overflows.md b/health/guides/tcp/1m_tcp_accept_queue_overflows.md deleted file mode 100644 index 7c5ddf0f..00000000 --- a/health/guides/tcp/1m_tcp_accept_queue_overflows.md +++ /dev/null @@ -1,35 +0,0 @@ -### Understand the alert - -This alert presents the average number of overflows in the TCP accept queue over the last minute. - -- This alert gets raised in a warning state when the value is greater than 1 and less than 5. -- If the overflow average exceeds 5 in the last minute, then the alert gets raised in the critical state. - -### What is the Accept queue? - -The accept queue holds fully established TCP connections waiting to be handled by the listening application. It overflows when the server application fails to accept new connections at the rate they are coming in. - -### This alert might also indicate a SYN flood. - -A SYN flood is a form of denial-of-service attack in which an attacker rapidly initiates a connection to a server without finalizing the connection. The server has to spend resources waiting for half-opened connections, which can consume enough resources to make the system unresponsive to legitimate traffic. - -### Troubleshooting Section - -Increase the queue length - -1. Open the /etc/sysctl.conf file and look for the entry " net.ipv4.tcp_max_syn_backlog". - The `tcp_max_syn_backlog` is the maximal number of remembered connection requests (SYN_RECV), which have not received an acknowledgment from connecting client. -2. If the entry does not exist, you can append the following default entry to the file; `net.ipv4. tcp_max_syn_backlog=1280`. Otherwise, adjust the limit to suit your needs. -3. Save your changes and run; - ``` - sysctl -p - ``` - -Note: Netdata strongly suggests knowing exactly what values you need before making system changes. - -### Useful resources - -1. [SYN Floods](https://en.wikipedia.org/wiki/SYN_flood) -2. [ip-sysctl.txt](https://www.kernel.org/doc/Documentation/networking/ip-sysctl.txt) -3. [Transmission Control Protocol](https://en.wikipedia.org/wiki/Transmission_Control_Protocol) - diff --git a/health/guides/tcp/1m_tcp_syn_queue_cookies.md b/health/guides/tcp/1m_tcp_syn_queue_cookies.md deleted file mode 100644 index 8dafb9f4..00000000 --- a/health/guides/tcp/1m_tcp_syn_queue_cookies.md +++ /dev/null @@ -1,39 +0,0 @@ -### Understand the alert - -This alert presents the average number of sent SYN cookies due to the full TCP SYN queue over the sixty seconds. Receiving this means that the incoming traffic is excessive. SYN queue cookies are used to resist any potential SYN flood attacks. - -This alert is raised to warning when the average exceeds 1 and will enter critical when the value exceeds an average of 5 sent SYN cookies in sixty seconds. - -###What are SYN Queue Cookies? - -The SYN Queue stores inbound SYN packets (specifically: struct inet_request_sock). It is responsible for sending out SYN+ACK packets and retrying them on timeout. After transmitting the SYN+ACK, the SYN Queue waits for an ACK packet from the client - the last packet in the three-way-handshake. All received ACK packets must first be matched against the fully established connection table, and only then against data in the relevant SYN Queue. On SYN Queue match, the kernel removes the item from the SYN Queue, successfully creates a full connection (specifically: struct inet_sock), and adds it to the Accept Queue. - -### SYN flood - -This alert likely indicates a SYN flood. - -A SYN flood is a form of denial-of-service attack in which an attacker rapidly initiates a connection to a server without finalizing the connection. The server has to spend resources waiting for half-opened connections, which can consume enough resources to make the system unresponsive to legitimate traffic. - -### Troubleshoot the alert - -If the traffic is legitimate, then increase the limit of the SYN queue. - -If you can determine that the traffic is legitimate, consider expanding the limit of the SYN queue through configuration; - -*(If the traffic is not legitimate, then this is not safe! You will expose more resources to an attacker if the traffic is not legitimate.)* - -1. Open the /etc/sysctl.conf file and look for the entry "net.core.somaxconn". This value will affect both SYN and accept queue limits on newer Linux systems. -2. Set the value accordingly (By default it is set to 128) `net.core.somaxconn=128` (if the value doesn't exist, append it to the file) -3. Save your changes and run this command to apply the changes. - ``` - sysctl -p - ``` -Note: Netdata strongly suggests knowing exactly what values you need before making system changes. - -### Useful resources - -1. [SYN packet handling](https://blog.cloudflare.com/syn-packet-handling-in-the-wild/) -2. [SYN Floods](https://en.wikipedia.org/wiki/SYN_flood) -3. [SYN Cookies](https://en.wikipedia.org/wiki/SYN_cookies) -4. [ip-sysctl.txt](https://www.kernel.org/doc/Documentation/networking/ip-sysctl.txt) -5. [Transmission Control Protocol](https://en.wikipedia.org/wiki/Transmission_Control_Protocol) diff --git a/health/guides/tcp/1m_tcp_syn_queue_drops.md b/health/guides/tcp/1m_tcp_syn_queue_drops.md deleted file mode 100644 index c29d86d7..00000000 --- a/health/guides/tcp/1m_tcp_syn_queue_drops.md +++ /dev/null @@ -1,22 +0,0 @@ -### Understand the alert - -This alert indicates that the average number of SYN requests dropped due to the TCP SYN queue being full has exceeded a specific threshold in the last minute. A high number of dropped SYN requests may indicate a SYN flood attack, causing the system to become unresponsive to legitimate traffic. - -### Troubleshoot the alert - -1. **Monitor incoming traffic**: Analyze the incoming network traffic to determine if there is a sudden surge in SYN requests, which might indicate a SYN flood attack. Use tools like `tcpdump`, `iftop`, or `nload` to monitor network traffic. - -2. **Check system resources**: Inspect the system's CPU and memory usage to ensure there are enough resources available to handle incoming connections. High resource usage might lead to dropped SYN requests. - -3. **Enable SYN cookies**: If the traffic is legitimate, consider enabling SYN cookies to help mitigate the impact of a SYN flood attack, as described in the provided guide above. - -4. **Adjust SYN queue settings**: Increase the SYN queue size by adjusting the `net.core.somaxconn` and `net.ipv4.tcp_max_syn_backlog` sysctl parameters. Make sure to set these values according to your system's capacity and traffic requirements. - -5. **Implement traffic filtering**: Use traffic filtering techniques such as rate limiting, IP blocking, or firewall rules to mitigate the impact of SYN flood attacks. - -### Useful resources - -1. [SYN packet handling](https://blog.cloudflare.com/syn-packet-handling-in-the-wild/) -2. [SYN Floods](https://en.wikipedia.org/wiki/SYN_flood) -3. [SYN Cookies](https://en.wikipedia.org/wiki/SYN_cookies) -4. [ip-sysctl.txt](https://www.kernel.org/doc/Documentation/networking/ip-sysctl.txt) diff --git a/health/guides/tcp/tcp_connections.md b/health/guides/tcp/tcp_connections.md deleted file mode 100644 index 849a05ac..00000000 --- a/health/guides/tcp/tcp_connections.md +++ /dev/null @@ -1,51 +0,0 @@ -### Understand the alert - -This alert is related to the percentage of used IPv4 TCP connections. If you receive this alert, it means that your system has high TCP connections utilization, and you might be approaching the limit of maximum connections. - -### What does high IPv4 TCP connections utilization mean? - -When the number of IPv4 TCP connections gets too high, the system's ability to establish new connections decreases. This is because there are limitations due to resources such as memory or system settings. High utilization could lead to connection-related issues or service interruptions. - -### Troubleshoot the alert - -1. Check current TCP connections: - - To see the current number of TCP connections, you can use the `ss` or `netstat` command: - - ``` - ss -t | grep ESTAB | wc -l - ``` - - or - - ``` - netstat -ant | grep ESTABLISHED | wc -l - ``` - -2. Identify connections with high usage: - - To list the connections with their state (e.g., ESTABLISHED, LISTEN), use the following command: - - ``` - ss -tan - ``` - - Look for connections with a high number of ESTABLISHED connections, as these may be contributing to the high utilization. - -3. Inspect running processes to identify potential culprits: - - You can use the `lsof` command to list all open files and the processes that are using them: - - ``` - sudo lsof -iTCP - ``` - - Look for processes with a high number of open files, as these are likely responsible for the increased TCP connections utilization. - -4. Take action: - - Once you have identified the processes contributing to high TCP connections utilization, you can take appropriate action. This may involve optimizing the application, adjusting system settings, or optimizing hardware resources. - -### Useful resources - -1. [Linux lsof command tutorial](https://www.howtoforge.com/linux-lsof-command/) diff --git a/health/guides/tcp/tcp_memory.md b/health/guides/tcp/tcp_memory.md deleted file mode 100644 index 99223c22..00000000 --- a/health/guides/tcp/tcp_memory.md +++ /dev/null @@ -1,50 +0,0 @@ -### Understand the alert - -This alert is triggered when the TCP memory usage on your system is higher than the allowed limit. High TCP memory utilization can cause applications to become unresponsive and result in poor system performance. - -### Troubleshoot the alert - -To resolve the TCP memory alert, you can follow these steps: - -1. Verify the current TCP memory usage: - - Check the current values of TCP memory buffers by running the following command: - - ``` - cat /proc/sys/net/ipv4/tcp_mem - ``` - - The output consists of three values: low, pressure (memory pressure), and high (memory limit). - -2. Monitor system performance: - - Use the `vmstat` command to monitor the system's performance and understand the memory consumption in detail: - - ``` - vmstat 5 - ``` - - This will display the system's statistics every 5 seconds. Pay attention to the `si` and `so` columns, which represent swap-ins and swap-outs. High values in these columns may indicate memory pressure on the system. - -3. Identify high memory-consuming processes: - - Use the `top` command to identify processes that consume the most memory: - - ``` - top -o %MEM - ``` - - Look for processes with high memory usage and determine if they are necessary for your system. If they are not, consider stopping or killing these processes to free up memory. - -4. Increase the TCP memory: - - Follow the steps mentioned in the provided guide to increase the TCP memory. This includes: - - - Increase the `tcp_mem` bounds using the `sysctl` command. - - Verify the change and test it with the same workload that triggered the alarm originally. - - If the change works, make it permanent by adding the new values to `/etc/sysctl.conf`. - - Reload the sysctl settings with `sysctl -p`. - -### Useful resources - -1. [man pages of tcp](https://man7.org/linux/man-pages/man7/tcp.7.html) diff --git a/health/guides/tcp/tcp_orphans.md b/health/guides/tcp/tcp_orphans.md deleted file mode 100644 index d7dd35a8..00000000 --- a/health/guides/tcp/tcp_orphans.md +++ /dev/null @@ -1,48 +0,0 @@ -### Understand the alert - -This alert indicates that your system is experiencing high IPv4 TCP socket utilization, specifically orphaned sockets. Orphaned connections are those not attached to any user file handle. When these connections exceed the limit, they are reset immediately. The warning state is triggered when the percentage of used orphan IPv4 TCP sockets exceeds 25%, and the critical state is triggered when the value exceeds 50%. - -### Troubleshoot the alert - -- Check the current orphan socket usage - -To check the number of orphan sockets in your system, run the following command: - - ``` - cat /proc/sys/net/ipv4/tcp_max_orphans - ``` - -- Identify the processes causing high orphan socket usage - -To identify the processes causing high orphan socket usage, you can use the `ss` command: - - ``` - sudo ss -tan state time-wait state close-wait - ``` - - Look for connections with a large number of orphan sockets and investigate the related processes. - -- Increase the orphan socket limit - -If you need to increase the orphan socket limit to accommodate legitimate connections, you can update the value in the `/proc/sys/net/ipv4/tcp_max_orphans` file. Replace `{DESIRED_AMOUNT}` with the new limit: - - ``` - echo {DESIRED_AMOUNT} > /proc/sys/net/ipv4/tcp_max_orphans - ``` - - Consider the kernel's penalty factor for orphan sockets (usually 2x or 4x) when determining the appropriate limit. - - **Note**: Be cautious when making system changes and ensure you understand the implications of updating these settings. - -- Review and optimize application behavior - -Investigate the applications generating a high number of orphan sockets and consider optimizing their behavior. This may involve updating application settings or code to better manage network connections. - -- Monitor your system - -Keep an eye on your system's orphan socket usage, particularly during peak hours. Adjust the limit as needed to accommodate legitimate connections. - -### Useful resources - -1. [Network Sockets](https://en.wikipedia.org/wiki/Network_socket) -2. [Linux-admins.com - Troubleshooting Out of Socket Memory](http://www.linux-admins.net/2013/01/troubleshooting-out-of-socket-memory.html)
\ No newline at end of file diff --git a/health/guides/timex/system_clock_sync_state.md b/health/guides/timex/system_clock_sync_state.md deleted file mode 100644 index c242e0a5..00000000 --- a/health/guides/timex/system_clock_sync_state.md +++ /dev/null @@ -1,11 +0,0 @@ -### Understand the alert - -The Netdata Agent checks if your system is in sync with a Network Time Protocol (NTP) server. This alert indicates that the system time is not synchronized to a reliable server. It is strongly recommended having the clock in sync with NTP servers, because, otherwise, it leads to unpredictable problems that are difficult to debug especially in matters of security. - -### Troubleshoot the alert - -Different linux distros utilize different NTP tools. You can always install `ntp`. If your clock is out of sync, you should first check for issues in your network connectivity. - -### Useful resources - -[Best practices for NTP servers](https://bluecatnetworks.com/blog/seven-best-practices-to-keep-your-ntp-resilient/).
\ No newline at end of file diff --git a/health/guides/udp/1m_ipv4_udp_receive_buffer_errors.md b/health/guides/udp/1m_ipv4_udp_receive_buffer_errors.md deleted file mode 100644 index a100ebbb..00000000 --- a/health/guides/udp/1m_ipv4_udp_receive_buffer_errors.md +++ /dev/null @@ -1,65 +0,0 @@ -### Understand the alert - -In both Linux and FreeBSD variants, the kernel allocates buffers to serve the UDP protocol operations. Packets after reception from a network interface are forwarded to these buffers to be processed by the UDP protocol stack in a system's socket. - -The Netdata Agent monitors the average number of UDP receive buffer errors over the last minute. Receiving this alert means that your system is dropping incoming UDP packets. This may indicate that the UDP receive buffer queue is full. This alert is triggered in warning state when the number of UDP receive buffer errors over the last minute is more than 10. - -In general, issues with buffers that allocated dynamically are correlated with the kernel memory, you must always be aware of memory pressure events. This can cause buffer errors. - -### Troubleshoot the alert (Linux) - -- Increase the net.core.rmem_default and net.core.rmem_max values - -1. Try to increase them, RedHat suggests the value of 262144 bytes - ``` - sysctl -w net.core.rmem_default=262144 - sysctl -w net.core.rmem_max=262144 - ``` - -2. Verify the change and test with the same workload that triggered the alarm originally. - ``` - sysctl net.core.rmem_default net.core.rmem_max - net.core.rmem_default=262144 - net.core.rmem_max=262144 - ``` - -3. If this change works for your system, you could make it permanently. - - Bump these `net.core.rmem_default=262144` & `net.core.rmem_max=262144` entries under `/etc/sysctl.conf`. - -4. Reload the sysctl settings. - - ``` - sysctl -p - ``` - -### Troubleshoot the alert (FreeBSD) - -- Increase the kern.ipc.maxsockbuf value - -1. Try to set this value to at least 16MB for 10GE overall - ``` - sysctl -w kern.ipc.maxsockbuf=16777216 - ``` - -2. Verify the change and test with the same workload that triggered the alarm originally. - ``` - sysctl kern.ipc.maxsockbuf - kern.ipc.maxsockbuf=16777216 - ``` - -3. If this change works for your system, you could make it permanently. - - Bump this `kern.ipc.maxsockbuf=16777216` entry under `/etc/sysctl.conf`. - -4. Reload the sysctl settings. - ``` - /etc/rc.d/sysctl reload - ``` - -### Useful resources - -1. [UDP definition on wikipedia](https://en.wikipedia.org/wiki/User_Datagram_Protocol) -2. [Man page of UDP protocol](https://man7.org/linux/man-pages/man7/udp.7.html) -3. [Redhat networking tuning guide](https://access.redhat.com/documentation/en-us/red_hat_enterprise_linux/5/html/tuning_and_optimizing_red_hat_enterprise_linux_for_oracle_9i_and_10g_databases/sect-oracle_9i_and_10g_tuning_guide-adjusting_network_settings-changing_network_kernel_settings) -4. [UDP on freebsd (blog)](https://awasihba.wordpress.com/2008/10/13/udp-on-freebsd/) diff --git a/health/guides/udp/1m_ipv4_udp_send_buffer_errors.md b/health/guides/udp/1m_ipv4_udp_send_buffer_errors.md deleted file mode 100644 index 7d0411e3..00000000 --- a/health/guides/udp/1m_ipv4_udp_send_buffer_errors.md +++ /dev/null @@ -1,43 +0,0 @@ -### Understand the alert - -The linux kernel allocates buffers to serve the UDP protocol operations. Data is written into sockets that utilize UDP to send data to an another system/subsystem. - -The Netdata Agent monitors the average number of UDP send buffer errors over the last minute. This alert indicates that the UDP send buffer is full or no kernel memory available. Receiving this alert -means that your system is dropping outgoing UDP packets. This alert is triggered in warning state when the number of UDP send buffer errors over the last minute is more than 10. - -In general, issues with buffers that allocated dynamically are correlated with the kernel memory, you must always be aware of memory pressure events. This can cause buffer errors. - -### Troubleshooting section: - -- Increase the net.core.wmem_default and net.core.wmem_max values - -1. Try to increase them, RedHat suggests the value of 262144 bytes - - ``` - sysctl -w net.core.wmem_default=262144 - sysctl -w net.core.wmem_max=262144 - ``` - -2. Verify the change and test with the same workload that triggered the alarm originally. - - ``` - sysctl net.core.wmem_default net.core.wmem_max - net.core.wmem_default=262144 - net.core.wmem_max=262144 - ``` - -3. If this change works for your system, you could make it permanently. - - Bump these `net.core.wmem_default=262144` & `net.core.wmem_max=262144` entries under `/etc/sysctl.conf`. - -4. Reload the sysctl settings. - - ``` - sysctl -p - ``` - -### Useful resources - -1. [UDP definition on wikipedia](https://en.wikipedia.org/wiki/User_Datagram_Protocol) -2. [Man page of UDP protocol](https://man7.org/linux/man-pages/man7/udp.7.html) -3. [Redhat networking tuning guide](https://access.redhat.com/documentation/en-us/red_hat_enterprise_linux/5/html/tuning_and_optimizing_red_hat_enterprise_linux_for_oracle_9i_and_10g_databases/sect-oracle_9i_and_10g_tuning_guide-adjusting_network_settings-changing_network_kernel_settings) diff --git a/health/guides/unbound/unbound_request_list_dropped.md b/health/guides/unbound/unbound_request_list_dropped.md deleted file mode 100644 index deed815e..00000000 --- a/health/guides/unbound/unbound_request_list_dropped.md +++ /dev/null @@ -1,38 +0,0 @@ -### Understand the alert - -The `unbound_request_list_dropped` alert indicates that the Unbound DNS resolver is dropping new incoming requests because its request queue is full. This situation may be caused by a high volume of DNS queries, possibly from a Denial of Service (DoS) attack or poor server optimization. - -### Troubleshoot the alert - -1. **Check the request queue length**: Inspect the Unbound configuration file (usually located at `/etc/unbound/unbound.conf`) and check the `num-queries-per-thread` setting. If the value is too low for your system, you may encounter issues with dropped requests. - -2. **Increase the queue length**: If necessary, increase the `num-queries-per-thread` value in the Unbound configuration file. For example, if the current value is 1024, you can try setting it to a higher value, such as 2048 or 4096. Save the changes and restart the Unbound service: - - ``` - sudo systemctl restart unbound - ``` - -3. **Monitor dropped requests**: Use the `unbound-control` command to monitor the number of dropped requests in real-time: - - ``` - sudo unbound-control stats_noreset | grep num.requestlist.dropped - ``` - - If you see the dropped requests decreasing, your changes to the `num-queries-per-thread` value may have resolved the issue. - -4. **Inspect server logs**: Check the Unbound log file (usually located at `/var/log/unbound.log`) for any suspicious activity or error messages that may indicate the cause of the increased DNS queries. - -5. **Check for potential DoS attacks**: Use tools like `iftop`, `nload`, or `nethogs` to monitor network traffic and identify any potential DoS attacks or unusual traffic patterns. - - If you believe your server is experiencing a DoS attack: - - - Investigate the source IP addresses of the high-volume traffic - - Block malicious traffic using firewall tools like `iptables` or `ufw` - - Contact your hosting provider, ISP, or network administrator for assistance - -6. **Optimize Unbound**: Review the [official Unbound documentation](https://nlnetlabs.nl/documentation/unbound/) and tune the settings in the Unbound configuration file to ensure optimal performance for your specific environment. - -### Useful resources - -1. [Unbound Official Documentation](https://nlnetlabs.nl/documentation/unbound/) -2. [How to set up a DNS Resolver with Unbound](https://calomel.org/unbound_dns.html) diff --git a/health/guides/unbound/unbound_request_list_overwritten.md b/health/guides/unbound/unbound_request_list_overwritten.md deleted file mode 100644 index fd74a163..00000000 --- a/health/guides/unbound/unbound_request_list_overwritten.md +++ /dev/null @@ -1,50 +0,0 @@ -### Understand the alert - -The `unbound_request_list_overwritten` alert is triggered when Unbound, a popular DNS resolver, overwrites old queued requests because its request queue is full. This alert can indicate a Denial of Service (DoS) attack or network saturation. - -### What does request list overwritten mean? - -When the request queue is full, Unbound starts overwriting the oldest requests in the queue with newer incoming requests. This is done to handle increasing load, but it may also lead to dropped or lost queries. - -### Troubleshoot the alert - -- Check the Unbound log file for any unusual events or error messages. The default log file location is `/var/log/unbound.log`. You may find more information about the cause of the request queue overload, such as a high number of incoming queries or sudden spikes in traffic. - -- Monitor Unbound's real-time statistics using the `unbound-control` command, which allows you to view various metrics related to the performance of the Unbound server: - - ``` - sudo unbound-control stats_noreset - ``` - - Look for the `num.query.list` and `num.query.list.overwritten` values to determine how many queries are in the request queue and how many of them are being overwritten. - -- Analyze the incoming DNS queries to check for suspicious patterns, such as high query rates from specific clients or repeated queries for the same domain. You can use tools like `tcpdump` to capture and inspect DNS traffic: - - ``` - sudo tcpdump -i any -nn -s0 -w dns_traffic.pcap 'port 53' - ``` - - You can then analyze the captured data using packet analyzers like Wireshark or tshark. - -- Increase the request queue length by adjusting the `num-queries-per-thread` value in the Unbound configuration file (`/etc/unbound/unbound.conf`), which determines the maximum number of queries that can be queued per thread before overwriting begins. Increasing this value may help to accommodate higher incoming query loads: - - ``` - server: - num-queries-per-thread: 4096 - ``` - - Remember to restart the Unbound service for the changes to take effect (`sudo systemctl restart unbound`). - -- Consider implementing rate limiting to prevent a single client from overloading the server. Unbound supports rate limiting using the `ratelimit` configuration option: - - ``` - server: - ratelimit: 1000 - ``` - - This example sets a limit of 1000 queries per second, but you should tune it according to your environment. - -### Useful resources - -1. [Unbound Configuration Guide](https://nlnetlabs.nl/documentation/unbound/unbound.conf/) -2. [Unbound Rate Limiting](https://calomel.org/unbound_dns.html#ratelimit) diff --git a/health/guides/upsd/upsd_10min_ups_load.md b/health/guides/upsd/upsd_10min_ups_load.md deleted file mode 100644 index fad4a2f6..00000000 --- a/health/guides/upsd/upsd_10min_ups_load.md +++ /dev/null @@ -1,38 +0,0 @@ -### Understand the alert - -This alert is based on the `upsd_10min_ups_load` metric, which measures the average UPS load over the last 10 minutes. If you receive this alert, it means that the load on your UPS is higher than expected, which may lead to an unstable power supply and ungraceful system shutdowns. - -### Troubleshoot the alert - -1. Verify the UPS load status - - Check the current load on the UPS using the `upsc` command with your UPS identifier: - ``` - upsc <your_ups_identifier> - ``` - Look for the `ups.load` metric in the command output to identify the current load percentage. - -2. Analyze the connected devices - - Make an inventory of all devices connected to the UPS, including servers, networking devices, and other equipment. Determine if all devices are essential or if some can be moved to another power source or disconnected entirely. - -3. Balance the load between multiple UPS units (if available) - - If you have more than one UPS, consider distributing the connected devices across multiple units to balance the load and ensure that each UPS isn't overloaded. - -4. Upgrade or replace the UPS - - If necessary, consider upgrading your UPS to a higher capacity model to handle the increased load or replacing the current unit if it's malfunctioning or unable to provide the required power. - -5. Monitor power usage trends - - Regularly review your power usage patterns and system logs, and take action to prevent load spikes that could trigger the `nut_10min_ups_load` alert. - -6. Optimize device power consumption - - Implement power-saving strategies for connected devices, such as enabling power-saving modes, reducing CPU usage, or using power-efficient networking equipment. - -### Useful resources - -1. [NUT user manual](https://networkupstools.org/docs/user-manual.chunked/index.html) -2. [Five steps to reduce UPS energy consumption](https://sp.ts.fujitsu.com/dmsp/Publications/public/wp-reduce-ups-energy-consumption-ww-en.pdf) diff --git a/health/guides/upsd/upsd_ups_battery_charge.md b/health/guides/upsd/upsd_ups_battery_charge.md deleted file mode 100644 index 0d8f757f..00000000 --- a/health/guides/upsd/upsd_ups_battery_charge.md +++ /dev/null @@ -1,38 +0,0 @@ -### Understand the alert - -The `upsd_ups_battery_charge` alert indicates that the average UPS charge over the last minute has dropped below a predefined threshold. This might be due to a power outage, a UPS malfunction, or a sudden surge in power demands that the UPS can't handle. - -### Troubleshoot the alert - -1. Check UPS status and connections - -Inspect the UPS physical connections, including power cables, communication cables, and any other devices connected to it. Ensure that everything is plugged in correctly and firmly. - -2. Check UPS logs and error messages - -Review the UPS logs for any error messages or events that might have occurred around the time the alert was triggered. This information could help you pinpoint the cause of the issue. You can find the logs in the Network UPS Tools (NUT) software. - -3. Monitor UPS charge level - -Keep an eye on the UPS charge level to determine if it's increasing or decreasing. This information can help you understand the overall health of your UPS. - -4. Test UPS batteries - -Test the UPS batteries to ensure that they are functioning correctly and have enough charge to power your devices during a power outage. Replace any faulty batteries or upgrade to higher-capacity batteries if needed. - -5. Check the UPS load - -Review the devices connected to the UPS and calculate their total power consumption. Ensure that the UPS is not overloaded and is capable of supporting the power demands of your devices. - -6. Restore the power supply - -If the UPS charge level remains low, try restoring the power supply to your UPS. This could involve switching to a different power source, fixing any faulty connections, or resolving issues with your local power grid. - -7. Prepare for a graceful shutdown - -If you can't restore the power supply to this UPS or if the problem persists,prepare your machine for a graceful shutdown to minimize the risk of data loss or hardware damage. - -### Useful resources - -1. [NUT User Manual](https://networkupstools.org/docs/user-manual.chunked/index.html) -2. [UPS troubleshooting guide](https://www.apc.com/us/en/faqs/FA158852/) diff --git a/health/guides/upsd/upsd_ups_last_collected_secs.md b/health/guides/upsd/upsd_ups_last_collected_secs.md deleted file mode 100644 index 81824783..00000000 --- a/health/guides/upsd/upsd_ups_last_collected_secs.md +++ /dev/null @@ -1,34 +0,0 @@ -### Understand the alert - -This alert is related to the Network UPS Tools (NUT) which monitors power devices, such as uninterruptible power supplies, power distribution units, solar controllers, and server power supply units. If you receive this alert, it means that there is an issue with the data collection process and needs troubleshooting to ensure the monitoring process works correctly. - -### Troubleshoot the alert - -#### Check the upsd server - -1. Check the status of the upsd daemon: - - ``` - $ systemctl status upsd - ``` - -2. Check for obvious and common errors in the log or output. If any errors are found, resolve them accordingly. - -3. Restart the daemon if needed: - - ``` - $ systemctl restart upsd - ``` - -#### Diagnose a bad driver - -1. `upsd` expects the drivers to either update their status regularly or at least answer periodic queries, called pings. If a driver doesn't answer, `upsd` will declare it "stale" and no more information will be provided to the clients. - -2. If upsd complains about staleness when you start it, then either your driver or configuration files are probably broken. Be sure that the driver is actually running, and that the UPS definition in [ups.conf(5)](https://networkupstools.org/docs/man/ups.conf.html) is correct. Also, make sure that you start your driver(s) before starting upsd. - -3. Data can also be marked stale if the driver can no longer communicate with the UPS. In this case, the driver should also provide diagnostic information in the syslog. If this happens, check the serial or USB cabling, or inspect the network path in the case of a SNMP UPS. - -### Useful resources - -1. [NUT User Manual](https://networkupstools.org/docs/user-manual.chunked/index.html) -2. [ups.conf(5)](https://networkupstools.org/docs/man/ups.conf.html)
\ No newline at end of file diff --git a/health/guides/vcsa/vcsa_applmgmt_health.md b/health/guides/vcsa/vcsa_applmgmt_health.md deleted file mode 100644 index 06f391b3..00000000 --- a/health/guides/vcsa/vcsa_applmgmt_health.md +++ /dev/null @@ -1,40 +0,0 @@ -### Understand the alert - -The `vcsa_applmgmt_health` alert is related to the health of VMware vCenter Server Appliance (VCSA) components. This alert is triggered when the health of one or more components is in a degraded or critical state, meaning that your VMware vCenter Server Appliance may be experiencing issues. - -### Troubleshoot the alert - -1. Access the vSphere Client for the affected vCenter Server Appliance - - Log in to the vSphere Client to check detailed health information and manage your VCSA. - -2. Check the health status of VCSA components - - In the vSphere Client, navigate to `Administration` > `System Configuration` > `Services` and `Nodes` tab. The component health status will be shown in the `Health` column. - -3. Inspect the affected component(s) - - If any components show a status other than "green" (healthy), click on the component to view more details and understand the issue. - -4. Check logs related to the affected component(s) - - Access the vCenter Server Appliance Management Interface (VAMI) by navigating to `https://<appliance-IP-address-or-FQDN>:5480` and logging in with the administrator account. - - In the VAMI, click on the `Monitoring` tab > `Logs`. Download and inspect the logs to identify the root cause of the issue. - -5. Take appropriate actions - - Depending on the nature of the issue identified, perform the necessary actions or modifications to resolve it. Consult the VMware documentation for recommended solutions for specific component health issues. - -6. Monitor the component health - - After performing appropriate actions, continue to monitor the VCSA component health in the vSphere Client to ensure they return to a healthy status. - -7. Contact VMware support - - If you are unable to resolve the issue, contact VMware support for further assistance. - -### Useful resources - -1. [VMware vCenter Server 7.0 Documentation](https://docs.vmware.com/en/VMware-vSphere/7.0/com.vmware.vsphere.vcenter.configuration.doc/GUID-52AF3379-8D78-437F-96EF-25D1A1100BEE.html) -2. [VMware Support](https://www.vmware.com/support.html) diff --git a/health/guides/vcsa/vcsa_database_storage_health.md b/health/guides/vcsa/vcsa_database_storage_health.md deleted file mode 100644 index eb978b07..00000000 --- a/health/guides/vcsa/vcsa_database_storage_health.md +++ /dev/null @@ -1,33 +0,0 @@ -### Understand the alert - -The `vcsa_database_storage_health` alert monitors the health of database storage components in a VMware vCenter Server Appliance (vCSA). When this alert is triggered, it indicates that one or more components have a health status of Warning, Critical or Unknown. - -### What do the different health statuses mean? - -- Unknown (`-1`): The system is unable to determine the component's health status. -- Healthy (`0`): The component is functioning correctly and has no known issues. -- Warning (`1`): The component is currently operating but may be experiencing minor problems. -- Critical (`2`): The component is degraded and might have significant issues affecting functionality. -- Critical (`3`): The component is unavailable or expected to stop functioning soon, requiring immediate attention. -- No health data (`4`): There is no health data available for the component. - -### Troubleshoot the alert - -1. **Identify the affected components**: To begin troubleshooting the alert, you need to identify which components are experiencing health issues. You can check the vCenter Server Appliance Management Interface (VAMI) to review the health status of all components. - - - Access the VAMI by navigating to `https://<appliance-IP>/ui` in your web browser. - - Log in with your vCenter credentials. - - Click on the `Health` tab in the left-hand menu to view the health status of all components. - -2. **Investigate the issues**: Once you have identified the affected components, review the alarms and events in vCenter to determine the root cause of the problems. Pay close attention to any recent changes or updates that may have impacted system functionality. - -3. **Review the vCenter Server logs**: If necessary, examine the logs in vCenter Server to gather more information about any possible issues. The logs can be accessed via SSH, the VAMI, or using the Log Browser in the vSphere Web Client. - -4. **Take corrective actions**: Based on your findings from the previous steps, address the issues affecting the health status of the components. - - - In the case of insufficient storage, increasing the storage capacity or deleting unnecessary files might resolve the problem. - - If the issues are caused by hardware failures, consider replacing or repairing the affected hardware components. - - For software-related issues, ensure that all components are up-to-date and properly configured. - -5. **Monitor the component health**: After taking corrective actions, continue to monitor the health statuses of the affected components through the VAMI to ensure that the issues have been successfully resolved. - diff --git a/health/guides/vcsa/vcsa_load_health.md b/health/guides/vcsa/vcsa_load_health.md deleted file mode 100644 index 026138d5..00000000 --- a/health/guides/vcsa/vcsa_load_health.md +++ /dev/null @@ -1,18 +0,0 @@ -### Understand the alert - -The `vcsa_load_health` alert indicates the current health status of the VMware vCenter Server Appliance (VCSA) system components. The color-coded health indicators help quickly understand the overall state of the system. - -### Troubleshoot the alert - -1. **Log in to the vCenter Server Appliance Management Interface (VAMI):** Open a web browser and navigate to `https://vcsa_address:5480`, where `vcsa_address` is the IP address or domain name of the VCSA. Log in with the appropriate credentials (by default, the `root` user). - -2. **Inspect the health status of VCSA components:** Once logged in, go to the `Summary` tab, which displays the health status of various components, such as Database, Management, and Networking. You can hover over the component's health icon to get more information about its status. - -3. **Check for specific component warnings or critical issues:** If any component has a warning or critical health status, click on the `Monitor` tab and then on the component in question to get more details about the specific problem. - -4. **Review log files:** For further investigation, review the log files associated with the affected VCSA component. The log files can be accessed on the VAMI interface under the `Logs` tab. - -5. **Resolve the issue:** Based on the information gathered from the VAMI interface and log files, take appropriate action to resolve the issue or contact VMware support for assistance. - -6. **Monitor VCSA Health:** After resolving the issue, monitor the health status of the VCSA components on the `Summary` tab in VAMI to ensure that the health indicators return to a normal state. - diff --git a/health/guides/vcsa/vcsa_mem_health.md b/health/guides/vcsa/vcsa_mem_health.md deleted file mode 100644 index 1e360465..00000000 --- a/health/guides/vcsa/vcsa_mem_health.md +++ /dev/null @@ -1,36 +0,0 @@ -### Understand the alert - -The `vcsa_mem_health` alert indicates the memory health status of a virtual machine within the VMware vCenter. If you receive this alert, it means that the system's memory health could be compromised, and might lead to degraded performance, serious problems, or stop functioning. - -### Troubleshoot the alert - -1. **Check the vCenter Server Appliance health**: - - Log in to the vSphere Client and select the vCenter Server instance. - - Navigate to the Monitor tab > Health section. - - Check the Memory Health status, and take note of any concerning warnings or critical issues. - -2. **Analyze the memory usage**: - - Log in to the vSphere Client and select the virtual machine. - - Navigate to the Monitor tab > Performance section > Memory. - - Evaluate the memory usage trends and look for any unusual spikes or prolonged high memory usage. - -3. **Identify processes consuming high memory**: - - Log in to the affected virtual machine. - - Use the appropriate task manager or command, depending on the OS, to list processes and their memory usage. - - Terminate any unnecessary processes that are consuming high memory, but ensure that the process is not critical to system operation. - -4. **Optimize the virtual machine's memory allocation**: - - If the virtual machine consistently experiences high memory usage, consider increasing the allocated memory or optimizing applications running on the virtual machine to consume less memory. - -5. **Update VMware tools**: - - Ensuring that the VMware tools are up to date can help in better memory management and improve overall system health. - -6. **Check hardware issues**: - - If the problem persists, check hardware components such as memory sticks, processors, and data stores for any faults that could be causing the problem. - -7. **Contact VMware Support**: - - If you can't resolve the `vcsa_mem_health` alert or are unable to identify the root cause, contact VMware Support for further assistance. - -### Useful resources - -1. [VMware vCenter Server Documentation](https://docs.vmware.com/en/VMware-vSphere/7.0/com.vmware.vsphere.vcenter.configuration.doc/GUID-ACEC0944-EFA7-482B-84DF-6A084C0868B3.html) diff --git a/health/guides/vcsa/vcsa_software_updates_health.md b/health/guides/vcsa/vcsa_software_updates_health.md deleted file mode 100644 index 505e20f5..00000000 --- a/health/guides/vcsa/vcsa_software_updates_health.md +++ /dev/null @@ -1,35 +0,0 @@ -### Understand the alert - -The `vcsa_software_updates_health` alert monitors the software updates availability status for a VMware vCenter Server Appliance (VCSA). The alert can have different statuses depending on the software updates state, with critical indicating that security updates are available. - -### Troubleshoot the alert - -Follow these troubleshooting steps according to the alert status: - -1. **Critical (security updates available):** - - - Access the vCenter Server Appliance Management Interface (VAMI) by browsing to `https://<vcsa-address>:5480`. - - Log in with the appropriate user credentials (typically `root` user). - - Click on the `Update` menu item. - - Review the available patches and updates, especially those related to security. - - Click `Stage and Install` to download and install the security updates. - - Monitor the progress of the update installation and, if needed, address any issues that might occur during the process. - -2. **Warning (error retrieving information on software updates):** - - - Access the vCenter Server Appliance Management Interface (VAMI) by browsing to `https://<vcsa-address>:5480`. - - Log in with the appropriate user credentials (typically `root` user). - - Click on the `Update` menu item. - - Check for any error messages in the `Update` section. - - Ensure that the VCSA has access to the internet and can reach the VMware update repositories. - - Verify that there are no issues with the system time or SSL certificates. - - If the issue persists, consider searching for relevant information in the VMware Knowledge Base or contacting VMware Support. - -3. **Clear (no updates available, non-security updates available, or unknown status):** - - - No immediate action is required. However, it's a good practice to periodically check for updates to ensure the VMware vCenter Server Appliance remains up-to-date and secure. - -### Useful resources - -1. [VMware vCenter Server Appliance Management](https://docs.vmware.com/en/VMware-vSphere/7.0/com.vmware.vsphere.vcenter.configuration.doc/GUID-52AF3379-8D78-437F-96EF-25D1A1100BEE.html) -2. [VMware Knowledge Base](https://kb.vmware.com/) diff --git a/health/guides/vcsa/vcsa_storage_health.md b/health/guides/vcsa/vcsa_storage_health.md deleted file mode 100644 index 9dbfe69c..00000000 --- a/health/guides/vcsa/vcsa_storage_health.md +++ /dev/null @@ -1,28 +0,0 @@ -### Understand the alert - -The `vcsa_storage_health` alert indicates the health status of the storage components in your VMware vCenter Server Appliance (vCSA). It notifies you when the storage components are experiencing issues or are at risk of failure. - -### Troubleshoot the alert - -1. Identify the affected component(s): Check the alert details and note the component(s) with the corresponding health codes to determine their status. - -2. Access the vCenter Server Appliance Management Interface (VAMI): Open a supported browser and enter the URL: `https://<appliance-IP-address-or-FQDN>:5480`. Log in with the administrator or root credentials. - -3. Navigate to the Storage tab: In the VAMI, click on the 'Monitor' tab and then click on 'Storage.' - -4. Analyze the storage health: Review the reported storage health status for each component, match the health status with the information in the alert, and identify any issues. - -5. Remediate the issue: Depending on the identified problem, take the necessary actions to resolve the issue. Examples include: - - - Check for any hardware faults and replace faulty components. - - Investigate possible disk space issues and free up space or increase the storage capacity. - - Verify that the storage subsystem is properly configured, and no misconfigurations are causing the issue. - - Look for software issues, such as failed updates, and resolve them or rollback changes. - - Consult VMware support if further assistance is needed. - -6. Verify resolution: After resolving the issue, verify that the storage health status has improved by checking the current status in the VAMI Storage tab. - -### Useful resources - -1. [VMware vCenter Server Appliance Management Interface](https://docs.vmware.com/en/VMware-vSphere/7.0/com.vmware.vsphere.vcenter.configuration.doc/GUID-ACEC0944-EFA7-482B-84DF-6A084C0868B3.html) -2. [VMware vSphere Documentation](https://docs.vmware.com/en/VMware-vSphere/index.html) diff --git a/health/guides/vcsa/vcsa_swap_health.md b/health/guides/vcsa/vcsa_swap_health.md deleted file mode 100644 index 6e236ed3..00000000 --- a/health/guides/vcsa/vcsa_swap_health.md +++ /dev/null @@ -1,35 +0,0 @@ -### Understand the alert - -The vcsa_swap_health alert presents the swap health status of the VMware vCenter virtual machine. It is an indicator of the overall health of memory swapping on the vCenter virtual machine. - -### Troubleshoot the alert - -1. First, identify the health status of the alert by checking the color and its corresponding description in the table above. - -2. Log in to the VMware vSphere Web Client: - - Navigate to `https://<vCenter-IP-address-or-domain-name>:<port>/vsphere-client`, where `<vCenter-IP-address-or-domain-name>` is your vCenter Server system IP or domain name, and `<port>` is the port number over which to access the vSphere Web Client. - - Enter the username and password, and click Login. - -3. Navigate to the vCenter virtual machine, and select the Monitor tab. - -4. Verify the swap file size by selecting the `Performance` tab, and choosing `Advanced` view. - -5. Monitor the swap usage on the virtual machine: - - On the `Performance` tab, look for high swap usage (`200 MB` or above). If necessary, consider increasing the swap file size. - - On the `Summary` tab, check for any warning or error messages related to the swap file or its usage. - -6. Check if there are any leading processes consuming an unreasonable amount of memory: - - If running a Linux-based virtual machine, use command-line utilities like `free`, `top`, `vmstat`, or `htop`. Look out for processes with high `%MEM` or `RES` values. - - If running a Windows-based virtual machine, use Task Manager or Performance Monitor to check for memory usage. - -7. Optimize the virtual machine memory settings: - - Verify if the virtual machine has sufficient memory allocation. - - Check the virtual machine's memory reservation and limit settings. - - Consider enabling memory ballooning for a better utilization of available memory. - -8. If the swap health status does not improve or you are unsure how to proceed, consult VMware documentation or contact VMware support for further assistance. - -### Useful resources - -1. [Configuring VMware vCenter 7.0](https://docs.vmware.com/en/VMware-vSphere/7.0/com.vmware.vsphere.vcenter.configuration.doc/GUID-ACEC0944-EFA7-482B-84DF-6A084C0868B3.html) -2. [Virtual Machine Memory Management Concepts](https://www.vmware.com/content/dam/digitalmarketing/vmware/en/pdf/techpaper/perf-vsphere-memory_management.pdf) diff --git a/health/guides/vcsa/vcsa_system_health.md b/health/guides/vcsa/vcsa_system_health.md deleted file mode 100644 index 6e58a68d..00000000 --- a/health/guides/vcsa/vcsa_system_health.md +++ /dev/null @@ -1,35 +0,0 @@ -### Understand the alert - -The `vcsa_system_health` alert indicates the overall health status of your VMware vCenter Server Appliance (vCSA). If you receive this alert, it means that one or more components in the appliance are in a degraded or unhealthy state that could lead to reduced performance or even appliance unresponsiveness. - -### Troubleshoot the alert - -Perform the following steps to identify and resolve the issue: - -1. Log in to the vCenter Server Appliance Management Interface (VAMI). - - You can access the VAMI by navigating to `https://<your_vcenter_address>:5480` in a web browser. Log in with the appropriate credentials. - -2. Check the System Health status. - - In the VAMI, click on the `Monitor` tab, and then click on `Health`. This will provide you with an overview of the different components and their individual health status. - -3. Analyze the affected components. - - Identify the components that are displaying warning (yellow), degraded (orange), or critical (red) health status. These components may be causing the overall `vcsa_system_health` alert. - -4. Investigate the problematic components. - - Click on each affected component to find more information about the issue. This may include error messages, suggested actions, and links to relevant documentation. - -5. Resolve the issues. - - Follow the recommended actions or consult the VMware documentation to resolve the issues with the affected components. - -6. Verify the system health. - - Once the issues have been resolved, refresh the Health page in the VAMI to ensure that all components now display a healthy (green) status. The `vcsa_system_health` alert should clear automatically. - -### Useful resources - -1. [VMware vSphere 7.0 vCenter Appliance Management](https://docs.vmware.com/en/VMware-vSphere/7.0/com.vmware.vsphere.vcenter.configuration.doc/GUID-52AF3379-8D78-437F-96EF-25D1A1100BEE.html) diff --git a/health/guides/vernemq/vernemq_average_scheduler_utilization.md b/health/guides/vernemq/vernemq_average_scheduler_utilization.md deleted file mode 100644 index 5e5bc6d4..00000000 --- a/health/guides/vernemq/vernemq_average_scheduler_utilization.md +++ /dev/null @@ -1,66 +0,0 @@ -### Understand the alert - -This alert is related to VerneMQ, which is an MQTT broker. The Netdata Agent calculates the average VerneMQ's scheduler utilization over the last 10 minutes. If you receive this alert, it means your VerneMQ scheduler's utilization is high, which may indicate performance issues or resource constraints. - -### What does scheduler utilization mean? - -VerneMQ uses schedulers to manage its tasks and processes. In this context, scheduler utilization represents the degree to which the VerneMQ schedulers are being used. High scheduler utilization may cause delays in processing tasks, leading to performance degradation and possibly affecting the proper functioning of the MQTT broker. - -### Troubleshoot the alert - -- Verify the VerneMQ scheduler utilization - -1. To check the scheduler utilization, you can use the `vmq-admin` command like this: - - ``` - vmq-admin metrics show | grep scheduler - ``` - - This command will display the scheduler utilization percentage. - -- Analyze the VerneMQ MQTT traffic - -1. To analyze the MQTT traffic, use the `vmq-admin` `session` and `client` subcommands. These can give you insights into the current subscription and client status: - - ``` - vmq-admin session show - vmq-admin client show - ``` - - This can help you identify if there is any abnormal activity or an increase in the number of clients or subscriptions that may be affecting the scheduler's performance. - -- Evaluate VerneMQ system resources - -1. Assess CPU and memory usage of the VerneMQ process using the `top` or `htop` commands: - - ``` - top -p $(pgrep -f vernemq) - ``` - - This will show you the CPU and memory usage for the VerneMQ process. If the process is consuming too many resources, it might be affecting the scheduler's utilization. - -2. Evaluate the system's available resources (CPU, memory, and I/O) using commands like `vmstat`, `free`, and `iostat`. - - ``` - vmstat - free - iostat - ``` - - These commands can help you understand if your system's resources are nearing their limits or if there are any bottlenecks affecting the overall performance. - -3. Check the VerneMQ logs for any errors or warnings. The default location for VerneMQ logs is `/var/log/vernemq`. Look for messages that may indicate issues affecting the scheduler's performance. - -- Optimize VerneMQ performance or adjust resources - -1. If the MQTT traffic is high or has increased recently, consider scaling up your VerneMQ instance by adding more resources (CPU or memory) or by distributing the load across multiple nodes. - -2. If your system resources are limited, consider optimizing your VerneMQ configuration to improve performance. Some example options include adjusting the `max_online_messages`, `max_inflight_messages`, or `queue_deliver_mode`. - -3. If the alert persists even after evaluating and making changes to the above steps, consult the VerneMQ documentation or community for further assistance. - -### Useful resources - -1. [VerneMQ Documentation](https://vernemq.com/docs/) -2. [VerneMQAdministration Guide](https://vernemq.com/docs/administration/) -3. [VerneMQ Configuration Guide](https://vernemq.com/docs/configuration/)
\ No newline at end of file diff --git a/health/guides/vernemq/vernemq_cluster_dropped.md b/health/guides/vernemq/vernemq_cluster_dropped.md deleted file mode 100644 index 0bdc6f08..00000000 --- a/health/guides/vernemq/vernemq_cluster_dropped.md +++ /dev/null @@ -1,49 +0,0 @@ -### Understand the alert - -This alert indicates that VerneMQ, an MQTT broker, is experiencing issues with inter-node message delivery within a clustered environment. The Netdata agent calculates the amount of traffic dropped during communication with cluster nodes in the last minute. If you receive this alert, it means that the outgoing cluster buffer is full and some messages cannot be delivered. - -### What does dropped messages mean? - -Dropped messages occur when the outgoing cluster buffer becomes full, and VerneMQ cannot deliver messages between its nodes. This can happen due to a remote node being down or unreachable, causing the buffer to fill up and preventing efficient message delivery. - -### Troubleshoot the alert - -1. Check the connectivity and status of cluster nodes - - Verify that all cluster nodes are up, running and reachable. Use `vmq-admin cluster show` to get an overview of the cluster nodes and their connectivity status. - - ``` - vmq-admin cluster show - ``` - -2. Investigate logs for any errors or warnings - - Inspect the logs of the VerneMQ node(s) for any errors or warning messages. This can provide insight into any potential problems related to the cluster or network. - - ``` - sudo journalctl -u vernemq - ``` - -3. Increase the buffer size - - If the issue persists, consider increasing the buffer size. Adjust the `outgoing_clustering_buffer_size` value in the `vernemq.conf` file. - - ``` - outgoing_clustering_buffer_size = <new_buffer_size> - ``` - - Replace `<new_buffer_size>` with a larger value, for example, doubling the current buffer size. After updating the configuration, restart the VerneMQ service to apply the changes. - - ``` - sudo systemctl restart vernemq - ``` - -4. Monitor the dropped messages - - Continue to monitor the dropped messages using Netdata, and check if the issue is resolved after increasing the buffer size. - -### Useful resources - -1. [VerneMQ Documentation - Clustering](https://vernemq.com/docs/clustering/) -2. [VerneMQ Logging and Monitoring](https://docs.vernemq.com/monitoring-vernemq/logging) -3. [Managing VerneMQ Configuration](https://docs.vernemq.com/configuration/)
\ No newline at end of file diff --git a/health/guides/vernemq/vernemq_mqtt_connack_sent_reason_unsuccessful.md b/health/guides/vernemq/vernemq_mqtt_connack_sent_reason_unsuccessful.md deleted file mode 100644 index d68db0d1..00000000 --- a/health/guides/vernemq/vernemq_mqtt_connack_sent_reason_unsuccessful.md +++ /dev/null @@ -1,20 +0,0 @@ -### Understand the alert - -This alert is triggered when there is a significant increase in the number of unsuccessful v3/v5 CONNACK packets sent by the VerneMQ broker within the last minute. A higher-than-normal rate of unsuccessful CONNACKs indicates that clients are experiencing difficulties establishing a connection with the MQTT broker. - -### What is a CONNACK packet? - -A CONNACK packet is an acknowledgment packet sent by the MQTT broker to a client in response to a CONNECT command. The CONNACK packet informs the client if the connection has been accepted or rejected, which is indicated by the return code. An unsuccessful CONNACK packet indicates a rejected connection. - -### Troubleshoot the alert - -1. **Check VerneMQ logs**: Inspect the VerneMQ logs for error messages or reasons why the connections are being rejected. By default, these logs are located at `/var/log/vernemq/console.log` and `/var/log/vernemq/error.log`. Look for entries with "CONNACK" and discern the cause of the unsuccessful connections. - -2. **Diagnose client configuration issues**: Analyze the rejected connection attempts' client configurations, such as incorrect credentials, unsupported protocol versions, or security settings. Debug the client-side applications, fix the configurations, and try reconnecting to the MQTT broker. - -3. **Evaluate broker capacity**: Check the system resources and settings of the VerneMQ broker. An overloaded broker or insufficient system resources, such as CPU and memory, can cause connection rejections. Optimize the VerneMQ configuration, upgrade the broker's hardware, or distribute the load between multiple brokers to resolve the issue. - -4. **Assess network issues**: Verify the network topology, firewalls, and router settings to ensure clients can reach the MQTT broker. Network latency or misconfigurations can lead to unsuccessful CONNACKs. Use monitoring tools such as `ping`, `traceroute`, or `netstat` to diagnose network issues and assess connectivity between clients and the broker. - -5. **Verify security settings and permissions**: Check the VerneMQ broker's security settings, including access control lists (ACL), user permissions, and authentication/authorization settings. Restricted access or incorrect permissions can lead to connection rejections. Update the security settings accordingly and test the connection again. - diff --git a/health/guides/vernemq/vernemq_mqtt_disconnect_received_reason_not_normal.md b/health/guides/vernemq/vernemq_mqtt_disconnect_received_reason_not_normal.md deleted file mode 100644 index 014c5b0c..00000000 --- a/health/guides/vernemq/vernemq_mqtt_disconnect_received_reason_not_normal.md +++ /dev/null @@ -1,40 +0,0 @@ -### Understand the alert - -This alert is triggered when the number of not normal v5 DISCONNECT packets received by VerneMQ in the last minute is above a certain threshold. This indicates that there is an issue with MQTT clients connecting to your VerneMQ MQTT broker that requires attention. - -### What does not normal mean? - -In the context of this alert, "not normal" refers to v5 DISCONNECT packets that were received with a reason code other than "normal disconnection", as specified in the MQTT v5 protocol. Normal disconnection refers to clients disconnecting gracefully without any issues. - -### Troubleshoot the alert - -1. Inspect VerneMQ logs - - Check the VerneMQ logs for any relevant information about the MQTT clients that are experiencing not normal disconnects. This can provide important context to identify the root cause of the issue. - - ``` - sudo journalctl -u vernemq - ``` - -2. Check the MQTT clients - - Investigate the MQTT clients that are experiencing not normal disconnects. This may involve inspecting client logs or usage patterns, as well as verifying that the clients are using the correct MQTT version (v5) and have the appropriate configurations. - -3. Monitor VerneMQ metrics - - Use the VerneMQ metrics to monitor the broker's performance and identify any sudden spikes in abnormal disconnects or other relevant metrics. - - To view the VerneMQ metrics, access the VerneMQ admin interface, usually available at `http://<your_vernemq_address>:8888/metrics`. - -4. Review network conditions - - Verify that there are no networking issues between the MQTT clients and the VerneMQ MQTT broker, as these issues could cause MQTT clients to disconnect unexpectedly. - -5. Review VerneMQ configuration - - Review your VerneMQ configuration to ensure it is correctly set up to handle the expected MQTT client load and usage patterns. - -### Useful resources - -1. [VerneMQ documentation](https://vernemq.com/docs/) -2. [MQTT v5 specification](https://docs.oasis-open.org/mqtt/mqtt/v5.0/mqtt-v5.0.html) diff --git a/health/guides/vernemq/vernemq_mqtt_disconnect_sent_reason_not_normal.md b/health/guides/vernemq/vernemq_mqtt_disconnect_sent_reason_not_normal.md deleted file mode 100644 index 7bbc1ba1..00000000 --- a/health/guides/vernemq/vernemq_mqtt_disconnect_sent_reason_not_normal.md +++ /dev/null @@ -1,45 +0,0 @@ -### Understand the alert - -This alert indicates that VerneMQ, a high-performance, distributed MQTT message broker, is sending an abnormal number of v5 DISCONNECT packets in the last minute. This may signify an issue in the MQTT messaging system and impact the functioning of IoT devices or other MQTT clients connected to VerneMQ. - -### What does an abnormal v5 DISCONNECT packet mean? - -In MQTT v5, the DISCONNECT packet is sent by a client or server to indicate the end of a session. A "not normal" DISCONNECT packet, generally refers to a DISCONNECT packet sent with a reason code other than "Normal Disconnection" (0x00). These reason codes might include: - -- Protocol errors -- Invalid DISCONNECT payloads -- Authorization or authentication violations -- Exceeded keep-alive timers -- Server/connection errors -- User-triggered disconnects - -A high number of not normal DISCONNECT packets, might indicate an issue in your MQTT infrastructure, misconfigured clients, or security breaches. - -### Troubleshoot the alert - -1. **Inspect VerneMQ logs**: VerneMQ logs can provide detailed information about connections, disconnections, and possible issues. Check the VerneMQ logs for errors and information about unusual disconnects. - - ``` - cat /var/log/vernemq/console.log - cat /var/log/vernemq/error.log - ``` - -2. **Monitor VerneMQ status**: Use the `vmq-admin` command-line tool to monitor VerneMQ and view its runtime status. Check the number of connected clients, subscriptions, and sessions. - - ``` - sudo vmq-admin cluster show - sudo vmq-admin session show - sudo vmq-admin listener show - ``` - -3. **Check clients and configurations**: Review client configurations for potential errors, like incorrect authentication credentials, misconfigured keep-alive timers, or invalid packet formats. If possible, isolate problematic clients and test their behavior. - -4. **Consider resource limitations**: If your VerneMQ instance is reaching resource limitations (CPU, memory, network), it might automatically terminate some connections to maintain performance. Monitor system resources using the `top` command or tools like Netdata. - -5. **Evaluate security**: If the issue persists, consider checking the security of your MQTT infrastructure. Investigate possible cyber threats, such as a DDoS attack or unauthorized clients attempting to connect. - -### Useful resources - -1. [VerneMQ Documentation](https://docs.vernemq.com/) -2. [MQTT v5 Specification](https://docs.oasis-open.org/mqtt/mqtt/v5.0/mqtt-v5.0.html) -3. [Debugging MQTT Connections](https://www.hivemq.com/blog/mqtt-essentials-part-9-last-will-and-testament/)
\ No newline at end of file diff --git a/health/guides/vernemq/vernemq_mqtt_puback_received_reason_unsuccessful.md b/health/guides/vernemq/vernemq_mqtt_puback_received_reason_unsuccessful.md deleted file mode 100644 index f7b50666..00000000 --- a/health/guides/vernemq/vernemq_mqtt_puback_received_reason_unsuccessful.md +++ /dev/null @@ -1,33 +0,0 @@ -### Understand the alert - -This alert tracks the number of `unsuccessful v5 PUBACK packets` received by the VerneMQ broker within the last minute. If you receive this alert, there might be an issue with your MQTT clients or the packets they send to the VerneMQ broker. - -### What are v5 PUBACK packets? - -In MQTT v5, the `PUBACK` packet is sent by the server or subscriber client to acknowledge the receipt of a `PUBLISH` packet. In the MQTT v5 protocol, the `PUBACK` packet can contain a reason code indicating whether the message was successfully processed or if there was an error. - -### Troubleshoot the alert - -1. Check the VerneMQ logs: Analyze the logs to check for any errors or issues related to the MQTT clients or the incoming messages. VerneMQ's logs are usually located at `/var/log/vernemq/` directory, or you can check the log location in the VerneMQ configuration files. - - ``` - less /var/log/vernemq/console.log - less /var/log/vernemq/error.log - ``` - -2. Verify MQTT clients' configurations: Review your MQTT clients' settings to ensure that they are configured correctly, especially the protocol version, QoS levels, and any MQTT v5 specific settings. Make any necessary adjustments and restart the clients. - -3. Monitor VerneMQ performance: Use the VerneMQ `vmq-admin` tool to monitor the broker's performance, check connections, subscriptions, and session information. This can help you identify potential issues affecting the processing of incoming messages. - - ``` - vmq-admin metrics show - vmq-admin session list - vmq-admin listener show - ``` - -4. Check the `PUBLISH` messages: Inspect the contents of `PUBLISH` messages being sent by the MQTT clients to ensure they are correctly formatted and adhere to the MQTT v5 protocol specifications. If necessary, correct any issues and send test messages to confirm the problem is resolved. - -### Useful resources - -1. [VerneMQ documentation](https://vernemq.com/docs/) -2. [MQTT v5.0 Specification](https://docs.oasis-open.org/mqtt/mqtt/v5.0/os/mqtt-v5.0-os.html) diff --git a/health/guides/vernemq/vernemq_mqtt_puback_sent_reason_unsuccessful.md b/health/guides/vernemq/vernemq_mqtt_puback_sent_reason_unsuccessful.md deleted file mode 100644 index 85a06a22..00000000 --- a/health/guides/vernemq/vernemq_mqtt_puback_sent_reason_unsuccessful.md +++ /dev/null @@ -1,32 +0,0 @@ -### Understand the alert - -This alert is related to VerneMQ, an MQTT message broker. If you receive this alert, it means that an increasing number of unsuccessful v5 PUBACK packets have been sent in the last minute. - -### What does "unsuccessful v5 PUBACK" mean? - -In the MQTT protocol, when a client sends a Publish message with a Quality of Service (QoS) level 1, the message broker sends a PUBACK packet to acknowledge receipt of the message. However, MQTT v5 has added a reason code field in the PUBACK packet, allowing brokers to report any issues or errors that occurred during message delivery. An "unsuccessful v5 PUBACK" refers to a PUBACK packet that reports a delivery problem or issue. - -### Troubleshoot the alert - -1. Check VerneMQ logs for possible errors or warnings: VerneMQ logs can provide valuable insights into the broker's runtime behavior, including connection issues or problems with authentication/authorization. Look for errors or warnings in the logs that could indicate the cause of the unsuccessful PUBACK packets. - - ``` - sudo journalctl -u vernemq - ``` - -2. Verify client connections: Connection issues can be a possible cause of unsuccessful PUBACK packets. Use the `vmq-admin session show` command to view the client connections, and check for any abnormal behavior (e.g., frequent disconnects and reconnects). - - ``` - sudo vmq-admin session show - ``` - -3. Check MQTT client logs: Review the logs from the devices that connect to your VerneMQ broker instance to verify if they encounter any issues or errors when sending messages. - -4. Monitor the broker's resources usage: High system load or insufficient resources may affect VerneMQ's performance and prevent it from processing PUBACK packets as expected. Use monitoring tools like `top` and `iotop` to observe CPU and I/O usage, and assess whether the broker has enough resources to handle the MQTT traffic. - -5. Update VerneMQ configuration: Double-check your VerneMQ settings for any misconfiguration related to QoS, message storage, or security policies that could prevent PUBACK packets from being sent or processed successfully. - -### Useful resources - -1. [VerneMQ Documentation](https://vernemq.com/docs/) -2. [MQTT Version 5 Features](https://www.hivemq.com/blog/mqtt-5-foundational-changes-in-the-protocol/) diff --git a/health/guides/vernemq/vernemq_mqtt_puback_unexpected.md b/health/guides/vernemq/vernemq_mqtt_puback_unexpected.md deleted file mode 100644 index b2541e86..00000000 --- a/health/guides/vernemq/vernemq_mqtt_puback_unexpected.md +++ /dev/null @@ -1,34 +0,0 @@ -### Understand the alert - -This alert is related to VerneMQ, a high-performance MQTT broker. It monitors the number of unexpected v3/v5 PUBACK packets received in the last minute. If you receive this alert, it means that there are more PUBACK packets received than expected, which could indicate an issue with your MQTT broker or your MQTT client application(s). - -### What are PUBACK packets? - -In MQTT (Message Queuing Telemetry Transport) protocol, PUBACK packets are acknowledgement packets sent by the MQTT broker to confirm the receipt of a PUBLISH message with QoS (Quality of Service) level 1. The MQTT client will wait for this acknowledgment packet before it can continue with the next transaction. - -### Troubleshoot the alert - -1. Check VerneMQ logs for any unusual events, errors, or issues that could be related to the PUBACK packets. The VerneMQ logs can be found in `/var/log/vernemq` by default, or any custom location defined in the configuration file. - - ``` - sudo tail -f /var/log/vernemq/console.log - ``` - -2. Investigate your MQTT client application(s) to ensure they are handling the PUBLISH messages correctly and not causing duplicate or unexpected PUBACK packets. You can use an MQTT client library that supports QoS level 1 to eliminate the possibility of custom code not following the MQTT protocol properly. - -3. Monitor your MQTT broker and client application(s) for any network connectivity issues that could cause unexpected PUBACK packets. You can use tools like `ping` and `traceroute` to check the network connectivity between the MQTT broker and client application(s). - -4. Analyze the load and performance of your MQTT broker using the various metrics provided by VerneMQ. You can access the VerneMQ status and metrics using the `vmq-admin` command: - - ``` - sudo vmq-admin metrics show - ``` - - Look for any unusual spikes or bottlenecks that could cause unexpected PUBACK packets in the output. - -5. If none of the above steps resolve the issue, consider reaching out to the VerneMQ community or opening a GitHub issue to seek further assistance. - -### Useful resources - -1. [VerneMQ Documentation](https://vernemq.com/docs/) -2. [Understanding MQTT QoS Levels](https://www.hivemq.com/blog/mqtt-essentials-part-6-mqtt-quality-of-service-levels/) diff --git a/health/guides/vernemq/vernemq_mqtt_pubcomp_received_reason_unsuccessful.md b/health/guides/vernemq/vernemq_mqtt_pubcomp_received_reason_unsuccessful.md deleted file mode 100644 index 5bdfd5b3..00000000 --- a/health/guides/vernemq/vernemq_mqtt_pubcomp_received_reason_unsuccessful.md +++ /dev/null @@ -1,26 +0,0 @@ -### Understand the alert - -This alert indicates that the VerneMQ broker has received an increased number of unsuccessful MQTT v5 PUBCOMP (Publish Complete) packets in the last minute. The PUBCOMP packet is the fourth and final packet in the QoS 2 publish flow. It means that there are issues in the MQTT message delivery process at Quality of Service (QoS) level 2, which could lead to message loss or duplicated messages. - -### What does an unsuccessful PUBCOMP mean? - -An unsuccessful PUBCOMP occurs when the recipient of a PUBLISH message (subscriber) acknowledges reception but encounters a problem while processing the message. The PUBCOMP packet contains a Reason Code, indicating the outcome of processing the PUBLISH message. In a successful case, the code would be 0x00 (Success); otherwise, it would be one of the following: 0x80 (Unspecified Error), 0x83 (Implementation Specific Error), 0x87 (Not Authorized), 0xD0 (Packet Identifier in Use), or 0xD2 (Packet Identifier Not Found). - -### Troubleshoot the alert - -1. Check the VerneMQ error logs: VerneMQ logs can provide valuable information on encountered errors or any misconfiguration that leads to unsuccessful PUBCOMP messages. Generally, their location is `/var/log/vernemq/console.log`, `/var/log/vernemq/error.log`, and `/var/log/vernemq/crash.log`. - -2. Review MQTT clients' logs: Inspect the logs of the MQTT clients that are publishing or subscribing to the messages on the VerneMQ broker. This may help you identify specific clients causing the problem or any pattern associated with unsuccessful PUBCOMP messages. - -3. Verify the Quality of Service (QoS) level: Check if the QoS level for PUBCOMP packets is set to 2, as required. If necessary, adjust the settings for the MQTT clients to match the expected QoS level. - -4. Investigate authorization and access control: If the Reason Code is related to authorization (0x87), verify that the MQTT clients involved have the correct permissions to publish and subscribe to the topics in question. Make sure that the VerneMQ Access Control List (ACL) or external authentication mechanisms are correctly configured. - -5. Monitor network connectivity: Unsuccessful PUBCOMP messages could be due to network issues between the MQTT clients and the VerneMQ broker. Monitor and analyze network latency or packet loss between clients and the VerneMQ server to identify any potential issues. - -### Useful resources - -1. [VerneMQ Documentation](https://vernemq.com/docs/) -2. [MQTT v5 Specification](https://docs.oasis-open.org/mqtt/mqtt/v5.0/mqtt-v5.0.html) -3. [Troubleshooting VerneMQ](https://vernemq.com/docs/guide/introduction/troubleshooting/) -4. [VerneMQ ACL Configuration](https://vernemq.com/docs/configuration/acl.html)
\ No newline at end of file diff --git a/health/guides/vernemq/vernemq_mqtt_pubcomp_sent_reason_unsuccessful.md b/health/guides/vernemq/vernemq_mqtt_pubcomp_sent_reason_unsuccessful.md deleted file mode 100644 index cc71b739..00000000 --- a/health/guides/vernemq/vernemq_mqtt_pubcomp_sent_reason_unsuccessful.md +++ /dev/null @@ -1,35 +0,0 @@ -### Understand the alert - -This alert indicates that the number of unsuccessful v5 PUBCOMP (Publish Complete) packets sent within the last minute has increased. VerneMQ is an MQTT broker, which plays a crucial role in managing and processing the message flow between MQTT clients. If you receive this alert, it implies that there are issues in the message flow, which might affect the communication between MQTT clients and the broker. - -### What does PUBCOMP mean? - -In MQTT protocol, PUBCOMP is the fourth and final packet in the Quality of Service (QoS) 2 protocol exchange. The flow consists of PUBLISH, PUBREC (Publish Received), PUBREL (Publish Release), and PUBCOMP packets. PUBCOMP is sent by the receiver (MQTT client or broker) to confirm that it has received and processed the PUBREL packet. Unsuccessful PUBCOMP packets indicate that the receiver was not able to process the message properly. - -### Troubleshoot the alert - -- Check VerneMQ logs for errors or warnings - - VerneMQ logs can provide valuable information about issues with the message flow. Locate the log file (usually at `/var/log/vernemq/console.log`) and inspect it for any error messages or warnings related to the PUBCOMP packet or its predecessors (PUBLISH, PUBREC, PUBREL) in the QoS 2 flow. - -- Identify problematic MQTT clients - - Analyze the logs to identify the MQTT clients that are frequently involved in unsuccessful PUBCOMP packets exchange. These clients might have connection or configuration issues that lead to unsuccessful PUBCOMP packets. - -- Validate MQTT clients configurations - - Ensure that the MQTT clients involved in unsuccessful PUBCOMP packets have valid configurations and that they are compatible with the broker (VerneMQ). Check parameters such as QoS level, protocol version, authentication, etc. - -- Monitor VerneMQ metrics - - Use Netdata or other monitoring tools to observe VerneMQ metrics and identify unusual patterns in the broker's performance. Increased load on the broker, high memory or CPU usage, slow response times, or network hiccups might contribute to unsuccessful PUBCOMP packets. - -- Ensure proper MQTT payload size - - Unsuccessful PUBCOMP packets can be caused by oversized payload or incorrect Message ID. Verify that the payload size respects the Maximum Transmission Unit (MTU) and that the Message ID follows the MQTT protocol specifications. - -### Useful resources - -1. [VerneMQ - Troubleshooting](https://vernemq.com/docs/troubleshooting/) -2. [MQTT Protocol Specification](https://docs.oasis-open.org/mqtt/mqtt/v5.0/mqtt-v5.0.html) -3. [VerneMQ - Monitoring](https://vernemq.com/docs/monitoring/)
\ No newline at end of file diff --git a/health/guides/vernemq/vernemq_mqtt_pubcomp_unexpected.md b/health/guides/vernemq/vernemq_mqtt_pubcomp_unexpected.md deleted file mode 100644 index ab493217..00000000 --- a/health/guides/vernemq/vernemq_mqtt_pubcomp_unexpected.md +++ /dev/null @@ -1,29 +0,0 @@ -### Understand the alert - -This alert is related to VerneMQ, a high-performance MQTT message broker. It monitors the number of unexpected PUBCOMP (publish complete) packets received in the last minute. If you receive this alert, it means there's an issue with the MQTT message flow between clients and the broker, which might lead to data inconsistencies. - -### What are PUBCOMP packets? - -In MQTT, the PUBCOMP packet is used when QoS (Quality of Service) 2 is applied. It's the fourth and final packet in the four-packet flow to ensure that messages are delivered exactly once. An unexpected PUBCOMP packet means that the client or the broker received a PUBCOMP packet that it didn't expect in the message flow, which can cause issues in processing the message correctly. - -### Troubleshoot the alert - -1. Inspect the VerneMQ logs: Check the VerneMQ logs for any error messages or unusual activity that could indicate a problem with the message flow. By default, VerneMQ logs are located in `/var/log/vernemq/`, but this might be different for your system. - - ``` - sudo tail -f /var/log/vernemq/console.log - sudo tail -f /var/log/vernemq/error.log - ``` - -2. Identify problematic clients: Inspect the MQTT client logs to identify which clients are causing the unexpected PUBCOMP packets. Some MQTT client libraries provide logging features, while others might require debugging or setting a higher log level. - -3. Check QoS settings: Ensure that the clients and the MQTT broker have the same QoS settings to avoid inconsistencies in the four-packet flow. - -4. Monitor the VerneMQ metrics: Use Netdata or other monitoring tools to keep an eye on MQTT message flows and observe any anomalies that require further investigation. - -5. Update client libraries and VerneMQ: Ensure that all MQTT client libraries and the VerneMQ server are up-to-date to avoid any incompatibilities or bugs that could lead to unexpected behavior. - -### Useful resources - -1. [VerneMQ Documentation](https://vernemq.com/documentation/) -2. [MQTT Specification - MQTT Control Packets](https://docs.oasis-open.org/mqtt/mqtt/v5.0/os/mqtt-v5.0-os.html#_Toc3901046) diff --git a/health/guides/vernemq/vernemq_mqtt_publish_auth_errors.md b/health/guides/vernemq/vernemq_mqtt_publish_auth_errors.md deleted file mode 100644 index 46bc7d31..00000000 --- a/health/guides/vernemq/vernemq_mqtt_publish_auth_errors.md +++ /dev/null @@ -1,36 +0,0 @@ -### Understand the alert - -This alert is triggered when the Netdata Agent detects a spike in unauthorized MQTT v3/v5 `PUBLISH` attempts in the last minute on your VerneMQ broker. If you receive this alert, it means that there might be clients attempting to publish messages without the proper authentication, which could indicate a misconfiguration or potential security risk. - -### What are MQTT and VerneMQ? - -MQTT (Message Queuing Telemetry Transport) is a lightweight, publish-subscribe protocol designed for low-bandwidth, high-latency, or unreliable networks. VerneMQ is a high-performance, distributed MQTT broker that supports a wide range of industry standards and can handle millions of clients. - -### Troubleshoot the alert - -1. Verify the clients' credentials - - To check if the clients are using the correct credentials while connecting and publishing to the VerneMQ broker, inspect their log files or debug messages to find authentication-related issues. - -2. Review VerneMQ broker configuration - - Ensure that the VerneMQ configuration allows for proper authentication of clients. Verify that the correct authentication plugins and settings are enabled. The configuration file is usually located at `/etc/vernemq/vernemq.conf`. For more information on VerneMQ config, please refer to [VerneMQ documentation](https://vernemq.com/docs/configuration/index.html). - -3. Analyze VerneMQ logs - - Inspect the VerneMQ logs to identify unauthorized attempts and assess any potential risks. The logs typically reside in the `/var/log/vernemq` directory, and you can tail the logs using the following command: - - ``` - tail -f /var/log/vernemq/console.log - ``` - -4. Configure firewall rules - - If you find unauthorized or suspicious IP addresses attempting to connect to your VerneMQ broker, consider blocking those addresses using firewall rules to prevent unauthorized access. - -### Useful resources - -1. [VerneMQ documentation](https://vernemq.com/docs/index.html) -2. [Getting started with MQTT](https://mqtt.org/getting-started/) -3. [MQTT Security Fundamentals](https://www.hivemq.com/mqtt-security-fundamentals/) -4. [VerneMQ configuration options](https://vernemq.com/docs/configuration/)
\ No newline at end of file diff --git a/health/guides/vernemq/vernemq_mqtt_publish_errors.md b/health/guides/vernemq/vernemq_mqtt_publish_errors.md deleted file mode 100644 index 9b57b1a7..00000000 --- a/health/guides/vernemq/vernemq_mqtt_publish_errors.md +++ /dev/null @@ -1,44 +0,0 @@ -### Understand the alert - -This alert monitors the number of failed v3/v5 PUBLISH operations in the last minute for VerneMQ, an MQTT broker. If you receive this alert, it means that there is an issue with the MQTT message publishing process in your VerneMQ broker. - -### What is MQTT? - -MQTT (Message Queuing Telemetry Transport) is a lightweight messaging protocol designed for constrained devices and low-bandwidth, high latency, or unreliable networks. It is based on the publish-subscribe model, where clients (devices or applications) can subscribe and publish messages to topics. - -### What is VerneMQ? - -VerneMQ is a high-performance, distributed MQTT message broker. It is designed to handle thousands of concurrent clients while providing low latency and high throughput. - -### Troubleshoot the alert - -1. Check the VerneMQ log files for any error messages or warnings related to the MQTT PUBLISH operation failures. The log files are usually located in the `/var/log/vernemq` directory. - - ``` - sudo tail -f /var/log/vernemq/vernemq.log - ``` - -2. Check VerneMQ metrics to identify any bottlenecks in the system's performance. You can do this by using the `vmq-admin` tool, which comes with VerneMQ. Run the following command to get an overview of the broker's performance: - - ``` - sudo vmq-admin metrics show - ``` - - Pay attention to the metrics related to PUBLISH operation failures, such as `mqtt.publish.error_code.*`. - -3. Assess the performance of connected clients. Use the `vmq-admin` tool to list client connections along with details like the client's state and the number of published messages: - - ``` - sudo vmq-admin session show --client_id --is_online --is_authenticated --session_publish_errors - ``` - - Investigate the clients with `session_publish_errors` to find out if there's an issue with specific clients. - -4. Review your MQTT topic configuration, such as the retained flag, QoS levels, and the permissions for publishing to ensure your setup aligns with the intended behavior. - -5. If the issue persists or requires further investigation, consider examining the network conditions, such as latency or connection issues, which might hinder the MQTT PUBLISH operation's efficiency. - -### Useful resources - -1. [VerneMQ documentation](https://vernemq.com/docs/) -2. [An introduction to MQTT](https://www.hivemq.com/mqtt-essentials/) diff --git a/health/guides/vernemq/vernemq_mqtt_pubrec_invalid_error.md b/health/guides/vernemq/vernemq_mqtt_pubrec_invalid_error.md deleted file mode 100644 index 47cd0fef..00000000 --- a/health/guides/vernemq/vernemq_mqtt_pubrec_invalid_error.md +++ /dev/null @@ -1,34 +0,0 @@ -### Understand the alert - -This alert is triggered when the Netdata Agent monitors an unexpected increase in the number of VerneMQ v3 MQTT `PUBREC` packets received during the last minute. VerneMQ is an MQTT broker that is essential for message distribution in IoT applications. MQTT v3 is one of the protocol versions used by the MQTT brokers. - -### What does an invalid PUBREC packet mean? - -`PUBREC` is a control packet in the MQTT protocol that acknowledges receipt of a `PUBLISH` packet. This packet is used during Quality of Service (QoS) level 2 message delivery, ensuring that the message is received exactly once. An invalid `PUBREC` packet means that VerneMQ has received a `PUBREC` packet that contains incorrect, unexpected, or duplicate data. - -### Troubleshoot the alert - -- Check VerneMQ logs - - Investigate the VerneMQ logs to see if there are any error messages or warnings related to the processing of `PUBREC` packets. The logs can be found in `/var/log/vernemq/console.log` or `/usr/local/var/log/vernemq/console.log`. Look for any entries with specific error messages mentioning `PUBREC`. - -- Check MQTT Clients - - Monitor the MQTT clients that are connected to the VerneMQ broker to identify which clients are sending invalid `PUBREC` packets. Check the logs or monitoring systems of those clients to understand the root cause of the problem. They might be experiencing issues or bugs causing them to send incorrect `PUBREC` packets. - -- Check the MQTT topics - - Monitor the MQTT topics with high levels of QoS 2 message delivery and determine if a specific topic is causing the spike in invalid `PUBREC` packets. - -- Upgrade or fix MQTT Clients - - If the issue arises from specific client implementations, consider upgrading the MQTT client libraries, fixing any configuration issues or reporting the bug to the appropriate development teams. - -- Review VerneMQ configuration - - Verify that the VerneMQ broker configuration is set up correctly and that MQTT v3 protocol is enabled. If necessary, adjust the configuration to better handle the volume of QoS 2 messages being processed. - -### Useful resources - -1. [VerneMQ documentation](https://vernemq.com/docs/index.html) -2. [MQTT v3.1.1 specification](http://docs.oasis-open.org/mqtt/mqtt/v3.1.1/os/mqtt-v3.1.1-os.html) diff --git a/health/guides/vernemq/vernemq_mqtt_pubrec_received_reason_unsuccessful.md b/health/guides/vernemq/vernemq_mqtt_pubrec_received_reason_unsuccessful.md deleted file mode 100644 index b01dc9fb..00000000 --- a/health/guides/vernemq/vernemq_mqtt_pubrec_received_reason_unsuccessful.md +++ /dev/null @@ -1,26 +0,0 @@ -### Understand the alert - -This alert indicates that the number of received unsuccessful v5 `PUBREC` packets in the last minute is higher than expected. VerneMQ is an open-source MQTT broker. MQTT is a lightweight messaging protocol for small sensors and mobile devices optimized for high-latency or unreliable networks. `PUBREC` is an MQTT packet that is part of the quality of service 2 (QoS 2) message flow for MQTT publish/subscribe model. An unsuccessful `PUBREC` could mean that there are issues with the MQTT messages being processed by the MQTT broker. - -### What does PUBREC mean? - -`PUBREC` stands for "Publish Received." In MQTT, it is part of the QoS 2 message flow to ensure end-to-end delivery of a message between clients (publishers) and subscribers connected to an MQTT broker. When a client sends a `PUBLISH` message with QoS 2, the broker acknowledges the receipt with a `PUBREC` message. - -### Troubleshoot the alert - -To address this alert and identify the root cause, follow these steps: - -1. **Check the VerneMQ log files**: Inspect the VerneMQ log files to find any issues or errors related to the processing of MQTT messages. Look for messages related to `PUBREC` or QoS 2 issues. The logs are typically located at `/var/log/vernemq/console.log`or `/var/log/vernemq/error.log`. - -2. **Monitor the VerneMQ metrics**: Check VerneMQ metrics using tools like `vmq-admin` to get insights into the broker's performance and message statistics. The command `vmq-admin metrics show` provides various metrics, including the number of received `PUBREC` and the number of unsuccessful `PUBREC` messages. - -3. **Verify the publisher's configuration**: Check the configuration of the MQTT clients (publishers) that are sending the QoS 2 messages to ensure a proper message flow. It's crucial to confirm that the clients are using the correct version of MQTT and adhere to the limitations set by MQTT v5, like the packet size or the maximum topic aliases used. - -4. **Identify unsupported features**: Some MQTT brokers may not support all MQTT v5 features. Verify that the publisher's MQTT library supports MQTT v5 features in use, such as user properties or message expiration interval, and that it is compatible with VerneMQ. - -5. **Analyze network conditions**: Unreliable network conditions or high traffic load may cause unsuccessful MQTT messages. Evaluate the network and identify any issues causing packet loss or latency. Often, improving the network conditions, migrating the broker/server to a stronger network, or adjusting the user's connection settings can help with such issues. - -### Useful resources - -1. [VerneMQ Documentation](https://vernemq.com/docs/) -2. [MQTT v5 Specification](https://docs.oasis-open.org/mqtt/mqtt/v5.0/cs02/mqtt-v5.0-cs02.html) diff --git a/health/guides/vernemq/vernemq_mqtt_pubrec_sent_reason_unsuccessful.md b/health/guides/vernemq/vernemq_mqtt_pubrec_sent_reason_unsuccessful.md deleted file mode 100644 index 9b197649..00000000 --- a/health/guides/vernemq/vernemq_mqtt_pubrec_sent_reason_unsuccessful.md +++ /dev/null @@ -1,30 +0,0 @@ -### Understand the alert - -This alert monitors the number of sent unsuccessful v5 PUBREC packets in the last minute in the VerneMQ MQTT broker. If you receive this alert, it means that there is an issue with successfully acknowledging receipt of PUBLISH packets in the MQTT system. - -### What does PUBREC mean? - -In the MQTT protocol, when a client sends a PUBLISH message with Quality of Service (QoS) level 2, it expects an acknowledgment from the server in the form of a PUBREC (Publish Received) message. This confirms the successful receipt of the PUBLISH message by the server. If a PUBREC message is marked as unsuccessful, it indicates a problem with the message acknowledgment process. - -### Troubleshoot the alert - -1. Check VerneMQ log files for any errors or warnings related to unsuccessful PUBREC messages. VerneMQ logs can be found in `/var/log/vernemq` (by default) or the directory specified in your configuration file. - - ``` - sudo tail -f /var/log/vernemq/console.log - sudo tail -f /var/log/vernemq/error.log - ``` - -2. Verify if any clients are having issues with the MQTT connection, such as intermittent network problems or misconfigured settings. Check the client logs for any issues and take appropriate action. - -3. Review the MQTT QoS settings for the clients in the system. If possible, consider lowering the QoS level to 1 or 0, which uses less resources and bandwidth. QoS level 2 might not be necessary for some use cases. - -4. Inspect the VerneMQ system and environment for resource bottlenecks or other performance issues. Use tools like `top`, `htop`, `vmstat`, or `iotop` to monitor system resources and identify any potential problems. - -5. If the issue persists, consider seeking support from the VerneMQ community or the software vendor for further assistance. - -### Useful resources - -1. [VerneMQ Documentation](https://vernemq.com/documentation.html) -2. [MQTT Essentials – All Core MQTT Concepts explained](https://www.hivemq.com/mqtt-essentials/) -3. [Understanding QoS Levels in MQTT](https://www.hivemq.com/blog/mqtt-essentials-part-6-mqtt-quality-of-service-levels/)
\ No newline at end of file diff --git a/health/guides/vernemq/vernemq_mqtt_pubrel_received_reason_unsuccessful.md b/health/guides/vernemq/vernemq_mqtt_pubrel_received_reason_unsuccessful.md deleted file mode 100644 index 67a54f0c..00000000 --- a/health/guides/vernemq/vernemq_mqtt_pubrel_received_reason_unsuccessful.md +++ /dev/null @@ -1,43 +0,0 @@ -### Understand the alert - -This alert monitors the number of received `unsuccessful v5 PUBREL` packets in the last minute in the VerneMQ MQTT broker. If you receive this alert, it means that there were unsuccessful PUBREL attempts in VerneMQ, which might indicate an issue during the message delivery process. - -### What are MQTT and PUBREL? - -MQTT (Message Queuing Telemetry Transport) is a lightweight, low-code and low-latency messaging protocol that works with a subscription-based system. It utilizes a broker, like VerneMQ, to facilitate communication. - -A `PUBREL` packet is the third one in a QoS-2 (Quality of Service level 2) message flow. QoS-2 is the highest available level in MQTT and strives to provide once-and-only-once message delivery to subscribers. The `PUBREL` packet is sent by the publisher to acknowledge its receipt of a `PUBREC` packet and signal that it is OK to release the message. - -An unsuccessful `PUBREL` packet indicates that the message release process encountered issues and may not have been completed as expected. - -### Troubleshoot the alert - -1. Check the VerneMQ broker logs for any unusual messages: - - ``` - sudo journalctl -u vernemq - ``` - - Look for errors or warnings that might be related to the unsuccessful `PUBREL` packets. - -2. Examine the configuration files of VerneMQ: - - ``` - cat /etc/vernemq/vernemq.conf - ``` - - Check if there are any misconfigurations or unsupported features that could cause issues with QoS-2 message flow. Refer to the [VerneMQ Documentation](https://docs.vernemq.com/configuration/introduction) for correct configurations. - -3. Analyze the clients' logs, which can be publishers or subscribers, for any errors or issues related to MQTT connections and QoS levels. Make sure the clients are using the correct QoS levels and are following the MQTT protocol. - -4. Monitor VerneMQ's RAM, CPU, and file descriptor usage to determine if the broker's performance is degraded. Resolve any performance bottlenecks or resource constraints to prevent further unsuccessful `PUBREL` packets. - -5. For in-depth analysis, enable VerneMQ's debug logs by setting `log.console.level` to `debug` in its configuration file and restarting the service. Be cautious, as this might generate large amounts of log data. - -6. If the issue persists, consider reaching out to the VerneMQ support channels, such as their [GitHub](https://github.com/vernemq/vernemq) repository. - -### Useful resources - -1. [VerneMQ Documentation](https://docs.vernemq.com/) -2. [MQTT Essentials](https://www.hivemq.com/mqtt-essentials/) -3. [Understanding MQTT QoS Levels - Part 1](https://www.hivemq.com/blog/mqtt-essentials-part-6-mqtt-quality-of-service-levels/) diff --git a/health/guides/vernemq/vernemq_mqtt_pubrel_sent_reason_unsuccessful.md b/health/guides/vernemq/vernemq_mqtt_pubrel_sent_reason_unsuccessful.md deleted file mode 100644 index 18e85e12..00000000 --- a/health/guides/vernemq/vernemq_mqtt_pubrel_sent_reason_unsuccessful.md +++ /dev/null @@ -1,49 +0,0 @@ -### Understand the alert - -This alert is related to VerneMQ, a high-performance MQTT broker. It monitors the number of unsuccessful v5 `PUBREL` packets sent in the last minute. If you receive this alert, it means that there was an issue with sending `PUBREL` packets in your VerneMQ instance. - -### What does PUBREL mean? - -`PUBREL` is a type of MQTT control packet that indicates the release of an application message from the server to the client. It is the third message in the QoS 2 (Quality of Service level 2) protocol exchange, where QoS 2 ensures that a message is delivered exactly once. An unsuccessful v5 `PUBREL` packet means that there was an error during the packet processing, and the message wasn't delivered to the client as expected. - -### Troubleshoot the alert - -1. Check the VerneMQ logs: - - VerneMQ logs can give you valuable information about possible errors that might have occurred during the processing of `PUBREL` packets. Look for any error messages or traces related to the `PUBREL` packets in the logs. - - ``` - sudo journalctl -u vernemq -f - ``` - - Alternatively, if you're using a custom log location: - - ``` - tail -f /path/to/custom/log - ``` - -2. Check the MQTT client-side logs: - - Check the logs of the MQTT client that might have caused the unsuccessful `PUBREL` packets. Look for any connection issues, error messages, or traces related to the MQTT protocol exchanges. - -3. Ensure proper configuration for VerneMQ: - - Verify that the VerneMQ configuration settings related to QoS 2 protocol timeouts and retries are correctly set. Check the VerneMQ [documentation](https://docs.vernemq.com/configuration) for guidance on the proper configuration. - - ``` - cat /etc/vernemq/vernemq.conf - ``` - -4. Monitor VerneMQ metrics: - - Use Netdata to monitor VerneMQ metrics to analyze the MQTT server's performance and resource usage. This can help you identify possible issues with the server. - -5. Address network or service issues: - - If the above steps don't resolve the alert, look for possible network or service-related issues that might be causing the unsuccessful `PUBREL` packets. This could require additional investigation based on your specific infrastructure and environment. - -### Useful resources - -1. [VerneMQ - Official Documentation](https://docs.vernemq.com/) -2. [MQTT Essentials: Quality of Service 2 (QoS 2)](https://www.hivemq.com/blog/mqtt-essentials-part-6-mqtt-quality-of-service-levels/) -3. [Netdata - VerneMQ monitoring](https://learn.netdata.cloud/docs/agent/collectors/go.d.plugin/modules/vernemq)
\ No newline at end of file diff --git a/health/guides/vernemq/vernemq_mqtt_subscribe_auth_error.md b/health/guides/vernemq/vernemq_mqtt_subscribe_auth_error.md deleted file mode 100644 index b8011873..00000000 --- a/health/guides/vernemq/vernemq_mqtt_subscribe_auth_error.md +++ /dev/null @@ -1,37 +0,0 @@ -### Understand the alert - -This alert indicates that there have been unauthorized MQTT (Message Queuing Telemetry Transport) v3/v5 SUBSCRIBE attempts in the last minute. This could mean that there are clients trying to subscribe to topics without proper authentication or authorization in your VerneMQ broker. - -### What does unauthorized subscribe mean? - -In the MQTT protocol, clients can subscribe to topics to receive messages published by other clients to the broker. An unauthorized subscribe occurs when a client tries to subscribe to a topic but does not have the required permissions or has not provided valid credentials. - -### Troubleshoot the alert - -1. Check the VerneMQ logs for unauthorized subscribe attempts: - - The first step in troubleshooting this issue is to check the VerneMQ logs to identify the source of the unauthorized attempts. Look for log messages related to authentication or authorization errors in the log files (`/var/log/vernemq/console.log` or `/var/log/vernemq/error.log`). - - Example log message: - ``` - date time [warning] <client_id>@<client_IP> MQTT SUBSCRIBE authorization failure for user "<username>", topic "<topic_name>" - ``` - -2. Verify client authentication and authorization configuration: - - Check the client configurations to ensure they have the correct credentials (username and password) and are authorized to subscribe to the intended topics. Remember that topic permissions are case-sensitive and might have wildcards. Update the client configurations if necessary and restart the MQTT clients. - -3. Review the VerneMQ broker configurations: - - Verify the authentication and authorization plugins or settings in the VerneMQ broker (`/etc/vernemq/vernemq.conf` or `/etc/vernemq/vmq.acl` for access control). Make sure the settings are correctly configured to allow the clients to subscribe to the intended topics. Update the configurations if necessary and restart the VerneMQ broker. - -4. Monitor the unauthorized subscribe attempts using the Netdata dashboard or configuration file: - - Continue monitoring the unauthorized subscribe attempts using the Netdata dashboard or by configuring the alert thresholds in the Netdata configuration file. This will help you track the issue and ensure that the problem has been resolved. - -### Useful resources - -1. [VerneMQ documentation](https://vernemq.com/docs/) -2. [MQTT v3.1.1 specification](https://docs.oasis-open.org/mqtt/mqtt/v3.1.1/os/mqtt-v3.1.1-os.html) -3. [MQTT v5.0 specification](https://docs.oasis-open.org/mqtt/mqtt/v5.0/mqtt-v5.0.html) -4. [Understanding MQTT topic permissions and wildcards](http://www.steves-internet-guide.com/understanding-mqtt-topics/)
\ No newline at end of file diff --git a/health/guides/vernemq/vernemq_mqtt_subscribe_error.md b/health/guides/vernemq/vernemq_mqtt_subscribe_error.md deleted file mode 100644 index f14d18d5..00000000 --- a/health/guides/vernemq/vernemq_mqtt_subscribe_error.md +++ /dev/null @@ -1,58 +0,0 @@ -### Understand the alert - -This alert is related to `VerneMQ`, the open-source, distributed MQTT message broker. If you receive this alert, it means that the number of failed v3/v5 `SUBSCRIBE` operations has increased in the last minute. - -### What do v3 and v5 SUBSCRIBE operations mean? - -MQTT v3 and v5 are different versions of the MQTT protocol, used for the Internet of Things (IoT) devices and their communication. The `SUBSCRIBE` operation allows a client (device) to subscribe to a specific topic and receive messages published under that topic. - -### Troubleshoot the alert - -- Check the VerneMQ logs - -1. Identify the location of the VerneMQ logs. The default location is `/var/log/vernemq`. If you have changed the default location, you can find it in the `vernemq.conf` file by looking for `log.console.file` and `log.error.file`. - - ``` - grep log.console.file /etc/vernemq/vernemq.conf - grep log.error.file /etc/vernemq/vernemq.conf - ``` - -2. Analyze the logs for any errors or issues related to the `SUBSCRIBE` operation: - - ``` - tail -f /path/to/vernemq/logs - ``` - -- Check the system resources - -1. Check the available resources (RAM and CPU) on your system: - - ``` - top - ``` - -2. If you find that the system resources are low, consider adding more resources or stopping unnecessary processes/applications. - -- Check the client-side logs - -1. Most MQTT clients (e.g., Mosquitto, Paho, MQTT.js) provide their logs to help you identify any issues related to the `SUBSCRIBE` operation. - -2. Analyze the client logs for errors in connecting, subscribing, or receiving messages from the MQTT broker. - -- Analyze the topics and subscriptions - -1. Verify if there are any invalid, restricted, or forbidden topics in your MQTT broker. - -2. Check the ACLs (Access Control Lists) and client authentication settings in your VerneMQ `vernemq.conf` file. - - ``` - grep -E '^(allow_anonymous|vmq_acl.acl_file|vmq_passwd.password_file)' /etc/vernemq/vernemq.conf - ``` - -3. Ensure the `ACLs` and authentication configuration are correct and allow the clients to subscribe to the required topics. - -### Useful resources - -1. [VerneMQ Administration](https://vernemq.com/docs/administration/) -2. [VerneMQ Configuration](https://vernemq.com/docs/configuration/) -3. [VerneMQ Logging](https://vernemq.com/docs/guide/internals.html#logging)
\ No newline at end of file diff --git a/health/guides/vernemq/vernemq_mqtt_unsubscribe_error.md b/health/guides/vernemq/vernemq_mqtt_unsubscribe_error.md deleted file mode 100644 index 55feb0a1..00000000 --- a/health/guides/vernemq/vernemq_mqtt_unsubscribe_error.md +++ /dev/null @@ -1,39 +0,0 @@ -### Understand the alert - -This alert monitors the number of failed v3/v5 `UNSUBSCRIBE` operations in VerneMQ in the last minute. If you receive this alert, it means that there is a significant number of failed `UNSUBSCRIBE` operations, which may impact the MQTT messaging on your system. - -### What is VerneMQ? - -VerneMQ is a high-performance, distributed MQTT message broker. It provides scalable and reliable communication for Internet of Things (IoT) systems and applications. - -### What is an MQTT UNSUBSCRIBE operation? - -An `UNSUBSCRIBE` operation in MQTT protocol is a request sent by a client to the server to remove one or more topics from the subscription list. It allows clients to stop receiving messages for particular topics. - -### Troubleshoot the alert - -1. Check VerneMQ logs for any error messages or indications of issues with the `UNSUBSCRIBE` operation: - - ``` - sudo journalctl -u vernemq - ``` - - Alternatively, you may find the logs in `/var/log/vernemq/` directory, if using the default configuration: - - ``` - cat /var/log/vernemq/console.log - cat /var/log/vernemq/error.log - ``` - -2. Review the VerneMQ configuration to ensure it is properly set up. The default configuration file is located at `/etc/vernemq/vernemq.conf`. Make sure that the settings are correct, especially those related to the MQTT protocol version and the supported QoS levels. - -3. Monitor the VerneMQ metrics using the `vmq-admin metrics show` command. This will provide you with an overview of the broker's performance and help you identify any abnormal metrics that could be related to the failed `UNSUBSCRIBE` operations: - - ``` - sudo vmq-admin metrics show - ``` - - Pay attention to the `mqtt.unsubscribe_error` metric, which indicates the number of failed `UNSUBSCRIBE` operations. - -4. Check the MQTT clients that are sending the `UNSUBSCRIBE` requests. It is possible that the client itself is misconfigured or has some faulty logic in its communication with the MQTT broker. Review the client's logs and configuration to identify any issues. - diff --git a/health/guides/vernemq/vernemq_netsplits.md b/health/guides/vernemq/vernemq_netsplits.md deleted file mode 100644 index 15d4d449..00000000 --- a/health/guides/vernemq/vernemq_netsplits.md +++ /dev/null @@ -1,44 +0,0 @@ -### Understand the alert - -This alert indicates that your VerneMQ cluster has experienced a netsplit (split-brain) situation within the last minute. This can lead to inconsistencies in the cluster, and you need to troubleshoot the problem to maintain proper cluster operation. - -### What is a netsplit? - -In distributed systems, a netsplit occurs when a cluster of nodes loses connectivity to one or more nodes due to a network failure, leaving the cluster to operate in a degraded state. In the context of VerneMQ, a netsplit can lead to inconsistencies in the subscription data and retained messages. - -### Troubleshoot the alert - -- Confirm the alert issue - - Review the VerneMQ logs to check for any signs of network partitioning or netsplits. - -- Check connectivity between nodes - - Ensure that the network connectivity between your cluster nodes is restored. You can use tools like `ping` and `traceroute` to verify network connectivity. - -- Inspect node status - - Use the `vmq-admin cluster show` command to inspect the current status of the nodes in the VerneMQ cluster, and check for any disconnected nodes: - - ``` - vmq-admin cluster show - ``` - -- Reestablish connections and heal partitions - - If a node is disconnected, reconnect it using the `vmq-admin cluster join` command: - - ``` - vmq-admin cluster join discovery-node=IP_ADDRESS_OF_ANOTHER_NODE - ``` - - As soon as the partition is healed, and connectivity is reestablished, the VerneMQ nodes will replicate the latest changes made to the subscription data. - -- Ensure node connectivity remains active - - Monitor the cluster and network to maintain consistent connectivity between the nodes. Set up monitoring tools and consider using an auto-healing or auto-scaling framework to help maintain node connectivity. - -### Useful resources - -1. [VerneMQ Clustering Guide: Netsplits](https://docs.vernemq.com/v/master/vernemq-clustering/netsplits) -2. [VerneMQ Documentation](https://docs.vernemq.com/) diff --git a/health/guides/vernemq/vernemq_queue_message_drop.md b/health/guides/vernemq/vernemq_queue_message_drop.md deleted file mode 100644 index 0b97c6b7..00000000 --- a/health/guides/vernemq/vernemq_queue_message_drop.md +++ /dev/null @@ -1,53 +0,0 @@ -### Understand the alert - -This alert monitors the number of dropped messages in VerneMQ due to full message queues within the last minute. If you receive this alert, it means that message queues are full and VerneMQ is dropping messages. This can be a result of slow consumers, slow VerneMQ performance, or fast publishers. - -### Troubleshoot the alert - -1. Check the message queue length and performance metrics of VerneMQ - - Monitor the current message queue length for each topic by using the command: - - ``` - vmq-admin metrics show | grep queue | sort | uniq -c - ``` - - You can also monitor VerneMQ performance metrics like CPU utilization, memory usage, and network I/O by using the `top` command: - - ``` - top - ``` - -2. Identify slow consumers, slow VerneMQ, or fast publishers - - Analyze the message flow and performance data to determine if the issue is caused by slow consumers, slow VerneMQ performance, or fast publishers. - - - Slow Consumers: If you identify slow consumers, consider optimizing their processing capabilities or scaling them to handle more load. - - Slow VerneMQ: If VerneMQ itself is slow, consider optimizing its configuration, increasing resources, or scaling the nodes in the cluster. - - Fast Publishers: If fast publishers are causing the issue, consider rate-limiting them or breaking their input into smaller chunks. - -3. Increase the queue length or adjust max_online_messages - - If increasing the capacity of your infrastructure is not a viable solution, consider increasing the queue length or adjusting the `max_online_messages` value in VerneMQ. This can help mitigate the issue of dropped messages due to full queues. - - Update the VerneMQ configuration file (`vernemq.conf`) to set the desired `max_online_messages` value: - - ``` - max_online_messages=<your_desired_value> - ``` - - Then, restart VerneMQ to apply the changes: - - ``` - sudo service vernemq restart - ``` - -4. Monitor the situation - - Continue to monitor the message queue length and VerneMQ performance metrics after making changes, to ensure that the issue is resolved or mitigated. - -### Useful resources - -1. [VerneMQ Documentation](https://vernemq.com/docs/) -2. [Understanding and Monitoring VerneMQ Metrics](https://docs.vernemq.com/monitoring/introduction) -3. [VerneMQ Configuration Guide](https://docs.vernemq.com/configuration/introduction)
\ No newline at end of file diff --git a/health/guides/vernemq/vernemq_queue_message_expired.md b/health/guides/vernemq/vernemq_queue_message_expired.md deleted file mode 100644 index bd053340..00000000 --- a/health/guides/vernemq/vernemq_queue_message_expired.md +++ /dev/null @@ -1,53 +0,0 @@ -### Understand the alert - -This alert is related to VerneMQ, a scalable and open-source MQTT broker. The `vernemq_queue_message_expired` alert indicates that there is a high number of expired messages that could not be delivered in the last minute. - -### What does message expiration mean? - -In MQTT, messages are kept in queues until they are delivered to their respective subscribers. Sometimes, messages might have a specific lifespan given by the Time to Live (TTL) attribute, and if they are not delivered within this time, they expire. - -Expired messages are removed from the queue and are not delivered to subscribers. This usually means that clients are unable to process the incoming messages fast enough, putting the VerneMQ system under stress. - -### Troubleshoot the alert - -1. **Check VerneMQ status**: Use the `vernemq` command along with the `vmq-admin` tool to monitor the status of your VerneMQ broker: - - ``` - sudo vmq-admin cluster show - ``` - - Analyze the output to make sure that the cluster is up and running without issues. - -2. **Check the message rate and throughput**: You can use the `vmq-admin metrics show` command to display key metrics related to your VerneMQ cluster: - - ``` - sudo vmq-admin metrics show - ``` - - Analyze the output and identify any sudden increase in the message rate or unusual rate of message expiration. - -3. **Identify slow or malfunctioning clients**: VerneMQ provides a command to list all clients connected to the cluster. You can use the following command to identify slow or malfunctioning clients: - - ``` - sudo vmq-admin session show - ``` - - Check the output for clients who have a high amount of queue delay, low queued messages, or are not receiving messages properly. - -4. **Optimize client connections**: Increasing the message TTL or decreasing the message rate can help decrease the number of expired messages. Adjust the client settings accordingly, ensuring they match the application requirements. - -5. **Ensure proper resource allocation**: Check whether the VerneMQ broker has enough resources by monitoring CPU, memory, and disk usage using tools like `top`1, `vmstat`, or `iotop`. - -6. **Check VerneMQ logs**: VerneMQ logs can provide valuable insight into the underlying issue. Check the logs for any relevant error messages or warnings: - - ``` - sudo tail -f /var/log/vernemq/console.log - sudo tail -f /var/log/vernemq/error.log - ``` - -7. **Monitor Netdata charts**: Monitor Netdata's VerneMQ dashboard to gain more insight into the behavior of your MQTT broker over time. Look for spikes in the number of expired messages, slow message delivery, or increasing message queues. - -### Useful resources - -1. [VerneMQ Documentation](https://vernemq.com/docs/) -2. [How to Monitor VerneMQ MQTT broker with Netdata](https://learn.netdata.cloud/guides/monitor/vernemq.html) diff --git a/health/guides/vernemq/vernemq_queue_message_unhandled.md b/health/guides/vernemq/vernemq_queue_message_unhandled.md deleted file mode 100644 index e2b5c503..00000000 --- a/health/guides/vernemq/vernemq_queue_message_unhandled.md +++ /dev/null @@ -1,41 +0,0 @@ -### Understand the alert - -This alert is raised when the number of unhandled messages in the last minute, monitored by the Netdata Agent, is too high. It indicates that many messages were not delivered due to connections with `clean_session=true` in a VerneMQ messaging system. - -### What does clean_session=true mean? - -In MQTT, `clean_session=true` means that the client doesn't want to store any session state on the broker for the duration of its connection. When the session is terminated, all subscriptions and messages are deleted. The broker won't store any messages or send any missed messages once the client reconnects. - -### What are VerneMQ unhandled messages? - -Unhandled messages are messages that cannot be delivered to subscribers due to connection issues, protocol limitations, or session configurations. These messages are often related to clients' settings for `clean_session=true`, which means they don't store any session state on the broker. - -### Troubleshoot the alert - -- Identify clients causing unhandled messages - - One way to find the clients causing unhandled messages is by analyzing the VerneMQ log files. Look for warning or error messages related to undelivered messages or clean sessions. The log files are typically located in `/var/log/vernemq/`. - -- Check clients' clean_session settings - - Review your MQTT clients' configurations to verify if they have `clean_session=true`. Consider changing the setting to `clean_session=false` if you want the broker to store session state and send missed messages upon reconnection. - -- Monitor VerneMQ statistics - - Use the following command to see an overview of the VerneMQ statistics: - - ``` - vmq-admin metrics show - ``` - - Look for metrics related to dropped or unhandled messages, such as `gauge.queue_message_unhandled`. - -- Examine your system resources - - High unhandled message rates can also be a result of insufficient system resources. Check your system resources (CPU, memory, disk usage) and consider upgrading if necessary. - -### Useful resources - -1. [VerneMQ - An MQTT Broker](https://vernemq.com/) -2. [VerneMQ Documentation: Monitoring & Metrics](https://docs.vernemq.com/monitoring/) -3. [Understanding MQTT Clean Sessions, Queuing, Retained Messages and QoS](https://www.hivemq.com/blog/mqtt-essentials-part-7-persistent-session-queuing-messages/)
\ No newline at end of file diff --git a/health/guides/vernemq/vernemq_socket_errors.md b/health/guides/vernemq/vernemq_socket_errors.md deleted file mode 100644 index 0be28eb6..00000000 --- a/health/guides/vernemq/vernemq_socket_errors.md +++ /dev/null @@ -1,33 +0,0 @@ -### Understand the alert - -This alert is related to the VerneMQ MQTT broker, and it triggers when there is a high number of socket errors in the last minute. Socket errors can occur due to various reasons, such as network connectivity issues or resource contention on the system running the VerneMQ broker. - -### What are socket errors? - -Socket errors are issues related to network communication between the VerneMQ broker and its clients. They usually occur when there are problems establishing or maintaining a stable network connection between the server and clients. Examples of socket errors include connection timeouts, connection resets, unreachable hosts, and other network-related problems. - -### Troubleshoot the alert - -1. Check the VerneMQ logs for more information: - - VerneMQ logs can give you a better understanding of the cause of the socket errors. You can find the logs at `/var/log/vernemq/console.log` or `/var/log/vernemq/error.log`. Look for any errors or warning messages that might be related to the socket errors. - -2. Monitor the system's resources: - - Use the `top`, `vmstat`, `iostat`, or `netstat` commands to monitor your system's resource usage, such as CPU, RAM, disk I/O, and network activity. Check if there are any resource bottlenecks or excessive usage that might be causing the socket errors. - -3. Check network connectivity: - - Verify that there are no issues with the network connectivity between the VerneMQ broker and its clients. Use tools such as `ping`, `traceroute`, or `mtr` to check the connectivity and latency of the network. - -4. Make sure the VerneMQ broker is running: - - Ensure that the VerneMQ broker process is running and listening for connections. You can use the `ps` command to check if the `vernemq` process is running, and the `netstat` command to verify that it's listening on the expected ports. - -5. Inspect client configurations and logs: - - It's possible that the root cause of the socket errors is related to the MQTT clients. Check their configurations and logs for any signs of issues or misconfigurations that could be causing socket errors when connecting to the VerneMQ broker. - -### Useful resources - -1. [VerneMQ Documentation](https://vernemq.com/docs/) diff --git a/health/guides/vsphere/vsphere_cpu_usage.md b/health/guides/vsphere/vsphere_cpu_usage.md deleted file mode 100644 index 0278edae..00000000 --- a/health/guides/vsphere/vsphere_cpu_usage.md +++ /dev/null @@ -1,29 +0,0 @@ -### Understand the alert - -The `vsphere_cpu_usage` alert monitors the average CPU utilization of virtual machines in the vSphere platform. The alert is triggered in a warning state when the CPU utilization is between 75-85% and in a critical state when it is between 85-95%. - -### What does high CPU usage mean? - -High CPU usage indicates that the virtual machine's CPU resources are being heavily utilized. This can lead to performance issues, slow response times, and decreased stability. - -### Troubleshoot the alert - -1. Confirm the high CPU usage by logging into the vSphere management console and checking the CPU performance metrics for the affected virtual machine(s). - -2. Identify the cause of high CPU usage: - - - Check the virtual machine's running processes to identify any resource-intensive applications or services. You can use the `top` command on Linux-based virtual machines or Task Manager on Windows-based virtual machines. - - Inspect application logs and system logs for any signs of issues, errors, or crashes that could be contributing to high CPU usage. - - Verify if the virtual machine has adequate CPU resources allocated. If the virtual machine is consistently using a high percentage of its allocated CPU resources, consider increasing the allocated CPU resources. - -3. Remediate the issue: - - - If an application or service is responsible for the high CPU usage, try restarting it or addressing the specific issue causing the problem. - - If the virtual machine is consistently using a high percentage of its allocated CPU resources, consider increasing the allocated CPU resources or optimizing the virtual machine's performance through application and OS tuning. - - Monitor the CPU usage after making changes to ensure that the issue has been resolved. - -### Useful resources - -1. [vSphere Monitoring and Performance Guide](https://docs.vmware.com/en/VMware-vSphere/7.0/com.vmware.vsphere.monitoring.doc/GUID-0C94837C-8CA4-4A4E-9694-FE9828979A77.html) -2. [Identifying and Troubleshooting CPU Performance Issues in VMware](https://kb.vmware.com/s/article/2090599) -3. [Optimizing Performance on Hyper-V and VMware Virtual Machines](https://info.raindanceit.com/blog/optimizing-performance-hyper-v-vmware)
\ No newline at end of file diff --git a/health/guides/vsphere/vsphere_host_mem_usage.md b/health/guides/vsphere/vsphere_host_mem_usage.md deleted file mode 100644 index 458e403a..00000000 --- a/health/guides/vsphere/vsphere_host_mem_usage.md +++ /dev/null @@ -1,33 +0,0 @@ -### Understand the alert - -The `vsphere_host_mem_usage` alert is triggered when the memory utilization of a vSphere host reaches critical levels. This alert is raised to a warning level when the utilization exceeds 90% and becomes critical when it exceeds 98%. High memory utilization can lead to performance issues on the virtual machines running on the host. - -### Troubleshoot the alert - -1. Log in to the vSphere client: - - Access the vSphere client to get an overview of your host's memory utilization and to identify which virtual machines are consuming the most memory. - -2. Identify high memory-consuming virtual machines: - - In the vSphere client, go to the "Hosts and Clusters" view and select the affected host. In the "Virtual Machines" tab, you can now see the memory usage of each virtual machine running on the host. Identify any virtual machines that are consuming a high amount of memory. - -3. Analyze the memory usage in the virtual machines: - - Connect to the high memory-consuming virtual machines and use their respective task managers (e.g., "top" command in Linux or Task Manager in Windows) to identify the applications and processes that are causing the high memory usage. - -4. Take action: - - - If an application or process is consuming an excessive amount of memory and is not required, consider stopping it. - - Alternatively, if the application or process is essential, you may need to allocate more memory to the virtual machine or consider moving the workload to a different host with more available resources. - - Ensure the virtual machine's memory is optimally configured, as over-allocating memory may cause contention. - -5. Monitor the situation: - - Keep an eye on the memory utilization of the host and the virtual machines after making changes. If memory utilization remains high, consider analyzing other virtual machines or adding more memory to the host. - -### Useful resources - -1. [Understanding Memory Utilization in VMware vSphere Host](https://www.altaro.com/vmware/memory-utilization-vmware-esxi/) -2. [vSphere Monitoring and Performance Documentation](https://docs.vmware.com/en/VMware-vSphere/7.0/com.vmware.vsphere.monitoring.doc/GUID-115861E6-810A-43BB-8CDB-EE99CF8F3250.html) -3. [Optimizing Memory Performance in VMware vSphere](https://blogs.vmware.com/performance/2021/04/optimizing-memory-performance-in-vmware-vsphere.html)
\ No newline at end of file diff --git a/health/guides/vsphere/vsphere_inbound_packets_dropped.md b/health/guides/vsphere/vsphere_inbound_packets_dropped.md deleted file mode 100644 index 6c3da656..00000000 --- a/health/guides/vsphere/vsphere_inbound_packets_dropped.md +++ /dev/null @@ -1,27 +0,0 @@ -### Understand the alert - -This alert is triggered when a significant number of inbound dropped packets are detected on the network interface of a Virtual Machine (VM) over the last 10 minutes. It indicates a potential issue with the VM's network connectivity or performance. - -### What does inbound packets dropped mean? - -Inbound dropped packets refer to packets that are received by a network interface but discarded before they are processed by the VM. This can occur for various reasons, such as network congestion, errors in packet content, or insufficient resources to handle the incoming data. - -### Troubleshoot the alert - -1. **Check for network congestion**: High network usage can lead to packet drops when the network is saturated, or bandwidth is insufficient to handle the incoming traffic. Monitor the overall network usage in your environment to identify if this is the cause. - -2. **Inspect network errors**: Errors in packet content, such as checksum errors or framing errors, can result in dropped packets. Examine logs at the hypervisor and VM level for any indication of network errors. - -3. **Check resource usage within the VM**: Inspect CPU, memory, and disk usage within the VM. High resource utilization can lead to degraded network performance and dropped packets. - -4. **Verify VM network configuration**: Ensure that the VM's network configuration, such as its IP address, subnet mask, and default gateway, are correctly set. Misconfigured network settings can cause network issues, including higher rates of dropped packets. - -5. **Check for faulty network hardware**: Damaged or malfunctioning network hardware, such as network interface cards (NICs) or cables, can result in dropped packets. Check the hardware components involved in the VM's network connection and replace any faulty components. - -6. **Evaluate hypervisor performance and configuration**: The performance of the hypervisor hosting the VM can also impact network performance. Ensure the hypervisor has adequate resources and is configured correctly for optimal VM network performance. - -### Useful resources - -1. [vSphere Networking Guide](https://docs.vmware.com/en/VMware-vSphere/7.0/com.vmware.vsphere.networking.doc/GUID-32DA33D2-7B68-471B-AF7F-0AE5456070EC.html) -2. [vSphere Troubleshooting Guide](https://docs.vmware.com/en/VMware-vSphere/7.0/com.vmware.vsphere.troubleshooting.doc/GUID-12989131-47E7-4005-B940-5BA5F5C089CF.html) -3. [VM Network Troubleshooting Best Practices](https://www.vmwareblog.org/troubleshooting-vm-network-performance-part-1/)
\ No newline at end of file diff --git a/health/guides/vsphere/vsphere_inbound_packets_dropped_ratio.md b/health/guides/vsphere/vsphere_inbound_packets_dropped_ratio.md deleted file mode 100644 index 6dccfa79..00000000 --- a/health/guides/vsphere/vsphere_inbound_packets_dropped_ratio.md +++ /dev/null @@ -1,31 +0,0 @@ -### Understand the alert - -This alert, `vsphere_inbound_packets_dropped_ratio`, is triggered when there is a high ratio of dropped inbound packets for the network interface in a vSphere (VMware) environment for a virtual machine. If you receive this alert, it means that the network interface is experiencing packet loss on inbound traffic over the last 10 minutes, which can result in poor network performance and degraded application functionality. - -### What does a high ratio of dropped inbound packets mean? - -A high ratio of dropped inbound packets means that a significant percentage of the incoming network packets are not being processed by the virtual machine. This can be caused by various reasons, such as network congestion, faulty hardware, incorrect network configuration, or overwhelmed virtual machine resources. A high packet loss in a network can significantly degrade its performance and affect the proper functioning of applications relying on the network. - -### Troubleshoot the alert - -1. Verify the packet loss rate - - Monitor the inbound dropped packets ratio using the Netdata dashboard or any other network monitoring tool you have available. Identify trends or patterns in the packet loss and try to correlate them with any specific events or changes in the infrastructure. - -2. Check the network congestion - - Examine your network traffic to determine if network congestion or high network utilization is causing the dropped inbound packets. If congestion is the issue, identify and resolve the bottleneck, such as by increasing bandwidth or optimizing the network configuration. - -3. Assess virtual machine resources - - Review the virtual machine's CPU usage, memory usage, and disk I/O. If the resources seem to be strained, consider allocating more resources or optimizing the virtual machine for better performance. - -4. Inspect the network hardware - - Check the physical network hardware, such as switches, routers, and network interface cards (NICs), for any failures or connectivity issues. Replace any faulty hardware if necessary. - -5. Validate network configuration - - Ensure that the network configuration on the virtual machine and vSphere host is correct and properly optimized for your specific environment. - -6. Monitor the vSphere environment - - Review the vSphere environment and look for any issues with the host, datastore, or other virtual machines that may be contributing to the high ratio of dropped inbound packets. - -7. Consult VMware documentation and support - - If the issue persists, refer to VMware's official documentation and knowledge base articles for further assistance, or contact VMware support for guidance. - diff --git a/health/guides/vsphere/vsphere_inbound_packets_errors.md b/health/guides/vsphere/vsphere_inbound_packets_errors.md deleted file mode 100644 index ef56fd6e..00000000 --- a/health/guides/vsphere/vsphere_inbound_packets_errors.md +++ /dev/null @@ -1,41 +0,0 @@ -### Understand the alert - -The `vsphere_inbound_packets_errors` alert is generated when there are inbound network errors in a VMware vSphere virtual machine. It calculates the number of inbound errors for the network interface in the last 10 minutes. If you receive this alert, it indicates that your virtual machine's network is experiencing errors, which could lead to issues with network performance, reliability, or availability. - -### Causes of network errors - -There are several reasons for network errors, including: - -1. Faulty hardware: physical problems with network adapters, cables, or switch ports. -2. Configuration issues: incorrect network settings or driver issues. -3. Network congestion: heavy traffic leading to packet loss or delays. -4. Corrupted packets: data transmission errors caused by software bugs or electro-magnetic interference. - -### Troubleshoot the alert - -Follow these steps to troubleshoot the `vsphere_inbound_packets_errors` alert: - -1. Log in to the vSphere client and select the affected virtual machine. - -2. Check the VM's network settings: - - Verify that the network adapter is connected. - - Check if the network adapter's driver is up-to-date. - -3. Review network performance: - - Examine the virtual machine's performance charts to identify high network utilization or packet loss. - - Use network monitoring tools, like `ping`, `traceroute`, and `mtr`, to check the network connectivity and latency. - -4. Inspect the physical network: - - Look for damaged cables or disconnected switch ports. - - Ensure that the network equipment, like switches and routers, is operating correctly and is up-to-date. - -5. Analyze system logs: - - Check the virtual machine's logs for any network-related errors or warnings. - - Investigate the vSphere host logs for issues involving network hardware or configurations. - -6. If errors persist, consult VMware support or documentation for further guidance. - -### Useful resources - -1. [vSphere Networking Documentation](https://docs.vmware.com/en/VMware-vSphere/7.0/com.vmware.vsphere.networking.doc/GUID-2B11DBB8-CB3C-4AFF-8885-EFEA0FC562F4.html) -2. [Troubleshooting VMware Network Issues](https://kb.vmware.com/s/article/1004109) diff --git a/health/guides/vsphere/vsphere_inbound_packets_errors_ratio.md b/health/guides/vsphere/vsphere_inbound_packets_errors_ratio.md deleted file mode 100644 index b7d0af21..00000000 --- a/health/guides/vsphere/vsphere_inbound_packets_errors_ratio.md +++ /dev/null @@ -1,33 +0,0 @@ -### Understand the alert - -The `vsphere_inbound_packets_errors_ratio` alert presents the ratio of inbound packet errors for the network interface of a virtual machine (VM) in VMware vSphere. If the ratio is equal to or greater than 2% and there are at least 10k packets within a 10 minute period, the alert switches to the warning state. - -### What are packet errors? - -Packet errors occur when there's an issue with the packet during transmission. Common reasons include: - -1. Transmission errors, where a packet is damaged on its way to its destination. -2. Format errors, where the packet's format doesn't match what the receiving device was expecting. - -Damaged packets can occur due to bad cables, bad ports, broken fiber cables, dirty fiber connectors, or high radio frequency interference. - -### Troubleshoot the alert - -1. Identify the affected virtual machine and its corresponding network interface by checking the alert details. - -2. Inspect the network hardware by checking for any visible damage or loose connections related to the affected network interface. This may include Ethernet cables, fiber cables, and connectors. Replace or repair any damaged components. - -3. Check for radio frequency interference from nearby devices, such as Bluetooth devices or microwaves. If interference is suspected, move or disable the interfering devices, or consider using shielded cables for network connections. - -4. Monitor vSphere network performance and error metrics by using VMware vSphere's monitoring tools or other third-party monitoring software, such as Netdata. This can help pinpoint which network devices, interfaces, or protocols are causing packet errors. - -5. Verify that network devices and virtual machines are configured correctly to ensure optimal network performance. This may include checking Quality of Service (QoS) settings, VLAN configurations, or network resource allocation. - -6. Update VMware vSphere to the latest version, as well as the network drivers and firmware of the physical host, to ensure compatibility and bug fixes are applied. - -7. If the issue persists, consider reaching out to VMware support for further assistance. - -### Useful resources - -1. [Packet Errors, Packet Discards & Packet Loss](https://www.auvik.com/franklyit/blog/packet-errors-packet-discards-packet-loss/) -2. [VMware vSphere Networking Guide](https://docs.vmware.com/en/VMware-vSphere/7.0/com.vmware.vsphere.networking.doc/GUID-6DB73F20-C99A-43D4-9EE0-3277974EF8BF.html)
\ No newline at end of file diff --git a/health/guides/vsphere/vsphere_outbound_packets_dropped.md b/health/guides/vsphere/vsphere_outbound_packets_dropped.md deleted file mode 100644 index 93c508e9..00000000 --- a/health/guides/vsphere/vsphere_outbound_packets_dropped.md +++ /dev/null @@ -1,35 +0,0 @@ -### Understand the alert - -This alert is generated when the number of outbound `packets dropped` on a network interface of a `vSphere Virtual Machine` exceeds a specified threshold in the last 10 minutes. Packet drops are an indication of network congestion or misconfiguration, and can cause degraded performance and application slowdowns. - -### Troubleshoot the alert - -1. Identify the Virtual Machine (VM) and network interface experiencing the issue: - - Use the details in the alert to find the Virtual Machine and network interface that triggered the alert. Note the name and location of the VM and the associated network interface. - -2. Check for network congestion or misconfiguration: - - Possible reasons for dropped packets can include network congestion, faulty network hardware, or VM configuration issues. Common ways to check for these problems are: - - - Check the performance charts in the vSphere Client for the affected VM, specifically the `Network` section, to visualize the network usage, dropped packets, and other relevant metrics. - - - Verify the VM's network adapter settings are correct, such as its speed, duplex settings, and MTU size. - - - Check the VM's host machine and its physical network connections for issues, like overutilization or faulty hardware. - - - Review any network traffic shaping policies on the vSphere side, such as rate-limiters or Quality of Service (QoS) configurations. - - - Examine the VM's guest OS network settings for configuration issues, such as incorrect IP addresses, subnet masks, or gateway settings. - -3. Diagnose application or protocol issues: - - If the network settings and hardware appear to be functioning correctly, the dropped packets could be a result of specific application or protocol issues. Inspect the network traffic to see if it's associated with certain applications. In the VM's guest OS, use tools like `tcpdump`, `wireshark`, or `iftop` to capture network packets and check for problematic patterns, or review application logs for any network issues. - -4. Address the problem and monitor the situation: - - Once you've identified and addressed the underlying cause of the dropped packets, continue monitoring the VM's network performance to verify that the issue has been resolved. If the alert persists or the problem comes back, consider escalating the issue to the network engineering team or VMware support for further assistance. - -### Useful resources - -1. [VMware Knowledge Base - Diagnosing Network Performance Issues](https://kb.vmware.com/s/article/1004089) diff --git a/health/guides/vsphere/vsphere_outbound_packets_dropped_ratio.md b/health/guides/vsphere/vsphere_outbound_packets_dropped_ratio.md deleted file mode 100644 index 8296198f..00000000 --- a/health/guides/vsphere/vsphere_outbound_packets_dropped_ratio.md +++ /dev/null @@ -1,37 +0,0 @@ -### Understand the alert - -This alert calculates the ratio of `outbound dropped packets` for a network interface on a VMware vSphere Virtual Machine over the last 10 minutes. If you receive this alert, it means your Virtual Machine may be experiencing network performance issues due to dropped packets. - -### What does outbound dropped packets mean? - -Outbound dropped packets are network packets that are discarded by a network interface when they are supposed to be transmitted (sent) from the Virtual Machine to the destination. This can be caused by several factors, such as network congestion, insufficient buffer resources, or malfunctioning hardware. - -### What can cause a high ratio of outbound dropped packets? - -There are several possible reasons for a high ratio of outbound dropped packets, including: - -1. Network congestion: High traffic may cause your network interface to drop packets if it cannot process all the outbound packets fast enough. -2. Insufficient buffer resources: The network interface requires buffer memory to store and process outbound packets. If not enough buffer memory is available, packets may be dropped. -3. Malfunctioning hardware: Issues with network hardware, such as the network adapter, could result in dropped packets. - -### Troubleshoot the alert - -- Check for network congestion - 1. Monitor your network traffic using monitoring tools such as `vSphere Client`, `vRealize Network Insight`, or other third-party tools. - 2. Identify whether there is an increase in traffic that could be causing congestion. - 3. Resolve any issues related to the cause of the increased traffic to relieve the congestion. - -- Inspect buffer resources - 1. Use `vSphere Client` to check your Virtual Machine's network interface settings for correct buffer allocation. - 2. Increase buffer allocation if required or tune the buffer settings to ensure better resource usage. - -- Verify network hardware - 1. Check the status of the network adapter using the `vSphere Client` or the VMware vSphere Command-Line Interface (vSphere CLI). Look for any signs of errors or issues. - 2. Verify that the network adapter driver is up-to-date and compatible with your vSphere environment. - 3. Consider troubleshooting or replacing the network adapter if hardware issues are suspected. - -### Useful resources - -1. [vSphere Monitoring and Performance Documentation (VMware Documentation)](https://docs.vmware.com/en/VMware-vSphere/7.0/com.vmware.vsphere.monitoring.doc/GUID-4D4F408E-F28E-4D34-A769-EEE9D9EB02AD.html) -2. [vSphere Administration Guide](https://docs.vmware.com/en/VMware-vSphere/index.html) -3. [vRealize Network Insight](https://www.vmware.com/products/vrealize-network-insight.html)
\ No newline at end of file diff --git a/health/guides/vsphere/vsphere_outbound_packets_errors.md b/health/guides/vsphere/vsphere_outbound_packets_errors.md deleted file mode 100644 index 7f50579d..00000000 --- a/health/guides/vsphere/vsphere_outbound_packets_errors.md +++ /dev/null @@ -1,39 +0,0 @@ -### Understand the alert - -The `vsphere_outbound_packets_errors` alert is triggered when there is a high number of outbound network errors on a virtual machine's network interface in the last 10 minutes. This alert is related to the vSphere environment and indicates a possible issue with the virtual machine's network configuration or the underlying virtual network infrastructure. - -### Troubleshoot the alert - -1. Identify the virtual machine with the issue - - The alert should show you the name or identifier of the virtual machine(s) facing the high number of outbound packet errors. - -2. Check the network interface configuration - - Verify the virtual machine's network interface configuration within vSphere. Please ensure the configuration matches the expected settings and is correctly connected to the right virtual network. - -3. Monitor virtual network infrastructure - - Inspect the virtual switches (vSwitches), port groups, and distributed switches in the vSphere environment. Look for misconfigurations, high packet loss rates, or other issues that may cause these errors. - -4. Check physical network infrastructure - - Investigate if there are any problems with the physical network components, such as NICs (Network Interface Cards), switches, or cables. As issues at the physical layer could also result in network packet errors. - -5. Examine virtual machine logs - - Review the virtual machine's logs for any network-related errors or warnings. This might give you more information about the root cause of the problem. - -6. Update network drivers and tools - - Ensure that the latest version of network drivers and VMware tools are installed on the virtual machine. Outdated or incorrect drivers can result in packet errors. - -7. Contact support - - If you cannot resolve the issue after completing the above steps, contact your vSphere support team for further assistance. - -### Useful resources - -1. [vSphere Networking Guide](https://docs.vmware.com/en/VMware-vSphere/7.0/com.vmware.vsphere.networking.doc/GUID-7CB8DB92-468E-404E-BC56-EC3241BFC2C6.html) -2. [VMware Network Troubleshooting](https://kb.vmware.com/s/article/1004099) -3. [Troubleshooting VMware Network Performance](https://www.vmware.com/content/dam/digitalmarketing/vmware/en/pdf/techpaper/virtual_network_performance-white-paper.pdf)
\ No newline at end of file diff --git a/health/guides/vsphere/vsphere_outbound_packets_errors_ratio.md b/health/guides/vsphere/vsphere_outbound_packets_errors_ratio.md deleted file mode 100644 index 333566ee..00000000 --- a/health/guides/vsphere/vsphere_outbound_packets_errors_ratio.md +++ /dev/null @@ -1,35 +0,0 @@ -### Understand the alert - -This alert is triggered when the ratio of outbound errors for the network interface of a virtual machine in vSphere is greater than 1 over the last 10 minutes. Network outbound errors can include dropped, discarded, or errored packets that couldn't be transmitted by the network interface. - -### What are outbound packet errors? - -Outbound packet errors occur when a network interface is unable to transmit packets due to issues like network congestion, hardware problems, or misconfigurations. A high number of outbound packet errors can indicate problems in the network and affect the performance of the virtual machine, resulting in poor application responsiveness and reduced bandwidth. - -### Troubleshoot the alert - -1. Verify the virtual machine's network configuration. - - Check virtual machine settings in vSphere to ensure the correct network adapters are assigned and configured properly. - - Check the virtual machine's guest operating system network configuration for possible errors or misconfigurations. - -2. Monitor vSphere network performance counters. - - Review the network performance counters in vSphere to identify issues or bottlenecks that might be causing the outbound packet errors. - -3. Check the physical network. - - Verify the physical network connections to the virtual machine, including cabling, switches, and routers. - - Inspect the network hardware to ensure proper functioning and identify faulty hardware. - -4. Evaluate network congestion. - - High network traffic can cause congestion, leading to increased outbound packet errors. Evaluate the network's current usage and identify potential bottlenecks. - -5. Review vSphere network policies. - - Check the network policies applied to the virtual machine, such as rate limiting or other traffic shaping policies, that may be causing the increased rate of outbound packet errors. - -6. Examine applications and services. - - Review the applications and services running on the virtual machine to determine if any of them are generating excessive or abnormal network traffic, resulting in outbound packet errors. - -### Useful resources - -1. [VMware: Troubleshooting Network Performance](https://www.vmware.com/support/ws5/doc/ws_performance_network.html) -2. [vSphere Networking Guide](https://docs.vmware.com/en/VMware-vSphere/7.0/vsphere-esxi-vcenter-server-70-networking-guide.pdf) -3. [VMware: Monitoring Network Performance Using vSphere Web Client](https://kb.vmware.com/s/article/1004099) diff --git a/health/guides/vsphere/vsphere_vm_mem_usage.md b/health/guides/vsphere/vsphere_vm_mem_usage.md deleted file mode 100644 index 0e699214..00000000 --- a/health/guides/vsphere/vsphere_vm_mem_usage.md +++ /dev/null @@ -1,20 +0,0 @@ -### Understand the alert - -This alert is triggered when a virtual machine's memory usage in a vSphere environment is significantly higher than normal, indicating potential performance issues or insufficient memory allocation. - -### Troubleshoot the alert - -1. **Check memory usage**: Monitor the virtual machine's memory usage to identify potential bottlenecks or high memory consumption by applications. - -2. **Inspect applications**: Review applications running on the virtual machine to identify those consuming excessive memory, and determine if it's expected behavior or a memory leak. - -3. **Adjust memory allocation**: If the virtual machine consistently has high memory usage, consider increasing the allocated memory to improve performance. - -4. **Optimize applications**: Identify opportunities to optimize applications running on the virtual machine to reduce memory consumption. - -5. **Monitor performance**: Keep an eye on the virtual machine's performance metrics to ensure that changes in memory usage or allocation do not negatively impact performance. - -### Useful resources - -1. [VMware vSphere Documentation](https://docs.vmware.com/en/VMware-vSphere/index.html) -2. [vSphere Performance Monitoring and Analysis](https://docs.vmware.com/en/VMware-vSphere/7.0/com.vmware.vsphere.vm_admin.doc/GUID-81E25CBB-16D9-416B-AD6F-5A96D7CD0A2D.html) diff --git a/health/guides/web_log/1m_bad_requests.md b/health/guides/web_log/1m_bad_requests.md deleted file mode 100644 index d8702b24..00000000 --- a/health/guides/web_log/1m_bad_requests.md +++ /dev/null @@ -1,21 +0,0 @@ -### Understand the alert - -This alert is triggered when the ratio of client error HTTP requests (4xx class status codes, excluding 401) within the last minute is higher than normal. Client errors indicate that the issue is on the client's side, such as incorrect requests or invalid URLs. - -### Troubleshoot the alert - -1. **Analyze response codes**: Identify the specific HTTP response codes your web server is sending to clients. Use the Netdata dashboard and inspect the `detailed_response_codes` chart for your web server to track the error codes being sent. - -2. **Check server logs**: Review the web server logs (e.g., access.log and error.log) to identify any issues, patterns, or errors causing the increase in client errors. These logs can typically be found under `/var/log/{nginx, apache2}/{access.log, error.log}`. - -3. **Verify application behavior**: Check the behavior of applications running on your web server to ensure they are not generating incorrect URLs or causing issues with client requests. - -4. **Identify broken links**: If there is a high number of 404 errors, use a broken link checker tool to identify and fix any dead links on your website or other websites that redirect to your website. - -5. **Monitor server performance**: Keep an eye on the web server's performance metrics to ensure that changes in client errors do not negatively impact server performance or resource usage. - -### Useful resources - -1. [RFC 2616 - HTTP/1.1 Status Code Definitions](https://datatracker.ietf.org/doc/html/rfc2616#section-10.4) -2. [Mozilla - HTTP Status Codes - Client Error Responses](https://developer.mozilla.org/en-US/docs/Web/HTTP/Status#client_error_responses) -3. [Broken Link Checker Tools](https://www.google.com/search?q=broken+link+checker) diff --git a/health/guides/web_log/1m_internal_errors.md b/health/guides/web_log/1m_internal_errors.md deleted file mode 100644 index 64a1ce08..00000000 --- a/health/guides/web_log/1m_internal_errors.md +++ /dev/null @@ -1,24 +0,0 @@ -### Understand the alert - -This alert indicates that there has been an increase in the number of HTTP 5XX server errors in the last minute. These errors typically indicate a problem with the server's ability to process requests, such as misconfigurations, overloaded resources, or other server-side issues. - -### Troubleshoot the alert - -1. **Inspect server logs**: Check the server error logs for any error messages, warnings, or unusual patterns. For Apache and Nginx, the error logs are usually found under `/var/log/{apache2, nginx}/error.log`. Analyze the logs to identify potential issues with the server, such as misconfigurations or resource limitations. - -2. **Check .htaccess file**: If you're using Apache, examine the `.htaccess` file for any misconfigurations or incorrect settings. Ensure that the directives in the file are valid and properly formatted. If necessary, temporarily disable the `.htaccess` file to see if it resolves the issue. - -3. **Review server resources**: Monitor the server's CPU, RAM, and disk usage to determine if the server is experiencing resource limitations. High resource usage can lead to server errors, as the server may be unable to handle incoming requests. Consider upgrading your server resources or optimizing the server for better performance. - -4. **Examine server software**: Check for any issues with the server software, such as outdated versions, security vulnerabilities, or software bugs. Update your server software to the latest version and apply any necessary patches to resolve potential issues. - -5. **Monitor third-party services**: If your server relies on third-party services or APIs, verify that these services are functioning correctly. Server errors may occur if your server is unable to communicate with these services or if they are experiencing downtime. - -6. **Test server functionality**: Use tools such as `curl` or web browser developer tools to send HTTP requests to your server and examine the responses. This can help you identify specific issues with the server, such as incorrect response headers or missing resources. - -### Useful resources - -1. [Apache HTTP Server Documentation](https://httpd.apache.org/docs/) -2. [Nginx Documentation](https://nginx.org/en/docs/) -3. [Mozilla Developer Network - HTTP Status Codes](https://developer.mozilla.org/en-US/docs/Web/HTTP/Status) - diff --git a/health/guides/web_log/1m_successful.md b/health/guides/web_log/1m_successful.md deleted file mode 100644 index abe79008..00000000 --- a/health/guides/web_log/1m_successful.md +++ /dev/null @@ -1,23 +0,0 @@ -### Understand the alert - -This alert is triggered when the percentage of successful HTTP requests (1xx, 2xx, 304, 401 response codes) within the last minute falls below a certain threshold. A warning state occurs when the success rate is below 85%, and a critical state occurs when it falls below 75%. This alert can indicate a malfunction in your web server's services, malicious activity towards your website, or broken links. - -### Troubleshoot the alert - -1. **Analyze response codes**: Identify the specific HTTP response codes your web server is sending to clients. Use the Netdata dashboard and inspect the `detailed_response_codes` chart for your web server to track the error codes being sent. - -2. **Check server logs**: Review the web server logs to identify any issues, patterns, or errors causing the decrease in successful requests. Investigate any unusual or unexpected response codes. - -3. **Inspect application logs**: Check the logs of applications running on your web server for any errors or issues that might be affecting the success rate of HTTP requests. - -4. **Verify server resources**: Ensure your server has adequate resources (CPU, RAM, disk space) to handle the workload, as resource limitations can impact the success rate of HTTP requests. - -5. **Review server configuration**: Check your web server's configuration for any misconfigurations, incorrect permissions, or improper settings that may be causing the issue. - -6. **Monitor security**: Look for signs of malicious activity, such as a high number of requests from a specific IP address or a sudden spike in requests. Implement security measures, such as rate limiting, IP blocking, or Web Application Firewalls (WAF), if necessary. - -### Useful resources - -1. [HTTP status codes on Mozilla](https://developer.mozilla.org/en-US/docs/Web/HTTP/Status) -2. [Apache HTTP Server Documentation](https://httpd.apache.org/docs/) -3. [Nginx Documentation](https://nginx.org/en/docs/) diff --git a/health/guides/web_log/web_log_10m_response_time.md b/health/guides/web_log/web_log_10m_response_time.md deleted file mode 100644 index 603482a9..00000000 --- a/health/guides/web_log/web_log_10m_response_time.md +++ /dev/null @@ -1,42 +0,0 @@ -### Understand the alert - -This alert calculates the average `HTTP response time` of your web server over the last 10 minutes. If you receive this alert, it means that the `latency` of your web server has increased, and might be affecting the user experience. - -### What does HTTP response time mean? - -`HTTP response time` is a measure of the time it takes for your web server to process a request and deliver the corresponding response to the client. A high response time can lead to slow loading pages, indicating that your server is struggling to handle the requests or there are issues with the network. - -### Troubleshoot the alert - -1. **Check the server load**: A high server load can cause increased latency. Check the server load using tools like `top`, `htop`, or `glances`. If server load is high, consider optimizing your server, offloading some services to a separate server, or scaling up your infrastructure. - - ``` - top - ``` - -2. **Analyze the web server logs**: Look for patterns or specific requests that may be causing the increased latency. This can be achieved by parsing logs and correlating the response time with requests. For example, for Apache logs: - - ``` - sudo cat /var/log/apache2/access.log | awk '{print $NF " " $0}' | sort -nr | head -n 10 - ``` - - For Nginx logs: - - ``` - sudo cat /var/log/nginx/access.log | awk '{print $NF " " $0}' | sort -nr | head -n 10 - ``` - -3. **Network issues**: Check if there are any issues with the network connecting your server to the clients, such as high latency, packet loss or a high number of dropped packets. You can use the `traceroute` command to diagnose any network-related issues. - - ``` - traceroute example.com - ``` - -4. **Review your server's configuration**: Check your web server's configuration for any issues, misconfigurations, or suboptimal settings that may be causing the high response time. - -5. **Monitoring and profiling**: Use application monitoring tools like New Relic, AppDynamics, or Dynatrace to get detailed insights about the response time and locate any bottlenecks or problematic requests. - -### Useful resources - -1. [How to Optimize Nginx Performance](https://calomel.org/nginx.html) -2. [Apache Performance Tuning](https://httpd.apache.org/docs/2.4/misc/perf-tuning.html) diff --git a/health/guides/web_log/web_log_1m_bad_requests.md b/health/guides/web_log/web_log_1m_bad_requests.md deleted file mode 100644 index a296c90e..00000000 --- a/health/guides/web_log/web_log_1m_bad_requests.md +++ /dev/null @@ -1,27 +0,0 @@ -### Understand the alert - -HTTP response status codes indicate whether a specific HTTP request has been successfully completed or not. - -The 4xx class of status code is intended for cases in which the client seems to have erred. Except when responding to a HEAD request, the server should include an entity containing an explanation of -the error situation, and whether it is a temporary or permanent condition. These status codes are applicable to any request method. - -The Netdata Agent calculates the ratio of client error HTTP requests over the last minute. This metric does not include the 401 errors. - - -### Troubleshoot the alert - -To identify the HTTP response code your web server sends back: - -1. Open the Netdata dashboard. -2. Inspect the `detailed_response_codes` chart for your web server. This chart keeps track of exactly what error codes your web server sends out. - -You should also check server logs for more details about how the server is handling the requests. For example, web servers such as Apache or Nginx produce two files called access.log and error.log (by default under `/var/log/{nginx, apache2}/{access.log, error.log}`) - -3. Troubleshoot 404 codes on the server side - -The 404 requests indicate outdated links on your website or in other websites that redirect to your website. To check for dead links on your on website, use a `broken link checker` software periodically. - -### Useful resources - -1. [https://datatracker.ietf.org/doc/html/rfc2616#section-10.4](https://datatracker.ietf.org/doc/html/rfc2616#section-10.4) -2. [https://developer.mozilla.org/en-US/docs/Web/HTTP/Status#client_error_responses](https://developer.mozilla.org/en-US/docs/Web/HTTP/Status#client_error_responses)
\ No newline at end of file diff --git a/health/guides/web_log/web_log_1m_internal_errors.md b/health/guides/web_log/web_log_1m_internal_errors.md deleted file mode 100644 index 6eff7c68..00000000 --- a/health/guides/web_log/web_log_1m_internal_errors.md +++ /dev/null @@ -1,31 +0,0 @@ -### Understand the alert - -This alert is generated by the Netdata Agent when monitoring web server logs. This alert is triggered when the web server has experienced an unusually high number of internal errors (HTTP status codes 5xx) within the last minute. Internal errors indicate that there is an issue with the server or the application running on it, which is causing the server to fail in processing client requests. - -### Troubleshoot the alert - -1. **Check the web server logs**: Inspect the web server logs to identify the specific internal errors and any patterns that might be causing the issue. Depending on the web server you are using (e.g., Apache, Nginx, etc.), the log files will be located in different directories. You can usually find the logs in the following locations: - - - Apache: `/var/log/apache2/` (Debian/Ubuntu) or `/var/log/httpd/` (RHEL/CentOS) - - Nginx: `/var/log/nginx/` - - To view the logs in real-time, you can use the `tail` command: - - ``` - tail -f /path/to/your/log/directory/access.log - ``` - -2. **Analyze the application logs**: If you have an application running on the web server (e.g., PHP, Node.js, Python), check the application logs for any errors or issues that might be causing the internal errors. - -3. **Verify server resources**: Ensure that your server has enough resources (CPU, RAM, disk space) to handle the current workload. High resource utilization can lead to internal errors. You can use Netdata's dashboard to monitor the server resources in real-time. - -4. **Check server configuration**: Review the web server's configuration files for any misconfigurations or settings that may be causing the issue. For example, incorrect permissions, wrong file paths, or improper configurations can lead to internal errors. - -5. **Inspect application code**: Review your application code to identify any bugs, memory leaks, or issues that could be causing the internal errors. If you recently deployed new code or made changes, consider rolling back to a previous version to see if the issue persists. - -6. **Monitor web server metrics**: Keep an eye on the web server's metrics, such as response times and request rates, to identify any performance bottlenecks or potential issues that may be causing the internal errors. - -### Useful resources - -1. [Server errors on Datatracker](https://datatracker.ietf.org/doc/html/rfc2616#section-10.5) -2. [HTTP server errors on Mozilla](https://developer.mozilla.org/en-US/docs/Web/HTTP/Status#server_error_responses) diff --git a/health/guides/web_log/web_log_1m_redirects.md b/health/guides/web_log/web_log_1m_redirects.md deleted file mode 100644 index 663f04f5..00000000 --- a/health/guides/web_log/web_log_1m_redirects.md +++ /dev/null @@ -1,22 +0,0 @@ -### Understand the alert - -HTTP response status codes indicate whether a specific HTTP request has been successfully completed or not. - -The 3XX class of status code indicates that further action needs to be taken by the user agent in order to fulfill the request. The action required may be carried out by the user agent without interaction with the user if and only if the method used in the second request is GET or HEAD. A client SHOULD detect infinite redirection loops, since such loops generate network traffic for each redirection. - -The Netdata Agent calculates the ratio of redirection HTTP requests over the last minute. This metric does not include the "304 Not modified" message. - -### Troubleshoot the alert - -You can identify exactly what HTTP response code your web server send back to your clients, by opening the Netdata dashboard and inspecting the `detailed_response_codes` chart for your web server. This chart keeps -track of exactly what error codes your web server sends out. - -You should also check the server error logs. For example, web servers such as Apache or Nginx produce and error logs, by default under `/var/log/{nginx, apache2}/{access.log, error.log}` - -### Useful resources - -1. [3XX codes in the HTTP protocol](https://datatracker.ietf.org/doc/html/rfc2616#section-10.3) - -2. [HTTP redirection messages on Mozilla](https://developer.mozilla.org/en-US/docs/Web/HTTP/Status#redirection_messages) - - diff --git a/health/guides/web_log/web_log_1m_requests.md b/health/guides/web_log/web_log_1m_requests.md deleted file mode 100644 index 230aa8c8..00000000 --- a/health/guides/web_log/web_log_1m_requests.md +++ /dev/null @@ -1,31 +0,0 @@ -### Understand the alert - -This alert monitors the number of HTTP requests received by your web server in the last minute. If you receive this alert, it means that there is an increase in the workload on your web server. - -### What does the number of HTTP requests mean? - -HTTP requests are messages sent by clients (like web browsers) to the server to request various resources, such as web pages, images, scripts, and more. An increase in the number of HTTP requests means that there are more clients accessing your web server, which can result in increased resource usage, decreased response times, or potential overloading. - -### Troubleshoot the alert - -1. Determine if the increase in requests is legitimate or malicious: - - - Review traffic logs to see if the increase in requests is coming from legitimate users or search engine bots, or if it is potentially malicious traffic resulting from bots, crawlers, or DDoS attacks. - -2. Analyze server logs for anomalies or abnormal request patterns: - - - Look for sudden spikes, repeating requests, or any other suspicious patterns in the server logs. You may use tools like `grep`, `awk`, or web server-specific log analyzers to help with this. - -3. Check server resources and response times: - - - Monitor your server's CPU, memory, and disk usage to see if the increased requests are causing resource strains or degradations in server performance. - - Use tools like `top`, `htop`, `vmstat`, or monitoring applications for your specific web server software (e.g., `apachetop` for Apache) to help identify the source of the problem. - -4. Optimize web server performance: - - - If you find that the increase in requests is legitimate, consider optimizing the web server by enabling caching, improving database query performance, or upgrading hardware and server resources to handle the increased demand. - -5. Implement security measures: - - - If you have determined that the increase in requests is coming from malicious sources, consider implementing security measures such as rate-limiting, IP blocking, or configuring a Web Application Firewall (WAF). - diff --git a/health/guides/web_log/web_log_1m_successful.md b/health/guides/web_log/web_log_1m_successful.md deleted file mode 100644 index b9751538..00000000 --- a/health/guides/web_log/web_log_1m_successful.md +++ /dev/null @@ -1,23 +0,0 @@ -### Understand the alert - -HTTP response status codes indicate whether a specific HTTP request has been successfully completed or not. - -The Netdata Agent calculates the ratio of successful HTTP requests over the last minute. These requests consist of 1xx, 2xx, 304, 401 response codes. You receive this alert in warning when the percentage of successful requests is less than 85% and in critical when it is below 75%. This alert can indicate: - -- A malfunction in the services of your web server -- Malicious activity towards your website -- Broken links towards your servers. - -In most cases, Netdata will send you another alert indicating high incidences of "abnormal" HTTP requests code, for example you could also receive the `web_log_1m_bad_requests` alert. - -### Troubleshoot the alert - -There are a number of reasons triggering this alert. All of them could eventually cause bad user experience with your web services. - -Identify exactly what HTTP response code your web server sent back to your clients. - -Open the Netdata dashboard and inspect the `detailed_response_codes` chart for your web server. This chart keeps track of exactly what error codes your web server sends out. - -### Useful resources - -1. [HTTP status codes on Mozilla](https://developer.mozilla.org/en-US/docs/Web/HTTP/Status)
\ No newline at end of file diff --git a/health/guides/web_log/web_log_1m_total_requests.md b/health/guides/web_log/web_log_1m_total_requests.md deleted file mode 100644 index c867cfbf..00000000 --- a/health/guides/web_log/web_log_1m_total_requests.md +++ /dev/null @@ -1,36 +0,0 @@ -### Understand the alert - -This alert calculates the total number of HTTP requests received by the web server in the last minute. If you receive this alert, it means that your web server is experiencing an increase in workload, which might affect its performance or availability. - -### What does an increase in workload mean? - -An increase in workload means that your web server is handling more traffic than usual, or there might be an unexpected spike in the number of HTTP requests received. This might be because of a variety of reasons, like marketing campaigns, product promotions, or even a sudden surge in user demand. - -### Troubleshoot the alert - -1. Analyze web traffic logs - - To understand the reason behind the increased workload, the first step is to analyze the web server traffic logs. Look for any patterns, specific time intervals, or specific user agents that are contributing to the high number of requests. - -2. Check the web server performance - - Monitoring web server performance metrics like CPU usage, memory usage, and disk space can provide insight into the resource utilization. Use tools like `top`, `vmstat`, `iostat`, and `free` for this assessment. - -3. Monitor response times - - Checking the response time statistics, like average response time and peak response time, can help to understand if the server is struggling to serve the high number of requests. Tools like `apachetop` or `logstash` can be used to track this information. - -4. Evaluate server scaling options - - If none of the previous steps help to identify or resolve the issue, it might be time to consider scaling options. If the server is unable to handle the increased workload, vertically or horizontally scaling the system can help. - -5. Investigate application-level issues - - Application-level issues might also be the reason for high web server traffic. Profiling the web application, checking for slow database queries, or inefficient scripts can help to identify and resolve performance issues. - -### Useful resources - -1. [Analyzing Web server logs with ApacheTop](https://www.howtoforge.com/how-to-analyze-apache-web-server-logs-apachetop) -2. [Logstash Guide: Analyzing Logs](https://www.elastic.co/guide/en/logstash/current/logstash-intro.html) -3. [Web Application Performance Monitoring with New Relic](https://newrelic.com/platform/web-application-monitoring) -4. [Vertically or Horizontally Scaling Your Web Server](https://www.digitalocean.com/community/tutorials/5-common-server-setups-for-your-web-application)
\ No newline at end of file diff --git a/health/guides/web_log/web_log_1m_unmatched.md b/health/guides/web_log/web_log_1m_unmatched.md deleted file mode 100644 index 93331649..00000000 --- a/health/guides/web_log/web_log_1m_unmatched.md +++ /dev/null @@ -1,25 +0,0 @@ -### Understand the alert - -In a webserver, all activity should be monitored. By default, most of the webservers log activity in an `access.log` file. The access log is a list of all requests for individual files that people or bots have requested from a website. Log File strings include notes about their requests for the HTML files and their embedded graphic images, along with any other associated files that are transmitted. - -The Netdata Agent calculates the percentage of unparsed log lines over the last minute. These are entries in the log file that didn't match in any of the common pattern operations (1XX, 2XX, etc) of the webserver. This can indicate an abnormal activity on your web server, or that your server is performing operations that you cannot monitor with the Agent. - -Web servers like NGINX and Apache2 give you the ability to modify the log patterns for each request. If you have done that, you also need to adjust the Netdata Agent to parse those patterns. - -### Troubleshoot the alert - -- Create a custom log format job - -You must create a new job in the `web_log` collector for your Agent. - -1. See how you can [configure this collector](https://learn.netdata.cloud/docs/agent/collectors/python.d.plugin/web_log#configuration) - -2. Follow the job template specified in the [default web_log.conf file](https://github.com/netdata/netdata/blob/master/collectors/python.d.plugin/web_log/web_log.conf#L53-L86), focus on the lines [83:85](https://github.com/netdata/netdata/blob/e6d9fbc4a53f1d35363e9b342231bb11627bafbd/collectors/python.d.plugin/web_log/web_log.conf#L83-L85) where you can see how you define a `custom_log_format`. - -3. Restart the Netdata Agent - ``` - systemctl restart netdata - ``` - - - diff --git a/health/guides/web_log/web_log_5m_requests_ratio.md b/health/guides/web_log/web_log_5m_requests_ratio.md deleted file mode 100644 index e2cf46f1..00000000 --- a/health/guides/web_log/web_log_5m_requests_ratio.md +++ /dev/null @@ -1,34 +0,0 @@ -### Understand the alert - -The `web_log_5m_requests_ratio` alert indicates that there is a significant increase in the number of successful HTTP requests to your web server in the last 5 minutes compared to the previous 5 minutes. This alert is important for monitoring sudden traffic surges, which can potentially overload your server. - -### Troubleshoot the alert - -1. Check the source of the increased traffic - Use web server logs to determine the source of the increased traffic. Identify if the requests are coming from a specific IP address, group of IP addresses, or even bots. - - For example, for Nginx, you can check the log files at `/var/log/nginx/access.log`. For Apache, the logs can be found at `/var/log/apache2/access.log`. - -2. Analyze the requests - Look at the type of requests (GET, POST, etc.) and the requested resources (URLs). This analysis can help you understand if the increase in traffic is legitimate or if it's due to an issue like a DDoS attack or a web crawler. - -3. Monitor server performance - Use monitoring tools like `top`, `iotop`, or Netdata itself to check your server's performance metrics. Keep an eye on CPU, RAM, and disk usage to ensure that the server is not getting overloaded. - -4. Optimize server resources and configuration - If you find that the traffic increase is legitimate and your server is struggling to handle the load, consider optimizing your server resources and configuration. Techniques include: - - - Increasing server resources (CPU, RAM, disk) - - Using a caching mechanism - - Load balancing and scaling out your infrastructure - - User connection rate limiting and request throttling - -5. Mitigate potential attacks - If the analysis reveals that the increase in traffic is due to a DDoS attack, implement mitigation strategies like firewalls, IP blocking, or using a web application firewall (WAF). Ensure that you have a robust security system in place to protect your server from such attacks. - -### Useful resources - -1. [How to Manage Sudden Traffic Surges and Server Overload](https://www.nginx.com/blog/how-to-manage-sudden-traffic-surges-server-overload/) -2. [Attacks on Network Infrastructure](https://www.cloudflare.com/learning/ddos/ddos-attacks/) -3. [Using Nginx to Rate Limit IP Addresses](https://calomel.org/nginx.html) -4. [Setting up a Super Fast Apache Server with Cache](https://hostadvice.com/how-to/how-to-configure-apache-web-server-cache-on-ubuntu/)
\ No newline at end of file diff --git a/health/guides/web_log/web_log_5m_successful.md b/health/guides/web_log/web_log_5m_successful.md deleted file mode 100644 index 5c5b2c4e..00000000 --- a/health/guides/web_log/web_log_5m_successful.md +++ /dev/null @@ -1,36 +0,0 @@ -### Understand the alert - -This alert monitors the average number of successful HTTP requests per second, over the last 5 minutes (`web_log.type_requests`). If you receive this alert, it means that there has been a significant change in the number of successful HTTP requests to your web server. - -### What does successful HTTP request mean? - -A successful HTTP request is one that receives a response with an HTTP status code in the range of `200-299`. In other words, these requests have been processed correctly by the web server and returned the expected results to the client. - -### Troubleshoot the alert - -1. Check your web server logs - - Inspect your web server logs for any abnormal activity or issues that might have led to increased or decreased successful HTTP requests. Depending on your web server (e.g., Apache, Nginx), the location of the logs will vary. - -2. Analyze the type of requests - - Check the logs for request types (e.g., GET, POST, PUT, DELETE) and their corresponding distribution during the time of the alert. This might help you identify a pattern or source of the issue. - -3. Monitor web server resources - - Use monitoring tools like `top`, `htop`, or `glances` to check the resource usage of your web server during the alert period. High resource usage may indicate that your server is struggling to handle the load, causing an abnormal number of successful HTTP requests. - -4. Verify client connections - - Investigate the IP addresses and user agents that are making a significant number of requests during the alert period. If there's a spike in requests from a single or a few IPs, it could be a sign of a coordinated attack, excessive crawling, or other unexpected behavior. - -5. Check your web application - - Make sure that your web application is functioning well and generating the expected response for clients, which can impact successful HTTP requests. - -### Useful resources - -1. [Apache Log Files](https://httpd.apache.org/docs/current/logs.html) -2. [Nginx Log Files](https://nginx.org/en/docs/ngx_core_module.html#error_log) -3. [Introduction to Identifying Security Vulnerabilities in Web Servers](https://www.acunetix.com/blog/articles/introduction-identifying-security-vulnerabilities-web-servers) -4. [Web Application Performance Analysis and Monitoring](https://www.site24x7.com/learning/web-application-performance.html)
\ No newline at end of file diff --git a/health/guides/web_log/web_log_5m_successful_old.md b/health/guides/web_log/web_log_5m_successful_old.md deleted file mode 100644 index bbee58a4..00000000 --- a/health/guides/web_log/web_log_5m_successful_old.md +++ /dev/null @@ -1,29 +0,0 @@ -### Understand the alert - -This alert, `web_log_5m_successful_old`, calculates the average number of successful HTTP requests per second for the 5 minutes starting 10 minutes ago. If you receive this alert, it means that there might be a significant change in the number of requests your web server is serving. - -### What does the alert mean? - -The alert is useful for understanding the workload on your web server based on historical request data. It helps to ensure that the web server is functioning as expected and can handle the current number of users without negatively impacting their experience. - -### Troubleshoot the alert - -To troubleshoot this alert, follow these steps: - -1. **Check the current number of successful HTTP requests** to compare with the historical data of the alert. You can use Netdata's web dashboard to see the current requests rate in real-time. If the number of requests has increased significantly, it might indicate a potential issue. - -2. **Identify any potential issues or errors on your web server.** Check the server's error logs for any signs of abnormal behavior or error messages. This can help you determine if there are any underlying issues causing the increase in requests. - -3. **Analyze the user traffic** to understand the cause of the increase in successful requests. This could be caused by a sudden spike in website visitors, a DDoS attack, or the introduction of new and popular content on your website. You can use tools like Google Analytics or server access logs to get detailed information about user traffic. - -4. **Review server resources and performance** to ensure the web server has adequate resources to handle the request load. If the number of requests is higher than usual, check the server's CPU usage, memory usage, and network bandwidth to ensure optimal performance. - -5. **Evaluate server configuration** to check for any misconfigurations, outdated software, or resource limitations that may impact the handling of requests. Update or adjust configurations as necessary to improve the web server's performance. - -6. **Monitor and take necessary actions** based on your findings. If the increase in successful requests is a result of legitimate traffic, ensure that your web server can handle the extra load. If the traffic is malicious or the result of an attack, consider implementing security measures like rate-limiting or blocking IPs. - -### Useful resources - -1. [Monitoring Web Server Performance with Netdata](https://www.netdata.cloud/webserver-monitoring/) -2. [How to Analyze Access Logs](https://www.scalyr.com/blog/analyze-access-logs/) -3. [Optimizing Web Server Performance](https://www.keycdn.com/blog/web-server-performance) diff --git a/health/guides/web_log/web_log_web_slow.md b/health/guides/web_log/web_log_web_slow.md deleted file mode 100644 index 7ed3ebe1..00000000 --- a/health/guides/web_log/web_log_web_slow.md +++ /dev/null @@ -1,48 +0,0 @@ -### Understand the alert - -The `web_log_web_slow` alert is triggered when the average HTTP response time of your web server (NGINX, Apache) has increased over the last minute. It indicates that your web server's performance might be affected, resulting in slow response times for client requests. - -### Troubleshoot the alert - -There are several factors that can cause slow web server performance. To troubleshoot the `web_log_web_slow` alert, examine the following areas: - -1. **Monitor web server utilization:** - - Use monitoring tools like `top`, `htop`, or `glances` to check the CPU, memory, and traffic utilization of your web server. If you find high resource usage, consider taking action to address the issue: - - Increase your server's resources (CPU, memory) or move to a more powerful machine. - - Adjust the web server configuration to use more worker processes or threads. - - Implement load balancing across multiple web servers to distribute the traffic load. - -2. **Optimize databases:** - - Slow database performance can directly impact web server response times. Monitor and optimize your database to improve response speeds: - - Check for slow or inefficient queries and optimize them. - - Regularly clean and optimize your database by removing outdated or unnecessary data, and by using tools like `mysqlcheck` or `pg_dump`. - - Enable database caching for faster results on recurring queries. - -3. **Configure caching:** - - Implement browser or server-side caching to reduce the load on your web server and speed up content delivery: - - Enable browser caching using proper cache-control headers in your server configuration. - - Implement server-side caching with tools like Varnish or use full-page caching in your web server (NGINX FastCGI cache, Apache mod_cache). - -4. **Examine web server logs:** - - Analyze your web server logs to identify specific requests or resources that may be causing slow responses. Tools like `goaccess` or `awstats` can help you analyze web server logs and identify issues: - - Check for slow request URIs or resources and optimize them. - - Identify slow third-party services, such as CDNs, external APIs, or database connections, and troubleshoot these connections as needed. - -5. **Optimize web server configuration:** - - Review your web server's configuration settings to ensure optimal performance: - - Ensure that your web server is using the latest stable version for performance improvements and security updates. - - Disable unnecessary modules or features to reduce resource usage. - - Review and optimize settings related to timeouts, buffer sizes, and compression for better performance. - -### Useful resources - -1. [Optimizing NGINX for Performance](https://easyengine.io/tutorials/nginx/performance/) -2. [Apache Performance Tuning](https://httpd.apache.org/docs/2.4/misc/perf-tuning.html) -3. [Top 10 MySQL Performance Tuning Tips](https://www.databasejournal.com/features/mysql/top-10-mysql-performance-tuning-tips.html) -4. [10 Tips for Optimal PostgreSQL Performance](https://www.digitalocean.com/community/tutorials/10-tips-for-optimizing-postgresql-performance-on-a-digitalocean-droplet) -5. [A Beginner's Guide to HTTP Cache Headers](https://www.keycdn.com/blog/http-cache-headers)
\ No newline at end of file diff --git a/health/guides/whoisquery/whoisquery_days_until_expiration.md b/health/guides/whoisquery/whoisquery_days_until_expiration.md deleted file mode 100644 index 7775bd9b..00000000 --- a/health/guides/whoisquery/whoisquery_days_until_expiration.md +++ /dev/null @@ -1,26 +0,0 @@ -### Understand the alert - -This alert indicates that your domain name registration is close to its expiration date. It will trigger a warning when there are less than 90 days remaining and a critical alert when there are less than 30 days remaining. If you do not renew the domain registration, it will be deactivated, and you might lose ownership of the domain. - -### What does domain name expiration mean? - -Domain names are registered for a limited period, usually between 1 and 10 years. When the registration period comes to an end, you need to renew it if you want to continue using the domain. If you fail to renew the domain, it will become inactive, and after a certain period (known as the grace period), it will be available for anyone else to register. This might result in losing access to your website and email services associated with the domain. - -### Troubleshoot the alert - -1. Verify domain expiration date: To verify the current expiration date of your domain, you can conduct a WHOIS search by visiting whois.icann.org. This will provide you with details about your domain, including the registrar information, registration date, and expiration date. - -2. Contact your domain registrar: If you want to renew your domain, contact your domain registrar (or reseller) as soon as possible to discuss the renewal options available to you. You can find the contact information for your domain registrar in the WHOIS search results. - -3. Renew your domain: Once you have contacted your domain registrar, follow their instructions to renew your domain. It's a good idea to renew it for a longer period to avoid the risk of domain expiration in the near future. - -4. Review domain auto-renewal settings: Many registrars offer an auto-renewal option, which can help you avoid domain expiration by automatically renewing the domain before it expires. Make sure to review your account settings and enable auto-renewal if you wish to take advantage of this feature. - -5. Monitor the domain renewal process: After renewing your domain, verify that the updated expiration date is reflected in the WHOIS search results. Keep an eye on this to ensure that the renewal process has been completed successfully. - -### Useful resources - -1. [ICANN WHOIS Search](https://whois.icann.org) -2. [ICANN-Accredited Registrar List](https://www.icann.org/registrar-reports/accredited-list.html) -3. [How to Renew Your Domain Name Registration](https://www.icann.org/resources/pages/renewal-registrant-2016-02-04-en) -4. [What to Do If Your Domain Name Expires](https://www.icann.org/resources/pages/existing-registrant-2016-06-01-en)
\ No newline at end of file diff --git a/health/guides/wifi/wifi_inbound_packets_dropped_ratio.md b/health/guides/wifi/wifi_inbound_packets_dropped_ratio.md deleted file mode 100644 index ce26c1e5..00000000 --- a/health/guides/wifi/wifi_inbound_packets_dropped_ratio.md +++ /dev/null @@ -1,52 +0,0 @@ -### Understand the alert - -This alert calculates the ratio of inbound dropped packets for a specific network interface over the last 10 minutes. If you receive this alert, it means that your WiFi network interface dropped a significant number of packets, which could be due to lack of resources or unsupported protocol. - -### What does "inbound dropped packets" mean? - -In the context of networking, "inbound dropped packets" means that packets were received by the network interface but were not processed. This can happen due to various reasons, including: - -1. Insufficient resources (e.g., CPU, memory) to handle the packet. -2. Unsupported protocol. -3. Network congestion, leading to packets being dropped. -4. Hardware or configuration issues. - -### Troubleshoot the alert - -- Check the system resource utilization - -Using the `top` command, check the resource utilization (CPU, memory, and I/O) in your system. High resource usage might indicate that your system is struggling to process the incoming packets. - -``` -top -``` - -- Inspect network configuration and hardware - -1. Check if there are any hardware issues or misconfigurations in your WiFi adapter or network interface. Refer to your hardware's documentation or manufacturer's support for troubleshooting steps. - -2. Make sure your network device drivers are up-to-date. - -- Monitor network traffic - -Use the `iftop` command to monitor network traffic on your interface. High network traffic can cause congestion, leading to dropped packets. If you don't have it installed, follow the [installation instructions](https://www.tecmint.com/iftop-linux-network-bandwidth-monitoring-tool/). - -``` -sudo iftop -i <interface_name> -``` - -- Investigate network protocols - -Inbound dropped packets may be caused by unsupported network protocols. Use the `tcpdump` command to examine network traffic for any abnormalities or unknown protocols. - -``` -sudo tcpdump -i <interface_name> -``` - -### Useful resources - -1. [Top 20 Netstat Command Examples in Linux](https://www.tecmint.com/20-netstat-commands-for-linux-network-management/) -2. [iftop command in Linux to monitor network traffic](https://www.tecmint.com/iftop-linux-network-bandwidth-monitoring-tool/) -3. [An Overview of Packet Sniffing using Tcpdump](https://www.ubuntupit.com/tcpdump-useful-unix-packet-sniffer-command/) - -Remember to replace `<interface_name>` with the actual name of the WiFi network interface causing the alert.
\ No newline at end of file diff --git a/health/guides/wifi/wifi_outbound_packets_dropped_ratio.md b/health/guides/wifi/wifi_outbound_packets_dropped_ratio.md deleted file mode 100644 index 8441885d..00000000 --- a/health/guides/wifi/wifi_outbound_packets_dropped_ratio.md +++ /dev/null @@ -1,54 +0,0 @@ -### Understand the alert - -The `wifi_outbound_packets_dropped_ratio` alert indicates that a significant number of packets were dropped on the way to transmission over the last 10 minutes. This could be due to a lack of resources or other issues with the network interface. - -### What does dropped packets mean? - -Dropped packets refer to data packets that are discarded by a network interface instead of being transmitted through the network. This can occur for various reasons such as hardware failures, lack of resources (e.g., memory, processing power), or network congestion. - -### Troubleshoot the alert - -1. Check interface statistics - -Use the `ifconfig` command to view information about your network interfaces, including their packet drop rates. Look for the dropped packets count in the TX (transmit) section. - -```bash -ifconfig <interface_name> -``` - -Replace `<interface_name>` with the name of the network interface you are investigating, such as `wlan0` for a wireless interface. - -2. Check system logs - -System logs can provide valuable information about any potential issues. Check the logs for any errors or warnings related to the network interface or driver. - -For example, use `dmesg` command to display kernel messages: - -```bash -dmesg | grep -i "<interface_name>" -``` - -Replace `<interface_name>` with the name of the network interface you are investigating. - -3. Check for hardware issues - -Inspect the network interface for any signs of hardware failure or malfunction. This may include damaged cables, loose connections, or issues with other networking equipment (e.g. switches, routers). - -4. Monitor network congestion - -High packet drop rates can be caused by network congestion. Monitor network usage and performance using tools such as `iftop`, `nload`, or `vnstat`. Identify and address any traffic bottlenecks or excessive usage. - -5. Update network drivers - -Outdated or faulty network drivers may cause packet drop issues. Check for driver updates and install any available updates following the manufacturer's instructions. - -6. Optimize network settings - -You can adjust network settings, like buffers or queues, to mitigate dropped packets. Consult your operating system or network device documentation for specific recommendations on adjusting these settings. - -### Useful resources - -1. [ifconfig command in Linux](https://www.geeksforgeeks.org/ifconfig-command-in-linux-with-examples/) -2. [How to monitor network usage with iftop](https://www.binarytides.com/monitor-network-usage-with-iftop/) -3. [nload – Monitor Network Traffic and Bandwidth Usage in Real Time](https://www.tecmint.com/nload-monitor-linux-network-traffic-bandwidth-usage/) -4. [VNstat – A Network Traffic Monitor](https://www.tecmint.com/vnstat-monitor-network-traffic-in-linux/)
\ No newline at end of file diff --git a/health/guides/windows/windows_10min_cpu_usage.md b/health/guides/windows/windows_10min_cpu_usage.md deleted file mode 100644 index 5b585c71..00000000 --- a/health/guides/windows/windows_10min_cpu_usage.md +++ /dev/null @@ -1,36 +0,0 @@ -### Understand the alert - -This alert calculates the average total `CPU utilization` on a Windows system over the last 10 minutes. If you receive this warning or critical alert, it means that your system is experiencing high CPU usage, which could lead to performance issues. - -### What does CPU utilization mean? - -`CPU utilization` is the percentage of time the CPU spends executing tasks, as opposed to being idle. A high CPU utilization means that the CPU is working on a large number of tasks and may not have enough processing power to handle additional tasks efficiently. This can result in slow response times and overall system performance issues. - -### Troubleshoot the alert - -1. Identify high CPU usage processes: - - Open Task Manager by pressing `Ctrl + Shift + Esc` on your keyboard, or right-click on the Taskbar and select "Task Manager." Click the "Processes" tab, and sort by the "CPU" column to identify the processes consuming the most CPU resources. - -2. Analyze process details: - - Right-click on the process with high CPU usage and select "Properties" or "Go to details" to learn more about the process, its location, and its purpose. - -3. Determine if the process is essential: - - Research the process in question to ensure that it is safe to terminate. Some processes are integral to the system, and terminating them may cause instability or crashes. - -4. Terminate or optimize the problematic process: - - If the process is not essential, you can right-click on it and select "End task" to stop it. If the process is necessary, consider optimizing its performance or updating the software responsible for the process. In some cases, restarting the system may help resolve temporary high CPU usage issues. - -5. Monitor CPU usage after taking action: - - Continue monitoring CPU usage to ensure that the issue has been resolved. If the problem persists, further investigation may be required, such as examining system logs or using performance analysis tools like Windows Performance Monitor. - -### Useful resources - -1. [How to Monitor CPU Usage on Windows](https://www.tomsguide.com/how-to/how-to-monitor-cpu-usage-on-windows) -2. [Windows Task Manager: A Troubleshooting Guide](https://www.howtogeek.com/66622/stupid-geek-tricks-6-ways-to-open-windows-task-manager/) -3. [How to Use the Performance Monitor on Windows](https://www.digitalcitizen.life/how-use-performance-monitor-windows/) -4. [Understanding Process Explorer](https://docs.microsoft.com/en-us/sysinternals/downloads/process-explorer)
\ No newline at end of file diff --git a/health/guides/windows/windows_disk_in_use.md b/health/guides/windows/windows_disk_in_use.md deleted file mode 100644 index 4642b79c..00000000 --- a/health/guides/windows/windows_disk_in_use.md +++ /dev/null @@ -1,34 +0,0 @@ -### Understand the alert - -This alert is triggered when the disk space utilization on a Windows system surpasses the defined thresholds. If you receive this alert, it means your system's disk usage is high, and you might need to free up space. - -### Why is disk space utilization important? - -Disk space utilization is crucial for the stable and efficient operation of your system. As the disk fills up, system processes may slow down or fail due to insufficient storage space. Moreover, new applications and updates may require additional storage, which can cause issues if not enough disk space is available. - -### Troubleshoot the alert - -1. Check disk usage in detail - - To check the disk usage on your Windows system, you can use `Disk Management` tool by searching for it in the Start menu, or by right-clicking on Computer in the File Explorer and selecting "Manage." - -2. Analyze disk usage by folders and files - - Use a disk space analyzer tool like [TreeSize](https://www.jam-software.com/treesize_free) or [WinDirStat](https://windirstat.net/) to find the largest files and folders on your system. These tools will help you identify areas where you can free up space. - -3. Clean up unnecessary files - - - Empty the recycle bin on your Windows system. - - In the File Explorer, right-click on the system drive (usually C:), and select "Properties." Navigate to the "General" tab and click on "Disk Cleanup" to free up space by removing temporary files, system files and other items that can be safely deleted. - - Uninstall unused applications using the Programs and Features setting in the Control Panel. - - Move larger files such as media or documents to an external storage device or cloud storage service. - -4. Monitor disk usage - - Keep an eye on the disk usage to prevent it from surpassing the threshold again in the future. Pay attention to system and software updates that may require additional storage, as well as the growth of log files or temporary files generated by your computer's operation. - -### Useful resources - -1. [Windows 10 Tips & Tricks: Analyze Disk Space & Free Space - YouTube](https://www.youtube.com/watch?v=NolLC9tBP_Y) -2. [5 Free Tools to Visualize Disk Space Usage on Windows](https://www.hongkiat.com/blog/visualize-hard-disk-usage-free-tools-for-windows/) -3. [10 Ways to Free Up Hard Drive Space on Windows](https://www.howtogeek.com/125923/7-ways-to-free-up-hard-disk-space-on-windows/)
\ No newline at end of file diff --git a/health/guides/windows/windows_inbound_packets_discarded.md b/health/guides/windows/windows_inbound_packets_discarded.md deleted file mode 100644 index 829e34ff..00000000 --- a/health/guides/windows/windows_inbound_packets_discarded.md +++ /dev/null @@ -1,39 +0,0 @@ -### Understand the alert - -This alert is triggered when the number of inbound discarded packets for a network interface on a Windows system exceeds the threshold (5 packets) within the last 10 minutes. If you receive this alert, it means that your network interface may have an issue that is causing packets to be discarded. - -### What does inbound discarded packets mean? - -Inbound discarded packets refer to network packets that are received by the network interface but are not processed by the system. Packets may be discarded for various reasons such as network congestion, packet corruption, or reaching the system's capacity limits. - -### Troubleshoot the alert - -1. Identify the problematic network interface - -To find out which network interface is causing the problem, log in to the Windows system and open **Performance Monitor**. Go to the **Windows → Networking → Network Interface** section in the left pane and check the **Packets Received Discarded** counter to identify the offending interface. - -2. Check network interface hardware - -Verify that the network interface is working correctly and hasn't malfunctioned. Inspect the cables and ensure that they are connected properly. If possible, try a different network interface. - -3. Check network congestion and bandwidth usage - -High network congestion and bandwidth usage can cause packets to be discarded. Monitor your network's usage and check for any unusual patterns or excessive bandwidth usage. Consider using a network monitoring tool to gather more in-depth information about your network. - -4. Inspect system logs - -Check system logs for errors or warnings related to the network interface. The Windows Event Viewer can be a valuable resource for identifying issues related to the network interface. - -5. Update network adapter drivers - -Outdated or incompatible drivers can cause network issues, including inbound discarded packets. Ensure that your network adapter drivers are up-to-date and provided by a reliable source. - -6. Investigate packet corruption - -Packet corruption can be caused by faulty hardware, software issues, or even cyber-attacks. Ensure that your system is adequately protected, and investigate any possible software-related issues that may lead to packet corruption. - -### Useful resources - -1. [Windows Performance Monitor](https://docs.microsoft.com/en-us/windows-server/administration/windows-commands/perfmon) -2. [Windows Event Viewer](https://docs.microsoft.com/en-us/windows/win32/eventlog/event-log-reference) -3. [How to troubleshoot networking problems on the Windows platform](https://support.microsoft.com/en-us/help/10267)
\ No newline at end of file diff --git a/health/guides/windows/windows_inbound_packets_errors.md b/health/guides/windows/windows_inbound_packets_errors.md deleted file mode 100644 index aee982d6..00000000 --- a/health/guides/windows/windows_inbound_packets_errors.md +++ /dev/null @@ -1,41 +0,0 @@ -### Understand the alert - -This alert informs you about the number of `inbound errors` on the network interface of your Windows machine within the last 10 minutes. If you receive this alert, it indicates that there might be issues with your network connection or hardware. - -### What are inbound errors? - -Inbound errors refer to problems that occur when packets are coming into the network interface of your machine from external sources. These errors might occur due to various reasons such as packet loss during transmission, hardware problems in the network interface card (NIC), or incorrect network configurations. - -### Troubleshoot the alert - -To troubleshoot this alert, you can perform the following steps: - -1. Check the network connection - - Ensure that the network connection is stable and the cables (if any) are properly connected. If you're using a wireless connection, verify that the signal strength is good and that there are no known Wi-Fi issues in your area. - -2. Verify network configurations - - Go through your network configurations and ensure that they are properly set. Some common issues include incorrect IP addresses, subnet masks or gateways. Open the Network Connections window (press Windows key + R, type `ncpa.cpl` and click OK), then right-click your network adapter, select `Properties`, and recheck your configurations. - -3. Inspect the hardware - - Check if the NIC experiences any physical issues or if it gets overheated. If you suspect a hardware problem, consider replacing the NIC or connecting to a different network interface to isolate the issue. - -4. Monitor the network for any anomalies - - You can use native Windows tools like `Performance Monitor` or `Resource Monitor` to keep an eye on network performance and packet errors. Open the respective tools by searching in the Start Menu. - -5. Review Event Viewer logs - - Look for any network-related errors logged in the `Event Viewer`. Press Windows key + X, select Event Viewer, and navigate to `Windows Logs` > `System`. Filter the logs by choosing the `Network Profile` event source and review the error messages. - -6. Update NIC drivers - - Sometimes, outdated or faulty NIC drivers might cause inbound packet errors. Ensure that you've installed the latest drivers for your NIC. Visit the manufacturer's website to download and install the most recent drivers compatible with your Windows operating system. - -### Useful resources - -1. [How to use Network Monitor in Windows](https://docs.microsoft.com/en-us/windows/client-management/troubleshoot-tcpip-network-monitor) -2. [Network Troubleshooting Guide for Windows](https://techcommunity.microsoft.com/t5/networking-blog/network-troubleshooting-guide-for-windows/ba-p/428114) -3. [How to Troubleshoot Network Connections with Ping and Tracert](https://www.windowscentral.com/how-troubleshoot-network-connection-ping-and-traceroute)
\ No newline at end of file diff --git a/health/guides/windows/windows_outbound_packets_discarded.md b/health/guides/windows/windows_outbound_packets_discarded.md deleted file mode 100644 index 226c3b0b..00000000 --- a/health/guides/windows/windows_outbound_packets_discarded.md +++ /dev/null @@ -1,48 +0,0 @@ -### Understand the alert - -This alert is triggered when the number of outbound discarded packets for a network interface on a Windows system reaches or exceeds 5 in the last 10 minutes. Discarded packets indicate network problems or misconfigurations and can lead to decreased performance, slow connections and communication errors. - -### What are outbound discarded packets? - -Outbound discarded packets are network packets that were not sent successfully from a Windows host to the intended destination. This might be due to various reasons such as buffer overflows, device driver errors, or network congestion. Discarded packets may result in retransmissions, which could cause increased latencies and reduced network throughput. - -### Troubleshoot the alert - -1. Check network performance statistics - -Use the built-in `netstat` command to display network statistics: -``` -netstat -s -``` - -Look for errors or high discard rates, which may indicate network problems. - -2. Monitor network interface performance - -Use the `Performance Monitor` tool in Windows to monitor the network interface for issues. Look for counters related to discarded packets, such as `Packets Outbound Errors`, `Packets Received Errors`, and `Packets Sent/sec`. - -3. Identify if there are specific applications with high discard rates - -Use the `Resource Monitor` tool in Windows to check which applications are consuming the most network resources and identify if any specific application is causing high discard rates. - -4. Check for errors, warnings, or unusual events in the Windows Event Viewer - -Open the `Event Viewer` in Windows and browse through the System and Application logs for any network-related events. Look for errors or warnings that could be related to network configurations, device driver problems, or application-specific issues. - -5. Update or reinstall network drivers - -Outdated or corrupt network drivers can cause discarded packets. Ensure your network drivers are up to date and, if necessary, reinstall the drivers. - -6. Check network components and configurations - -Inspect network cables, switches, and routers for any physical damage or malfunction. Check the network settings on the Windows host to ensure they are correctly configured, including DNS, gateway, and subnet mask. - -7. Network congestion - -If your network is congested, it can cause an increase in discarded packets. Consider upgrading network equipment or implementing quality of service (QoS) policies to prioritize and manage network traffic more effectively. - -### Useful resources - -1. [Using Performance Monitor to monitor network performance](https://techcommunity.microsoft.com/t5/ask-the-performance-team/using-perfmon-to-monitor-your-servers-network-performance/ba-p/373944) -2. [Monitoring Network Performance with Resource Monitor](https://www.online-tech-tips.com/computer-tips/monitoring-network-performance-with-resource-monitor/) -3. [Event Viewer in Windows](https://www.dummies.com/computers/operating-systems/windows-10/how-to-use-event-viewer-in-windows-10/)
\ No newline at end of file diff --git a/health/guides/windows/windows_outbound_packets_errors.md b/health/guides/windows/windows_outbound_packets_errors.md deleted file mode 100644 index 2ccb8ef1..00000000 --- a/health/guides/windows/windows_outbound_packets_errors.md +++ /dev/null @@ -1,46 +0,0 @@ -### Understand the alert - -This alert monitors the number of `outbound errors` on the network interface of a Windows system over the last 10 minutes. If you receive this alert, it means that there are `5 or more errors` in outbound packets during that period. - -### What are outbound errors? - -`Outbound errors` refer to problems that occur during the transmission of packets from the network interface of your system. These errors can be due to various reasons, such as faulty hardware, incorrect configuration, or network congestion. - -### Troubleshoot the alert - -1. Identify the network interface(s) with high outbound errors - -Use the `netstat -e` command to display network statistics for each interface on your system: - -``` -netstat -e -``` - -This will show you the interfaces with errors, along with a count of errors. - -2. Check for faulty hardware or cables - -Visually inspect the network interface and cables for any signs of damage or disconnection. If the hardware appears to be faulty, replace it as necessary. - -3. Review network configuration settings - -Ensure that the network configuration on your system is correct, including the IP address, subnet mask, gateway, and DNS settings. If the configuration is incorrect, update it accordingly. - -4. Monitor network traffic - -Use network monitoring tools such as `Wireshark` or `tcpdump` to capture traffic on the affected interface. Analyze the captured traffic to identify any issues or patterns that may be causing the errors. - -5. Check for network congestion - -If the errors are due to network congestion, identify the sources of high traffic and implement measures to reduce congestion, such as traffic shaping, prioritizing, or rate limiting. - -6. Update network drivers and firmware - -Ensure that your network interface card (NIC) drivers and firmware are up-to-date. Check the manufacturer's website for updates and apply them as necessary. - -### Useful resources - -1. [Netstat Command Usage on Windows](https://www.computerhope.com/issues/ch001/stat.htm) -2. [Wireshark - A Network Protocol Analyzer](https://www.wireshark.org/) -3. [Tcpdump - A Packet Analyzer](https://www.tcpdump.org/) -4. [Network Performance Monitoring and Diagnostics Guide](https://docs.microsoft.com/en-us/windows-server/networking/technologies/npmd/npmd)
\ No newline at end of file diff --git a/health/guides/windows/windows_ram_in_use.md b/health/guides/windows/windows_ram_in_use.md deleted file mode 100644 index ef85588b..00000000 --- a/health/guides/windows/windows_ram_in_use.md +++ /dev/null @@ -1,38 +0,0 @@ -### Understand the alert - -The `windows_ram_in_use` alert is triggered when memory utilization on a Windows system reaches the specified warning or critical thresholds. If you receive this alert, it means that your Windows system is running low on available memory. - -### What does memory utilization mean? - -Memory utilization refers to the percentage of a system's RAM that is currently being used by applications, processes, and the operating system. High memory utilization can lead to performance issues and may cause applications to crash or become unresponsive. - -### Troubleshoot the alert - -- Check current memory usage on the system - -1. Press `Ctrl + Shift + Esc` to open Task Manager. -2. Click on the `Performance` tab. -3. View the `Memory` section to see the total memory usage and available memory. - -- Identify high memory usage processes - -1. In Task Manager, click on the `Processes` tab. -2. Click on the `Memory` column to sort processes by memory usage. -3. Identify processes that are using a high percentage of memory. - -- Optimize memory usage - -1. Close unnecessary applications and processes to free up memory. -2. Investigate if running processes have a known memory leak issue. -3. Consider upgrading the system's RAM if memory usage is consistently high. - -- Monitor memory usage over time - -1. Use Windows Performance Monitor to create a Data Collector Set that collects memory usage metrics. -2. Analyze the collected data to identify trends and potential issues. - -### Useful resources - -1. [How to use Task Manager to monitor Windows PC's performance](https://support.microsoft.com/en-us/windows/how-to-use-task-manager-to-monitor-windows-pc-s-performance-171100cb-5e7d-aaba-29abfedfb06f) -2. [How to use Performance Monitor on Windows 10](https://www.windowscentral.com/how-use-performance-monitor-windows-10) -3. [How to fix high memory usage in Windows](https://pureinfotech.com/reduce-ram-memory-usage-windows/)
\ No newline at end of file diff --git a/health/guides/windows/windows_swap_in_use.md b/health/guides/windows/windows_swap_in_use.md deleted file mode 100644 index 5a650091..00000000 --- a/health/guides/windows/windows_swap_in_use.md +++ /dev/null @@ -1,41 +0,0 @@ -### Understand the alert - -This alert monitors the swap memory utilization on a Windows system. If you receive this alert, it means that your system's swap memory usage is nearing or has exceeded the defined thresholds (`warning` at 80-90% and `critical` at 90-98%). - -### What is swap memory? - -Swap memory is a virtual memory management technique where a portion of the disk space is used as an extension of the physical memory (RAM). When the system runs low on RAM, it moves inactive data from RAM to swap memory to free up space for active processes. While swap memory can help prevent the system from running out of memory, keep in mind that accessing data from swap memory is slower than from RAM. - -### Troubleshoot the alert - -1. Determine the system's memory and swap usage. - - Use the Windows Task Manager to monitor the overall system performance: - - ``` - Ctrl+Shift+Esc - ``` - - Navigate to the Performance tab to see the used and available memory, as well as swap usage. - -2. Check per-process memory usage to find the top consumers. - - In the Task Manager, navigate to the Processes tab. Sort the processes by memory usage to identify the processes consuming the most memory. - -3. Optimize or close the high memory-consuming processes. - - Analyze the processes and determine whether they are essential. Terminate or optimize non-critical processes that consume a significant amount of memory. Ensure to double-check before closing any process to avoid unintentionally closing necessary processes. - -4. Increase the system's memory or adjust swap file settings. - - If your system consistently runs low on memory, consider upgrading the hardware to add more RAM or adjusting the swap memory settings to allocate more disk space. - -5. Prevent memory leaks. - - Memory leaks occur when an application uses memory but fails to release it when no longer needed, causing gradual memory depletion. Ensure that all software running on your system, particularly custom or in-house applications, is well-designed and tested for memory leaks. - -### Useful resources - -1. [How to Manage Virtual Memory (Pagefile) in Windows 10](https://www.techbout.com/manage-virtual-memory-pagefile-windows-10-29638/) -2. [Troubleshooting Windows Performance Issues Using the Resource Monitor](https://docs.microsoft.com/en-us/archive/blogs/askcore/troubleshooting-windows-performance-issues-using-the-resource-monitor) -3. [Windows Performance Monitor](https://docs.microsoft.com/en-us/windows-server/administration/windows-server-2008-help/troubleshoot/windows-rel-performance-monitor)
\ No newline at end of file diff --git a/health/guides/x509check/x509check_days_until_expiration.md b/health/guides/x509check/x509check_days_until_expiration.md deleted file mode 100644 index a37792ab..00000000 --- a/health/guides/x509check/x509check_days_until_expiration.md +++ /dev/null @@ -1,45 +0,0 @@ -### Understand the alert - -This alert indicates that your X.509 certificate will expire soon. By default, it is triggered in a warning state when your certificate has less than 14 days to expire and in a critical state when it has less than 7 days to expire. However, these levels are configurable. - -An X.509 certificate is a digital certificate used to manage identity and security in internet communications and computer networking. If your certificate expires, your system may encounter security and authentication issues which can disrupt your services. - -### Troubleshoot the alert - -**Step 1: Check the certificate's expiration details** - -To check the details of your X.509 certificate, including its expiration date, run the following command: - -``` -openssl x509 -in path/to/your/certificate.crt -text -noout -``` - -Replace `path/to/your/certificate.crt` with the path to your X.509 certificate file. - -**Step 2: Renew or re-key the certificate** - -If your X.509 certificate is issued by a Certification Authority (CA), you need to renew or re-key the certificate before it expires. The process for renewing or re-keying your certificate depends on your CA. Refer to your CA's documentation or help resources for guidance. - -Examples of popular CAs include: - -1. [Let's Encrypt](https://letsencrypt.org/) -2. [Symantec](https://securitycloud.symantec.com/cc/landing) -3. [GeoTrust](https://www.geotrust.com/) -4. [Sectigo](https://sectigo.com/) -5. [DigiCert](https://www.digicert.com/) - -**Step 3: Update your system with the new certificate** - -After renewing or re-keying your certificate, you need to update your system with the new certificate file. The process for updating your system depends on the services and platforms you are using. Refer to their documentation for guidance on how to update your certificate. - -**Step 4: Verify the new certificate** - -Ensure that your system is running with the updated certificate by checking its details again, as described in Step 1. - -If there are still issues or the alert persists, double-check your certificate management process and consult your CA's documentation for any additional help or support. - -### Useful resources - -1. [Sectigo: What is an X.509 certificate?](https://sectigo.com/resource-library/what-is-x509-certificate) -2. [Netdata: x509 certificate monitoring](https://learn.netdata.cloud/docs/agent/collectors/go.d.plugin/modules/x509check) -3. [OpenSSL: X.509 Certificate Commands](https://www.openssl.org/docs/man1.1.1/man1/x509.html)
\ No newline at end of file diff --git a/health/guides/x509check/x509check_revocation_status.md b/health/guides/x509check/x509check_revocation_status.md deleted file mode 100644 index 2d14f106..00000000 --- a/health/guides/x509check/x509check_revocation_status.md +++ /dev/null @@ -1,35 +0,0 @@ -### Understand the alert - -This alert indicates that the X.509 certificate has been revoked, meaning that it is no longer valid or trusted. The certificate can be revoked for various reasons, such as key compromise, errors within the certificate, change of usage, or the certificate owner no longer being deemed trustworthy. - -### Troubleshoot the alert - -1. **Identify the affected certificate**: The alert should provide information about the affected X.509 certificate. Take note of the certificate's details, such as the domain name, subject, issuer, and serial number. - -2. **Verify the revocation status**: You can use the `openssl` command to verify the revocation status of the affected certificate. Use the following command to check the certificate against the Certificate Revocation List (CRL) provided by the CA: - - ``` - openssl verify -crl_check -CAfile CA_certificate.pem -CRLfile CRL.pem certificate.pem - ``` - - Replace `CA_certificate.pem`, `CRL.pem`, and `certificate.pem` with the appropriate file names of the CA certificate, CRL file, and the target X.509 certificate. - - Alternatively, you can use online tools such as [SSL Shopper's SSL Checker](https://www.sslshopper.com/ssl-checker.html) to verify the revocation status. Be sure to input the domain and port associated with the revoked certificate. - -3. **Remove or replace the revoked certificate**: If you have confirmed that the certificate is indeed revoked, you should stop using it immediately. Remove the revoked certificate from your server or application, and replace it with a valid one. - - - If the certificate was issued by a commercial CA, you can request a new certificate from the CA. The CA might provide you with a free replacement or require you to purchase a new one. - - If the certificate was issued by [Let's Encrypt](https://letsencrypt.org/), you can renew the certificate using [Certbot](https://certbot.eff.org/) or another ACME client. - - If the certificate was self-signed, you can create a new self-signed certificate using the `openssl` command or another certificate management tool. - -4. **Update server or application configuration**: After obtaining a new certificate, update your server or application configuration to use the new certificate. Make sure to restart the server or application for the changes to take effect. - -5. **Monitor the new certificate**: Keep an eye on the new certificate's status using the X.509 monitoring tools provided by Netdata. Regularly check for any new alerts or changes in the certificate's status. - -### Useful resources - -1. [X.509 Certificate Monitoring with Netdata](https://learn.netdata.cloud/docs/agent/collectors/go.d.plugin/modules/x509check) -2. [How to use OpenSSL to verify a certificate against a CRL](https://raymii.org/s/tutorials/OpenSSL_command_line_Root_and_Intermediate_CA_including_OCSP_CRL_Signed_Certs.html) -3. [SSL Shopper's SSL Checker](https://www.sslshopper.com/ssl-checker.html) -4. [Renewing certificates with Certbot](https://certbot.eff.org/docs/using.html#renewing-certificates) -5. [Creating a Self-Signed SSL Certificate](https://www.akadia.com/services/ssh_test_certificate.html)
\ No newline at end of file diff --git a/health/guides/zfs/zfs_memory_throttle.md b/health/guides/zfs/zfs_memory_throttle.md deleted file mode 100644 index 3903a02e..00000000 --- a/health/guides/zfs/zfs_memory_throttle.md +++ /dev/null @@ -1,21 +0,0 @@ -### Understand the alert - -This alert indicates the number of times ZFS had to limit the Adaptive Replacement Cache (ARC) growth in the last 10 minutes. ARC stores the most recently used and most frequently used data in RAM, helping to improve read performance. When ARC growth is throttled, it can impact read performance due to a higher chance of cold hits. - -### Troubleshoot the alert - -1. **Monitor RAM usage**: Check your system's RAM usage to determine if there is sufficient memory available for ARC. If other processes are consuming a large amount of RAM, ARC growth may be throttled to free up resources. - -2. **Increase RAM capacity**: If you consistently experience ARC throttling, consider increasing your RAM capacity. This will allow for a larger ARC size, improving read performance and reducing the likelihood of cold hits. - -3. **Adjust ARC size**: If you are using ZFS on Linux, you can adjust the ARC size by modifying the `zfs_arc_min` and `zfs_arc_max` parameters in the `/etc/modprobe.d/zfs.conf` file. On FreeBSD, you can adjust the `vfs.zfs.arc_max` sysctl parameter. Make sure to set these values according to your system's RAM capacity and workload requirements. - -4. **Evaluate workload**: Analyze your system's workload to identify if there are any specific processes or applications that are causing high memory usage, leading to ARC throttling. Optimize or limit these processes if necessary. - - -### Useful resources - -1. [Linux: ZFS Caching](https://www.45drives.com/community/articles/zfs-caching/) -2. [FreeBSD: OpenZFS documentation](https://openzfs.org/w/index.php?title=Features&mobileaction=toggle_view_mobile#Single_Copy_ARC) -3. [ZFS on Linux Performance Tuning Guide](https://github.com/zfsonlinux/zfs/wiki/Performance-Tuning) -4. [FreeBSD ZFS Tuning Guide](https://wiki.freebsd.org/ZFSTuningGuide) diff --git a/health/guides/zfs/zfs_pool_state_crit.md b/health/guides/zfs/zfs_pool_state_crit.md deleted file mode 100644 index 72db4b06..00000000 --- a/health/guides/zfs/zfs_pool_state_crit.md +++ /dev/null @@ -1,58 +0,0 @@ -### Understand the alert - -The `zfs_pool_state_crit` alert indicates that your ZFS pool is faulted or unavailable, which can cause access and data loss problems. It is important to identify the current state of the pool and take corrective actions to remedy the situation. - -### Troubleshoot the alert - -1. **Check the current ZFS pool state** - - Run the `zpool status` command to view the status of all ZFS pools: - - ``` - zpool status - ``` - - This will display the pool state, device states, and any errors that occurred. Take note of any devices that are in DEGRADED, FAULTED, UNAVAIL, or OFFLINE states. - -2. **Assess the problematic devices** - - Check for any hardware issues or file system errors on the affected devices. For example, if a device is FAULTED due to a hardware failure, replace the device. If a device is UNAVAIL or OFFLINE, check the connectivity and make sure it's properly accessible. - -3. **Repair the pool** - - Depending on the root cause of the problem, you may need to take different actions: - - - Repair file system errors using the `zpool scrub` command. This will initiate a scrub, which attempts to fix any errors in the pool. - - ``` - zpool scrub [pool_name] - ``` - - - Replace a failed device using the `zpool replace` command. For example, if you have a new device `/dev/sdb` that will replace `/dev/sda`, run the following command: - - ``` - zpool replace [pool_name] /dev/sda /dev/sdb - ``` - - - Bring an OFFLINE device back ONLINE using the `zpool online` command: - - ``` - zpool online [pool_name] [device] - ``` - - Note: Make sure to replace `[pool_name]` and `[device]` with the appropriate values for your system. - -4. **Verify the pool state** - - After taking the necessary corrective actions, run the `zpool status` command again to verify that the pool state has improved. - -5. **Monitor pool health** - - Continuously monitor the health of your ZFS pools to avoid future issues. Consider setting up periodic scrubs and reviewing system logs to catch any hardware or file system errors. - -### Useful resources - -1. [Determining the Health Status of ZFS Storage Pools](https://docs.oracle.com/cd/E19253-01/819-5461/gamno/index.html) -2. [Chapter 11, Oracle Solaris ZFS Troubleshooting and Pool Recovery](https://docs.oracle.com/cd/E53394_01/html/E54801/gavwg.html) -3. [ZFS on FreeBSD documentation](https://docs.freebsd.org/en/books/handbook/zfs/) -4. [OpenZFS documentation](https://openzfs.github.io/openzfs-docs/)
\ No newline at end of file diff --git a/health/guides/zfs/zfs_pool_state_warn.md b/health/guides/zfs/zfs_pool_state_warn.md deleted file mode 100644 index ffba2045..00000000 --- a/health/guides/zfs/zfs_pool_state_warn.md +++ /dev/null @@ -1,20 +0,0 @@ -### Understand the alert - -This alert is triggered when the state of a ZFS pool changes to a warning state, indicating potential issues with the pool, such as disk errors, corruption, or degraded performance. - -### Troubleshoot the alert - -1. **Check pool status**: Use the `zpool status` command to check the status of the ZFS pool and identify any issues or errors. - -2. **Review disk health**: Inspect the health of the disks in the ZFS pool using `smartctl` or other disk health monitoring tools. - -3. **Replace faulty disks**: If a disk in the ZFS pool is faulty, replace it with a new one and perform a resilvering operation using `zpool replace`. - -4. **Scrub the pool**: Run a manual scrub operation on the ZFS pool with `zpool scrub` to verify data integrity and repair any detected issues. - -5. **Monitor pool health**: Keep an eye on the ZFS pool's health and performance metrics to ensure that issues are resolved and do not recur. - -### Useful resources - -1. [ZFS on Linux Documentation](https://openzfs.github.io/openzfs-docs/) -2. [FreeBSD Handbook - ZFS](https://www.freebsd.org/doc/handbook/zfs.html) diff --git a/health/health.c b/health/health.c deleted file mode 100644 index c1a11167..00000000 --- a/health/health.c +++ /dev/null @@ -1,1652 +0,0 @@ -// SPDX-License-Identifier: GPL-3.0-or-later - -#include "health.h" - -#define WORKER_HEALTH_JOB_RRD_LOCK 0 -#define WORKER_HEALTH_JOB_HOST_LOCK 1 -#define WORKER_HEALTH_JOB_DB_QUERY 2 -#define WORKER_HEALTH_JOB_CALC_EVAL 3 -#define WORKER_HEALTH_JOB_WARNING_EVAL 4 -#define WORKER_HEALTH_JOB_CRITICAL_EVAL 5 -#define WORKER_HEALTH_JOB_ALARM_LOG_ENTRY 6 -#define WORKER_HEALTH_JOB_ALARM_LOG_PROCESS 7 -#define WORKER_HEALTH_JOB_DELAYED_INIT_RRDSET 8 -#define WORKER_HEALTH_JOB_DELAYED_INIT_RRDDIM 9 - -#if WORKER_UTILIZATION_MAX_JOB_TYPES < 10 -#error WORKER_UTILIZATION_MAX_JOB_TYPES has to be at least 10 -#endif - -unsigned int default_health_enabled = 1; -char *silencers_filename; -SIMPLE_PATTERN *conf_enabled_alarms = NULL; -DICTIONARY *health_rrdvars; - -void health_entry_flags_to_json_array(BUFFER *wb, const char *key, HEALTH_ENTRY_FLAGS flags) { - buffer_json_member_add_array(wb, key); - - if(flags & HEALTH_ENTRY_FLAG_PROCESSED) - buffer_json_add_array_item_string(wb, "PROCESSED"); - if(flags & HEALTH_ENTRY_FLAG_UPDATED) - buffer_json_add_array_item_string(wb, "UPDATED"); - if(flags & HEALTH_ENTRY_FLAG_EXEC_RUN) - buffer_json_add_array_item_string(wb, "EXEC_RUN"); - if(flags & HEALTH_ENTRY_FLAG_EXEC_FAILED) - buffer_json_add_array_item_string(wb, "EXEC_FAILED"); - if(flags & HEALTH_ENTRY_FLAG_SILENCED) - buffer_json_add_array_item_string(wb, "SILENCED"); - if(flags & HEALTH_ENTRY_RUN_ONCE) - buffer_json_add_array_item_string(wb, "RUN_ONCE"); - if(flags & HEALTH_ENTRY_FLAG_EXEC_IN_PROGRESS) - buffer_json_add_array_item_string(wb, "EXEC_IN_PROGRESS"); - if(flags & HEALTH_ENTRY_FLAG_IS_REPEATING) - buffer_json_add_array_item_string(wb, "RECURRING"); - if(flags & HEALTH_ENTRY_FLAG_SAVED) - buffer_json_add_array_item_string(wb, "SAVED"); - if(flags & HEALTH_ENTRY_FLAG_ACLK_QUEUED) - buffer_json_add_array_item_string(wb, "ACLK_QUEUED"); - if(flags & HEALTH_ENTRY_FLAG_NO_CLEAR_NOTIFICATION) - buffer_json_add_array_item_string(wb, "NO_CLEAR_NOTIFICATION"); - - buffer_json_array_close(wb); -} - -static bool prepare_command(BUFFER *wb, - const char *exec, - const char *recipient, - const char *registry_hostname, - uint32_t unique_id, - uint32_t alarm_id, - uint32_t alarm_event_id, - uint32_t when, - const char *alert_name, - const char *alert_chart_name, - const char *new_status, - const char *old_status, - NETDATA_DOUBLE new_value, - NETDATA_DOUBLE old_value, - const char *alert_source, - uint32_t duration, - uint32_t non_clear_duration, - const char *alert_units, - const char *alert_info, - const char *new_value_string, - const char *old_value_string, - const char *source, - const char *error_msg, - int n_warn, - int n_crit, - const char *warn_alarms, - const char *crit_alarms, - const char *classification, - const char *edit_command, - const char *machine_guid, - uuid_t *transition_id, - const char *summary, - const char *context, - const char *component, - const char *type -) { - char buf[8192]; - size_t n = sizeof(buf) - 1; - - buffer_strcat(wb, "exec"); - - if (!sanitize_command_argument_string(buf, exec, n)) - return false; - buffer_sprintf(wb, " '%s'", buf); - - if (!sanitize_command_argument_string(buf, recipient, n)) - return false; - buffer_sprintf(wb, " '%s'", buf); - - if (!sanitize_command_argument_string(buf, registry_hostname, n)) - return false; - buffer_sprintf(wb, " '%s'", buf); - - buffer_sprintf(wb, " '%u'", unique_id); - - buffer_sprintf(wb, " '%u'", alarm_id); - - buffer_sprintf(wb, " '%u'", alarm_event_id); - - buffer_sprintf(wb, " '%u'", when); - - if (!sanitize_command_argument_string(buf, alert_name, n)) - return false; - buffer_sprintf(wb, " '%s'", buf); - - if (!sanitize_command_argument_string(buf, alert_chart_name, n)) - return false; - buffer_sprintf(wb, " '%s'", buf); - - if (!sanitize_command_argument_string(buf, new_status, n)) - return false; - buffer_sprintf(wb, " '%s'", buf); - - if (!sanitize_command_argument_string(buf, old_status, n)) - return false; - buffer_sprintf(wb, " '%s'", buf); - - buffer_sprintf(wb, " '" NETDATA_DOUBLE_FORMAT_ZERO "'", new_value); - - buffer_sprintf(wb, " '" NETDATA_DOUBLE_FORMAT_ZERO "'", old_value); - - if (!sanitize_command_argument_string(buf, alert_source, n)) - return false; - buffer_sprintf(wb, " '%s'", buf); - - buffer_sprintf(wb, " '%u'", duration); - - buffer_sprintf(wb, " '%u'", non_clear_duration); - - if (!sanitize_command_argument_string(buf, alert_units, n)) - return false; - buffer_sprintf(wb, " '%s'", buf); - - if (!sanitize_command_argument_string(buf, alert_info, n)) - return false; - buffer_sprintf(wb, " '%s'", buf); - - if (!sanitize_command_argument_string(buf, new_value_string, n)) - return false; - buffer_sprintf(wb, " '%s'", buf); - - if (!sanitize_command_argument_string(buf, old_value_string, n)) - return false; - buffer_sprintf(wb, " '%s'", buf); - - if (!sanitize_command_argument_string(buf, source, n)) - return false; - buffer_sprintf(wb, " '%s'", buf); - - if (!sanitize_command_argument_string(buf, error_msg, n)) - return false; - buffer_sprintf(wb, " '%s'", buf); - - buffer_sprintf(wb, " '%d'", n_warn); - - buffer_sprintf(wb, " '%d'", n_crit); - - if (!sanitize_command_argument_string(buf, warn_alarms, n)) - return false; - buffer_sprintf(wb, " '%s'", buf); - - if (!sanitize_command_argument_string(buf, crit_alarms, n)) - return false; - buffer_sprintf(wb, " '%s'", buf); - - if (!sanitize_command_argument_string(buf, classification, n)) - return false; - buffer_sprintf(wb, " '%s'", buf); - - if (!sanitize_command_argument_string(buf, edit_command, n)) - return false; - buffer_sprintf(wb, " '%s'", buf); - - if (!sanitize_command_argument_string(buf, machine_guid, n)) - return false; - buffer_sprintf(wb, " '%s'", buf); - - char tr_id[UUID_STR_LEN]; - uuid_unparse_lower(*transition_id, tr_id); - if (!sanitize_command_argument_string(buf, tr_id, n)) - return false; - buffer_sprintf(wb, " '%s'", buf); - - if (!sanitize_command_argument_string(buf, summary, n)) - return false; - buffer_sprintf(wb, " '%s'", buf); - - if (!sanitize_command_argument_string(buf, context, n)) - return false; - buffer_sprintf(wb, " '%s'", buf); - - if (!sanitize_command_argument_string(buf, component, n)) - return false; - buffer_sprintf(wb, " '%s'", buf); - - if (!sanitize_command_argument_string(buf, type, n)) - return false; - buffer_sprintf(wb, " '%s'", buf); - - return true; -} - -// the queue of executed alarm notifications that haven't been waited for yet -static struct { - ALARM_ENTRY *head; // oldest - ALARM_ENTRY *tail; // latest -} alarm_notifications_in_progress = {NULL, NULL}; - -typedef struct active_alerts { - char *name; - time_t last_status_change; - RRDCALC_STATUS status; -} active_alerts_t; - -static inline void enqueue_alarm_notify_in_progress(ALARM_ENTRY *ae) -{ - ae->prev_in_progress = NULL; - ae->next_in_progress = NULL; - - if (NULL != alarm_notifications_in_progress.tail) { - ae->prev_in_progress = alarm_notifications_in_progress.tail; - alarm_notifications_in_progress.tail->next_in_progress = ae; - } - if (NULL == alarm_notifications_in_progress.head) { - alarm_notifications_in_progress.head = ae; - } - alarm_notifications_in_progress.tail = ae; - -} - -static inline void unlink_alarm_notify_in_progress(ALARM_ENTRY *ae) -{ - struct alarm_entry *prev = ae->prev_in_progress; - struct alarm_entry *next = ae->next_in_progress; - - if (NULL != prev) { - prev->next_in_progress = next; - } - if (NULL != next) { - next->prev_in_progress = prev; - } - if (ae == alarm_notifications_in_progress.head) { - alarm_notifications_in_progress.head = next; - } - if (ae == alarm_notifications_in_progress.tail) { - alarm_notifications_in_progress.tail = prev; - } -} -// ---------------------------------------------------------------------------- -// health initialization - -/** - * User Config directory - * - * Get the config directory for health and return it. - * - * @return a pointer to the user config directory - */ -inline char *health_user_config_dir(void) { - char buffer[FILENAME_MAX + 1]; - snprintfz(buffer, FILENAME_MAX, "%s/health.d", netdata_configured_user_config_dir); - return config_get(CONFIG_SECTION_DIRECTORIES, "health config", buffer); -} - -/** - * Stock Config Directory - * - * Get the Stock config directory and return it. - * - * @return a pointer to the stock config directory. - */ -inline char *health_stock_config_dir(void) { - char buffer[FILENAME_MAX + 1]; - snprintfz(buffer, FILENAME_MAX, "%s/health.d", netdata_configured_stock_config_dir); - return config_get(CONFIG_SECTION_DIRECTORIES, "stock health config", buffer); -} - -/** - * Silencers init - * - * Function used to initialize the silencer structure. - */ -static void health_silencers_init(void) { - FILE *fd = fopen(silencers_filename, "r"); - if (fd) { - fseek(fd, 0 , SEEK_END); - off_t length = (off_t) ftell(fd); - fseek(fd, 0 , SEEK_SET); - - if (length > 0 && length < HEALTH_SILENCERS_MAX_FILE_LEN) { - char *str = mallocz((length+1)* sizeof(char)); - if(str) { - size_t copied; - copied = fread(str, sizeof(char), length, fd); - if (copied == (length* sizeof(char))) { - str[length] = 0x00; - json_parse(str, NULL, health_silencers_json_read_callback); - netdata_log_info("Parsed health silencers file %s", silencers_filename); - } else { - netdata_log_error("Cannot read the data from health silencers file %s", silencers_filename); - } - freez(str); - } - } else { - netdata_log_error("Health silencers file %s has the size %" PRId64 " that is out of range[ 1 , %d ]. Aborting read.", - silencers_filename, - (int64_t)length, - HEALTH_SILENCERS_MAX_FILE_LEN); - } - fclose(fd); - } else { - netdata_log_info("Cannot open the file %s, so Netdata will work with the default health configuration.", - silencers_filename); - } -} - -/** - * Health Init - * - * Initialize the health thread. - */ -void health_init(void) { - netdata_log_debug(D_HEALTH, "Health configuration initializing"); - - if(!(default_health_enabled = (unsigned int)config_get_boolean(CONFIG_SECTION_HEALTH, "enabled", default_health_enabled))) { - netdata_log_debug(D_HEALTH, "Health is disabled."); - return; - } - - health_silencers_init(); -} - -// ---------------------------------------------------------------------------- -// re-load health configuration - -/** - * Reload host - * - * Reload configuration for a specific host. - * - * @param host the structure of the host that the function will reload the configuration. - */ -static void health_reload_host(RRDHOST *host) { - if(unlikely(!host->health.health_enabled) && !rrdhost_flag_check(host, RRDHOST_FLAG_INITIALIZED_HEALTH)) - return; - - nd_log(NDLS_DAEMON, NDLP_DEBUG, - "[%s]: Reloading health.", - rrdhost_hostname(host)); - - char *user_path = health_user_config_dir(); - char *stock_path = health_stock_config_dir(); - - // free all running alarms - rrdcalc_delete_all(host); - rrdcalctemplate_delete_all(host); - - // invalidate all previous entries in the alarm log - rw_spinlock_read_lock(&host->health_log.spinlock); - ALARM_ENTRY *t; - for(t = host->health_log.alarms ; t ; t = t->next) { - if(t->new_status != RRDCALC_STATUS_REMOVED) - t->flags |= HEALTH_ENTRY_FLAG_UPDATED; - } - rw_spinlock_read_unlock(&host->health_log.spinlock); - - // reset all thresholds to all charts - RRDSET *st; - rrdset_foreach_read(st, host) { - st->green = NAN; - st->red = NAN; - } - rrdset_foreach_done(st); - - // load the new alarms - health_readdir(host, user_path, stock_path, NULL); - - //Discard alarms with labels that do not apply to host - rrdcalc_delete_alerts_not_matching_host_labels_from_this_host(host); - - // link the loaded alarms to their charts - rrdset_foreach_write(st, host) { - rrdcalc_link_matching_alerts_to_rrdset(st); - rrdcalctemplate_link_matching_templates_to_rrdset(st); - } - rrdset_foreach_done(st); - -#ifdef ENABLE_ACLK - if (netdata_cloud_enabled) { - struct aclk_sync_cfg_t *wc = host->aclk_config; - if (likely(wc)) { - wc->alert_queue_removed = SEND_REMOVED_AFTER_HEALTH_LOOPS; - } - } -#endif -} - -/** - * Reload - * - * Reload the host configuration for all hosts. - */ -void health_reload(void) { - sql_refresh_hashes(); - - RRDHOST *host; - dfe_start_reentrant(rrdhost_root_index, host){ - health_reload_host(host); - } - dfe_done(host); -} - -// ---------------------------------------------------------------------------- -// health main thread and friends - -static inline RRDCALC_STATUS rrdcalc_value2status(NETDATA_DOUBLE n) { - if(isnan(n) || isinf(n)) return RRDCALC_STATUS_UNDEFINED; - if(n) return RRDCALC_STATUS_RAISED; - return RRDCALC_STATUS_CLEAR; -} - -#define ACTIVE_ALARMS_LIST_EXAMINE 500 -#define ACTIVE_ALARMS_LIST 15 - -static inline int compare_active_alerts(const void * a, const void * b) { - active_alerts_t *active_alerts_a = (active_alerts_t *)a; - active_alerts_t *active_alerts_b = (active_alerts_t *)b; - - return (int) ( active_alerts_b->last_status_change - active_alerts_a->last_status_change ); -} - -static inline void health_alarm_execute(RRDHOST *host, ALARM_ENTRY *ae) { - ae->flags |= HEALTH_ENTRY_FLAG_PROCESSED; - - if(unlikely(ae->new_status < RRDCALC_STATUS_CLEAR)) { - // do not send notifications for internal statuses - netdata_log_debug(D_HEALTH, "Health not sending notification for alarm '%s.%s' status %s (internal statuses)", ae_chart_id(ae), ae_name(ae), rrdcalc_status2string(ae->new_status)); - goto done; - } - - if(unlikely(ae->new_status <= RRDCALC_STATUS_CLEAR && (ae->flags & HEALTH_ENTRY_FLAG_NO_CLEAR_NOTIFICATION))) { - // do not send notifications for disabled statuses - - nd_log(NDLS_DAEMON, NDLP_DEBUG, - "[%s]: Health not sending notification for alarm '%s.%s' status %s (it has no-clear-notification enabled)", - rrdhost_hostname(host), ae_chart_id(ae), ae_name(ae), rrdcalc_status2string(ae->new_status)); - - // mark it as run, so that we will send the same alarm if it happens again - goto done; - } - - // find the previous notification for the same alarm - // which we have run the exec script - // exception: alarms with HEALTH_ENTRY_FLAG_NO_CLEAR_NOTIFICATION set - RRDCALC_STATUS last_executed_status = -3; - if(likely(!(ae->flags & HEALTH_ENTRY_FLAG_NO_CLEAR_NOTIFICATION))) { - int ret = sql_health_get_last_executed_event(host, ae, &last_executed_status); - - if (likely(ret == 1)) { - // we have executed this alarm notification in the past - if(last_executed_status == ae->new_status && !(ae->flags & HEALTH_ENTRY_FLAG_IS_REPEATING)) { - // don't send the notification for the same status again - nd_log(NDLS_DAEMON, NDLP_DEBUG, - "[%s]: Health not sending again notification for alarm '%s.%s' status %s", - rrdhost_hostname(host), ae_chart_id(ae), ae_name(ae), - rrdcalc_status2string(ae->new_status)); - goto done; - } - } - else { - // we have not executed this alarm notification in the past - // so, don't send CLEAR notifications - if(unlikely(ae->new_status == RRDCALC_STATUS_CLEAR)) { - if((!(ae->flags & HEALTH_ENTRY_RUN_ONCE)) || (ae->flags & HEALTH_ENTRY_RUN_ONCE && ae->old_status < RRDCALC_STATUS_RAISED) ) { - netdata_log_debug(D_HEALTH, "Health not sending notification for first initialization of alarm '%s.%s' status %s" - , ae_chart_id(ae), ae_name(ae), rrdcalc_status2string(ae->new_status)); - goto done; - } - } - } - } - - // Check if alarm notifications are silenced - if (ae->flags & HEALTH_ENTRY_FLAG_SILENCED) { - nd_log(NDLS_DAEMON, NDLP_DEBUG, - "[%s]: Health not sending notification for alarm '%s.%s' status %s " - "(command API has disabled notifications)", - rrdhost_hostname(host), ae_chart_id(ae), ae_name(ae), rrdcalc_status2string(ae->new_status)); - goto done; - } - - nd_log(NDLS_DAEMON, NDLP_DEBUG, - "[%s]: Sending notification for alarm '%s.%s' status %s.", - rrdhost_hostname(host), ae_chart_id(ae), ae_name(ae), rrdcalc_status2string(ae->new_status)); - - const char *exec = (ae->exec) ? ae_exec(ae) : string2str(host->health.health_default_exec); - const char *recipient = (ae->recipient) ? ae_recipient(ae) : string2str(host->health.health_default_recipient); - - int n_warn=0, n_crit=0; - RRDCALC *rc; - EVAL_EXPRESSION *expr=NULL; - BUFFER *warn_alarms, *crit_alarms; - active_alerts_t *active_alerts = callocz(ACTIVE_ALARMS_LIST_EXAMINE, sizeof(active_alerts_t)); - - warn_alarms = buffer_create(NETDATA_WEB_RESPONSE_INITIAL_SIZE, &netdata_buffers_statistics.buffers_health); - crit_alarms = buffer_create(NETDATA_WEB_RESPONSE_INITIAL_SIZE, &netdata_buffers_statistics.buffers_health); - - foreach_rrdcalc_in_rrdhost_read(host, rc) { - if(unlikely(!rc->rrdset || !rc->rrdset->last_collected_time.tv_sec)) - continue; - - if(unlikely((n_warn + n_crit) >= ACTIVE_ALARMS_LIST_EXAMINE)) - break; - - if (unlikely(rc->status == RRDCALC_STATUS_WARNING)) { - if (likely(ae->alarm_id != rc->id) || likely(ae->alarm_event_id != rc->next_event_id - 1)) { - active_alerts[n_warn+n_crit].name = (char *)rrdcalc_name(rc); - active_alerts[n_warn+n_crit].last_status_change = rc->last_status_change; - active_alerts[n_warn+n_crit].status = rc->status; - n_warn++; - } else if (ae->alarm_id == rc->id) - expr = rc->warning; - } else if (unlikely(rc->status == RRDCALC_STATUS_CRITICAL)) { - if (likely(ae->alarm_id != rc->id) || likely(ae->alarm_event_id != rc->next_event_id - 1)) { - active_alerts[n_warn+n_crit].name = (char *)rrdcalc_name(rc); - active_alerts[n_warn+n_crit].last_status_change = rc->last_status_change; - active_alerts[n_warn+n_crit].status = rc->status; - n_crit++; - } else if (ae->alarm_id == rc->id) - expr = rc->critical; - } else if (unlikely(rc->status == RRDCALC_STATUS_CLEAR)) { - if (ae->alarm_id == rc->id) - expr = rc->warning; - } - } - foreach_rrdcalc_in_rrdhost_done(rc); - - if (n_warn+n_crit>1) - qsort (active_alerts, n_warn+n_crit, sizeof(active_alerts_t), compare_active_alerts); - - int count_w = 0, count_c = 0; - while (count_w + count_c < n_warn + n_crit && count_w + count_c < ACTIVE_ALARMS_LIST) { - if (active_alerts[count_w+count_c].status == RRDCALC_STATUS_WARNING) { - if (count_w) - buffer_strcat(warn_alarms, ","); - buffer_strcat(warn_alarms, active_alerts[count_w+count_c].name); - buffer_strcat(warn_alarms, "="); - buffer_snprintf(warn_alarms, 11, "%"PRId64"", (int64_t)active_alerts[count_w+count_c].last_status_change); - count_w++; - } - else if (active_alerts[count_w+count_c].status == RRDCALC_STATUS_CRITICAL) { - if (count_c) - buffer_strcat(crit_alarms, ","); - buffer_strcat(crit_alarms, active_alerts[count_w+count_c].name); - buffer_strcat(crit_alarms, "="); - buffer_snprintf(crit_alarms, 11, "%"PRId64"", (int64_t)active_alerts[count_w+count_c].last_status_change); - count_c++; - } - } - - char *edit_command = ae->source ? health_edit_command_from_source(ae_source(ae)) : strdupz("UNKNOWN=0=UNKNOWN"); - - BUFFER *wb = buffer_create(8192, &netdata_buffers_statistics.buffers_health); - bool ok = prepare_command(wb, - exec, - recipient, - rrdhost_registry_hostname(host), - ae->unique_id, - ae->alarm_id, - ae->alarm_event_id, - (unsigned long)ae->when, - ae_name(ae), - ae->chart?ae_chart_id(ae):"NOCHART", - rrdcalc_status2string(ae->new_status), - rrdcalc_status2string(ae->old_status), - ae->new_value, - ae->old_value, - ae->source?ae_source(ae):"UNKNOWN", - (uint32_t)ae->duration, - (ae->flags & HEALTH_ENTRY_FLAG_IS_REPEATING && ae->new_status >= RRDCALC_STATUS_WARNING) ? (uint32_t)ae->duration : (uint32_t)ae->non_clear_duration, - ae_units(ae), - ae_info(ae), - ae_new_value_string(ae), - ae_old_value_string(ae), - (expr && expr->source)?expr->source:"NOSOURCE", - (expr && expr->error_msg)?buffer_tostring(expr->error_msg):"NOERRMSG", - n_warn, - n_crit, - buffer_tostring(warn_alarms), - buffer_tostring(crit_alarms), - ae->classification?ae_classification(ae):"Unknown", - edit_command, - host->machine_guid, - &ae->transition_id, - host->health.use_summary_for_notifications && ae->summary?ae_summary(ae):ae_name(ae), - string2str(ae->chart_context), - string2str(ae->component), - string2str(ae->type) - ); - - const char *command_to_run = buffer_tostring(wb); - if (ok) { - ae->flags |= HEALTH_ENTRY_FLAG_EXEC_RUN; - ae->exec_run_timestamp = now_realtime_sec(); /* will be updated by real time after spawning */ - - netdata_log_debug(D_HEALTH, "executing command '%s'", command_to_run); - ae->flags |= HEALTH_ENTRY_FLAG_EXEC_IN_PROGRESS; - ae->exec_spawn_serial = spawn_enq_cmd(command_to_run); - enqueue_alarm_notify_in_progress(ae); - health_alarm_log_save(host, ae); - } else { - netdata_log_error("Failed to format command arguments"); - } - - buffer_free(wb); - freez(edit_command); - buffer_free(warn_alarms); - buffer_free(crit_alarms); - freez(active_alerts); - - return; //health_alarm_wait_for_execution -done: - health_alarm_log_save(host, ae); -} - -static inline void health_alarm_wait_for_execution(ALARM_ENTRY *ae) { - if (!(ae->flags & HEALTH_ENTRY_FLAG_EXEC_IN_PROGRESS)) - return; - - spawn_wait_cmd(ae->exec_spawn_serial, &ae->exec_code, &ae->exec_run_timestamp); - netdata_log_debug(D_HEALTH, "done executing command - returned with code %d", ae->exec_code); - ae->flags &= ~HEALTH_ENTRY_FLAG_EXEC_IN_PROGRESS; - - if(ae->exec_code != 0) - ae->flags |= HEALTH_ENTRY_FLAG_EXEC_FAILED; - - unlink_alarm_notify_in_progress(ae); -} - -static inline void health_process_notifications(RRDHOST *host, ALARM_ENTRY *ae) { - netdata_log_debug(D_HEALTH, "Health alarm '%s.%s' = " NETDATA_DOUBLE_FORMAT_AUTO " - changed status from %s to %s", - ae->chart?ae_chart_id(ae):"NOCHART", ae_name(ae), - ae->new_value, - rrdcalc_status2string(ae->old_status), - rrdcalc_status2string(ae->new_status) - ); - - health_alarm_execute(host, ae); -} - -static inline void health_alarm_log_process(RRDHOST *host) { - uint32_t first_waiting = (host->health_log.alarms)?host->health_log.alarms->unique_id:0; - time_t now = now_realtime_sec(); - - rw_spinlock_read_lock(&host->health_log.spinlock); - - ALARM_ENTRY *ae; - for(ae = host->health_log.alarms; ae && ae->unique_id >= host->health_last_processed_id; ae = ae->next) { - if(unlikely( - !(ae->flags & HEALTH_ENTRY_FLAG_PROCESSED) && - !(ae->flags & HEALTH_ENTRY_FLAG_UPDATED) - )) { - if(unlikely(ae->unique_id < first_waiting)) - first_waiting = ae->unique_id; - - if(likely(now >= ae->delay_up_to_timestamp)) - health_process_notifications(host, ae); - } - } - - rw_spinlock_read_unlock(&host->health_log.spinlock); - - // remember this for the next iteration - host->health_last_processed_id = first_waiting; - - //delete those that are updated, no in progress execution, and is not repeating - rw_spinlock_write_lock(&host->health_log.spinlock); - - ALARM_ENTRY *prev = NULL, *next = NULL; - for(ae = host->health_log.alarms; ae ; ae = next) { - next = ae->next; // set it here, for the next iteration - - if((likely(!(ae->flags & HEALTH_ENTRY_FLAG_IS_REPEATING)) && - (ae->flags & HEALTH_ENTRY_FLAG_UPDATED) && - (ae->flags & HEALTH_ENTRY_FLAG_SAVED) && - !(ae->flags & HEALTH_ENTRY_FLAG_EXEC_IN_PROGRESS)) - || - ((ae->new_status == RRDCALC_STATUS_REMOVED) && - (ae->flags & HEALTH_ENTRY_FLAG_SAVED) && - (ae->when + 86400 < now_realtime_sec()))) - { - - if(host->health_log.alarms == ae) { - host->health_log.alarms = next; - // prev is also NULL here - } - else { - prev->next = next; - // prev should not be touched here - we need it for the next iteration - // because we may have to also remove the next item - } - - health_alarm_log_free_one_nochecks_nounlink(ae); - } - else - prev = ae; - } - - rw_spinlock_write_unlock(&host->health_log.spinlock); -} - -static inline int rrdcalc_isrunnable(RRDCALC *rc, time_t now, time_t *next_run) { - if(unlikely(!rc->rrdset)) { - netdata_log_debug(D_HEALTH, "Health not running alarm '%s.%s'. It is not linked to a chart.", rrdcalc_chart_name(rc), rrdcalc_name(rc)); - return 0; - } - - if(unlikely(rc->next_update > now)) { - if (unlikely(*next_run > rc->next_update)) { - // update the next_run time of the main loop - // to run this alarm precisely the time required - *next_run = rc->next_update; - } - - netdata_log_debug(D_HEALTH, "Health not examining alarm '%s.%s' yet (will do in %d secs).", rrdcalc_chart_name(rc), rrdcalc_name(rc), (int) (rc->next_update - now)); - return 0; - } - - if(unlikely(!rc->update_every)) { - netdata_log_debug(D_HEALTH, "Health not running alarm '%s.%s'. It does not have an update frequency", rrdcalc_chart_name(rc), rrdcalc_name(rc)); - return 0; - } - - if(unlikely(rrdset_flag_check(rc->rrdset, RRDSET_FLAG_OBSOLETE))) { - netdata_log_debug(D_HEALTH, "Health not running alarm '%s.%s'. The chart has been marked as obsolete", rrdcalc_chart_name(rc), rrdcalc_name(rc)); - return 0; - } - - if(unlikely(!rc->rrdset->last_collected_time.tv_sec || rc->rrdset->counter_done < 2)) { - netdata_log_debug(D_HEALTH, "Health not running alarm '%s.%s'. Chart is not fully collected yet.", rrdcalc_chart_name(rc), rrdcalc_name(rc)); - return 0; - } - - int update_every = rc->rrdset->update_every; - time_t first = rrdset_first_entry_s(rc->rrdset); - time_t last = rrdset_last_entry_s(rc->rrdset); - - if(unlikely(now + update_every < first /* || now - update_every > last */)) { - netdata_log_debug(D_HEALTH - , "Health not examining alarm '%s.%s' yet (wanted time is out of bounds - we need %lu but got %lu - %lu)." - , rrdcalc_chart_name(rc), rrdcalc_name(rc), (unsigned long) now, (unsigned long) first - , (unsigned long) last); - return 0; - } - - if(RRDCALC_HAS_DB_LOOKUP(rc)) { - time_t needed = now + rc->before + rc->after; - - if(needed + update_every < first || needed - update_every > last) { - netdata_log_debug(D_HEALTH - , "Health not examining alarm '%s.%s' yet (not enough data yet - we need %lu but got %lu - %lu)." - , rrdcalc_chart_name(rc), rrdcalc_name(rc), (unsigned long) needed, (unsigned long) first - , (unsigned long) last); - return 0; - } - } - - return 1; -} - -static inline int check_if_resumed_from_suspension(void) { - static usec_t last_realtime = 0, last_monotonic = 0; - usec_t realtime = now_realtime_usec(), monotonic = now_monotonic_usec(); - int ret = 0; - - // detect if monotonic and realtime have twice the difference - // in which case we assume the system was just waken from hibernation - - if(last_realtime && last_monotonic && realtime - last_realtime > 2 * (monotonic - last_monotonic)) - ret = 1; - - last_realtime = realtime; - last_monotonic = monotonic; - - return ret; -} - -static void health_main_cleanup(void *ptr) { - worker_unregister(); - - struct netdata_static_thread *static_thread = (struct netdata_static_thread *)ptr; - static_thread->enabled = NETDATA_MAIN_THREAD_EXITING; - netdata_log_info("cleaning up..."); - static_thread->enabled = NETDATA_MAIN_THREAD_EXITED; - - nd_log(NDLS_DAEMON, NDLP_DEBUG, - "Health thread ended."); -} - -static void initialize_health(RRDHOST *host) -{ - if(!host->health.health_enabled || - rrdhost_flag_check(host, RRDHOST_FLAG_INITIALIZED_HEALTH) || - !service_running(SERVICE_HEALTH)) - return; - - rrdhost_flag_set(host, RRDHOST_FLAG_INITIALIZED_HEALTH); - - nd_log(NDLS_DAEMON, NDLP_DEBUG, - "[%s]: Initializing health.", - rrdhost_hostname(host)); - - host->health.health_default_warn_repeat_every = config_get_duration(CONFIG_SECTION_HEALTH, "default repeat warning", "never"); - host->health.health_default_crit_repeat_every = config_get_duration(CONFIG_SECTION_HEALTH, "default repeat critical", "never"); - - host->health_log.next_log_id = 1; - host->health_log.next_alarm_id = 1; - host->health_log.max = 1000; - host->health_log.next_log_id = (uint32_t)now_realtime_sec(); - host->health_log.next_alarm_id = 0; - - long n = config_get_number(CONFIG_SECTION_HEALTH, "in memory max health log entries", host->health_log.max); - if(n < 10) { - nd_log(NDLS_DAEMON, NDLP_WARNING, - "Host '%s': health configuration has invalid max log entries %ld. " - "Using default %u", - rrdhost_hostname(host), n, host->health_log.max); - - config_set_number(CONFIG_SECTION_HEALTH, "in memory max health log entries", (long)host->health_log.max); - } - else - host->health_log.max = (unsigned int)n; - - uint32_t m = config_get_number(CONFIG_SECTION_HEALTH, "health log history", HEALTH_LOG_DEFAULT_HISTORY); - if (m < HEALTH_LOG_MINIMUM_HISTORY) { - nd_log(NDLS_DAEMON, NDLP_WARNING, - "Host '%s': health configuration has invalid health log history %u. " - "Using minimum %d", - rrdhost_hostname(host), m, HEALTH_LOG_MINIMUM_HISTORY); - - config_set_number(CONFIG_SECTION_HEALTH, "health log history", HEALTH_LOG_MINIMUM_HISTORY); - m = HEALTH_LOG_MINIMUM_HISTORY; - } - - //default health log history is 5 days and not less than a day - if (host->health_log.health_log_history) { - if (host->health_log.health_log_history < HEALTH_LOG_MINIMUM_HISTORY) - host->health_log.health_log_history = HEALTH_LOG_MINIMUM_HISTORY; - } else - host->health_log.health_log_history = m; - - nd_log(NDLS_DAEMON, NDLP_DEBUG, - "[%s]: Health log history is set to %u seconds (%u days)", - rrdhost_hostname(host), host->health_log.health_log_history, host->health_log.health_log_history / 86400); - - conf_enabled_alarms = simple_pattern_create(config_get(CONFIG_SECTION_HEALTH, "enabled alarms", "*"), NULL, - SIMPLE_PATTERN_EXACT, true); - - rw_spinlock_init(&host->health_log.spinlock); - - char filename[FILENAME_MAX + 1]; - - snprintfz(filename, FILENAME_MAX, "%s/alarm-notify.sh", netdata_configured_primary_plugins_dir); - host->health.health_default_exec = string_strdupz(config_get(CONFIG_SECTION_HEALTH, "script to execute on alarm", filename)); - host->health.health_default_recipient = string_strdupz("root"); - host->health.use_summary_for_notifications = config_get_boolean(CONFIG_SECTION_HEALTH, "use summary for notifications", CONFIG_BOOLEAN_YES); - - sql_health_alarm_log_load(host); - - // ------------------------------------------------------------------------ - // load health configuration - - health_readdir(host, health_user_config_dir(), health_stock_config_dir(), NULL); - - // link the loaded alarms to their charts - RRDSET *st; - rrdset_foreach_reentrant(st, host) { - rrdcalc_link_matching_alerts_to_rrdset(st); - rrdcalctemplate_link_matching_templates_to_rrdset(st); - } - rrdset_foreach_done(st); - - //Discard alarms with labels that do not apply to host - rrdcalc_delete_alerts_not_matching_host_labels_from_this_host(host); -} - -static void health_sleep(time_t next_run, unsigned int loop __maybe_unused) { - time_t now = now_realtime_sec(); - if(now < next_run) { - worker_is_idle(); - netdata_log_debug(D_HEALTH, "Health monitoring iteration no %u done. Next iteration in %d secs", loop, (int) (next_run - now)); - while (now < next_run && service_running(SERVICE_HEALTH)) { - sleep_usec(USEC_PER_SEC); - now = now_realtime_sec(); - } - } - else { - netdata_log_debug(D_HEALTH, "Health monitoring iteration no %u done. Next iteration now", loop); - } -} - -static SILENCE_TYPE check_silenced(RRDCALC *rc, const char *host) -{ - SILENCER *s; - - for (s = silencers->silencers; s!=NULL; s=s->next){ - if ( - (!s->alarms_pattern || (rc->name && s->alarms_pattern && simple_pattern_matches_string(s->alarms_pattern, rc->name))) && - (!s->contexts_pattern || (rc->rrdset && rc->rrdset->context && s->contexts_pattern && simple_pattern_matches_string(s->contexts_pattern, rc->rrdset->context))) && - (!s->hosts_pattern || (host && s->hosts_pattern && simple_pattern_matches(s->hosts_pattern, host))) && - (!s->charts_pattern || (rc->chart && s->charts_pattern && simple_pattern_matches_string(s->charts_pattern, rc->chart))) - ) { - netdata_log_debug(D_HEALTH, "Alarm matches command API silence entry %s:%s:%s:%s", s->alarms,s->charts, s->contexts, s->hosts); - if (unlikely(silencers->stype == STYPE_NONE)) { - netdata_log_debug(D_HEALTH, "Alarm %s matched a silence entry, but no SILENCE or DISABLE command was issued via the command API. The match has no effect.", rrdcalc_name(rc)); - } else { - netdata_log_debug(D_HEALTH, "Alarm %s via the command API - name:%s context:%s chart:%s host:%s" - , (silencers->stype == STYPE_DISABLE_ALARMS)?"Disabled":"Silenced" - , rrdcalc_name(rc) - , (rc->rrdset)?rrdset_context(rc->rrdset):"" - , rrdcalc_chart_name(rc) - , host - ); - } - return silencers->stype; - } - } - return STYPE_NONE; -} - -/** - * Update Disabled Silenced - * - * Update the variable rrdcalc_flags of the structure RRDCALC according with the values of the host structure - * - * @param host structure that contains information about the host monitored. - * @param rc structure with information about the alarm - * - * @return It returns 1 case rrdcalc_flags is DISABLED or 0 otherwise - */ -static int update_disabled_silenced(RRDHOST *host, RRDCALC *rc) { - uint32_t rrdcalc_flags_old = rc->run_flags; - // Clear the flags - rc->run_flags &= ~(RRDCALC_FLAG_DISABLED | RRDCALC_FLAG_SILENCED); - if (unlikely(silencers->all_alarms)) { - if (silencers->stype == STYPE_DISABLE_ALARMS) rc->run_flags |= RRDCALC_FLAG_DISABLED; - else if (silencers->stype == STYPE_SILENCE_NOTIFICATIONS) rc->run_flags |= RRDCALC_FLAG_SILENCED; - } else { - SILENCE_TYPE st = check_silenced(rc, rrdhost_hostname(host)); - if (st == STYPE_DISABLE_ALARMS) rc->run_flags |= RRDCALC_FLAG_DISABLED; - else if (st == STYPE_SILENCE_NOTIFICATIONS) rc->run_flags |= RRDCALC_FLAG_SILENCED; - } - - if (rrdcalc_flags_old != rc->run_flags) { - netdata_log_info( - "Alarm silencing changed for host '%s' alarm '%s': Disabled %s->%s Silenced %s->%s", - rrdhost_hostname(host), - rrdcalc_name(rc), - (rrdcalc_flags_old & RRDCALC_FLAG_DISABLED) ? "true" : "false", - (rc->run_flags & RRDCALC_FLAG_DISABLED) ? "true" : "false", - (rrdcalc_flags_old & RRDCALC_FLAG_SILENCED) ? "true" : "false", - (rc->run_flags & RRDCALC_FLAG_SILENCED) ? "true" : "false"); - } - if (rc->run_flags & RRDCALC_FLAG_DISABLED) - return 1; - else - return 0; -} - -static void sql_health_postpone_queue_removed(RRDHOST *host __maybe_unused) { -#ifdef ENABLE_ACLK - if (netdata_cloud_enabled) { - struct aclk_sync_cfg_t *wc = host->aclk_config; - if (unlikely(!wc)) { - return; - } - - if (wc->alert_queue_removed >= 1) { - wc->alert_queue_removed+=6; - } - } -#endif -} - -static void health_execute_delayed_initializations(RRDHOST *host) { - RRDSET *st; - bool must_postpone = false; - - if (!rrdhost_flag_check(host, RRDHOST_FLAG_PENDING_HEALTH_INITIALIZATION)) return; - rrdhost_flag_clear(host, RRDHOST_FLAG_PENDING_HEALTH_INITIALIZATION); - - rrdset_foreach_reentrant(st, host) { - if(!rrdset_flag_check(st, RRDSET_FLAG_PENDING_HEALTH_INITIALIZATION)) continue; - rrdset_flag_clear(st, RRDSET_FLAG_PENDING_HEALTH_INITIALIZATION); - - worker_is_busy(WORKER_HEALTH_JOB_DELAYED_INIT_RRDSET); - - rrdcalc_link_matching_alerts_to_rrdset(st); - rrdcalctemplate_link_matching_templates_to_rrdset(st); - - RRDDIM *rd; - rrddim_foreach_read(rd, st) { - if(!rrddim_flag_check(rd, RRDDIM_FLAG_PENDING_HEALTH_INITIALIZATION)) continue; - rrddim_flag_clear(rd, RRDDIM_FLAG_PENDING_HEALTH_INITIALIZATION); - - worker_is_busy(WORKER_HEALTH_JOB_DELAYED_INIT_RRDDIM); - - RRDCALCTEMPLATE *rt; - foreach_rrdcalctemplate_read(host, rt) { - if(!rt->foreach_dimension_pattern) - continue; - - if(rrdcalctemplate_check_rrdset_conditions(rt, st, host)) { - rrdcalctemplate_check_rrddim_conditions_and_link(rt, st, rd, host); - } - } - foreach_rrdcalctemplate_done(rt); - - if (health_variable_check(health_rrdvars, st, rd) || rrdset_flag_check(st, RRDSET_FLAG_HAS_RRDCALC_LINKED)) - rrdvar_store_for_chart(host, st); - } - rrddim_foreach_done(rd); - must_postpone = true; - } - rrdset_foreach_done(st); - if (must_postpone) - sql_health_postpone_queue_removed(host); -} - -/** - * Health Main - * - * The main thread of the health system. In this function all the alarms will be processed. - * - * @param ptr is a pointer to the netdata_static_thread structure. - * - * @return It always returns NULL - */ - -void *health_main(void *ptr) { - worker_register("HEALTH"); - worker_register_job_name(WORKER_HEALTH_JOB_RRD_LOCK, "rrd lock"); - worker_register_job_name(WORKER_HEALTH_JOB_HOST_LOCK, "host lock"); - worker_register_job_name(WORKER_HEALTH_JOB_DB_QUERY, "db lookup"); - worker_register_job_name(WORKER_HEALTH_JOB_CALC_EVAL, "calc eval"); - worker_register_job_name(WORKER_HEALTH_JOB_WARNING_EVAL, "warning eval"); - worker_register_job_name(WORKER_HEALTH_JOB_CRITICAL_EVAL, "critical eval"); - worker_register_job_name(WORKER_HEALTH_JOB_ALARM_LOG_ENTRY, "alarm log entry"); - worker_register_job_name(WORKER_HEALTH_JOB_ALARM_LOG_PROCESS, "alarm log process"); - worker_register_job_name(WORKER_HEALTH_JOB_DELAYED_INIT_RRDSET, "rrdset init"); - worker_register_job_name(WORKER_HEALTH_JOB_DELAYED_INIT_RRDDIM, "rrddim init"); - - netdata_thread_cleanup_push(health_main_cleanup, ptr); - - int min_run_every = (int)config_get_number(CONFIG_SECTION_HEALTH, "run at least every seconds", 10); - if(min_run_every < 1) min_run_every = 1; - - time_t hibernation_delay = config_get_number(CONFIG_SECTION_HEALTH, "postpone alarms during hibernation for seconds", 60); - - bool health_running_logged = false; - - rrdcalc_delete_alerts_not_matching_host_labels_from_all_hosts(); - - unsigned int loop = 0; - - while(service_running(SERVICE_HEALTH)) { - loop++; - netdata_log_debug(D_HEALTH, "Health monitoring iteration no %u started", loop); - - time_t now = now_realtime_sec(); - int runnable = 0, apply_hibernation_delay = 0; - time_t next_run = now + min_run_every; - RRDCALC *rc; - RRDHOST *host; - - if (unlikely(check_if_resumed_from_suspension())) { - apply_hibernation_delay = 1; - - nd_log(NDLS_DAEMON, NDLP_NOTICE, - "Postponing alarm checks for %"PRId64" seconds, " - "because it seems that the system was just resumed from suspension.", - (int64_t)hibernation_delay); - } - - if (unlikely(silencers->all_alarms && silencers->stype == STYPE_DISABLE_ALARMS)) { - static int logged=0; - if (!logged) { - nd_log(NDLS_DAEMON, NDLP_DEBUG, - "Skipping health checks, because all alarms are disabled via a %s command.", - HEALTH_CMDAPI_CMD_DISABLEALL); - logged = 1; - } - } - - worker_is_busy(WORKER_HEALTH_JOB_RRD_LOCK); - dfe_start_reentrant(rrdhost_root_index, host) { - - if(unlikely(!service_running(SERVICE_HEALTH))) - break; - - if (unlikely(!host->health.health_enabled)) - continue; - - if (unlikely(!rrdhost_flag_check(host, RRDHOST_FLAG_INITIALIZED_HEALTH))) - initialize_health(host); - - health_execute_delayed_initializations(host); - - rrdcalc_delete_alerts_not_matching_host_labels_from_this_host(host); - - if (unlikely(apply_hibernation_delay)) { - nd_log(NDLS_DAEMON, NDLP_DEBUG, - "[%s]: Postponing health checks for %"PRId64" seconds.", - rrdhost_hostname(host), - (int64_t)hibernation_delay); - - host->health.health_delay_up_to = now + hibernation_delay; - } - - if (unlikely(host->health.health_delay_up_to)) { - if (unlikely(now < host->health.health_delay_up_to)) { - continue; - } - - nd_log(NDLS_DAEMON, NDLP_DEBUG, - "[%s]: Resuming health checks after delay.", - rrdhost_hostname(host)); - - host->health.health_delay_up_to = 0; - } - - // wait until cleanup of obsolete charts on children is complete - if (host != localhost) { - if (unlikely(host->trigger_chart_obsoletion_check == 1)) { - - nd_log(NDLS_DAEMON, NDLP_DEBUG, - "[%s]: Waiting for chart obsoletion check.", - rrdhost_hostname(host)); - - continue; - } - } - - if (!health_running_logged) { - nd_log(NDLS_DAEMON, NDLP_DEBUG, - "[%s]: Health is running.", - rrdhost_hostname(host)); - - health_running_logged = true; - } - - worker_is_busy(WORKER_HEALTH_JOB_HOST_LOCK); - - // the first loop is to lookup values from the db - foreach_rrdcalc_in_rrdhost_read(host, rc) { - - if(unlikely(!service_running(SERVICE_HEALTH))) - break; - - rrdcalc_update_info_using_rrdset_labels(rc); - - if (update_disabled_silenced(host, rc)) - continue; - - // create an alert removed event if the chart is obsolete and - // has stopped being collected for 60 seconds - if (unlikely(rc->rrdset && rc->status != RRDCALC_STATUS_REMOVED && - rrdset_flag_check(rc->rrdset, RRDSET_FLAG_OBSOLETE) && - now > (rc->rrdset->last_collected_time.tv_sec + 60))) { - if (!rrdcalc_isrepeating(rc)) { - worker_is_busy(WORKER_HEALTH_JOB_ALARM_LOG_ENTRY); - time_t now = now_realtime_sec(); - - ALARM_ENTRY *ae = health_create_alarm_entry( - host, - rc->id, - rc->next_event_id++, - rc->config_hash_id, - now, - rc->name, - rc->rrdset->id, - rc->rrdset->context, - rc->rrdset->name, - rc->classification, - rc->component, - rc->type, - rc->exec, - rc->recipient, - now - rc->last_status_change, - rc->value, - NAN, - rc->status, - RRDCALC_STATUS_REMOVED, - rc->source, - rc->units, - rc->summary, - rc->info, - 0, - rrdcalc_isrepeating(rc)?HEALTH_ENTRY_FLAG_IS_REPEATING:0); - - if (ae) { - health_log_alert(host, ae); - health_alarm_log_add_entry(host, ae); - rc->old_status = rc->status; - rc->status = RRDCALC_STATUS_REMOVED; - rc->last_status_change = now; - rc->last_status_change_value = rc->value; - rc->last_updated = now; - rc->value = NAN; - rc->ae = ae; - -#ifdef ENABLE_ACLK - if (netdata_cloud_enabled) - sql_queue_alarm_to_aclk(host, ae, true); -#endif - } - } - } - - if (unlikely(!rrdcalc_isrunnable(rc, now, &next_run))) { - if (unlikely(rc->run_flags & RRDCALC_FLAG_RUNNABLE)) - rc->run_flags &= ~RRDCALC_FLAG_RUNNABLE; - continue; - } - - runnable++; - rc->old_value = rc->value; - rc->run_flags |= RRDCALC_FLAG_RUNNABLE; - - // ------------------------------------------------------------ - // if there is database lookup, do it - - if (unlikely(RRDCALC_HAS_DB_LOOKUP(rc))) { - worker_is_busy(WORKER_HEALTH_JOB_DB_QUERY); - - /* time_t old_db_timestamp = rc->db_before; */ - int value_is_null = 0; - - int ret = rrdset2value_api_v1(rc->rrdset, NULL, &rc->value, rrdcalc_dimensions(rc), 1, - rc->after, rc->before, rc->group, NULL, - 0, rc->options | RRDR_OPTION_SELECTED_TIER, - &rc->db_after,&rc->db_before, - NULL, NULL, NULL, - &value_is_null, NULL, 0, 0, - QUERY_SOURCE_HEALTH, STORAGE_PRIORITY_LOW); - - if (unlikely(ret != 200)) { - // database lookup failed - rc->value = NAN; - rc->run_flags |= RRDCALC_FLAG_DB_ERROR; - - netdata_log_debug(D_HEALTH, "Health on host '%s', alarm '%s.%s': database lookup returned error %d", - rrdhost_hostname(host), rrdcalc_chart_name(rc), rrdcalc_name(rc), ret - ); - } else - rc->run_flags &= ~RRDCALC_FLAG_DB_ERROR; - - if (unlikely(value_is_null)) { - // collected value is null - rc->value = NAN; - rc->run_flags |= RRDCALC_FLAG_DB_NAN; - - netdata_log_debug(D_HEALTH, - "Health on host '%s', alarm '%s.%s': database lookup returned empty value (possibly value is not collected yet)", - rrdhost_hostname(host), rrdcalc_chart_name(rc), rrdcalc_name(rc) - ); - } else - rc->run_flags &= ~RRDCALC_FLAG_DB_NAN; - - netdata_log_debug(D_HEALTH, "Health on host '%s', alarm '%s.%s': database lookup gave value " NETDATA_DOUBLE_FORMAT, - rrdhost_hostname(host), rrdcalc_chart_name(rc), rrdcalc_name(rc), rc->value - ); - } - - // ------------------------------------------------------------ - // if there is calculation expression, run it - - if (unlikely(rc->calculation)) { - worker_is_busy(WORKER_HEALTH_JOB_CALC_EVAL); - - if (unlikely(!expression_evaluate(rc->calculation))) { - // calculation failed - rc->value = NAN; - rc->run_flags |= RRDCALC_FLAG_CALC_ERROR; - - netdata_log_debug(D_HEALTH, "Health on host '%s', alarm '%s.%s': expression '%s' failed: %s", - rrdhost_hostname(host), rrdcalc_chart_name(rc), rrdcalc_name(rc), - rc->calculation->parsed_as, buffer_tostring(rc->calculation->error_msg) - ); - } else { - rc->run_flags &= ~RRDCALC_FLAG_CALC_ERROR; - - netdata_log_debug(D_HEALTH, "Health on host '%s', alarm '%s.%s': expression '%s' gave value " - NETDATA_DOUBLE_FORMAT - ": %s (source: %s)", rrdhost_hostname(host), rrdcalc_chart_name(rc), rrdcalc_name(rc), - rc->calculation->parsed_as, rc->calculation->result, - buffer_tostring(rc->calculation->error_msg), rrdcalc_source(rc) - ); - - rc->value = rc->calculation->result; - } - } - } - foreach_rrdcalc_in_rrdhost_done(rc); - - if (unlikely(runnable && service_running(SERVICE_HEALTH))) { - foreach_rrdcalc_in_rrdhost_read(host, rc) { - if(unlikely(!service_running(SERVICE_HEALTH))) - break; - - if (unlikely(!(rc->run_flags & RRDCALC_FLAG_RUNNABLE))) - continue; - - if (rc->run_flags & RRDCALC_FLAG_DISABLED) { - continue; - } - RRDCALC_STATUS warning_status = RRDCALC_STATUS_UNDEFINED; - RRDCALC_STATUS critical_status = RRDCALC_STATUS_UNDEFINED; - - // -------------------------------------------------------- - // check the warning expression - - if (likely(rc->warning)) { - worker_is_busy(WORKER_HEALTH_JOB_WARNING_EVAL); - - if (unlikely(!expression_evaluate(rc->warning))) { - // calculation failed - rc->run_flags |= RRDCALC_FLAG_WARN_ERROR; - - netdata_log_debug(D_HEALTH, - "Health on host '%s', alarm '%s.%s': warning expression failed with error: %s", - rrdhost_hostname(host), rrdcalc_chart_name(rc), rrdcalc_name(rc), - buffer_tostring(rc->warning->error_msg) - ); - } else { - rc->run_flags &= ~RRDCALC_FLAG_WARN_ERROR; - netdata_log_debug(D_HEALTH, "Health on host '%s', alarm '%s.%s': warning expression gave value " - NETDATA_DOUBLE_FORMAT - ": %s (source: %s)", rrdhost_hostname(host), rrdcalc_chart_name(rc), - rrdcalc_name(rc), rc->warning->result, buffer_tostring(rc->warning->error_msg), rrdcalc_source(rc) - ); - warning_status = rrdcalc_value2status(rc->warning->result); - } - } - - // -------------------------------------------------------- - // check the critical expression - - if (likely(rc->critical)) { - worker_is_busy(WORKER_HEALTH_JOB_CRITICAL_EVAL); - - if (unlikely(!expression_evaluate(rc->critical))) { - // calculation failed - rc->run_flags |= RRDCALC_FLAG_CRIT_ERROR; - - netdata_log_debug(D_HEALTH, - "Health on host '%s', alarm '%s.%s': critical expression failed with error: %s", - rrdhost_hostname(host), rrdcalc_chart_name(rc), rrdcalc_name(rc), - buffer_tostring(rc->critical->error_msg) - ); - } else { - rc->run_flags &= ~RRDCALC_FLAG_CRIT_ERROR; - netdata_log_debug(D_HEALTH, "Health on host '%s', alarm '%s.%s': critical expression gave value " - NETDATA_DOUBLE_FORMAT - ": %s (source: %s)", rrdhost_hostname(host), rrdcalc_chart_name(rc), - rrdcalc_name(rc), rc->critical->result, buffer_tostring(rc->critical->error_msg), - rrdcalc_source(rc) - ); - critical_status = rrdcalc_value2status(rc->critical->result); - } - } - - // -------------------------------------------------------- - // decide the final alarm status - - RRDCALC_STATUS status = RRDCALC_STATUS_UNDEFINED; - - switch (warning_status) { - case RRDCALC_STATUS_CLEAR: - status = RRDCALC_STATUS_CLEAR; - break; - - case RRDCALC_STATUS_RAISED: - status = RRDCALC_STATUS_WARNING; - break; - - default: - break; - } - - switch (critical_status) { - case RRDCALC_STATUS_CLEAR: - if (status == RRDCALC_STATUS_UNDEFINED) - status = RRDCALC_STATUS_CLEAR; - break; - - case RRDCALC_STATUS_RAISED: - status = RRDCALC_STATUS_CRITICAL; - break; - - default: - break; - } - - // -------------------------------------------------------- - // check if the new status and the old differ - - if (status != rc->status) { - - worker_is_busy(WORKER_HEALTH_JOB_ALARM_LOG_ENTRY); - int delay = 0; - - // apply trigger hysteresis - - if (now > rc->delay_up_to_timestamp) { - rc->delay_up_current = rc->delay_up_duration; - rc->delay_down_current = rc->delay_down_duration; - rc->delay_last = 0; - rc->delay_up_to_timestamp = 0; - } else { - rc->delay_up_current = (int) (rc->delay_up_current * rc->delay_multiplier); - if (rc->delay_up_current > rc->delay_max_duration) - rc->delay_up_current = rc->delay_max_duration; - - rc->delay_down_current = (int) (rc->delay_down_current * rc->delay_multiplier); - if (rc->delay_down_current > rc->delay_max_duration) - rc->delay_down_current = rc->delay_max_duration; - } - - if (status > rc->status) - delay = rc->delay_up_current; - else - delay = rc->delay_down_current; - - // COMMENTED: because we do need to send raising alarms - // if(now + delay < rc->delay_up_to_timestamp) - // delay = (int)(rc->delay_up_to_timestamp - now); - - rc->delay_last = delay; - rc->delay_up_to_timestamp = now + delay; - - ALARM_ENTRY *ae = health_create_alarm_entry( - host, - rc->id, - rc->next_event_id++, - rc->config_hash_id, - now, - rc->name, - rc->rrdset->id, - rc->rrdset->context, - rc->rrdset->name, - rc->classification, - rc->component, - rc->type, - rc->exec, - rc->recipient, - now - rc->last_status_change, - rc->old_value, - rc->value, - rc->status, - status, - rc->source, - rc->units, - rc->summary, - rc->info, - rc->delay_last, - ( - ((rc->options & RRDCALC_OPTION_NO_CLEAR_NOTIFICATION)? HEALTH_ENTRY_FLAG_NO_CLEAR_NOTIFICATION : 0) | - ((rc->run_flags & RRDCALC_FLAG_SILENCED)? HEALTH_ENTRY_FLAG_SILENCED : 0) | - (rrdcalc_isrepeating(rc)?HEALTH_ENTRY_FLAG_IS_REPEATING:0) - ) - ); - - health_log_alert(host, ae); - health_alarm_log_add_entry(host, ae); - - nd_log(NDLS_DAEMON, NDLP_DEBUG, - "[%s]: Alert event for [%s.%s], value [%s], status [%s].", - rrdhost_hostname(host), ae_chart_id(ae), ae_name(ae), ae_new_value_string(ae), - rrdcalc_status2string(ae->new_status)); - - rc->last_status_change_value = rc->value; - rc->last_status_change = now; - rc->old_status = rc->status; - rc->status = status; - rc->ae = ae; - - if(unlikely(rrdcalc_isrepeating(rc))) { - rc->last_repeat = now; - if (rc->status == RRDCALC_STATUS_CLEAR) - rc->run_flags |= RRDCALC_FLAG_RUN_ONCE; - } - } - - rc->last_updated = now; - rc->next_update = now + rc->update_every; - - if (next_run > rc->next_update) - next_run = rc->next_update; - } - foreach_rrdcalc_in_rrdhost_done(rc); - - // process repeating alarms - foreach_rrdcalc_in_rrdhost_read(host, rc) { - if(unlikely(!service_running(SERVICE_HEALTH))) - break; - - int repeat_every = 0; - if(unlikely(rrdcalc_isrepeating(rc) && rc->delay_up_to_timestamp <= now)) { - if(unlikely(rc->status == RRDCALC_STATUS_WARNING)) { - rc->run_flags &= ~RRDCALC_FLAG_RUN_ONCE; - repeat_every = rc->warn_repeat_every; - } else if(unlikely(rc->status == RRDCALC_STATUS_CRITICAL)) { - rc->run_flags &= ~RRDCALC_FLAG_RUN_ONCE; - repeat_every = rc->crit_repeat_every; - } else if(unlikely(rc->status == RRDCALC_STATUS_CLEAR)) { - if(!(rc->run_flags & RRDCALC_FLAG_RUN_ONCE)) { - if(rc->old_status == RRDCALC_STATUS_CRITICAL) { - repeat_every = 1; - } else if (rc->old_status == RRDCALC_STATUS_WARNING) { - repeat_every = 1; - } - } - } - } else { - continue; - } - - if(unlikely(repeat_every > 0 && (rc->last_repeat + repeat_every) <= now)) { - worker_is_busy(WORKER_HEALTH_JOB_ALARM_LOG_ENTRY); - rc->last_repeat = now; - if (likely(rc->times_repeat < UINT32_MAX)) rc->times_repeat++; - ALARM_ENTRY *ae = health_create_alarm_entry( - host, - rc->id, - rc->next_event_id++, - rc->config_hash_id, - now, - rc->name, - rc->rrdset->id, - rc->rrdset->context, - rc->rrdset->name, - rc->classification, - rc->component, - rc->type, - rc->exec, - rc->recipient, - now - rc->last_status_change, - rc->old_value, - rc->value, - rc->old_status, - rc->status, - rc->source, - rc->units, - rc->summary, - rc->info, - rc->delay_last, - ( - ((rc->options & RRDCALC_OPTION_NO_CLEAR_NOTIFICATION)? HEALTH_ENTRY_FLAG_NO_CLEAR_NOTIFICATION : 0) | - ((rc->run_flags & RRDCALC_FLAG_SILENCED)? HEALTH_ENTRY_FLAG_SILENCED : 0) | - (rrdcalc_isrepeating(rc)?HEALTH_ENTRY_FLAG_IS_REPEATING:0) - ) - ); - - health_log_alert(host, ae); - ae->last_repeat = rc->last_repeat; - if (!(rc->run_flags & RRDCALC_FLAG_RUN_ONCE) && rc->status == RRDCALC_STATUS_CLEAR) { - ae->flags |= HEALTH_ENTRY_RUN_ONCE; - } - rc->run_flags |= RRDCALC_FLAG_RUN_ONCE; - health_process_notifications(host, ae); - netdata_log_debug(D_HEALTH, "Notification sent for the repeating alarm %u.", ae->alarm_id); - health_alarm_wait_for_execution(ae); - health_alarm_log_free_one_nochecks_nounlink(ae); - } - } - foreach_rrdcalc_in_rrdhost_done(rc); - } - - if (unlikely(!service_running(SERVICE_HEALTH))) - break; - - // execute notifications - // and cleanup - worker_is_busy(WORKER_HEALTH_JOB_ALARM_LOG_PROCESS); - health_alarm_log_process(host); - - if (unlikely(!service_running(SERVICE_HEALTH))) { - // wait for all notifications to finish before allowing health to be cleaned up - ALARM_ENTRY *ae; - while (NULL != (ae = alarm_notifications_in_progress.head)) { - if(unlikely(!service_running(SERVICE_HEALTH))) - break; - - health_alarm_wait_for_execution(ae); - } - break; - } -#ifdef ENABLE_ACLK - if (netdata_cloud_enabled) { - struct aclk_sync_cfg_t *wc = host->aclk_config; - if (unlikely(!wc)) - continue; - - if (wc->alert_queue_removed == 1) { - sql_queue_removed_alerts_to_aclk(host); - } else if (wc->alert_queue_removed > 1) { - wc->alert_queue_removed--; - } - - if (wc->alert_checkpoint_req == 1) { - aclk_push_alarm_checkpoint(host); - } else if (wc->alert_checkpoint_req > 1) { - wc->alert_checkpoint_req--; - } - } -#endif - } - dfe_done(host); - - // wait for all notifications to finish before allowing health to be cleaned up - ALARM_ENTRY *ae; - while (NULL != (ae = alarm_notifications_in_progress.head)) { - if(unlikely(!service_running(SERVICE_HEALTH))) - break; - - health_alarm_wait_for_execution(ae); - } - - if(unlikely(!service_running(SERVICE_HEALTH))) - break; - - health_sleep(next_run, loop); - - } // forever - - netdata_thread_cleanup_pop(1); - return NULL; -} diff --git a/health/health.d/adaptec_raid.conf b/health/health.d/adaptec_raid.conf deleted file mode 100644 index 1f184049..00000000 --- a/health/health.d/adaptec_raid.conf +++ /dev/null @@ -1,32 +0,0 @@ - -# logical device status check - - template: adaptec_raid_ld_status - on: adaptec_raid.ld_status - class: Errors - type: System -component: RAID - lookup: max -10s foreach * - units: bool - every: 10s - crit: $this > 0 - delay: down 5m multiplier 1.5 max 1h - summary: Adaptec raid logical device status - info: Logical device status is failed or degraded - to: sysadmin - -# physical device state check - - template: adaptec_raid_pd_state - on: adaptec_raid.pd_state - class: Errors - type: System -component: RAID - lookup: max -10s foreach * - units: bool - every: 10s - crit: $this > 0 - delay: down 5m multiplier 1.5 max 1h - summary: Adaptec raid physical device state - info: Physical device state is not online - to: sysadmin diff --git a/health/health.d/anomalies.conf b/health/health.d/anomalies.conf deleted file mode 100644 index 269ae544..00000000 --- a/health/health.d/anomalies.conf +++ /dev/null @@ -1,23 +0,0 @@ -# raise a warning alarm if an anomaly probability is consistently above 50% - - template: anomalies_anomaly_probabilities - on: anomalies.probability - class: Errors - type: Netdata -component: ML - lookup: average -2m foreach * - every: 1m - warn: $this > 50 - info: average anomaly probability over the last 2 minutes - -# raise a warning alarm if an anomaly flag is consistently firing - - template: anomalies_anomaly_flags - on: anomalies.anomaly - class: Errors - type: Netdata -component: ML - lookup: sum -2m foreach * - every: 1m - warn: $this > 10 - info: number of anomalies in the last 2 minutes diff --git a/health/health.d/apcupsd.conf b/health/health.d/apcupsd.conf deleted file mode 100644 index 90a72af1..00000000 --- a/health/health.d/apcupsd.conf +++ /dev/null @@ -1,125 +0,0 @@ -# you can disable an alarm notification by setting the 'to' line to: silent - - template: apcupsd_10min_ups_load - on: apcupsd.load - class: Utilization - type: Power Supply -component: UPS - os: * - hosts: * - lookup: average -10m unaligned of percentage - units: % - every: 1m - warn: $this > (($status >= $WARNING) ? (70) : (80)) - delay: down 10m multiplier 1.5 max 1h - summary: APC UPS load - info: APC UPS average load over the last 10 minutes - to: sitemgr - -# Discussion in https://github.com/netdata/netdata/pull/3928: -# Fire the alarm as soon as it's going on battery (99% charge) and clear only when full. - template: apcupsd_ups_charge - on: apcupsd.charge - class: Errors - type: Power Supply -component: UPS - os: * - hosts: * - lookup: average -60s unaligned of charge - units: % - every: 60s - warn: $this < 100 - crit: $this < 40 - delay: down 10m multiplier 1.5 max 1h - summary: APC UPS battery charge - info: APC UPS average battery charge over the last minute - to: sitemgr - - template: apcupsd_last_collected_secs - on: apcupsd.load - class: Latency - type: Power Supply -component: UPS device - calc: $now - $last_collected_t - every: 10s - units: seconds ago - warn: $this > (($status >= $WARNING) ? ($update_every) : ( 5 * $update_every)) - delay: down 5m multiplier 1.5 max 1h - summary: APC UPS last collection - info: APC UPS number of seconds since the last successful data collection - to: sitemgr - -#Send out a warning when SELFTEST code is BT or NG. Code descriptions can be found at: -#http://www.apcupsd.org/manual/#:~:text=or%20N/A.-,SELFTEST,-The%20results%20of - template: apcupsd_selftest_warning - on: apcupsd.selftest - lookup: max -1s unaligned match-names of BT,NG - units: status - every: 10s - warn: $this == 1 - delay: up 0 down 15m multiplier 1.5 max 1h - info: APC UPS self-test failed due to insufficient battery capacity or due to overload. - to: sitemgr - -#Send out a warning when STATUS code is ONBATT,OVERLOAD,LOWBATT,REPLACEBATT,NOBATT,COMMLOST -#https://man.archlinux.org/man/apcaccess.8.en#:~:text=apcupsd%20was%20started-,STATUS,-%3A%20UPS%20status.%20One - - template: apcupsd_status_onbatt - on: apcupsd.status - lookup: max -1s unaligned match-names of ONBATT - units: status - every: 10s - warn: $this == 1 - delay: up 1m down 15m multiplier 1.5 max 1h - info: APC UPS has switched to battery power because the input power has failed - to: sitemgr - - template: apcupsd_status_overload - on: apcupsd.status - lookup: max -1s unaligned match-names of OVERLOAD - units: status - every: 10s - warn: $this == 1 - delay: up 0 down 15m multiplier 1.5 max 1h - info: APC UPS is overloaded and cannot supply enough power to the load - to: sitemgr - - template: apcupsd_status_lowbatt - on: apcupsd.status - lookup: max -1s unaligned match-names of LOWBATT - units: status - every: 10s - warn: $this == 1 - delay: up 0 down 15m multiplier 1.5 max 1h - info: APC UPS battery is low and needs to be recharged - to: sitemgr - - template: apcupsd_status_replacebatt - on: apcupsd.status - lookup: max -1s unaligned match-names of REPLACEBATT - units: status - every: 10s - warn: $this == 1 - delay: up 0 down 15m multiplier 1.5 max 1h - info: APC UPS battery has reached the end of its lifespan and needs to be replaced - to: sitemgr - - template: apcupsd_status_nobatt - on: apcupsd.status - lookup: max -1s unaligned match-names of NOBATT - units: status - every: 10s - warn: $this == 1 - delay: up 0 down 15m multiplier 1.5 max 1h - info: APC UPS has no battery - to: sitemgr - - template: apcupsd_status_commlost - on: apcupsd.status - lookup: max -1s unaligned match-names of COMMLOST - units: status - every: 10s - warn: $this == 1 - delay: up 0 down 15m multiplier 1.5 max 1h - info: APC UPS communication link is lost - to: sitemgr diff --git a/health/health.d/bcache.conf b/health/health.d/bcache.conf deleted file mode 100644 index 44617342..00000000 --- a/health/health.d/bcache.conf +++ /dev/null @@ -1,31 +0,0 @@ - - template: bcache_cache_errors - on: disk.bcache_cache_read_races - class: Errors - type: System -component: Disk - lookup: sum -1m unaligned absolute - units: errors - every: 1m - warn: $this > 0 - delay: up 2m down 1h multiplier 1.5 max 2h - summary: Bcache cache read race errors - info: Number of times data was read from the cache, \ - the bucket was reused and invalidated in the last 10 minutes \ - (when this occurs the data is reread from the backing device) - to: silent - - template: bcache_cache_dirty - on: disk.bcache_cache_alloc - class: Utilization - type: System -component: Disk - calc: $dirty + $metadata + $undefined - units: % - every: 1m - warn: $this > 75 - delay: up 1m down 1h multiplier 1.5 max 2h - summary: Bcache cache used space - info: Percentage of cache space used for dirty data and metadata \ - (this usually means your SSD cache is too small) - to: silent diff --git a/health/health.d/beanstalkd.conf b/health/health.d/beanstalkd.conf deleted file mode 100644 index 0d37f28e..00000000 --- a/health/health.d/beanstalkd.conf +++ /dev/null @@ -1,41 +0,0 @@ -# get the number of buried jobs in all queues - - template: beanstalk_server_buried_jobs - on: beanstalk.current_jobs - class: Workload - type: Messaging -component: Beanstalk - calc: $buried - units: jobs - every: 10s - warn: $this > 3 - delay: up 0 down 5m multiplier 1.2 max 1h - summary: Beanstalk buried jobs - info: Number of buried jobs across all tubes. \ - You need to manually kick them so they can be processed. \ - Presence of buried jobs in a tube does not affect new jobs. - to: sysadmin - -# get the number of buried jobs per queue - -#template: beanstalk_tube_buried_jobs -# on: beanstalk.jobs -# calc: $buried -# units: jobs -# every: 10s -# warn: $this > 0 -# crit: $this > 10 -# delay: up 0 down 5m multiplier 1.2 max 1h -# info: the number of jobs buried per tube -# to: sysadmin - -# get the current number of tubes - -#template: beanstalk_number_of_tubes -# on: beanstalk.current_tubes -# calc: $tubes -# every: 10s -# warn: $this < 5 -# delay: up 0 down 5m multiplier 1.2 max 1h -# info: the current number of tubes on the server -# to: sysadmin diff --git a/health/health.d/bind_rndc.conf b/health/health.d/bind_rndc.conf deleted file mode 100644 index b1c271df..00000000 --- a/health/health.d/bind_rndc.conf +++ /dev/null @@ -1,12 +0,0 @@ - template: bind_rndc_stats_file_size - on: bind_rndc.stats_size - class: Utilization - type: DNS -component: BIND - units: megabytes - every: 60 - calc: $stats_size - warn: $this > 512 - summary: BIND statistics file size - info: BIND statistics-file size - to: sysadmin diff --git a/health/health.d/boinc.conf b/health/health.d/boinc.conf deleted file mode 100644 index 092a5684..00000000 --- a/health/health.d/boinc.conf +++ /dev/null @@ -1,70 +0,0 @@ -# Alarms for various BOINC issues. - -# Warn on any compute errors encountered. - template: boinc_compute_errors - on: boinc.states - class: Errors - type: Computing -component: BOINC - os: * - hosts: * - lookup: average -10m unaligned of comperror - units: tasks - every: 1m - warn: $this > 0 - delay: up 1m down 5m multiplier 1.5 max 1h - summary: BOINC compute errors - info: Average number of compute errors over the last 10 minutes - to: sysadmin - -# Warn on lots of upload errors - template: boinc_upload_errors - on: boinc.states - class: Errors - type: Computing -component: BOINC - os: * - hosts: * - lookup: average -10m unaligned of upload_failed - units: tasks - every: 1m - warn: $this > 0 - delay: up 1m down 5m multiplier 1.5 max 1h - summary: BOINC failed uploads - info: Average number of failed uploads over the last 10 minutes - to: sysadmin - -# Warn on the task queue being empty - template: boinc_total_tasks - on: boinc.tasks - class: Utilization - type: Computing -component: BOINC - os: * - hosts: * - lookup: average -10m unaligned of total - units: tasks - every: 1m - warn: $this < 1 - delay: up 5m down 10m multiplier 1.5 max 1h - summary: BOINC total tasks - info: Average number of total tasks over the last 10 minutes - to: sysadmin - -# Warn on no active tasks with a non-empty queue - template: boinc_active_tasks - on: boinc.tasks - class: Utilization - type: Computing -component: BOINC - os: * - hosts: * - lookup: average -10m unaligned of active - calc: ($boinc_total_tasks >= 1) ? ($this) : (inf) - units: tasks - every: 1m - warn: $this < 1 - delay: up 5m down 10m multiplier 1.5 max 1h - summary: BOINC active tasks - info: Average number of active tasks over the last 10 minutes - to: sysadmin diff --git a/health/health.d/btrfs.conf b/health/health.d/btrfs.conf deleted file mode 100644 index 1557a594..00000000 --- a/health/health.d/btrfs.conf +++ /dev/null @@ -1,142 +0,0 @@ - - template: btrfs_allocated - on: btrfs.disk - class: Utilization - type: System -component: File system - os: * - hosts: * - calc: 100 - ($unallocated * 100 / ($unallocated + $data_used + $data_free + $meta_used + $meta_free + $sys_used + $sys_free)) - units: % - every: 10s - warn: $this > (($status == $CRITICAL) ? (95) : (98)) - delay: up 1m down 15m multiplier 1.5 max 1h - summary: BTRFS allocated space utilization - info: Percentage of allocated BTRFS physical disk space - to: silent - - template: btrfs_data - on: btrfs.data - class: Utilization - type: System -component: File system - os: * - hosts: * - calc: $used * 100 / ($used + $free) - units: % - every: 10s - warn: $this > (($status >= $WARNING) ? (90) : (95)) && $btrfs_allocated > 98 - crit: $this > (($status == $CRITICAL) ? (95) : (98)) && $btrfs_allocated > 98 - delay: up 1m down 15m multiplier 1.5 max 1h - summary: BTRFS data space utilization - info: Utilization of BTRFS data space - to: sysadmin - - template: btrfs_metadata - on: btrfs.metadata - class: Utilization - type: System -component: File system - os: * - hosts: * - calc: ($used + $reserved) * 100 / ($used + $free + $reserved) - units: % - every: 10s - warn: $this > (($status >= $WARNING) ? (90) : (95)) && $btrfs_allocated > 98 - crit: $this > (($status == $CRITICAL) ? (95) : (98)) && $btrfs_allocated > 98 - delay: up 1m down 15m multiplier 1.5 max 1h - summary: BTRFS metadata space utilization - info: Utilization of BTRFS metadata space - to: sysadmin - - template: btrfs_system - on: btrfs.system - class: Utilization - type: System -component: File system - os: * - hosts: * - calc: $used * 100 / ($used + $free) - units: % - every: 10s - warn: $this > (($status >= $WARNING) ? (90) : (95)) && $btrfs_allocated > 98 - crit: $this > (($status == $CRITICAL) ? (95) : (98)) && $btrfs_allocated > 98 - delay: up 1m down 15m multiplier 1.5 max 1h - summary: BTRFS system space utilization - info: Utilization of BTRFS system space - to: sysadmin - - template: btrfs_device_read_errors - on: btrfs.device_errors - class: Errors - type: System -component: File system - os: * - hosts: * - units: errors - lookup: max -10m every 1m of read_errs - warn: $this > 0 - delay: up 1m down 15m multiplier 1.5 max 1h - summary: BTRFS device read errors - info: Number of encountered BTRFS read errors - to: sysadmin - - template: btrfs_device_write_errors - on: btrfs.device_errors - class: Errors - type: System -component: File system - os: * - hosts: * - units: errors - lookup: max -10m every 1m of write_errs - crit: $this > 0 - delay: up 1m down 15m multiplier 1.5 max 1h - summary: BTRFS device write errors - info: Number of encountered BTRFS write errors - to: sysadmin - - template: btrfs_device_flush_errors - on: btrfs.device_errors - class: Errors - type: System -component: File system - os: * - hosts: * - units: errors - lookup: max -10m every 1m of flush_errs - crit: $this > 0 - delay: up 1m down 15m multiplier 1.5 max 1h - summary: BTRFS device flush errors - info: Number of encountered BTRFS flush errors - to: sysadmin - - template: btrfs_device_corruption_errors - on: btrfs.device_errors - class: Errors - type: System -component: File system - os: * - hosts: * - units: errors - lookup: max -10m every 1m of corruption_errs - warn: $this > 0 - delay: up 1m down 15m multiplier 1.5 max 1h - summary: BTRFS device corruption errors - info: Number of encountered BTRFS corruption errors - to: sysadmin - - template: btrfs_device_generation_errors - on: btrfs.device_errors - class: Errors - type: System -component: File system - os: * - hosts: * - units: errors - lookup: max -10m every 1m of generation_errs - warn: $this > 0 - delay: up 1m down 15m multiplier 1.5 max 1h - summary: BTRFS device generation errors - info: Number of encountered BTRFS generation errors - to: sysadmin diff --git a/health/health.d/ceph.conf b/health/health.d/ceph.conf deleted file mode 100644 index 44d35133..00000000 --- a/health/health.d/ceph.conf +++ /dev/null @@ -1,16 +0,0 @@ -# low ceph disk available - - template: ceph_cluster_space_usage - on: ceph.general_usage - class: Utilization - type: Storage -component: Ceph - calc: $used * 100 / ($used + $avail) - units: % - every: 1m - warn: $this > (($status >= $WARNING ) ? (85) : (90)) - crit: $this > (($status == $CRITICAL) ? (90) : (98)) - delay: down 5m multiplier 1.2 max 1h - summary: Ceph cluster disk space utilization - info: Ceph cluster disk space utilization - to: sysadmin diff --git a/health/health.d/cgroups.conf b/health/health.d/cgroups.conf deleted file mode 100644 index 9c55633e..00000000 --- a/health/health.d/cgroups.conf +++ /dev/null @@ -1,72 +0,0 @@ - -# you can disable an alarm notification by setting the 'to' line to: silent - - template: cgroup_10min_cpu_usage - on: cgroup.cpu_limit - class: Utilization - type: Cgroups -component: CPU - os: linux - hosts: * - lookup: average -10m unaligned - units: % - every: 1m - warn: $this > (($status == $CRITICAL) ? (85) : (95)) - delay: down 15m multiplier 1.5 max 1h - summary: Cgroup ${label:cgroup_name} CPU utilization - info: Cgroup ${label:cgroup_name} average CPU utilization over the last 10 minutes - to: silent - - template: cgroup_ram_in_use - on: cgroup.mem_usage - class: Utilization - type: Cgroups -component: Memory - os: linux - hosts: * - calc: ($ram) * 100 / $memory_limit - units: % - every: 10s - warn: $this > (($status >= $WARNING) ? (80) : (90)) - crit: $this > (($status == $CRITICAL) ? (90) : (98)) - delay: down 15m multiplier 1.5 max 1h - summary: Cgroup ${label:cgroup_name} memory utilization - info: Cgroup ${label:cgroup_name} memory utilization - to: silent - -# ---------------------------------K8s containers-------------------------------------------- - - template: k8s_cgroup_10min_cpu_usage - on: k8s.cgroup.cpu_limit - class: Utilization - type: Cgroups -component: CPU - os: linux - hosts: * - lookup: average -10m unaligned - units: % - every: 1m - warn: $this > (($status >= $WARNING) ? (75) : (85)) - delay: down 15m multiplier 1.5 max 1h - summary: Container ${label:k8s_container_name} pod ${label:k8s_pod_name} CPU utilization - info: Container ${label:k8s_container_name} of pod ${label:k8s_pod_name} of namespace ${label:k8s_namespace}, \ - average CPU utilization over the last 10 minutes - to: silent - - template: k8s_cgroup_ram_in_use - on: k8s.cgroup.mem_usage - class: Utilization - type: Cgroups -component: Memory - os: linux - hosts: * - calc: ($ram) * 100 / $memory_limit - units: % - every: 10s - warn: $this > (($status >= $WARNING) ? (80) : (90)) - crit: $this > (($status == $CRITICAL) ? (90) : (98)) - delay: down 15m multiplier 1.5 max 1h - summary: Container ${label:k8s_container_name} pod ${label:k8s_pod_name} memory utilization - info: container ${label:k8s_container_name} of pod ${label:k8s_pod_name} of namespace ${label:k8s_namespace}, \ - memory utilization - to: silent diff --git a/health/health.d/cockroachdb.conf b/health/health.d/cockroachdb.conf deleted file mode 100644 index 60f17835..00000000 --- a/health/health.d/cockroachdb.conf +++ /dev/null @@ -1,78 +0,0 @@ - -# Capacity - - template: cockroachdb_used_storage_capacity - on: cockroachdb.storage_used_capacity_percentage - class: Utilization - type: Database -component: CockroachDB - calc: $total - units: % - every: 10s - warn: $this > (($status >= $WARNING) ? (80) : (85)) - crit: $this > (($status == $CRITICAL) ? (85) : (95)) - delay: down 15m multiplier 1.5 max 1h - summary: CockroachDB storage space utilization - info: Storage capacity utilization - to: dba - - template: cockroachdb_used_usable_storage_capacity - on: cockroachdb.storage_used_capacity_percentage - class: Utilization - type: Database -component: CockroachDB - calc: $usable - units: % - every: 10s - warn: $this > (($status >= $WARNING) ? (80) : (85)) - crit: $this > (($status == $CRITICAL) ? (85) : (95)) - delay: down 15m multiplier 1.5 max 1h - summary: CockroachDB usable storage space utilization - info: Storage usable space utilization - to: dba - -# Replication - - template: cockroachdb_unavailable_ranges - on: cockroachdb.ranges_replication_problem - class: Errors - type: Database -component: CockroachDB - calc: $unavailable - units: num - every: 10s - warn: $this > 0 - delay: down 15m multiplier 1.5 max 1h - summary: CockroachDB unavailable replication - info: Number of ranges with fewer live replicas than needed for quorum - to: dba - - template: cockroachdb_underreplicated_ranges - on: cockroachdb.ranges_replication_problem - class: Errors - type: Database -component: CockroachDB - calc: $under_replicated - units: num - every: 10s - warn: $this > 0 - delay: down 15m multiplier 1.5 max 1h - summary: CockroachDB under-replicated - info: Number of ranges with fewer live replicas than the replication target - to: dba - -# FD - - template: cockroachdb_open_file_descriptors_limit - on: cockroachdb.process_file_descriptors - class: Utilization - type: Database -component: CockroachDB - calc: $open/$sys_fd_softlimit * 100 - units: % - every: 10s - warn: $this > 80 - delay: down 15m multiplier 1.5 max 1h - summary: CockroachDB file descriptors utilization - info: Open file descriptors utilization (against softlimit) - to: dba diff --git a/health/health.d/consul.conf b/health/health.d/consul.conf deleted file mode 100644 index 8b414a26..00000000 --- a/health/health.d/consul.conf +++ /dev/null @@ -1,171 +0,0 @@ -# you can disable an alarm notification by setting the 'to' line to: silent - - template: consul_license_expiration_time - on: consul.license_expiration_time - class: Errors - type: ServiceMesh -component: Consul - calc: $license_expiration - every: 60m - units: seconds - warn: $this < 14*24*60*60 - crit: $this < 7*24*60*60 - summary: Consul license expiration on ${label:node_name} - info: Consul Enterprise license expiration time on node ${label:node_name} datacenter ${label:datacenter} - to: sysadmin - - template: consul_autopilot_health_status - on: consul.autopilot_health_status - class: Errors - type: ServiceMesh -component: Consul - calc: $unhealthy - every: 10s - units: status - warn: $this == 1 - delay: down 5m multiplier 1.5 max 1h - summary: Consul datacenter ${label:datacenter} health - info: Datacenter ${label:datacenter} cluster is unhealthy as reported by server ${label:node_name} - to: sysadmin - - template: consul_autopilot_server_health_status - on: consul.autopilot_server_health_status - class: Errors - type: ServiceMesh -component: Consul - calc: $unhealthy - every: 10s - units: status - warn: $this == 1 - delay: down 5m multiplier 1.5 max 1h - summary: Consul server ${label:node_name} health - info: Server ${label:node_name} from datacenter ${label:datacenter} is unhealthy - to: sysadmin - - template: consul_raft_leader_last_contact_time - on: consul.raft_leader_last_contact_time - class: Errors - type: ServiceMesh -component: Consul - lookup: average -1m unaligned of quantile_0.5 - every: 10s - units: milliseconds - warn: $this > (($status >= $WARNING) ? (150) : (200)) - crit: $this > (($status == $CRITICAL) ? (200) : (500)) - delay: down 5m multiplier 1.5 max 1h - summary: Consul leader server ${label:node_name} last contact time - info: Median time elapsed since leader server ${label:node_name} datacenter ${label:datacenter} was last able to contact the follower nodes - to: sysadmin - - template: consul_raft_leadership_transitions - on: consul.raft_leadership_transitions_rate - class: Errors - type: ServiceMesh -component: Consul - lookup: sum -1m unaligned - every: 10s - units: transitions - warn: $this > 0 - delay: down 5m multiplier 1.5 max 1h - summary: Consul server ${label:node_name} leadership transitions - info: There has been a leadership change and server ${label:node_name} datacenter ${label:datacenter} has become the leader - to: sysadmin - - template: consul_raft_thread_main_saturation - on: consul.raft_thread_main_saturation_perc - class: Utilization - type: ServiceMesh -component: Consul - lookup: average -1m unaligned of quantile_0.9 - every: 10s - units: percentage - warn: $this > (($status >= $WARNING) ? (40) : (50)) - delay: down 5m multiplier 1.5 max 1h - summary: Consul server ${label:node_name} main Raft saturation - info: Average saturation of the main Raft goroutine on server ${label:node_name} datacenter ${label:datacenter} - to: sysadmin - - template: consul_raft_thread_fsm_saturation - on: consul.raft_thread_fsm_saturation_perc - class: Utilization - type: ServiceMesh -component: Consul - lookup: average -1m unaligned of quantile_0.9 - every: 10s - units: milliseconds - warn: $this > (($status >= $WARNING) ? (40) : (50)) - delay: down 5m multiplier 1.5 max 1h - summary: Consul server ${label:node_name} FSM Raft saturation - info: Average saturation of the FSM Raft goroutine on server ${label:node_name} datacenter ${label:datacenter} - to: sysadmin - - template: consul_client_rpc_requests_exceeded - on: consul.client_rpc_requests_exceeded_rate - class: Errors - type: ServiceMesh -component: Consul - lookup: sum -1m unaligned - every: 10s - units: requests - warn: $this > (($status >= $WARNING) ? (0) : (5)) - delay: down 5m multiplier 1.5 max 1h - summary: Consul server ${label:node_name} RPC requests rate - info: Number of rate-limited RPC requests made by server ${label:node_name} datacenter ${label:datacenter} - to: sysadmin - - template: consul_client_rpc_requests_failed - on: consul.client_rpc_requests_failed_rate - class: Errors - type: ServiceMesh -component: Consul - lookup: sum -1m unaligned - every: 10s - units: requests - warn: $this > (($status >= $WARNING) ? (0) : (5)) - delay: down 5m multiplier 1.5 max 1h - summary: Consul server ${label:node_name} failed RPC requests - info: number of failed RPC requests made by server ${label:node_name} datacenter ${label:datacenter} - to: sysadmin - - template: consul_node_health_check_status - on: consul.node_health_check_status - class: Errors - type: ServiceMesh -component: Consul - calc: $warning + $critical - every: 10s - units: status - warn: $this != nan AND $this != 0 - delay: down 5m multiplier 1.5 max 1h - summary: Consul node health check ${label:check_name} on ${label:node_name} - info: Node health check ${label:check_name} has failed on server ${label:node_name} datacenter ${label:datacenter} - to: sysadmin - - template: consul_service_health_check_status - on: consul.service_health_check_status - class: Errors - type: ServiceMesh -component: Consul - calc: $warning + $critical - every: 10s - units: status - warn: $this == 1 - delay: down 5m multiplier 1.5 max 1h - summary: Consul service health check ${label:check_name} service ${label:service_name} node ${label:node_name} - info: Service health check ${label:check_name} for service ${label:service_name} has failed on server ${label:node_name} datacenter ${label:datacenter} - to: sysadmin - - template: consul_gc_pause_time - on: consul.gc_pause_time - class: Errors - type: ServiceMesh -component: Consul - lookup: sum -1m unaligned - every: 10s - units: seconds - warn: $this > (($status >= $WARNING) ? (1) : (2)) - crit: $this > (($status >= $WARNING) ? (2) : (5)) - delay: down 5m multiplier 1.5 max 1h - summary: Consul server ${label:node_name} garbage collection pauses - info: Time spent in stop-the-world garbage collection pauses on server ${label:node_name} datacenter ${label:datacenter} - to: sysadmin diff --git a/health/health.d/cpu.conf b/health/health.d/cpu.conf deleted file mode 100644 index 0b007d6b..00000000 --- a/health/health.d/cpu.conf +++ /dev/null @@ -1,69 +0,0 @@ - -# you can disable an alarm notification by setting the 'to' line to: silent - - template: 10min_cpu_usage - on: system.cpu - class: Utilization - type: System -component: CPU - os: linux - hosts: * - lookup: average -10m unaligned of user,system,softirq,irq,guest - units: % - every: 1m - warn: $this > (($status >= $WARNING) ? (75) : (85)) - crit: $this > (($status == $CRITICAL) ? (85) : (95)) - delay: down 15m multiplier 1.5 max 1h - summary: System CPU utilization - info: Average CPU utilization over the last 10 minutes (excluding iowait, nice and steal) - to: silent - - template: 10min_cpu_iowait - on: system.cpu - class: Utilization - type: System -component: CPU - os: linux - hosts: * - lookup: average -10m unaligned of iowait - units: % - every: 1m - warn: $this > (($status >= $WARNING) ? (20) : (40)) - delay: up 30m down 30m multiplier 1.5 max 2h - summary: System CPU iowait time - info: Average CPU iowait time over the last 10 minutes - to: silent - - template: 20min_steal_cpu - on: system.cpu - class: Latency - type: System -component: CPU - os: linux - hosts: * - lookup: average -20m unaligned of steal - units: % - every: 5m - warn: $this > (($status >= $WARNING) ? (5) : (10)) - delay: down 1h multiplier 1.5 max 2h - summary: System CPU steal time - info: Average CPU steal time over the last 20 minutes - to: silent - -## FreeBSD - template: 10min_cpu_usage - on: system.cpu - class: Utilization - type: System -component: CPU - os: freebsd - hosts: * - lookup: average -10m unaligned of user,system,interrupt - units: % - every: 1m - warn: $this > (($status >= $WARNING) ? (75) : (85)) - crit: $this > (($status == $CRITICAL) ? (85) : (95)) - delay: down 15m multiplier 1.5 max 1h - summary: System CPU utilization - info: Average CPU utilization over the last 10 minutes (excluding nice) - to: silent diff --git a/health/health.d/dbengine.conf b/health/health.d/dbengine.conf deleted file mode 100644 index 0a70d2e8..00000000 --- a/health/health.d/dbengine.conf +++ /dev/null @@ -1,68 +0,0 @@ - -# you can disable an alarm notification by setting the 'to' line to: silent - - alarm: 10min_dbengine_global_fs_errors - on: netdata.dbengine_global_errors - class: Errors - type: Netdata -component: DB engine - os: linux freebsd macos - hosts: * - lookup: sum -10m unaligned of fs_errors - units: errors - every: 10s - crit: $this > 0 - delay: down 15m multiplier 1.5 max 1h - summary: Netdata DBengine filesystem errors - info: Number of filesystem errors in the last 10 minutes (too many open files, wrong permissions, etc) - to: sysadmin - - alarm: 10min_dbengine_global_io_errors - on: netdata.dbengine_global_errors - class: Errors - type: Netdata -component: DB engine - os: linux freebsd macos - hosts: * - lookup: sum -10m unaligned of io_errors - units: errors - every: 10s - crit: $this > 0 - delay: down 1h multiplier 1.5 max 3h - summary: Netdata DBengine IO errors - info: Number of IO errors in the last 10 minutes (CRC errors, out of space, bad disk, etc) - to: sysadmin - - alarm: 10min_dbengine_global_flushing_warnings - on: netdata.dbengine_global_errors - class: Errors - type: Netdata -component: DB engine - os: linux freebsd macos - hosts: * - lookup: sum -10m unaligned of pg_cache_over_half_dirty_events - units: errors - every: 10s - warn: $this > 0 - delay: down 1h multiplier 1.5 max 3h - summary: Netdata DBengine global flushing warnings - info: number of times when dbengine dirty pages were over 50% of the instance's page cache in the last 10 minutes. \ - Metric data are at risk of not being stored in the database. To remedy, reduce disk load or use faster disks. - to: sysadmin - - alarm: 10min_dbengine_global_flushing_errors - on: netdata.dbengine_long_term_page_stats - class: Errors - type: Netdata -component: DB engine - os: linux freebsd macos - hosts: * - lookup: sum -10m unaligned of flushing_pressure_deletions - units: pages - every: 10s - crit: $this != 0 - delay: down 1h multiplier 1.5 max 3h - summary: Netdata DBengine global flushing errors - info: Number of pages deleted due to failure to flush data to disk in the last 10 minutes. \ - Metric data were lost to unblock data collection. To fix, reduce disk load or use faster disks. - to: sysadmin diff --git a/health/health.d/disks.conf b/health/health.d/disks.conf deleted file mode 100644 index 2e417fd4..00000000 --- a/health/health.d/disks.conf +++ /dev/null @@ -1,172 +0,0 @@ - -# you can disable an alarm notification by setting the 'to' line to: silent - - -# ----------------------------------------------------------------------------- -# low disk space - -# checking the latest collected values -# raise an alarm if the disk is low on -# available disk space - - template: disk_space_usage - on: disk.space - class: Utilization - type: System -component: Disk - os: linux freebsd - hosts: * -chart labels: mount_point=!/dev !/dev/* !/run !/run/* * - calc: $used * 100 / ($avail + $used) - units: % - every: 1m - warn: $this > (($status >= $WARNING ) ? (80) : (90)) - crit: ($this > (($status == $CRITICAL) ? (90) : (98))) && $avail < 5 - delay: up 1m down 15m multiplier 1.5 max 1h - summary: Disk ${label:mount_point} space usage - info: Total space utilization of disk ${label:mount_point} - to: sysadmin - - template: disk_inode_usage - on: disk.inodes - class: Utilization - type: System -component: Disk - os: linux freebsd - hosts: * -chart labels: mount_point=!/dev !/dev/* !/run !/run/* * - calc: $used * 100 / ($avail + $used) - units: % - every: 1m - warn: $this > (($status >= $WARNING) ? (80) : (90)) - crit: $this > (($status == $CRITICAL) ? (90) : (98)) - delay: up 1m down 15m multiplier 1.5 max 1h - summary: Disk ${label:mount_point} inode usage - info: Total inode utilization of disk ${label:mount_point} - to: sysadmin - - -# ----------------------------------------------------------------------------- -# disk fill rate - -# calculate the rate the disk fills -# use as base, the available space change -# during the last hour - -# this is just a calculation - it has no alarm -# we will use it in the next template to find -# the hours remaining - -template: disk_fill_rate - on: disk.space - os: linux freebsd - hosts: * - lookup: min -10m at -50m unaligned of avail - calc: ($this - $avail) / (($now - $after) / 3600) - every: 1m - units: GB/hour - info: average rate the disk fills up (positive), or frees up (negative) space, for the last hour - -# calculate the hours remaining -# if the disk continues to fill -# in this rate - -template: out_of_disk_space_time - on: disk.space - os: linux freebsd - hosts: * - calc: ($disk_fill_rate > 0) ? ($avail / $disk_fill_rate) : (inf) - units: hours - every: 10s - warn: $this > 0 and $this < (($status >= $WARNING) ? (48) : (8)) - crit: $this > 0 and $this < (($status == $CRITICAL) ? (24) : (2)) - delay: down 15m multiplier 1.2 max 1h - summary: Disk ${label:mount_point} estimation of lack of space - info: Estimated time the disk ${label:mount_point} will run out of space, if the system continues to add data with the rate of the last hour - to: silent - - -# ----------------------------------------------------------------------------- -# disk inode fill rate - -# calculate the rate the disk inodes are allocated -# use as base, the available inodes change -# during the last hour - -# this is just a calculation - it has no alarm -# we will use it in the next template to find -# the hours remaining - -template: disk_inode_rate - on: disk.inodes - os: linux freebsd - hosts: * - lookup: min -10m at -50m unaligned of avail - calc: ($this - $avail) / (($now - $after) / 3600) - every: 1m - units: inodes/hour - info: average rate at which disk inodes are allocated (positive), or freed (negative), for the last hour - -# calculate the hours remaining -# if the disk inodes are allocated -# in this rate - -template: out_of_disk_inodes_time - on: disk.inodes - os: linux freebsd - hosts: * - calc: ($disk_inode_rate > 0) ? ($avail / $disk_inode_rate) : (inf) - units: hours - every: 10s - warn: $this > 0 and $this < (($status >= $WARNING) ? (48) : (8)) - crit: $this > 0 and $this < (($status == $CRITICAL) ? (24) : (2)) - delay: down 15m multiplier 1.2 max 1h - summary: Disk ${label:mount_point} estimation of lack of inodes - info: Estimated time the disk ${label:mount_point} will run out of inodes, if the system continues to allocate inodes with the rate of the last hour - to: silent - - -# ----------------------------------------------------------------------------- -# disk congestion - -# raise an alarm if the disk is congested -# by calculating the average disk utilization -# for the last 10 minutes - - template: 10min_disk_utilization - on: disk.util - class: Utilization - type: System -component: Disk - os: linux freebsd - hosts: * - lookup: average -10m unaligned - units: % - every: 1m - warn: $this > 98 * (($status >= $WARNING) ? (0.7) : (1)) - delay: down 15m multiplier 1.2 max 1h - summary: Disk ${label:device} utilization - info: Average percentage of time ${label:device} disk was busy over the last 10 minutes - to: silent - - -# raise an alarm if the disk backlog -# is above 1000ms (1s) per second -# for 10 minutes -# (i.e. the disk cannot catch up) - - template: 10min_disk_backlog - on: disk.backlog - class: Latency - type: System -component: Disk - os: linux - hosts: * - lookup: average -10m unaligned - units: ms - every: 1m - warn: $this > 5000 * (($status >= $WARNING) ? (0.7) : (1)) - delay: down 15m multiplier 1.2 max 1h - summary: Disk ${label:device} backlog - info: Average backlog size of the ${label:device} disk over the last 10 minutes - to: silent diff --git a/health/health.d/dns_query.conf b/health/health.d/dns_query.conf deleted file mode 100644 index 756c6a1b..00000000 --- a/health/health.d/dns_query.conf +++ /dev/null @@ -1,15 +0,0 @@ -# detect dns query failure - - template: dns_query_query_status - on: dns_query.query_status - class: Errors - type: DNS -component: DNS - calc: $success - units: status - every: 10s - warn: $this != nan && $this != 1 - delay: up 30s down 5m multiplier 1.5 max 1h - summary: DNS query unsuccessful requests to ${label:server} - info: DNS request type ${label:record_type} to server ${label:server} is unsuccessful - to: sysadmin diff --git a/health/health.d/dnsmasq_dhcp.conf b/health/health.d/dnsmasq_dhcp.conf deleted file mode 100644 index f6ef0194..00000000 --- a/health/health.d/dnsmasq_dhcp.conf +++ /dev/null @@ -1,15 +0,0 @@ -# dhcp-range utilization - - template: dnsmasq_dhcp_dhcp_range_utilization - on: dnsmasq_dhcp.dhcp_range_utilization - class: Utilization - type: DHCP -component: Dnsmasq - every: 10s - units: % - calc: $used - warn: $this > ( ($status >= $WARNING ) ? ( 80 ) : ( 90 ) ) - delay: down 5m - summary: Dnsmasq DHCP range ${label:dhcp_range} utilization - info: DHCP range ${label:dhcp_range} utilization - to: sysadmin diff --git a/health/health.d/docker.conf b/health/health.d/docker.conf deleted file mode 100644 index 668614d4..00000000 --- a/health/health.d/docker.conf +++ /dev/null @@ -1,12 +0,0 @@ - template: docker_container_unhealthy - on: docker.container_health_status - class: Errors - type: Containers -component: Docker - units: status - every: 10s - lookup: average -10s of unhealthy - warn: $this > 0 - summary: Docker container ${label:container_name} health - info: ${label:container_name} docker container health status is unhealthy - to: sysadmin diff --git a/health/health.d/elasticsearch.conf b/health/health.d/elasticsearch.conf deleted file mode 100644 index 600840c5..00000000 --- a/health/health.d/elasticsearch.conf +++ /dev/null @@ -1,78 +0,0 @@ -# you can disable an alarm notification by setting the 'to' line to: silent - -# 'red' is a threshold, can't lookup the 'red' dimension - using simple pattern is a workaround. - - template: elasticsearch_cluster_health_status_red - on: elasticsearch.cluster_health_status - class: Errors - type: SearchEngine -component: Elasticsearch - lookup: average -5s unaligned of *ed - every: 10s - units: status - crit: $this == 1 - delay: down 5m multiplier 1.5 max 1h - summary: Elasticsearch cluster ${label:cluster_name} status - info: Elasticsearch cluster ${label:cluster_name} health status is red. - to: sysadmin - -# the idea of '-10m' is to handle yellow status after node restart, -# (usually) no action is required because Elasticsearch will automatically restore the green status. - template: elasticsearch_cluster_health_status_yellow - on: elasticsearch.cluster_health_status - class: Errors - type: SearchEngine -component: Elasticsearch - lookup: average -10m unaligned of yellow - every: 1m - units: status - warn: $this == 1 - delay: down 5m multiplier 1.5 max 1h - summary: Elasticsearch cluster ${label:cluster_name} status - info: Elasticsearch cluster ${label:cluster_name} health status is yellow. - to: sysadmin - - template: elasticsearch_node_index_health_red - on: elasticsearch.node_index_health - class: Errors - type: SearchEngine -component: Elasticsearch - lookup: average -5s unaligned of *ed - every: 10s - units: status - warn: $this == 1 - delay: down 5m multiplier 1.5 max 1h - summary: Elasticsearch cluster ${label:cluster_name} index ${label:index} status - info: Elasticsearch cluster ${label:cluster_name} index ${label:index} health status is red. - to: sysadmin - -# don't convert 'lookup' value to seconds in 'calc' due to UI showing seconds as hh:mm:ss (0 as now). - - template: elasticsearch_node_indices_search_time_query - on: elasticsearch.node_indices_search_time - class: Workload - type: SearchEngine -component: Elasticsearch - lookup: average -10m unaligned of query - every: 10s - units: milliseconds - warn: $this > (($status >= $WARNING) ? (20 * 1000) : (30 * 1000)) - delay: down 5m multiplier 1.5 max 1h - summary: Elasticsearch cluster ${label:cluster_name} node ${label:node_name} query performance - info: Elasticsearch cluster ${label:cluster_name} node ${label:node_name} search performance is degraded, queries run slowly. - to: sysadmin - - template: elasticsearch_node_indices_search_time_fetch - on: elasticsearch.node_indices_search_time - class: Workload - type: SearchEngine -component: Elasticsearch - lookup: average -10m unaligned of fetch - every: 10s - units: milliseconds - warn: $this > (($status >= $WARNING) ? (3 * 1000) : (5 * 1000)) - crit: $this > (($status == $CRITICAL) ? (5 * 1000) : (30 * 1000)) - delay: down 5m multiplier 1.5 max 1h - summary: Elasticsearch cluster ${label:cluster_name} node ${label:node_name} fetch performance - info: Elasticsearch cluster ${label:cluster_name} node ${label:node_name} search performance is degraded, fetches run slowly. - to: sysadmin diff --git a/health/health.d/entropy.conf b/health/health.d/entropy.conf deleted file mode 100644 index be8b1fe4..00000000 --- a/health/health.d/entropy.conf +++ /dev/null @@ -1,20 +0,0 @@ - -# check if entropy is too low -# the alarm is checked every 1 minute -# and examines the last hour of data - - alarm: lowest_entropy - on: system.entropy - class: Utilization - type: System -component: Cryptography - os: linux - hosts: * - lookup: min -5m unaligned - units: entries - every: 5m - warn: $this < (($status >= $WARNING) ? (200) : (100)) - delay: down 1h multiplier 1.5 max 2h - summary: System entropy pool number of entries - info: Minimum number of entries in the random numbers pool in the last 5 minutes - to: silent diff --git a/health/health.d/exporting.conf b/health/health.d/exporting.conf deleted file mode 100644 index c0320193..00000000 --- a/health/health.d/exporting.conf +++ /dev/null @@ -1,29 +0,0 @@ - - template: exporting_last_buffering - on: netdata.exporting_data_size - class: Latency - type: Netdata -component: Exporting engine - calc: $now - $last_collected_t - units: seconds ago - every: 10s - warn: $this > (($status >= $WARNING) ? ($update_every) : ( 5 * $update_every)) - crit: $this > (($status == $CRITICAL) ? ($update_every) : (60 * $update_every)) - delay: down 5m multiplier 1.5 max 1h - summary: Netdata exporting data last successful buffering - info: Number of seconds since the last successful buffering of exporting data - to: dba - - template: exporting_metrics_sent - on: netdata.exporting_data_size - class: Workload - type: Netdata -component: Exporting engine - units: % - calc: abs($sent) * 100 / abs($buffered) - every: 10s - warn: $this != 100 - delay: down 5m multiplier 1.5 max 1h - summary: Netdata exporting metrics sent - info: Percentage of metrics sent to the external database server - to: dba diff --git a/health/health.d/file_descriptors.conf b/health/health.d/file_descriptors.conf deleted file mode 100644 index 20a592d6..00000000 --- a/health/health.d/file_descriptors.conf +++ /dev/null @@ -1,33 +0,0 @@ - # you can disable an alarm notification by setting the 'to' line to: silent - - template: system_file_descriptors_utilization - on: system.file_nr_utilization - class: Utilization - type: System - component: Processes - hosts: * - lookup: max -1m unaligned - units: % - every: 1m - crit: $this > 90 - delay: down 15m multiplier 1.5 max 1h - summary: System open file descriptors utilization - info: System-wide utilization of open files - to: sysadmin - - template: apps_group_file_descriptors_utilization - on: app.fds_open_limit - class: Utilization - type: System -component: Process - os: linux - module: * - hosts: * - lookup: max -10s unaligned foreach * - units: % - every: 10s - warn: $this > (($status >= $WARNING) ? (85) : (95)) - delay: down 15m multiplier 1.5 max 1h - summary: App group ${label:app_group} file descriptors utilization - info: Open files percentage against the processes limits, among all PIDs in application group - to: sysadmin diff --git a/health/health.d/gearman.conf b/health/health.d/gearman.conf deleted file mode 100644 index 78e1165d..00000000 --- a/health/health.d/gearman.conf +++ /dev/null @@ -1,14 +0,0 @@ - - template: gearman_workers_queued - on: gearman.single_job - class: Latency - type: Computing -component: Gearman - lookup: average -10m unaligned match-names of Pending - units: workers - every: 10s - warn: $this > 30000 - delay: down 5m multiplier 1.5 max 1h - summary: Gearman queued jobs - info: Average number of queued jobs over the last 10 minutes - to: sysadmin diff --git a/health/health.d/geth.conf b/health/health.d/geth.conf deleted file mode 100644 index 361b6b41..00000000 --- a/health/health.d/geth.conf +++ /dev/null @@ -1,11 +0,0 @@ -#chainhead_header is expected momenterarily to be ahead. If its considerably ahead (e.g more than 5 blocks), then the node is definitely out of sync. - template: geth_chainhead_diff_between_header_block - on: geth.chainhead - class: Workload - type: ethereum_node -component: geth - every: 10s - calc: $chain_head_block - $chain_head_header - units: blocks - warn: $this != 0 - delay: down 1m multiplier 1.5 max 1h diff --git a/health/health.d/go.d.plugin.conf b/health/health.d/go.d.plugin.conf deleted file mode 100644 index 7796a1bc..00000000 --- a/health/health.d/go.d.plugin.conf +++ /dev/null @@ -1,18 +0,0 @@ - -# make sure go.d.plugin data collection job is running - - template: go.d_job_last_collected_secs - on: netdata.go_plugin_execution_time - class: Errors - type: Netdata -component: go.d.plugin - module: !* * - calc: $now - $last_collected_t - units: seconds ago - every: 10s - warn: $this > (($status >= $WARNING) ? ($update_every) : ( 5 * $update_every)) - crit: $this > (($status == $CRITICAL) ? ($update_every) : (60 * $update_every)) - delay: down 5m multiplier 1.5 max 1h - summary: Go.d plugin last collection - info: Number of seconds since the last successful data collection - to: webmaster diff --git a/health/health.d/haproxy.conf b/health/health.d/haproxy.conf deleted file mode 100644 index 66a488fa..00000000 --- a/health/health.d/haproxy.conf +++ /dev/null @@ -1,25 +0,0 @@ - template: haproxy_backend_server_status - on: haproxy_hs.down - class: Errors - type: Web Proxy -component: HAProxy - units: failed servers - every: 10s - lookup: average -10s - crit: $this > 0 - summary: HAProxy server status - info: Average number of failed haproxy backend servers over the last 10 seconds - to: sysadmin - - template: haproxy_backend_status - on: haproxy_hb.down - class: Errors - type: Web Proxy -component: HAProxy - units: failed backend - every: 10s - lookup: average -10s - crit: $this > 0 - summary: HAProxy backend status - info: Average number of failed haproxy backends over the last 10 seconds - to: sysadmin diff --git a/health/health.d/hdfs.conf b/health/health.d/hdfs.conf deleted file mode 100644 index 566e815a..00000000 --- a/health/health.d/hdfs.conf +++ /dev/null @@ -1,81 +0,0 @@ - -# Common - - template: hdfs_capacity_usage - on: hdfs.capacity - class: Utilization - type: Storage -component: HDFS - calc: ($used) * 100 / ($used + $remaining) - units: % - every: 10s - warn: $this > (($status >= $WARNING) ? (70) : (80)) - crit: $this > (($status == $CRITICAL) ? (80) : (98)) - delay: down 15m multiplier 1.5 max 1h - summary: HDFS datanodes space utilization - info: summary datanodes space capacity utilization - to: sysadmin - - -# NameNode - - template: hdfs_missing_blocks - on: hdfs.blocks - class: Errors - type: Storage -component: HDFS - calc: $missing - units: missing blocks - every: 10s - warn: $this > 0 - delay: down 15m multiplier 1.5 max 1h - summary: HDFS missing blocks - info: number of missing blocks - to: sysadmin - - - template: hdfs_stale_nodes - on: hdfs.data_nodes - class: Errors - type: Storage -component: HDFS - calc: $stale - units: dead nodes - every: 10s - warn: $this > 0 - delay: down 15m multiplier 1.5 max 1h - summary: HDFS stale datanodes - info: number of datanodes marked stale due to delayed heartbeat - to: sysadmin - - - template: hdfs_dead_nodes - on: hdfs.data_nodes - class: Errors - type: Storage -component: HDFS - calc: $dead - units: dead nodes - every: 10s - crit: $this > 0 - delay: down 15m multiplier 1.5 max 1h - summary: HDFS dead datanodes - info: number of datanodes which are currently dead - to: sysadmin - - -# DataNode - - template: hdfs_num_failed_volumes - on: hdfs.num_failed_volumes - class: Errors - type: Storage -component: HDFS - calc: $fsds_num_failed_volumes - units: failed volumes - every: 10s - warn: $this > 0 - delay: down 15m multiplier 1.5 max 1h - summary: HDFS failed volumes - info: number of failed volumes - to: sysadmin diff --git a/health/health.d/httpcheck.conf b/health/health.d/httpcheck.conf deleted file mode 100644 index da5dec79..00000000 --- a/health/health.d/httpcheck.conf +++ /dev/null @@ -1,73 +0,0 @@ - -# This is a fast-reacting no-notification alarm ideal for custom dashboards or badges - template: httpcheck_web_service_up - on: httpcheck.status - class: Utilization - type: Web Server -component: HTTP endpoint - lookup: average -1m unaligned percentage of success - calc: ($this < 75) ? (0) : ($this) - every: 5s - units: up/down - info: HTTP check endpoint ${label:url} liveness status - to: silent - - template: httpcheck_web_service_bad_content - on: httpcheck.status - class: Workload - type: Web Server -component: HTTP endpoint - lookup: average -5m unaligned percentage of bad_content - every: 10s - units: % - warn: $this >= 10 AND $this < 40 - crit: $this >= 40 - delay: down 5m multiplier 1.5 max 1h - summary: HTTP check for ${label:url} unexpected content - info: Percentage of HTTP responses from ${label:url} with unexpected content in the last 5 minutes - to: webmaster - - template: httpcheck_web_service_bad_status - on: httpcheck.status - class: Workload - type: Web Server -component: HTTP endpoint - lookup: average -5m unaligned percentage of bad_status - every: 10s - units: % - warn: $this >= 10 AND $this < 40 - crit: $this >= 40 - delay: down 5m multiplier 1.5 max 1h - summary: HTTP check for ${label:url} unexpected status - info: Percentage of HTTP responses from ${label:url} with unexpected status in the last 5 minutes - to: webmaster - - template: httpcheck_web_service_timeouts - on: httpcheck.status - class: Latency - type: Web Server -component: HTTP endpoint - lookup: average -5m unaligned percentage of timeout - every: 10s - units: % - warn: $this >= 10 AND $this < 40 - crit: $this >= 40 - delay: down 5m multiplier 1.5 max 1h - summary: HTTP check for ${label:url} timeouts - info: Percentage of timed-out HTTP requests to ${label:url} in the last 5 minutes - to: webmaster - - template: httpcheck_web_service_no_connection - on: httpcheck.status - class: Errors - type: Other -component: HTTP endpoint - lookup: average -5m unaligned percentage of no_connection - every: 10s - units: % - warn: $this >= 10 AND $this < 40 - crit: $this >= 40 - delay: down 5m multiplier 1.5 max 1h - summary: HTTP check for ${label:url} failed requests - info: Percentage of failed HTTP requests to ${label:url} in the last 5 minutes - to: webmaster diff --git a/health/health.d/ioping.conf b/health/health.d/ioping.conf deleted file mode 100644 index 6d832bf0..00000000 --- a/health/health.d/ioping.conf +++ /dev/null @@ -1,14 +0,0 @@ - template: ioping_disk_latency - on: ioping.latency - class: Latency - type: System -component: Disk - lookup: average -10s unaligned of latency - units: microseconds - every: 10s - green: 10000 - warn: $this > $green - delay: down 30m multiplier 1.5 max 2h - summary: IO ping latency - info: Average I/O latency over the last 10 seconds - to: silent diff --git a/health/health.d/ipc.conf b/health/health.d/ipc.conf deleted file mode 100644 index f77f5606..00000000 --- a/health/health.d/ipc.conf +++ /dev/null @@ -1,34 +0,0 @@ - -# you can disable an alarm notification by setting the 'to' line to: silent - - alarm: semaphores_used - on: system.ipc_semaphores - class: Utilization - type: System -component: IPC - os: linux - hosts: * - calc: $semaphores * 100 / $ipc_semaphores_max - units: % - every: 10s - warn: $this > (($status >= $WARNING) ? (70) : (80)) - delay: down 5m multiplier 1.5 max 1h - summary: IPC semaphores used - info: IPC semaphore utilization - to: sysadmin - - alarm: semaphore_arrays_used - on: system.ipc_semaphore_arrays - class: Utilization - type: System -component: IPC - os: linux - hosts: * - calc: $arrays * 100 / $ipc_semaphores_arrays_max - units: % - every: 10s - warn: $this > (($status >= $WARNING) ? (70) : (80)) - delay: down 5m multiplier 1.5 max 1h - summary: IPC semaphore arrays used - info: IPC semaphore arrays utilization - to: sysadmin diff --git a/health/health.d/ipfs.conf b/health/health.d/ipfs.conf deleted file mode 100644 index 4dfee3c7..00000000 --- a/health/health.d/ipfs.conf +++ /dev/null @@ -1,15 +0,0 @@ - - template: ipfs_datastore_usage - on: ipfs.repo_size - class: Utilization - type: Data Sharing -component: IPFS - calc: $size * 100 / $avail - units: % - every: 10s - warn: $this > (($status >= $WARNING) ? (80) : (90)) - crit: $this > (($status == $CRITICAL) ? (90) : (98)) - delay: down 15m multiplier 1.5 max 1h - summary: IPFS datastore utilization - info: IPFS datastore utilization - to: sysadmin diff --git a/health/health.d/ipmi.conf b/health/health.d/ipmi.conf deleted file mode 100644 index cec2320a..00000000 --- a/health/health.d/ipmi.conf +++ /dev/null @@ -1,28 +0,0 @@ - template: ipmi_sensor_state - on: ipmi.sensor_state - class: Errors - type: System -component: IPMI - calc: $warning + $critical - units: state - every: 10s - warn: $warning > 0 - crit: $critical > 0 - delay: up 5m down 15m multiplier 1.5 max 1h - summary: IPMI sensor ${label:sensor} state - info: IPMI sensor ${label:sensor} (${label:component}) state - to: sysadmin - - alarm: ipmi_events - on: ipmi.events - class: Utilization - type: System -component: IPMI - calc: $events - units: events - every: 30s - warn: $this > 0 - delay: up 5m down 15m multiplier 1.5 max 1h - summary: IPMI entries in System Event Log - info: number of events in the IPMI System Event Log (SEL) - to: silent diff --git a/health/health.d/isc_dhcpd.conf b/health/health.d/isc_dhcpd.conf deleted file mode 100644 index d1f93969..00000000 --- a/health/health.d/isc_dhcpd.conf +++ /dev/null @@ -1,10 +0,0 @@ -# template: isc_dhcpd_leases_size -# on: isc_dhcpd.leases_total -# units: KB -# every: 60 -# calc: $leases_size -# warn: $this > 3072 -# crit: $this > 6144 -# delay: up 2m down 5m -# info: dhcpd.leases file too big! Module can slow down your server. -# to: sysadmin diff --git a/health/health.d/kubelet.conf b/health/health.d/kubelet.conf deleted file mode 100644 index 8adf5f7d..00000000 --- a/health/health.d/kubelet.conf +++ /dev/null @@ -1,151 +0,0 @@ -# you can disable an alarm notification by setting the 'to' line to: silent - -# ----------------------------------------------------------------------------- - -# True (1) if the node is experiencing a configuration-related error, false (0) otherwise. - - template: kubelet_node_config_error - on: k8s_kubelet.kubelet_node_config_error - class: Errors - type: Kubernetes -component: Kubelet - calc: $experiencing_error - units: bool - every: 10s - warn: $this == 1 - delay: down 1m multiplier 1.5 max 2h - summary: Kubelet node config error - info: The node is experiencing a configuration-related error (0: false, 1: true) - to: sysadmin - -# Failed Token() requests to the alternate token source - - template: kubelet_token_requests - on: k8s_kubelet.kubelet_token_requests - class: Errors - type: Kubernetes -component: Kubelet - lookup: sum -10s of failed - units: requests - every: 10s - warn: $this > 0 - delay: down 1m multiplier 1.5 max 2h - summary: Kubelet failed token requests - info: Number of failed Token() requests to the alternate token source - to: sysadmin - -# Docker and runtime operation errors - - template: kubelet_operations_error - on: k8s_kubelet.kubelet_operations_errors - class: Errors - type: Kubernetes -component: Kubelet - lookup: sum -1m - units: errors - every: 10s - warn: $this > (($status >= $WARNING) ? (0) : (20)) - delay: up 30s down 1m multiplier 1.5 max 2h - summary: Kubelet runtime errors - info: Number of Docker or runtime operation errors - to: sysadmin - -# ----------------------------------------------------------------------------- - -# Pod Lifecycle Event Generator Relisting Latency - -# 1. calculate the pleg relisting latency for 1m (quantile 0.5, quantile 0.9, quantile 0.99) -# 2. do the same for the last 10s -# 3. raise an alarm if the later is: -# - 2x the first for quantile 0.5 -# - 4x the first for quantile 0.9 -# - 8x the first for quantile 0.99 -# -# we assume the minimum latency is 1000 microseconds - -# quantile 0.5 - - template: kubelet_1m_pleg_relist_latency_quantile_05 - on: k8s_kubelet.kubelet_pleg_relist_latency_microseconds - class: Latency - type: Kubernetes -component: Kubelet - lookup: average -1m unaligned of 0.5 - units: microseconds - every: 10s - info: average Pod Lifecycle Event Generator relisting latency over the last minute (quantile 0.5) - - template: kubelet_10s_pleg_relist_latency_quantile_05 - on: k8s_kubelet.kubelet_pleg_relist_latency_microseconds - class: Latency - type: Kubernetes -component: Kubelet - lookup: average -10s unaligned of 0.5 - calc: $this * 100 / (($kubelet_1m_pleg_relist_latency_quantile_05 < 1000)?(1000):($kubelet_1m_pleg_relist_latency_quantile_05)) - every: 10s - units: % - warn: $this > (($status >= $WARNING)?(100):(200)) - crit: $this > (($status >= $WARNING)?(200):(400)) - delay: down 1m multiplier 1.5 max 2h - summary: Kubelet relisting latency (quantile 0.5) - info: Ratio of average Pod Lifecycle Event Generator relisting latency over the last 10 seconds, \ - compared to the last minute (quantile 0.5) - to: sysadmin - -# quantile 0.9 - - template: kubelet_1m_pleg_relist_latency_quantile_09 - on: k8s_kubelet.kubelet_pleg_relist_latency_microseconds - class: Latency - type: Kubernetes -component: Kubelet - lookup: average -1m unaligned of 0.9 - units: microseconds - every: 10s - info: average Pod Lifecycle Event Generator relisting latency over the last minute (quantile 0.9) - - template: kubelet_10s_pleg_relist_latency_quantile_09 - on: k8s_kubelet.kubelet_pleg_relist_latency_microseconds - class: Latency - type: Kubernetes -component: Kubelet - lookup: average -10s unaligned of 0.9 - calc: $this * 100 / (($kubelet_1m_pleg_relist_latency_quantile_09 < 1000)?(1000):($kubelet_1m_pleg_relist_latency_quantile_09)) - every: 10s - units: % - warn: $this > (($status >= $WARNING)?(200):(400)) - crit: $this > (($status >= $WARNING)?(400):(800)) - delay: down 1m multiplier 1.5 max 2h - summary: Kubelet relisting latency (quantile 0.9) - info: Ratio of average Pod Lifecycle Event Generator relisting latency over the last 10 seconds, \ - compared to the last minute (quantile 0.9) - to: sysadmin - -# quantile 0.99 - - template: kubelet_1m_pleg_relist_latency_quantile_099 - on: k8s_kubelet.kubelet_pleg_relist_latency_microseconds - class: Latency - type: Kubernetes -component: Kubelet - lookup: average -1m unaligned of 0.99 - units: microseconds - every: 10s - info: average Pod Lifecycle Event Generator relisting latency over the last minute (quantile 0.99) - - template: kubelet_10s_pleg_relist_latency_quantile_099 - on: k8s_kubelet.kubelet_pleg_relist_latency_microseconds - class: Latency - type: Kubernetes -component: Kubelet - lookup: average -10s unaligned of 0.99 - calc: $this * 100 / (($kubelet_1m_pleg_relist_latency_quantile_099 < 1000)?(1000):($kubelet_1m_pleg_relist_latency_quantile_099)) - every: 10s - units: % - warn: $this > (($status >= $WARNING)?(400):(800)) - crit: $this > (($status >= $WARNING)?(800):(1200)) - delay: down 1m multiplier 1.5 max 2h - summary: Kubelet relisting latency (quantile 0.99) - info: Ratio of average Pod Lifecycle Event Generator relisting latency over the last 10 seconds, \ - compared to the last minute (quantile 0.99) - to: sysadmin diff --git a/health/health.d/linux_power_supply.conf b/health/health.d/linux_power_supply.conf deleted file mode 100644 index b0d35e75..00000000 --- a/health/health.d/linux_power_supply.conf +++ /dev/null @@ -1,15 +0,0 @@ -# Alert on low battery capacity. - - template: linux_power_supply_capacity - on: powersupply.capacity - class: Utilization - type: Power Supply -component: Battery - calc: $capacity - units: % - every: 10s - warn: $this < 10 - delay: up 30s down 5m multiplier 1.2 max 1h - summary: Power supply capacity - info: Percentage of remaining power supply capacity - to: silent diff --git a/health/health.d/load.conf b/health/health.d/load.conf deleted file mode 100644 index fd8bf939..00000000 --- a/health/health.d/load.conf +++ /dev/null @@ -1,72 +0,0 @@ - -# you can disable an alarm notification by setting the 'to' line to: silent - -# Calculate the base trigger point for the load average alarms. -# This is the maximum number of CPU's in the system over the past 1 -# minute, with a special case for a single CPU of setting the trigger at 2. - alarm: load_cpu_number - on: system.load - class: Utilization - type: System -component: Load - os: linux - hosts: * - calc: ($active_processors == nan or $active_processors == 0) ? (nan) : ( ($active_processors < 2) ? ( 2 ) : ( $active_processors ) ) - units: cpus - every: 1m - info: Number of active CPU cores in the system - -# Send alarms if the load average is unusually high. -# These intentionally _do not_ calculate the average over the sampled -# time period because the values being checked already are averages. - - alarm: load_average_15 - on: system.load - class: Utilization - type: System -component: Load - os: linux - hosts: * - lookup: max -1m unaligned of load15 - calc: ($load_cpu_number == nan) ? (nan) : ($this) - units: load - every: 1m - warn: ($this * 100 / $load_cpu_number) > (($status >= $WARNING) ? 175 : 200) - delay: down 15m multiplier 1.5 max 1h - summary: Host load average (15 minutes) - info: System load average for the past 15 minutes - to: silent - - alarm: load_average_5 - on: system.load - class: Utilization - type: System -component: Load - os: linux - hosts: * - lookup: max -1m unaligned of load5 - calc: ($load_cpu_number == nan) ? (nan) : ($this) - units: load - every: 1m - warn: ($this * 100 / $load_cpu_number) > (($status >= $WARNING) ? 350 : 400) - delay: down 15m multiplier 1.5 max 1h - summary: System load average (5 minutes) - info: System load average for the past 5 minutes - to: silent - - alarm: load_average_1 - on: system.load - class: Utilization - type: System -component: Load - os: linux - hosts: * - lookup: max -1m unaligned of load1 - calc: ($load_cpu_number == nan) ? (nan) : ($this) - units: load - every: 1m - warn: ($this * 100 / $load_cpu_number) > (($status >= $WARNING) ? 700 : 800) - delay: down 15m multiplier 1.5 max 1h - summary: System load average (1 minute) - info: System load average for the past 1 minute - to: silent diff --git a/health/health.d/mdstat.conf b/health/health.d/mdstat.conf deleted file mode 100644 index 90f97d85..00000000 --- a/health/health.d/mdstat.conf +++ /dev/null @@ -1,43 +0,0 @@ - - template: mdstat_disks - on: md.disks - class: Errors - type: System -component: RAID - units: failed devices - every: 10s - calc: $down - warn: $this > 0 - summary: MD array device ${label:device} down - info: Number of devices in the down state for the ${label:device} ${label:raid_level} array. \ - Any number > 0 indicates that the array is degraded. - to: sysadmin - - template: mdstat_mismatch_cnt - on: md.mismatch_cnt - class: Errors - type: System -component: RAID -chart labels: raid_level=!raid1 !raid10 * - units: unsynchronized blocks - calc: $count - every: 60s - warn: $this > 1024 - delay: up 30m - summary: MD array device ${label:device} unsynchronized blocks - info: Number of unsynchronized blocks for the ${label:device} ${label:raid_level} array - to: silent - - template: mdstat_nonredundant_last_collected - on: md.nonredundant - class: Latency - type: System -component: RAID - calc: $now - $last_collected_t - units: seconds ago - every: 10s - warn: $this > (($status >= $WARNING) ? ($update_every) : ( 5 * $update_every)) - crit: $this > (($status == $CRITICAL) ? ($update_every) : (60 * $update_every)) - summary: MD array last collected - info: Number of seconds since the last successful data collection - to: sysadmin diff --git a/health/health.d/megacli.conf b/health/health.d/megacli.conf deleted file mode 100644 index 118997a5..00000000 --- a/health/health.d/megacli.conf +++ /dev/null @@ -1,76 +0,0 @@ - -## Adapters (controllers) - - template: megacli_adapter_state - on: megacli.adapter_degraded - class: Errors - type: System -component: RAID - lookup: max -10s foreach * - units: boolean - every: 10s - crit: $this > 0 - delay: down 5m multiplier 2 max 10m - summary: MegaCLI adapter state - info: Adapter is in the degraded state (0: false, 1: true) - to: sysadmin - -## Physical Disks - - template: megacli_pd_predictive_failures - on: megacli.pd_predictive_failure - class: Errors - type: System -component: RAID - lookup: sum -10s foreach * - units: predictive failures - every: 10s - warn: $this > 0 - delay: up 1m down 5m multiplier 2 max 10m - summary: MegaCLI physical drive predictive failures - info: Number of physical drive predictive failures - to: sysadmin - - template: megacli_pd_media_errors - on: megacli.pd_media_error - class: Errors - type: System -component: RAID - lookup: sum -10s foreach * - units: media errors - every: 10s - warn: $this > 0 - delay: up 1m down 5m multiplier 2 max 10m - summary: MegaCLI physical drive errors - info: Number of physical drive media errors - to: sysadmin - -## Battery Backup Units (BBU) - - template: megacli_bbu_relative_charge - on: megacli.bbu_relative_charge - class: Workload - type: System -component: RAID - lookup: average -10s - units: percent - every: 10s - warn: $this <= (($status >= $WARNING) ? (85) : (80)) - crit: $this <= (($status == $CRITICAL) ? (50) : (40)) - summary: MegaCLI BBU charge state - info: Average battery backup unit (BBU) relative state of charge over the last 10 seconds - to: sysadmin - - template: megacli_bbu_cycle_count - on: megacli.bbu_cycle_count - class: Workload - type: System -component: RAID - lookup: average -10s - units: cycles - every: 10s - warn: $this >= 100 - crit: $this >= 500 - summary: MegaCLI BBU cycles count - info: Average battery backup unit (BBU) charge cycles count over the last 10 seconds - to: sysadmin diff --git a/health/health.d/memcached.conf b/health/health.d/memcached.conf deleted file mode 100644 index 77ca0afa..00000000 --- a/health/health.d/memcached.conf +++ /dev/null @@ -1,50 +0,0 @@ - -# detect if memcached cache is full - - template: memcached_cache_memory_usage - on: memcached.cache - class: Utilization - type: KV Storage -component: Memcached - calc: $used * 100 / ($used + $available) - units: % - every: 10s - warn: $this > (($status >= $WARNING) ? (70) : (80)) - crit: $this > (($status == $CRITICAL) ? (80) : (90)) - delay: up 0 down 15m multiplier 1.5 max 1h - summary: Memcached memory utilization - info: Cache memory utilization - to: dba - - -# find the rate memcached cache is filling - - template: memcached_cache_fill_rate - on: memcached.cache - class: Utilization - type: KV Storage -component: Memcached - lookup: min -10m at -50m unaligned of available - calc: ($this - $available) / (($now - $after) / 3600) - units: KB/hour - every: 1m - info: Average rate the cache fills up (positive), or frees up (negative) space over the last hour - - -# find the hours remaining until memcached cache is full - - template: memcached_out_of_cache_space_time - on: memcached.cache - class: Utilization - type: KV Storage -component: Memcached - calc: ($memcached_cache_fill_rate > 0) ? ($available / $memcached_cache_fill_rate) : (inf) - units: hours - every: 10s - warn: $this > 0 and $this < (($status >= $WARNING) ? (48) : (8)) - crit: $this > 0 and $this < (($status == $CRITICAL) ? (24) : (2)) - delay: down 15m multiplier 1.5 max 1h - summary: Memcached estimation of lack of cache space - info: Estimated time the cache will run out of space \ - if the system continues to add data at the same rate as the past hour - to: dba diff --git a/health/health.d/memory.conf b/health/health.d/memory.conf deleted file mode 100644 index 5ab3d2d9..00000000 --- a/health/health.d/memory.conf +++ /dev/null @@ -1,85 +0,0 @@ -# you can disable an alarm notification by setting the 'to' line to: silent - - alarm: 1hour_memory_hw_corrupted - on: mem.hwcorrupt - class: Errors - type: System -component: Memory - os: linux - hosts: * - calc: $HardwareCorrupted - units: MB - every: 10s - warn: $this > 0 - delay: down 1h multiplier 1.5 max 1h - summary: System corrupted memory - info: Amount of memory corrupted due to a hardware failure - to: sysadmin - -## ECC Controller - - template: ecc_memory_mc_correctable - on: mem.edac_mc - class: Errors - type: System -component: Memory - os: linux - hosts: * - lookup: sum -10m unaligned of correctable, correctable_noinfo - units: errors - every: 1m - warn: $this > 0 - delay: down 1h multiplier 1.5 max 1h - summary: System ECC memory ${label:controller} correctable errors - info: Memory controller ${label:controller} ECC correctable errors in the last 10 minutes - to: sysadmin - - template: ecc_memory_mc_uncorrectable - on: mem.edac_mc - class: Errors - type: System -component: Memory - os: linux - hosts: * - lookup: sum -10m unaligned of uncorrectable,uncorrectable_noinfo - units: errors - every: 1m - crit: $this > 0 - delay: down 1h multiplier 1.5 max 1h - summary: System ECC memory ${label:controller} uncorrectable errors - info: Memory controller ${label:controller} ECC uncorrectable errors in the last 10 minutes - to: sysadmin - -## ECC DIMM - - template: ecc_memory_dimm_correctable - on: mem.edac_mc_dimm - class: Errors - type: System -component: Memory - os: linux - hosts: * - lookup: sum -10m unaligned of correctable - units: errors - every: 1m - warn: $this > 0 - delay: down 1h multiplier 1.5 max 1h - summary: System ECC memory DIMM ${label:dimm} correctable errors - info: DIMM ${label:dimm} controller ${label:controller} (location ${label:dimm_location}) ECC correctable errors in the last 10 minutes - to: sysadmin - - template: ecc_memory_dimm_uncorrectable - on: mem.edac_mc_dimm - class: Errors - type: System -component: Memory - os: linux - hosts: * - lookup: sum -10m unaligned of uncorrectable - units: errors - every: 1m - crit: $this > 0 - delay: down 1h multiplier 1.5 max 1h - summary: System ECC memory DIMM ${label:dimm} uncorrectable errors - info: DIMM ${label:dimm} controller ${label:controller} (location ${label:dimm_location}) ECC uncorrectable errors in the last 10 minutes - to: sysadmin diff --git a/health/health.d/ml.conf b/health/health.d/ml.conf deleted file mode 100644 index aef9b036..00000000 --- a/health/health.d/ml.conf +++ /dev/null @@ -1,56 +0,0 @@ -# below are some examples of using the `anomaly-bit` option to define alerts based on anomaly -# rates as opposed to raw metric values. You can read more about the anomaly-bit and Netdata's -# native anomaly detection here: -# https://learn.netdata.cloud/docs/agent/ml#anomaly-bit---100--anomalous-0--normal - -# some examples below are commented, you would need to uncomment and adjust as desired to enable them. - -# node level anomaly rate -# https://learn.netdata.cloud/docs/agent/ml#node-anomaly-rate -# if node level anomaly rate is above 1% then warning (pick your own threshold that works best via trial and error). - template: ml_1min_node_ar - on: anomaly_detection.anomaly_rate - class: Workload - type: System -component: ML - os: * - hosts: * - lookup: average -1m of anomaly_rate - calc: $this - units: % - every: 30s - warn: $this > 1 - summary: ML node anomaly rate - info: Rolling 1min node level anomaly rate - to: silent - -# alert per dimension example -# if anomaly rate is between 5-20% then warning (pick your own threshold that works best via tial and error). -# if anomaly rate is above 20% then critical (pick your own threshold that works best via tial and error). -# template: ml_5min_cpu_dims -# on: system.cpu -# os: linux -# hosts: * -# lookup: average -5m anomaly-bit foreach * -# calc: $this -# units: % -# every: 30s -# warn: $this > (($status >= $WARNING) ? (5) : (20)) -# crit: $this > (($status == $CRITICAL) ? (20) : (100)) -# info: rolling 5min anomaly rate for each system.cpu dimension - -# alert per chart example -# if anomaly rate is between 5-20% then warning (pick your own threshold that works best via tial and error). -# if anomaly rate is above 20% then critical (pick your own threshold that works best via tial and error). -# template: ml_5min_cpu_chart -# on: system.cpu -# os: linux -# hosts: * -# lookup: average -5m anomaly-bit of * -# calc: $this -# units: % -# every: 30s -# warn: $this > (($status >= $WARNING) ? (5) : (20)) -# crit: $this > (($status == $CRITICAL) ? (20) : (100)) -# info: rolling 5min anomaly rate for system.cpu chart - diff --git a/health/health.d/mysql.conf b/health/health.d/mysql.conf deleted file mode 100644 index 572560b4..00000000 --- a/health/health.d/mysql.conf +++ /dev/null @@ -1,187 +0,0 @@ - -# slow queries - - template: mysql_10s_slow_queries - on: mysql.queries - class: Latency - type: Database -component: MySQL - lookup: sum -10s of slow_queries - units: slow queries - every: 10s - warn: $this > (($status >= $WARNING) ? (5) : (10)) - crit: $this > (($status == $CRITICAL) ? (10) : (20)) - delay: down 5m multiplier 1.5 max 1h - summary: MySQL slow queries - info: Number of slow queries in the last 10 seconds - to: dba - - -# ----------------------------------------------------------------------------- -# lock waits - - template: mysql_10s_table_locks_immediate - on: mysql.table_locks - class: Utilization - type: Database -component: MySQL - lookup: sum -10s absolute of immediate - units: immediate locks - every: 10s - summary: MySQL table immediate locks - info: Number of table immediate locks in the last 10 seconds - to: dba - - template: mysql_10s_table_locks_waited - on: mysql.table_locks - class: Latency - type: Database -component: MySQL - lookup: sum -10s absolute of waited - units: waited locks - every: 10s - summary: MySQL table waited locks - info: Number of table waited locks in the last 10 seconds - to: dba - - template: mysql_10s_waited_locks_ratio - on: mysql.table_locks - class: Latency - type: Database -component: MySQL - calc: ( ($mysql_10s_table_locks_waited + $mysql_10s_table_locks_immediate) > 0 ) ? (($mysql_10s_table_locks_waited * 100) / ($mysql_10s_table_locks_waited + $mysql_10s_table_locks_immediate)) : 0 - units: % - every: 10s - warn: $this > (($status >= $WARNING) ? (10) : (25)) - crit: $this > (($status == $CRITICAL) ? (25) : (50)) - delay: down 30m multiplier 1.5 max 1h - summary: MySQL waited table locks ratio - info: Ratio of waited table locks over the last 10 seconds - to: dba - - -# ----------------------------------------------------------------------------- -# connections - - template: mysql_connections - on: mysql.connections_active - class: Utilization - type: Database -component: MySQL - calc: $active * 100 / $limit - units: % - every: 10s - warn: $this > (($status >= $WARNING) ? (60) : (70)) - crit: $this > (($status == $CRITICAL) ? (80) : (90)) - delay: down 15m multiplier 1.5 max 1h - summary: MySQL connections utilization - info: Client connections utilization - to: dba - - -# ----------------------------------------------------------------------------- -# replication - - template: mysql_replication - on: mysql.slave_status - class: Errors - type: Database -component: MySQL - calc: ($sql_running <= 0 OR $io_running <= 0)?0:1 - units: ok/failed - every: 10s - crit: $this == 0 - delay: down 5m multiplier 1.5 max 1h - summary: MySQL replication status - info: Replication status (0: stopped, 1: working) - to: dba - - template: mysql_replication_lag - on: mysql.slave_behind - class: Latency - type: Database -component: MySQL - calc: $seconds - units: seconds - every: 10s - warn: $this > (($status >= $WARNING) ? (5) : (10)) - crit: $this > (($status == $CRITICAL) ? (10) : (30)) - delay: down 15m multiplier 1.5 max 1h - summary: MySQL replication lag - info: Difference between the timestamp of the latest transaction processed by the SQL thread and \ - the timestamp of the same transaction when it was processed on the master - to: dba - - -# ----------------------------------------------------------------------------- -# galera cluster size - - template: mysql_galera_cluster_size_max_2m - on: mysql.galera_cluster_size - class: Utilization - type: Database -component: MySQL - lookup: max -2m at -1m unaligned - units: nodes - every: 10s - info: maximum galera cluster size in the last 2 minutes starting one minute ago - to: dba - - template: mysql_galera_cluster_size - on: mysql.galera_cluster_size - class: Utilization - type: Database -component: MySQL - calc: $nodes - units: nodes - every: 10s - warn: $this > $mysql_galera_cluster_size_max_2m - crit: $this < $mysql_galera_cluster_size_max_2m - delay: up 20s down 5m multiplier 1.5 max 1h - summary: MySQL galera cluster size - info: Current galera cluster size, compared to the maximum size in the last 2 minutes - to: dba - -# galera node state - - template: mysql_galera_cluster_state_warn - on: mysql.galera_cluster_state - class: Errors - type: Database -component: MySQL - calc: $donor + $joined - every: 10s - warn: $this != nan AND $this != 0 - delay: up 30s down 5m multiplier 1.5 max 1h - summary: MySQL galera node state - info: Galera node state is either Donor/Desynced or Joined. - to: dba - - template: mysql_galera_cluster_state_crit - on: mysql.galera_cluster_state - class: Errors - type: Database -component: MySQL - calc: $undefined + $joining + $error - every: 10s - crit: $this != nan AND $this != 0 - delay: up 30s down 5m multiplier 1.5 max 1h - summary: MySQL galera node state - info: Galera node state is either Undefined or Joining or Error. - to: dba - -# galera node status - - template: mysql_galera_cluster_status - on: mysql.galera_cluster_status - class: Errors - type: Database -component: MySQL - calc: $primary - every: 10s - crit: $this != nan AND $this != 1 - delay: up 30s down 5m multiplier 1.5 max 1h - summary: MySQL galera cluster status - info: Galera node is part of a nonoperational component. \ - This occurs in cases of multiple membership changes that result in a loss of Quorum or in cases of split-brain situations. - to: dba diff --git a/health/health.d/net.conf b/health/health.d/net.conf deleted file mode 100644 index 2dfe6bba..00000000 --- a/health/health.d/net.conf +++ /dev/null @@ -1,258 +0,0 @@ - -# you can disable an alarm notification by setting the 'to' line to: silent - -# ----------------------------------------------------------------------------- -# net traffic overflow - - template: interface_speed - on: net.net - class: Latency - type: System -component: Network - os: * - hosts: * - calc: ( $nic_speed_max > 0 ) ? ( $nic_speed_max / 1000) : ( nan ) - units: Mbit - every: 10s - info: Network interface ${label:device} current speed - - template: 1m_received_traffic_overflow - on: net.net - class: Workload - type: System -component: Network - os: linux - hosts: * - lookup: average -1m unaligned absolute of received - calc: ($interface_speed > 0) ? ($this * 100 / ($interface_speed * 1000)) : ( nan ) - units: % - every: 10s - warn: $this > (($status >= $WARNING) ? (85) : (90)) - delay: up 1m down 1m multiplier 1.5 max 1h - summary: System network interface ${label:device} inbound utilization - info: Average inbound utilization for the network interface ${label:device} over the last minute - to: silent - - template: 1m_sent_traffic_overflow - on: net.net - class: Workload - type: System -component: Network - os: linux - hosts: * - lookup: average -1m unaligned absolute of sent - calc: ($interface_speed > 0) ? ($this * 100 / ($interface_speed * 1000)) : ( nan ) - units: % - every: 10s - warn: $this > (($status >= $WARNING) ? (85) : (90)) - delay: up 1m down 1m multiplier 1.5 max 1h - summary: System network interface ${label:device} outbound utilization - info: Average outbound utilization for the network interface ${label:device} over the last minute - to: silent - -# ----------------------------------------------------------------------------- -# dropped packets - -# check if an interface is dropping packets -# the alarm is checked every 1 minute -# and examines the last 10 minutes of data -# -# it is possible to have expected packet drops on an interface for some network configurations -# look at the Monitoring Network Interfaces section in the proc.plugin documentation for more information - - template: net_interface_inbound_packets - on: net.packets - class: Workload - type: System -component: Network - os: * - hosts: * - lookup: sum -10m unaligned absolute of received - units: packets - every: 1m - summary: Network interface ${label:device} received packets - info: Received packets for the network interface ${label:device} in the last 10 minutes - - template: net_interface_outbound_packets - on: net.packets - class: Workload - type: System -component: Network - os: * - hosts: * - lookup: sum -10m unaligned absolute of sent - units: packets - every: 1m - summary: Network interface ${label:device} sent packets - info: Sent packets for the network interface ${label:device} in the last 10 minutes - - template: inbound_packets_dropped_ratio - on: net.drops - class: Errors - type: System -component: Network - os: * - hosts: * -chart labels: device=!wl* * - lookup: sum -10m unaligned absolute of inbound - calc: (($net_interface_inbound_packets > 10000) ? ($this * 100 / $net_interface_inbound_packets) : (0)) - units: % - every: 1m - warn: $this >= 2 - delay: up 1m down 1h multiplier 1.5 max 2h - summary: System network interface ${label:device} inbound drops - info: Ratio of inbound dropped packets for the network interface ${label:device} over the last 10 minutes - to: silent - - template: outbound_packets_dropped_ratio - on: net.drops - class: Errors - type: System -component: Network - os: * - hosts: * -chart labels: device=!wl* * - lookup: sum -10m unaligned absolute of outbound - calc: (($net_interface_outbound_packets > 1000) ? ($this * 100 / $net_interface_outbound_packets) : (0)) - units: % - every: 1m - warn: $this >= 2 - delay: up 1m down 1h multiplier 1.5 max 2h - summary: System network interface ${label:device} outbound drops - info: Ratio of outbound dropped packets for the network interface ${label:device} over the last 10 minutes - to: silent - - template: wifi_inbound_packets_dropped_ratio - on: net.drops - class: Errors - type: System -component: Network - os: linux - hosts: * -chart labels: device=wl* - lookup: sum -10m unaligned absolute of received - calc: (($net_interface_inbound_packets > 10000) ? ($this * 100 / $net_interface_inbound_packets) : (0)) - units: % - every: 1m - warn: $this >= 10 - delay: up 1m down 1h multiplier 1.5 max 2h - summary: System network interface ${label:device} inbound drops ratio - info: Ratio of inbound dropped packets for the network interface ${label:device} over the last 10 minutes - to: silent - - template: wifi_outbound_packets_dropped_ratio - on: net.drops - class: Errors - type: System -component: Network - os: linux - hosts: * -chart labels: device=wl* - lookup: sum -10m unaligned absolute of sent - calc: (($net_interface_outbound_packets > 1000) ? ($this * 100 / $net_interface_outbound_packets) : (0)) - units: % - every: 1m - warn: $this >= 10 - delay: up 1m down 1h multiplier 1.5 max 2h - summary: System network interface ${label:device} outbound drops ratio - info: Ratio of outbound dropped packets for the network interface ${label:device} over the last 10 minutes - to: silent - -# ----------------------------------------------------------------------------- -# interface errors - - template: interface_inbound_errors - on: net.errors - class: Errors - type: System -component: Network - os: freebsd - hosts: * - lookup: sum -10m unaligned absolute of inbound - units: errors - every: 1m - warn: $this >= 5 - delay: down 1h multiplier 1.5 max 2h - summary: System network interface ${label:device} inbound errors - info: Number of inbound errors for the network interface ${label:device} in the last 10 minutes - to: silent - - template: interface_outbound_errors - on: net.errors - class: Errors - type: System -component: Network - os: freebsd - hosts: * - lookup: sum -10m unaligned absolute of outbound - units: errors - every: 1m - warn: $this >= 5 - delay: down 1h multiplier 1.5 max 2h - summary: System network interface ${label:device} outbound errors - info: Number of outbound errors for the network interface ${label:device} in the last 10 minutes - to: silent - -# ----------------------------------------------------------------------------- -# FIFO errors - -# check if an interface is having FIFO -# buffer errors -# the alarm is checked every 1 minute -# and examines the last 10 minutes of data - - template: 10min_fifo_errors - on: net.fifo - class: Errors - type: System -component: Network - os: linux - hosts: * - lookup: sum -10m unaligned absolute - units: errors - every: 1m - warn: $this > 0 - delay: down 1h multiplier 1.5 max 2h - summary: System network interface ${label:device} FIFO errors - info: Number of FIFO errors for the network interface ${label:device} in the last 10 minutes - to: silent - -# ----------------------------------------------------------------------------- -# check for packet storms - -# 1. calculate the rate packets are received in 1m: 1m_received_packets_rate -# 2. do the same for the last 10s -# 3. raise an alarm if the later is 10x or 20x the first -# we assume the minimum packet storm should at least have -# 10000 packets/s, average of the last 10 seconds - - template: 1m_received_packets_rate - on: net.packets - class: Workload - type: System -component: Network - os: linux freebsd - hosts: * - lookup: average -1m unaligned of received - units: packets - every: 10s - info: Average number of packets received by the network interface ${label:device} over the last minute - - template: 10s_received_packets_storm - on: net.packets - class: Workload - type: System -component: Network - os: linux freebsd - hosts: * - lookup: average -10s unaligned of received - calc: $this * 100 / (($1m_received_packets_rate < 1000)?(1000):($1m_received_packets_rate)) - every: 10s - units: % - warn: $this > (($status >= $WARNING)?(200):(5000)) - crit: $this > (($status == $CRITICAL)?(5000):(6000)) - options: no-clear-notification - summary: System network interface ${label:device} inbound packet storm - info: Ratio of average number of received packets for the network interface ${label:device} over the last 10 seconds, \ - compared to the rate over the last minute - to: silent diff --git a/health/health.d/netfilter.conf b/health/health.d/netfilter.conf deleted file mode 100644 index 417105d4..00000000 --- a/health/health.d/netfilter.conf +++ /dev/null @@ -1,20 +0,0 @@ - -# you can disable an alarm notification by setting the 'to' line to: silent - - alarm: netfilter_conntrack_full - on: netfilter.conntrack_sockets - class: Workload - type: System -component: Network - os: linux - hosts: * - lookup: max -10s unaligned of connections - calc: $this * 100 / $netfilter_conntrack_max - units: % - every: 10s - warn: $this > (($status >= $WARNING) ? (85) : (90)) - crit: $this > (($status == $CRITICAL) ? (90) : (95)) - delay: down 5m multiplier 1.5 max 1h - summary: System Netfilter connection tracker utilization - info: Netfilter connection tracker table size utilization - to: sysadmin diff --git a/health/health.d/nvme.conf b/health/health.d/nvme.conf deleted file mode 100644 index aea402e8..00000000 --- a/health/health.d/nvme.conf +++ /dev/null @@ -1,15 +0,0 @@ -# you can disable an alarm notification by setting the 'to' line to: silent - - template: nvme_device_critical_warnings_state - on: nvme.device_critical_warnings_state - class: Errors - type: System -component: Disk - lookup: max -30s unaligned - units: state - every: 10s - crit: $this != nan AND $this != 0 - delay: down 5m multiplier 1.5 max 2h - summary: NVMe device ${label:device} state - info: NVMe device ${label:device} has critical warnings - to: sysadmin diff --git a/health/health.d/pihole.conf b/health/health.d/pihole.conf deleted file mode 100644 index c4db835c..00000000 --- a/health/health.d/pihole.conf +++ /dev/null @@ -1,33 +0,0 @@ - -# Blocklist last update time. -# Default update interval is a week. - - template: pihole_blocklist_last_update - on: pihole.blocklist_last_update - class: Errors - type: Ad Filtering -component: Pi-hole - every: 10s - units: seconds - calc: $ago - warn: $this > 60 * 60 * 24 * 30 - summary: Pi-hole blocklist last update - info: gravity.list (blocklist) file last update time - to: sysadmin - -# Pi-hole's ability to block unwanted domains. -# Should be enabled. The whole point of Pi-hole! - - template: pihole_status - on: pihole.unwanted_domains_blocking_status - class: Errors - type: Ad Filtering -component: Pi-hole - every: 10s - units: status - calc: $disabled - warn: $this != nan AND $this == 1 - delay: up 2m down 5m - summary: Pi-hole domains blocking status - info: Unwanted domains blocking is disabled - to: sysadmin diff --git a/health/health.d/ping.conf b/health/health.d/ping.conf deleted file mode 100644 index 0e434420..00000000 --- a/health/health.d/ping.conf +++ /dev/null @@ -1,50 +0,0 @@ -# you can disable an alarm notification by setting the 'to' line to: silent - - template: ping_host_reachable - on: ping.host_packet_loss - class: Errors - type: Other -component: Network - lookup: average -30s unaligned of loss - calc: $this != nan AND $this < 100 - units: up/down - every: 10s - crit: $this == 0 - delay: down 30m multiplier 1.5 max 2h - summary: Host ${label:host} ping status - info: Network host ${label:host} reachability status - to: sysadmin - - template: ping_packet_loss - on: ping.host_packet_loss - class: Errors - type: Other -component: Network - lookup: average -10m unaligned of loss - green: 5 - red: 10 - units: % - every: 10s - warn: $this > $green - crit: $this > $red - delay: down 30m multiplier 1.5 max 2h - summary: Host ${label:host} ping packet loss - info: Packet loss percentage to the network host ${label:host} over the last 10 minutes - to: sysadmin - - template: ping_host_latency - on: ping.host_rtt - class: Latency - type: Other -component: Network - lookup: average -10s unaligned of avg - units: ms - every: 10s - green: 500 - red: 1000 - warn: $this > $green OR $max > $red - crit: $this > $red - delay: down 30m multiplier 1.5 max 2h - summary: Host ${label:host} ping latency - info: Average latency to the network host ${label:host} over the last 10 seconds - to: sysadmin diff --git a/health/health.d/plugin.conf b/health/health.d/plugin.conf deleted file mode 100644 index 8615a021..00000000 --- a/health/health.d/plugin.conf +++ /dev/null @@ -1,12 +0,0 @@ - template: plugin_availability_status - on: netdata.plugin_availability_status - class: Errors - type: Netdata - calc: $now - $last_collected_t - units: seconds ago - every: 10s - warn: $this > (($status >= $WARNING) ? ($update_every) : (20 * $update_every)) - delay: down 5m multiplier 1.5 max 1h - summary: Plugin ${label:_collect_plugin} availability status - info: the amount of time that ${label:_collect_plugin} did not report its availability status - to: sysadmin diff --git a/health/health.d/portcheck.conf b/health/health.d/portcheck.conf deleted file mode 100644 index 281731c8..00000000 --- a/health/health.d/portcheck.conf +++ /dev/null @@ -1,44 +0,0 @@ - -# This is a fast-reacting no-notification alarm ideal for custom dashboards or badges - template: portcheck_service_reachable - on: portcheck.status - class: Workload - type: Other -component: TCP endpoint - lookup: average -1m unaligned percentage of success - calc: ($this < 75) ? (0) : ($this) - every: 5s - units: up/down - summary: Portcheck status for ${label:host}:${label:port} - info: TCP host ${label:host} port ${label:port} liveness status - to: silent - - template: portcheck_connection_timeouts - on: portcheck.status - class: Errors - type: Other -component: TCP endpoint - lookup: average -5m unaligned percentage of timeout - every: 10s - units: % - warn: $this >= 10 AND $this < 40 - crit: $this >= 40 - delay: down 5m multiplier 1.5 max 1h - summary: Portcheck timeouts for ${label:host}:${label:port} - info: Percentage of timed-out TCP connections to host ${label:host} port ${label:port} in the last 5 minutes - to: sysadmin - - template: portcheck_connection_fails - on: portcheck.status - class: Errors - type: Other -component: TCP endpoint - lookup: average -5m unaligned percentage of no_connection,failed - every: 10s - units: % - warn: $this >= 10 AND $this < 40 - crit: $this >= 40 - delay: down 5m multiplier 1.5 max 1h - summary: Portcheck fails for ${label:host}:${label:port} - info: Percentage of failed TCP connections to host ${label:host} port ${label:port} in the last 5 minutes - to: sysadmin diff --git a/health/health.d/postgres.conf b/health/health.d/postgres.conf deleted file mode 100644 index de4c0078..00000000 --- a/health/health.d/postgres.conf +++ /dev/null @@ -1,228 +0,0 @@ -# you can disable an alarm notification by setting the 'to' line to: silent - - template: postgres_total_connection_utilization - on: postgres.connections_utilization - class: Utilization - type: Database -component: PostgreSQL - hosts: * - lookup: average -1m unaligned of used - units: % - every: 1m - warn: $this > (($status >= $WARNING) ? (70) : (80)) - crit: $this > (($status == $CRITICAL) ? (80) : (90)) - delay: down 15m multiplier 1.5 max 1h - summary: PostgreSQL connection utilization - info: Average total connection utilization over the last minute - to: dba - - template: postgres_acquired_locks_utilization - on: postgres.locks_utilization - class: Utilization - type: Database -component: PostgreSQL - hosts: * - lookup: average -1m unaligned of used - units: % - every: 1m - warn: $this > (($status >= $WARNING) ? (15) : (20)) - delay: down 15m multiplier 1.5 max 1h - summary: PostgreSQL acquired locks utilization - info: Average acquired locks utilization over the last minute - to: dba - - template: postgres_txid_exhaustion_perc - on: postgres.txid_exhaustion_perc - class: Utilization - type: Database -component: PostgreSQL - hosts: * - calc: $txid_exhaustion - units: % - every: 1m - warn: $this > 90 - delay: down 15m multiplier 1.5 max 1h - summary: PostgreSQL TXID exhaustion - info: Percent towards TXID wraparound - to: dba - -# Database alarms - - template: postgres_db_cache_io_ratio - on: postgres.db_cache_io_ratio - class: Workload - type: Database -component: PostgreSQL - hosts: * - lookup: average -1m unaligned of miss - calc: 100 - $this - units: % - every: 1m - warn: $this < (($status >= $WARNING) ? (70) : (60)) - crit: $this < (($status == $CRITICAL) ? (60) : (50)) - delay: down 15m multiplier 1.5 max 1h - summary: PostgreSQL DB ${label:database} cache hit ratio - info: Average cache hit ratio in db ${label:database} over the last minute - to: dba - - template: postgres_db_transactions_rollback_ratio - on: postgres.db_transactions_ratio - class: Workload - type: Database -component: PostgreSQL - hosts: * - lookup: average -5m unaligned of rollback - units: % - every: 1m - warn: $this > (($status >= $WARNING) ? (0) : (2)) - delay: down 15m multiplier 1.5 max 1h - summary: PostgreSQL DB ${label:database} aborted transactions - info: Average aborted transactions percentage in db ${label:database} over the last five minutes - to: dba - - template: postgres_db_deadlocks_rate - on: postgres.db_deadlocks_rate - class: Errors - type: Database -component: PostgreSQL - hosts: * - lookup: sum -1m unaligned of deadlocks - units: deadlocks - every: 1m - warn: $this > (($status >= $WARNING) ? (0) : (10)) - delay: down 15m multiplier 1.5 max 1h - summary: PostgreSQL DB ${label:database} deadlocks rate - info: Number of deadlocks detected in db ${label:database} in the last minute - to: dba - -# Table alarms - - template: postgres_table_cache_io_ratio - on: postgres.table_cache_io_ratio - class: Workload - type: Database -component: PostgreSQL - hosts: * - lookup: average -1m unaligned of miss - calc: 100 - $this - units: % - every: 1m - warn: $this < (($status >= $WARNING) ? (70) : (60)) - crit: $this < (($status == $CRITICAL) ? (60) : (50)) - delay: down 15m multiplier 1.5 max 1h - summary: PostgreSQL table ${label:table} db ${label:database} cache hit ratio - info: Average cache hit ratio in db ${label:database} table ${label:table} over the last minute - to: dba - - template: postgres_table_index_cache_io_ratio - on: postgres.table_index_cache_io_ratio - class: Workload - type: Database -component: PostgreSQL - hosts: * - lookup: average -1m unaligned of miss - calc: 100 - $this - units: % - every: 1m - warn: $this < (($status >= $WARNING) ? (70) : (60)) - crit: $this < (($status == $CRITICAL) ? (60) : (50)) - delay: down 15m multiplier 1.5 max 1h - summary: PostgreSQL table ${label:table} db ${label:database} index cache hit ratio - info: Average index cache hit ratio in db ${label:database} table ${label:table} over the last minute - to: dba - - template: postgres_table_toast_cache_io_ratio - on: postgres.table_toast_cache_io_ratio - class: Workload - type: Database -component: PostgreSQL - hosts: * - lookup: average -1m unaligned of miss - calc: 100 - $this - units: % - every: 1m - warn: $this < (($status >= $WARNING) ? (70) : (60)) - crit: $this < (($status == $CRITICAL) ? (60) : (50)) - delay: down 15m multiplier 1.5 max 1h - summary: PostgreSQL table ${label:table} db ${label:database} toast cache hit ratio - info: Average TOAST hit ratio in db ${label:database} table ${label:table} over the last minute - to: dba - - template: postgres_table_toast_index_cache_io_ratio - on: postgres.table_toast_index_cache_io_ratio - class: Workload - type: Database -component: PostgreSQL - hosts: * - lookup: average -1m unaligned of miss - calc: 100 - $this - units: % - every: 1m - warn: $this < (($status >= $WARNING) ? (70) : (60)) - crit: $this < (($status == $CRITICAL) ? (60) : (50)) - delay: down 15m multiplier 1.5 max 1h - summary: PostgreSQL table ${label:table} db ${label:database} index toast hit ratio - info: average index TOAST hit ratio in db ${label:database} table ${label:table} over the last minute - to: dba - - template: postgres_table_bloat_size_perc - on: postgres.table_bloat_size_perc - class: Errors - type: Database -component: PostgreSQL - hosts: * - calc: ($table_size > (1024 * 1024 * 100)) ? ($bloat) : (0) - units: % - every: 1m - warn: $this > (($status >= $WARNING) ? (60) : (70)) - crit: $this > (($status == $CRITICAL) ? (70) : (80)) - delay: down 15m multiplier 1.5 max 1h - summary: PostgreSQL table ${label:table} db ${label:database} bloat size - info: Bloat size percentage in db ${label:database} table ${label:table} - to: dba - - template: postgres_table_last_autovacuum_time - on: postgres.table_autovacuum_since_time - class: Errors - type: Database -component: PostgreSQL - hosts: !* - calc: $time - units: seconds - every: 1m - warn: $this != nan AND $this > (60 * 60 * 24 * 7) - summary: PostgreSQL table ${label:table} db ${label:database} last autovacuum - info: Time elapsed since db ${label:database} table ${label:table} was vacuumed by the autovacuum daemon - to: dba - - template: postgres_table_last_autoanalyze_time - on: postgres.table_autoanalyze_since_time - class: Errors - type: Database -component: PostgreSQL - hosts: !* - calc: $time - units: seconds - every: 1m - warn: $this != nan AND $this > (60 * 60 * 24 * 7) - summary: PostgreSQL table ${label:table} db ${label:database} last autoanalyze - info: Time elapsed since db ${label:database} table ${label:table} was analyzed by the autovacuum daemon - to: dba - -# Index alarms - - template: postgres_index_bloat_size_perc - on: postgres.index_bloat_size_perc - class: Errors - type: Database -component: PostgreSQL - hosts: * - calc: ($index_size > (1024 * 1024 * 10)) ? ($bloat) : (0) - units: % - every: 1m - warn: $this > (($status >= $WARNING) ? (60) : (70)) - crit: $this > (($status == $CRITICAL) ? (70) : (80)) - delay: down 15m multiplier 1.5 max 1h - summary: PostgreSQL table ${label:table} db ${label:database} index bloat size - info: Bloat size percentage in db ${label:database} table ${label:table} index ${label:index} - to: dba diff --git a/health/health.d/processes.conf b/health/health.d/processes.conf deleted file mode 100644 index 8f2e0fda..00000000 --- a/health/health.d/processes.conf +++ /dev/null @@ -1,17 +0,0 @@ -# you can disable an alarm notification by setting the 'to' line to: silent - - alarm: active_processes - on: system.active_processes - class: Workload - type: System -component: Processes - hosts: * - calc: $active * 100 / $pidmax - units: % - every: 5s - warn: $this > (($status >= $WARNING) ? (85) : (90)) - crit: $this > (($status == $CRITICAL) ? (90) : (95)) - delay: down 5m multiplier 1.5 max 1h - summary: System PIDs utilization - info: System process IDs (PID) space utilization - to: sysadmin diff --git a/health/health.d/python.d.plugin.conf b/health/health.d/python.d.plugin.conf deleted file mode 100644 index da27ad5b..00000000 --- a/health/health.d/python.d.plugin.conf +++ /dev/null @@ -1,18 +0,0 @@ - -# make sure python.d.plugin data collection job is running - - template: python.d_job_last_collected_secs - on: netdata.pythond_runtime - class: Errors - type: Netdata -component: python.d.plugin - module: !* * - calc: $now - $last_collected_t - units: seconds ago - every: 10s - warn: $this > (($status >= $WARNING) ? ($update_every) : ( 5 * $update_every)) - crit: $this > (($status == $CRITICAL) ? ($update_every) : (60 * $update_every)) - delay: down 5m multiplier 1.5 max 1h - summary: Python.d plugin last collection - info: Number of seconds since the last successful data collection - to: webmaster diff --git a/health/health.d/qos.conf b/health/health.d/qos.conf deleted file mode 100644 index 970ea636..00000000 --- a/health/health.d/qos.conf +++ /dev/null @@ -1,18 +0,0 @@ - -# you can disable an alarm notification by setting the 'to' line to: silent - -# check if a QoS class is dropping packets -# the alarm is checked every 10 seconds -# and examines the last minute of data - -template: 10min_qos_packet_drops - on: tc.qos_dropped - os: linux - hosts: * - lookup: sum -5m unaligned absolute - every: 30s - warn: $this > 0 - units: packets - summary: QOS packet drops - info: Dropped packets in the last 5 minutes - to: silent diff --git a/health/health.d/ram.conf b/health/health.d/ram.conf deleted file mode 100644 index 51f307ca..00000000 --- a/health/health.d/ram.conf +++ /dev/null @@ -1,82 +0,0 @@ - -# you can disable an alarm notification by setting the 'to' line to: silent - - alarm: ram_in_use - on: system.ram - class: Utilization - type: System -component: Memory - os: linux - hosts: * - calc: $used * 100 / ($used + $cached + $free + $buffers) - units: % - every: 10s - warn: $this > (($status >= $WARNING) ? (80) : (90)) - crit: $this > (($status == $CRITICAL) ? (90) : (98)) - delay: down 15m multiplier 1.5 max 1h - summary: System memory utilization - info: System memory utilization - to: sysadmin - - alarm: ram_available - on: mem.available - class: Utilization - type: System -component: Memory - os: linux - hosts: * - calc: $avail * 100 / ($system.ram.used + $system.ram.cached + $system.ram.free + $system.ram.buffers) - units: % - every: 10s - warn: $this < (($status >= $WARNING) ? (15) : (10)) - delay: down 15m multiplier 1.5 max 1h - summary: System available memory - info: Percentage of estimated amount of RAM available for userspace processes, without causing swapping - to: silent - - alarm: oom_kill - on: mem.oom_kill - os: linux - hosts: * - lookup: sum -30m unaligned - units: kills - every: 5m - warn: $this > 0 - delay: down 10m - summary: System OOM kills - info: Number of out of memory kills in the last 30 minutes - to: silent - -## FreeBSD - alarm: ram_in_use - on: system.ram - class: Utilization - type: System -component: Memory - os: freebsd - hosts: * - calc: ($active + $wired + $laundry + $buffers) * 100 / ($active + $wired + $laundry + $buffers + $cache + $free + $inactive) - units: % - every: 10s - warn: $this > (($status >= $WARNING) ? (80) : (90)) - crit: $this > (($status == $CRITICAL) ? (90) : (98)) - delay: down 15m multiplier 1.5 max 1h - summary: System memory utilization - info: System memory utilization - to: sysadmin - - alarm: ram_available - on: mem.available - class: Utilization - type: System -component: Memory - os: freebsd - hosts: * - calc: $avail * 100 / ($system.ram.free + $system.ram.active + $system.ram.inactive + $system.ram.wired + $system.ram.cache + $system.ram.laundry + $system.ram.buffers) - units: % - every: 10s - warn: $this < (($status >= $WARNING) ? (15) : (10)) - delay: down 15m multiplier 1.5 max 1h - summary: System available memory - info: Percentage of estimated amount of RAM available for userspace processes, without causing swapping - to: silent diff --git a/health/health.d/redis.conf b/health/health.d/redis.conf deleted file mode 100644 index 7c2945e6..00000000 --- a/health/health.d/redis.conf +++ /dev/null @@ -1,57 +0,0 @@ -# you can disable an alarm notification by setting the 'to' line to: silent - - template: redis_connections_rejected - on: redis.connections - class: Errors - type: KV Storage -component: Redis - lookup: sum -1m unaligned of rejected - every: 10s - units: connections - warn: $this > 0 - summary: Redis rejected connections - info: Connections rejected because of maxclients limit in the last minute - delay: down 5m multiplier 1.5 max 1h - to: dba - - template: redis_bgsave_broken - on: redis.bgsave_health - class: Errors - type: KV Storage -component: Redis - every: 10s - crit: $last_bgsave != nan AND $last_bgsave != 0 - units: ok/failed - summary: Redis background save - info: Status of the last RDB save operation (0: ok, 1: error) - delay: down 5m multiplier 1.5 max 1h - to: dba - - template: redis_bgsave_slow - on: redis.bgsave_now - class: Latency - type: KV Storage -component: Redis - every: 10s - calc: $current_bgsave_time - warn: $this > 600 - crit: $this > 1200 - units: seconds - summary: Redis slow background save - info: Duration of the on-going RDB save operation - delay: down 5m multiplier 1.5 max 1h - to: dba - - template: redis_master_link_down - on: redis.master_link_down_since_time - class: Errors - type: KV Storage -component: Redis - every: 10s - calc: $time - units: seconds - crit: $this != nan AND $this > 0 - summary: Redis master link down - info: Time elapsed since the link between master and slave is down - delay: down 5m multiplier 1.5 max 1h - to: dba diff --git a/health/health.d/retroshare.conf b/health/health.d/retroshare.conf deleted file mode 100644 index c665430f..00000000 --- a/health/health.d/retroshare.conf +++ /dev/null @@ -1,17 +0,0 @@ - -# make sure the DHT is fine when active - - template: retroshare_dht_working - on: retroshare.dht - class: Utilization - type: Data Sharing -component: Retroshare - calc: $dht_size_all - units: peers - every: 1m - warn: $this < (($status >= $WARNING) ? (120) : (100)) - crit: $this < (($status == $CRITICAL) ? (10) : (1)) - delay: up 0 down 15m multiplier 1.5 max 1h - summary: Retroshare DHT peers - info: Number of DHT peers - to: sysadmin diff --git a/health/health.d/riakkv.conf b/health/health.d/riakkv.conf deleted file mode 100644 index 677e3cb4..00000000 --- a/health/health.d/riakkv.conf +++ /dev/null @@ -1,98 +0,0 @@ - -# Warn if a list keys operation is running. - template: riakkv_list_keys_active - on: riak.core.fsm_active - class: Utilization - type: Database -component: Riak KV - calc: $list_fsm_active - units: state machines - every: 10s - warn: $list_fsm_active > 0 - summary: Riak KV active list keys - info: Number of currently running list keys finite state machines - to: dba - - -## Timing healthchecks -# KV GET - template: riakkv_1h_kv_get_mean_latency - on: riak.kv.latency.get - class: Latency - type: Database -component: Riak KV - calc: $node_get_fsm_time_mean - lookup: average -1h unaligned of time - every: 30s - units: ms - info: average time between reception of client GET request and \ - subsequent response to client over the last hour - - template: riakkv_kv_get_slow - on: riak.kv.latency.get - class: Latency - type: Database -component: Riak KV - calc: $mean - lookup: average -3m unaligned of time - units: ms - every: 10s - warn: ($this > ($riakkv_1h_kv_get_mean_latency * 2) ) - crit: ($this > ($riakkv_1h_kv_get_mean_latency * 3) ) - summary: Riak KV GET latency - info: Average time between reception of client GET request and \ - subsequent response to the client over the last 3 minutes, \ - compared to the average over the last hour - delay: down 5m multiplier 1.5 max 1h - to: dba - -# KV PUT - template: riakkv_1h_kv_put_mean_latency - on: riak.kv.latency.put - class: Latency - type: Database -component: Riak KV - calc: $node_put_fsm_time_mean - lookup: average -1h unaligned of time - every: 30s - units: ms - summary: Riak KV PUT mean latency - info: Average time between reception of client PUT request and \ - subsequent response to the client over the last hour - - template: riakkv_kv_put_slow - on: riak.kv.latency.put - class: Latency - type: Database -component: Riak KV - calc: $mean - lookup: average -3m unaligned of time - units: ms - every: 10s - warn: ($this > ($riakkv_1h_kv_put_mean_latency * 2) ) - crit: ($this > ($riakkv_1h_kv_put_mean_latency * 3) ) - summary: Riak KV PUT latency - info: Average time between reception of client PUT request and \ - subsequent response to the client over the last 3 minutes, \ - compared to the average over the last hour - delay: down 5m multiplier 1.5 max 1h - to: dba - - -## VM healthchecks - -# Default Erlang VM process limit: 262144 -# On systems observed, this is < 2000, but may grow depending on load. - template: riakkv_vm_high_process_count - on: riak.vm - class: Utilization - type: Database -component: Riak KV - calc: $sys_process_count - units: processes - every: 10s - warn: $this > 10000 - crit: $this > 100000 - summary: Riak KV number of processes - info: Number of processes running in the Erlang VM - to: dba diff --git a/health/health.d/scaleio.conf b/health/health.d/scaleio.conf deleted file mode 100644 index b089cb85..00000000 --- a/health/health.d/scaleio.conf +++ /dev/null @@ -1,33 +0,0 @@ - -# make sure Storage Pool capacity utilization is under limit - - template: scaleio_storage_pool_capacity_utilization - on: scaleio.storage_pool_capacity_utilization - class: Utilization - type: Storage -component: ScaleIO - calc: $used - units: % - every: 10s - warn: $this > (($status >= $WARNING) ? (80) : (85)) - crit: $this > (($status == $CRITICAL) ? (85) : (90)) - delay: down 15m multiplier 1.5 max 1h - summary: ScaleIO storage pool capacity utilization - info: Storage pool capacity utilization - to: sysadmin - - -# make sure Sdc is connected to MDM - - template: scaleio_sdc_mdm_connection_state - on: scaleio.sdc_mdm_connection_state - class: Utilization - type: Storage -component: ScaleIO - calc: $connected - every: 10s - warn: $this != 1 - delay: up 30s down 5m multiplier 1.5 max 1h - summary: ScaleIO SDC-MDM connection state - info: Data Client (SDC) to Metadata Manager (MDM) connection state (0: disconnected, 1: connected) - to: sysadmin diff --git a/health/health.d/softnet.conf b/health/health.d/softnet.conf deleted file mode 100644 index 8d7ba566..00000000 --- a/health/health.d/softnet.conf +++ /dev/null @@ -1,57 +0,0 @@ - -# you can disable an alarm notification by setting the 'to' line to: silent - -# check for common /proc/net/softnet_stat errors - - alarm: 1min_netdev_backlog_exceeded - on: system.softnet_stat - class: Errors - type: System -component: Network - os: linux - hosts: * - lookup: average -1m unaligned absolute of dropped - units: packets - every: 10s - warn: $this > (($status >= $WARNING) ? (0) : (10)) - delay: down 1h multiplier 1.5 max 2h - summary: System netdev dropped packets - info: Average number of dropped packets in the last minute \ - due to exceeded net.core.netdev_max_backlog - to: silent - - alarm: 1min_netdev_budget_ran_outs - on: system.softnet_stat - class: Errors - type: System -component: Network - os: linux - hosts: * - lookup: average -1m unaligned absolute of squeezed - units: events - every: 10s - warn: $this > (($status >= $WARNING) ? (0) : (10)) - delay: down 1h multiplier 1.5 max 2h - summary: System netdev budget run outs - info: Average number of times ksoftirq ran out of sysctl net.core.netdev_budget or \ - net.core.netdev_budget_usecs with work remaining over the last minute \ - (this can be a cause for dropped packets) - to: silent - - alarm: 10min_netisr_backlog_exceeded - on: system.softnet_stat - class: Errors - type: System -component: Network - os: freebsd - hosts: * - lookup: average -1m unaligned absolute of qdrops - units: packets - every: 10s - warn: $this > (($status >= $WARNING) ? (0) : (10)) - delay: down 1h multiplier 1.5 max 2h - summary: System netisr drops - info: Average number of drops in the last minute \ - due to exceeded sysctl net.route.netisr_maxqlen \ - (this can be a cause for dropped packets) - to: silent diff --git a/health/health.d/swap.conf b/health/health.d/swap.conf deleted file mode 100644 index e3973399..00000000 --- a/health/health.d/swap.conf +++ /dev/null @@ -1,37 +0,0 @@ - -# you can disable an alarm notification by setting the 'to' line to: silent - - alarm: 30min_ram_swapped_out - on: mem.swapio - class: Workload - type: System -component: Memory - os: linux freebsd - hosts: * - lookup: sum -30m unaligned absolute of out - # we have to convert KB to MB by dividing $this (i.e. the result of the lookup) with 1024 - calc: $this / 1024 * 100 / ( $system.ram.used + $system.ram.cached + $system.ram.free ) - units: % of RAM - every: 1m - warn: $this > (($status >= $WARNING) ? (20) : (30)) - delay: down 15m multiplier 1.5 max 1h - summary: System memory swapped out - info: Percentage of the system RAM swapped in the last 30 minutes - to: silent - - alarm: used_swap - on: mem.swap - class: Utilization - type: System -component: Memory - os: linux freebsd - hosts: * - calc: (($used + $free) > 0) ? ($used * 100 / ($used + $free)) : 0 - units: % - every: 10s - warn: $this > (($status >= $WARNING) ? (80) : (90)) - crit: $this > (($status == $CRITICAL) ? (90) : (98)) - delay: up 30s down 15m multiplier 1.5 max 1h - summary: System swap memory utilization - info: Swap memory utilization - to: sysadmin diff --git a/health/health.d/synchronization.conf b/health/health.d/synchronization.conf deleted file mode 100644 index 6c947d90..00000000 --- a/health/health.d/synchronization.conf +++ /dev/null @@ -1,13 +0,0 @@ - alarm: sync_freq - on: mem.sync - lookup: sum -1m of sync - units: calls - plugin: ebpf.plugin - every: 1m - warn: $this > 6 - delay: up 1m down 10m multiplier 1.5 max 1h - summary: Sync system call frequency - info: Number of sync() system calls. \ - Every call causes all pending modifications to filesystem metadata and \ - cached file data to be written to the underlying filesystems. - to: silent diff --git a/health/health.d/systemdunits.conf b/health/health.d/systemdunits.conf deleted file mode 100644 index ad53a0e1..00000000 --- a/health/health.d/systemdunits.conf +++ /dev/null @@ -1,161 +0,0 @@ -# you can disable an alarm notification by setting the 'to' line to: silent - -## Service units - template: systemd_service_unit_failed_state - on: systemd.service_unit_state - class: Errors - type: Linux -component: Systemd units - module: !* * - calc: $failed - units: state - every: 10s - warn: $this != nan AND $this == 1 - delay: down 5m multiplier 1.5 max 1h - summary: systemd unit ${label:unit_name} state - info: systemd service unit in the failed state - to: sysadmin - -## Socket units - template: systemd_socket_unit_failed_state - on: systemd.socket_unit_state - class: Errors - type: Linux -component: Systemd units - module: !* * - calc: $failed - units: state - every: 10s - warn: $this != nan AND $this == 1 - delay: down 5m multiplier 1.5 max 1h - summary: systemd unit ${label:unit_name} state - info: systemd socket unit in the failed state - to: sysadmin - -## Target units - template: systemd_target_unit_failed_state - on: systemd.target_unit_state - class: Errors - type: Linux -component: Systemd units - module: !* * - calc: $failed - units: state - every: 10s - warn: $this != nan AND $this == 1 - delay: down 5m multiplier 1.5 max 1h - summary: systemd unit ${label:unit_name} state - info: systemd target unit in the failed state - to: sysadmin - -## Path units - template: systemd_path_unit_failed_state - on: systemd.path_unit_state - class: Errors - type: Linux -component: Systemd units - module: !* * - calc: $failed - units: state - every: 10s - warn: $this != nan AND $this == 1 - delay: down 5m multiplier 1.5 max 1h - summary: systemd unit ${label:unit_name} state - info: systemd path unit in the failed state - to: sysadmin - -## Device units - template: systemd_device_unit_failed_state - on: systemd.device_unit_state - class: Errors - type: Linux -component: Systemd units - module: !* * - calc: $failed - units: state - every: 10s - warn: $this != nan AND $this == 1 - delay: down 5m multiplier 1.5 max 1h - summary: systemd unit ${label:unit_name} state - info: systemd device unit in the failed state - to: sysadmin - -## Mount units - template: systemd_mount_unit_failed_state - on: systemd.mount_unit_state - class: Errors - type: Linux -component: Systemd units - module: !* * - calc: $failed - units: state - every: 10s - warn: $this != nan AND $this == 1 - delay: down 5m multiplier 1.5 max 1h - summary: systemd unit ${label:unit_name} state - info: systemd mount units in the failed state - to: sysadmin - -## Automount units - template: systemd_automount_unit_failed_state - on: systemd.automount_unit_state - class: Errors - type: Linux -component: Systemd units - module: !* * - calc: $failed - units: state - every: 10s - warn: $this != nan AND $this == 1 - delay: down 5m multiplier 1.5 max 1h - summary: systemd unit ${label:unit_name} state - info: systemd automount unit in the failed state - to: sysadmin - -## Swap units - template: systemd_swap_unit_failed_state - on: systemd.swap_unit_state - class: Errors - type: Linux -component: Systemd units - module: !* * - calc: $failed - units: state - every: 10s - warn: $this != nan AND $this == 1 - delay: down 5m multiplier 1.5 max 1h - summary: systemd unit ${label:unit_name} state - info: systemd swap units in the failed state - to: sysadmin - -## Scope units - template: systemd_scope_unit_failed_state - on: systemd.scope_unit_state - class: Errors - type: Linux -component: Systemd units - module: !* * - calc: $failed - units: state - every: 10s - warn: $this != nan AND $this == 1 - delay: down 5m multiplier 1.5 max 1h - summary: systemd unit ${label:unit_name} state - info: systemd scope units in the failed state - to: sysadmin - -## Slice units - template: systemd_slice_unit_failed_state - on: systemd.slice_unit_state - class: Errors - type: Linux -component: Systemd units - module: !* * - calc: $failed - units: state - every: 10s - warn: $this != nan AND $this == 1 - delay: down 5m multiplier 1.5 max 1h - summary: systemd unit ${label:unit_name} state - info: systemd slice units in the failed state - to: sysadmin diff --git a/health/health.d/tcp_conn.conf b/health/health.d/tcp_conn.conf deleted file mode 100644 index 2b2f9740..00000000 --- a/health/health.d/tcp_conn.conf +++ /dev/null @@ -1,23 +0,0 @@ - -# -# ${tcp_max_connections} may be nan or -1 if the system -# supports dynamic threshold for TCP connections. -# In this case, the alarm will always be zero. -# - - alarm: tcp_connections - on: ip.tcpsock - class: Workload - type: System -component: Network - os: linux - hosts: * - calc: (${tcp_max_connections} > 0) ? ( ${connections} * 100 / ${tcp_max_connections} ) : 0 - units: % - every: 10s - warn: $this > (($status >= $WARNING ) ? ( 60 ) : ( 80 )) - crit: $this > (($status == $CRITICAL) ? ( 80 ) : ( 90 )) - delay: up 0 down 5m multiplier 1.5 max 1h - summary: System TCP connections utilization - info: IPv4 TCP connections utilization - to: sysadmin diff --git a/health/health.d/tcp_listen.conf b/health/health.d/tcp_listen.conf deleted file mode 100644 index 9d1104a5..00000000 --- a/health/health.d/tcp_listen.conf +++ /dev/null @@ -1,100 +0,0 @@ -# -# There are two queues involved when incoming TCP connections are handled -# (both at the kernel): -# -# SYN queue -# The SYN queue tracks TCP handshakes until connections are fully established. -# It overflows when too many incoming TCP connection requests hang in the -# half-open state and the server is not configured to fall back to SYN cookies. -# Overflows are usually caused by SYN flood DoS attacks (i.e. someone sends -# lots of SYN packets and never completes the handshakes). -# -# Accept queue -# The accept queue holds fully established TCP connections waiting to be handled -# by the listening application. It overflows when the server application fails -# to accept new connections at the rate they are coming in. -# -# -# ----------------------------------------------------------------------------- -# tcp accept queue (at the kernel) - - alarm: 1m_tcp_accept_queue_overflows - on: ip.tcp_accept_queue - class: Workload - type: System -component: Network - os: linux - hosts: * - lookup: average -60s unaligned absolute of ListenOverflows - units: overflows - every: 10s - warn: $this > 1 - crit: $this > (($status == $CRITICAL) ? (1) : (5)) - delay: up 0 down 5m multiplier 1.5 max 1h - summary: System TCP accept queue overflows - info: Average number of overflows in the TCP accept queue over the last minute - to: silent - -# THIS IS TOO GENERIC -# CHECK: https://github.com/netdata/netdata/issues/3234#issuecomment-423935842 - alarm: 1m_tcp_accept_queue_drops - on: ip.tcp_accept_queue - class: Workload - type: System -component: Network - os: linux - hosts: * - lookup: average -60s unaligned absolute of ListenDrops - units: drops - every: 10s - warn: $this > 1 - crit: $this > (($status == $CRITICAL) ? (1) : (5)) - delay: up 0 down 5m multiplier 1.5 max 1h - summary: System TCP accept queue dropped packets - info: Average number of dropped packets in the TCP accept queue over the last minute - to: silent - - -# ----------------------------------------------------------------------------- -# tcp SYN queue (at the kernel) - -# When the SYN queue is full, either TcpExtTCPReqQFullDoCookies or -# TcpExtTCPReqQFullDrop is incremented, depending on whether SYN cookies are -# enabled or not. In both cases this probably indicates a SYN flood attack, -# so i guess a notification should be sent. - - alarm: 1m_tcp_syn_queue_drops - on: ip.tcp_syn_queue - class: Workload - type: System -component: Network - os: linux - hosts: * - lookup: average -60s unaligned absolute of TCPReqQFullDrop - units: drops - every: 10s - warn: $this > 1 - crit: $this > (($status == $CRITICAL) ? (0) : (5)) - delay: up 10 down 5m multiplier 1.5 max 1h - summary: System TCP SYN queue drops - info: Average number of SYN requests was dropped due to the full TCP SYN queue over the last minute \ - (SYN cookies were not enabled) - to: silent - - alarm: 1m_tcp_syn_queue_cookies - on: ip.tcp_syn_queue - class: Workload - type: System -component: Network - os: linux - hosts: * - lookup: average -60s unaligned absolute of TCPReqQFullDoCookies - units: cookies - every: 10s - warn: $this > 1 - crit: $this > (($status == $CRITICAL) ? (0) : (5)) - delay: up 10 down 5m multiplier 1.5 max 1h - summary: System TCP SYN queue cookies - info: Average number of sent SYN cookies due to the full TCP SYN queue over the last minute - to: silent - diff --git a/health/health.d/tcp_mem.conf b/health/health.d/tcp_mem.conf deleted file mode 100644 index 4e422ec1..00000000 --- a/health/health.d/tcp_mem.conf +++ /dev/null @@ -1,24 +0,0 @@ -# -# check -# http://blog.tsunanet.net/2011/03/out-of-socket-memory.html -# -# We give a warning when TCP is under memory pressure -# and a critical when TCP is 90% of its upper memory limit -# - - alarm: tcp_memory - on: ipv4.sockstat_tcp_mem - class: Utilization - type: System -component: Network - os: linux - hosts: * - calc: ${mem} * 100 / ${tcp_mem_high} - units: % - every: 10s - warn: ${mem} > (($status >= $WARNING ) ? ( ${tcp_mem_pressure} * 0.8 ) : ( ${tcp_mem_pressure} )) - crit: ${mem} > (($status == $CRITICAL ) ? ( ${tcp_mem_pressure} ) : ( ${tcp_mem_high} * 0.9 )) - delay: up 0 down 5m multiplier 1.5 max 1h - summary: System TCP memory utilization - info: TCP memory utilization - to: silent diff --git a/health/health.d/tcp_orphans.conf b/health/health.d/tcp_orphans.conf deleted file mode 100644 index 8f665d50..00000000 --- a/health/health.d/tcp_orphans.conf +++ /dev/null @@ -1,25 +0,0 @@ - -# -# check -# http://blog.tsunanet.net/2011/03/out-of-socket-memory.html -# -# The kernel may penalize orphans by 2x or even 4x -# so we alarm warning at 25% and critical at 50% -# - - alarm: tcp_orphans - on: ipv4.sockstat_tcp_sockets - class: Errors - type: System -component: Network - os: linux - hosts: * - calc: ${orphan} * 100 / ${tcp_max_orphans} - units: % - every: 10s - warn: $this > (($status >= $WARNING ) ? ( 20 ) : ( 25 )) - crit: $this > (($status == $CRITICAL) ? ( 25 ) : ( 50 )) - delay: up 0 down 5m multiplier 1.5 max 1h - summary: System TCP orphan sockets utilization - info: Orphan IPv4 TCP sockets utilization - to: silent diff --git a/health/health.d/tcp_resets.conf b/health/health.d/tcp_resets.conf deleted file mode 100644 index 7c39db2d..00000000 --- a/health/health.d/tcp_resets.conf +++ /dev/null @@ -1,71 +0,0 @@ - -# you can disable an alarm notification by setting the 'to' line to: silent - -# ----------------------------------------------------------------------------- -# tcp resets this host sends - - alarm: 1m_ip_tcp_resets_sent - on: ip.tcphandshake - class: Errors - type: System -component: Network - os: linux - hosts: * - lookup: average -1m at -10s unaligned absolute of OutRsts - units: tcp resets/s - every: 10s - info: average number of sent TCP RESETS over the last minute - - alarm: 10s_ip_tcp_resets_sent - on: ip.tcphandshake - class: Errors - type: System -component: Network - os: linux - hosts: * - lookup: average -10s unaligned absolute of OutRsts - units: tcp resets/s - every: 10s - warn: $netdata.uptime.uptime > (1 * 60) AND $this > ((($1m_ip_tcp_resets_sent < 5)?(5):($1m_ip_tcp_resets_sent)) * (($status >= $WARNING) ? (1) : (10))) - delay: up 20s down 60m multiplier 1.2 max 2h - options: no-clear-notification - summary: System TCP outbound resets - info: Average number of sent TCP RESETS over the last 10 seconds. \ - This can indicate a port scan, \ - or that a service running on this host has crashed. \ - Netdata will not send a clear notification for this alarm. - to: silent - -# ----------------------------------------------------------------------------- -# tcp resets this host receives - - alarm: 1m_ip_tcp_resets_received - on: ip.tcphandshake - class: Errors - type: System -component: Network - os: linux freebsd - hosts: * - lookup: average -1m at -10s unaligned absolute of AttemptFails - units: tcp resets/s - every: 10s - info: average number of received TCP RESETS over the last minute - - alarm: 10s_ip_tcp_resets_received - on: ip.tcphandshake - class: Errors - type: System -component: Network - os: linux freebsd - hosts: * - lookup: average -10s unaligned absolute of AttemptFails - units: tcp resets/s - every: 10s - warn: $netdata.uptime.uptime > (1 * 60) AND $this > ((($1m_ip_tcp_resets_received < 5)?(5):($1m_ip_tcp_resets_received)) * (($status >= $WARNING) ? (1) : (10))) - delay: up 20s down 60m multiplier 1.2 max 2h - options: no-clear-notification - summary: System TCP inbound resets - info: average number of received TCP RESETS over the last 10 seconds. \ - This can be an indication that a service this host needs has crashed. \ - Netdata will not send a clear notification for this alarm. - to: silent diff --git a/health/health.d/timex.conf b/health/health.d/timex.conf deleted file mode 100644 index 65c9628b..00000000 --- a/health/health.d/timex.conf +++ /dev/null @@ -1,18 +0,0 @@ - -# It can take several minutes before ntpd selects a server to synchronize with; -# try checking after 17 minutes (1024 seconds). - - alarm: system_clock_sync_state - on: system.clock_sync_state - os: linux - class: Errors - type: System -component: Clock - calc: $state - units: synchronization state - every: 10s - warn: $system.uptime.uptime > 17 * 60 AND $this == 0 - delay: down 5m - summary: System clock sync state - info: When set to 0, the system kernel believes the system clock is not properly synchronized to a reliable server - to: silent diff --git a/health/health.d/udp_errors.conf b/health/health.d/udp_errors.conf deleted file mode 100644 index dc094840..00000000 --- a/health/health.d/udp_errors.conf +++ /dev/null @@ -1,40 +0,0 @@ - -# you can disable an alarm notification by setting the 'to' line to: silent - -# ----------------------------------------------------------------------------- -# UDP receive buffer errors - - alarm: 1m_ipv4_udp_receive_buffer_errors - on: ipv4.udperrors - class: Errors - type: System -component: Network - os: linux freebsd - hosts: * - lookup: average -1m unaligned absolute of RcvbufErrors - units: errors - every: 10s - warn: $this > (($status >= $WARNING) ? (0) : (10)) - summary: System UDP receive buffer errors - info: Average number of UDP receive buffer errors over the last minute - delay: up 1m down 60m multiplier 1.2 max 2h - to: silent - -# ----------------------------------------------------------------------------- -# UDP send buffer errors - - alarm: 1m_ipv4_udp_send_buffer_errors - on: ipv4.udperrors - class: Errors - type: System -component: Network - os: linux - hosts: * - lookup: average -1m unaligned absolute of SndbufErrors - units: errors - every: 10s - warn: $this > (($status >= $WARNING) ? (0) : (10)) - summary: System UDP send buffer errors - info: Average number of UDP send buffer errors over the last minute - delay: up 1m down 60m multiplier 1.2 max 2h - to: silent diff --git a/health/health.d/unbound.conf b/health/health.d/unbound.conf deleted file mode 100644 index 3c898f1d..00000000 --- a/health/health.d/unbound.conf +++ /dev/null @@ -1,30 +0,0 @@ - -# make sure there is no overwritten/dropped queries in the request-list - - template: unbound_request_list_overwritten - on: unbound.request_list_jostle_list - class: Errors - type: DNS -component: Unbound - lookup: average -60s unaligned absolute match-names of overwritten - units: queries - every: 10s - warn: $this > 5 - delay: up 10 down 5m multiplier 1.5 max 1h - summary: Unbound overwritten queries - info: Number of overwritten queries in the request-list - to: sysadmin - - template: unbound_request_list_dropped - on: unbound.request_list_jostle_list - class: Errors - type: DNS -component: Unbound - lookup: average -60s unaligned absolute match-names of dropped - units: queries - every: 10s - warn: $this > 0 - delay: up 10 down 5m multiplier 1.5 max 1h - summary: Unbound dropped queries - info: Number of dropped queries in the request-list - to: sysadmin diff --git a/health/health.d/upsd.conf b/health/health.d/upsd.conf deleted file mode 100644 index 703a6488..00000000 --- a/health/health.d/upsd.conf +++ /dev/null @@ -1,50 +0,0 @@ -# you can disable an alarm notification by setting the 'to' line to: silent - - template: upsd_10min_ups_load - on: upsd.ups_load - class: Utilization - type: Power Supply -component: UPS - os: * - hosts: * - lookup: average -10m unaligned of load - units: % - every: 1m - warn: $this > (($status >= $WARNING) ? (70) : (80)) - crit: $this > (($status == $CRITICAL) ? (85) : (95)) - delay: down 10m multiplier 1.5 max 1h - summary: UPS ${label:ups_name} load - info: UPS ${label:ups_name} average load over the last 10 minutes - to: sitemgr - - template: upsd_ups_battery_charge - on: upsd.ups_battery_charge - class: Errors - type: Power Supply -component: UPS - os: * - hosts: * - lookup: average -60s unaligned of charge - units: % - every: 60s - warn: $this < 75 - crit: $this < 40 - delay: down 10m multiplier 1.5 max 1h - summary: UPS ${label:ups_name} battery charge - info: UPS ${label:ups_name} average battery charge over the last minute - to: sitemgr - - template: upsd_ups_last_collected_secs - on: upsd.ups_load - class: Latency - type: Power Supply -component: UPS device - calc: $now - $last_collected_t - every: 10s - units: seconds ago - warn: $this > (($status >= $WARNING) ? ($update_every) : ( 5 * $update_every)) - crit: $this > (($status == $CRITICAL) ? ($update_every) : (60 * $update_every)) - delay: down 5m multiplier 1.5 max 1h - summary: UPS ${label:ups_name} last collected - info: UPS ${label:ups_name} number of seconds since the last successful data collection - to: sitemgr diff --git a/health/health.d/vcsa.conf b/health/health.d/vcsa.conf deleted file mode 100644 index 3e20bfd1..00000000 --- a/health/health.d/vcsa.conf +++ /dev/null @@ -1,230 +0,0 @@ - -# Overall system health: -# - 0: all components are healthy. -# - 1: one or more components might become overloaded soon. -# - 2: one or more components in the appliance might be degraded. -# - 3: one or more components might be in an unusable status and the appliance might become unresponsive soon. -# - 4: no health data is available. - - template: vcsa_system_health_warn - on: vcsa.system_health_status - class: Errors - type: Virtual Machine -component: VMware vCenter - calc: $orange - units: status - every: 10s - warn: $this == 1 - delay: down 1m multiplier 1.5 max 1h - summary: VCSA system status - info: VCSA overall system status is orange. One or more components are degraded. - to: sysadmin - - template: vcsa_system_health_crit - on: vcsa.system_health_status - class: Errors - type: Virtual Machine -component: VMware vCenter - calc: $red - units: status - every: 10s - crit: $this == 1 - delay: down 1m multiplier 1.5 max 1h - summary: VCSA system status - info: VCSA overall system status is red. One or more components are unavailable or will stop functioning soon. - to: sysadmin - -# Components health: -# - 0: healthy. -# - 1: healthy, but may have some problems. -# - 2: degraded, and may have serious problems. -# - 3: unavailable, or will stop functioning soon. -# - 4: no health data is available. - - template: vcsa_applmgmt_health_warn - on: vcsa.applmgmt_health_status - class: Errors - type: Virtual Machine -component: VMware vCenter - calc: $orange - units: status - every: 10s - warn: $this == 1 - delay: down 1m multiplier 1.5 max 1h - summary: VCSA ApplMgmt service status - info: VCSA ApplMgmt component status is orange. It is degraded, and may have serious problems. - to: silent - - template: vcsa_applmgmt_health_crit - on: vcsa.applmgmt_health_status - class: Errors - type: Virtual Machine -component: VMware vCenter - calc: $red - units: status - every: 10s - warn: $this == 1 - delay: down 1m multiplier 1.5 max 1h - summary: VCSA ApplMgmt service status - info: VCSA ApplMgmt component status is red. It is unavailable, or will stop functioning soon. - to: sysadmin - - template: vcsa_load_health_warn - on: vcsa.load_health_status - class: Errors - type: Virtual Machine -component: VMware vCenter - calc: $orange - units: status - every: 10s - warn: $this == 1 - delay: down 1m multiplier 1.5 max 1h - summary: VCSA Load status - info: VCSA Load component status is orange. It is degraded, and may have serious problems. - to: silent - - template: vcsa_load_health_crit - on: vcsa.load_health_status - class: Errors - type: Virtual Machine -component: VMware vCenter - calc: $red - units: status - every: 10s - warn: $this == 1 - delay: down 1m multiplier 1.5 max 1h - summary: VCSA Load status - info: VCSA Load component status is red. It is unavailable, or will stop functioning soon. - to: sysadmin - - template: vcsa_mem_health_warn - on: vcsa.mem_health_status - class: Errors - type: Virtual Machine -component: VMware vCenter - calc: $orange - units: status - every: 10s - warn: $this == 1 - delay: down 1m multiplier 1.5 max 1h - summary: VCSA Memory status - info: VCSA Memory component status is orange. It is degraded, and may have serious problems. - to: silent - - template: vcsa_mem_health_crit - on: vcsa.mem_health_status - class: Errors - type: Virtual Machine -component: VMware vCenter - calc: $red - units: status - every: 10s - warn: $this == 1 - delay: down 1m multiplier 1.5 max 1h - summary: VCSA Memory status - info: VCSA Memory component status is red. It is unavailable, or will stop functioning soon. - to: sysadmin - - template: vcsa_swap_health_warn - on: vcsa.swap_health_status - class: Errors - type: Virtual Machine -component: VMware vCenter - calc: $orange - units: status - every: 10s - warn: $this == 1 - delay: down 1m multiplier 1.5 max 1h - summary: VCSA Swap status - info: VCSA Swap component status is orange. It is degraded, and may have serious problems. - to: silent - - template: vcsa_swap_health_crit - on: vcsa.swap_health_status - class: Errors - type: Virtual Machine -component: VMware vCenter - calc: $red - units: status - every: 10s - warn: $this == 1 - delay: down 1m multiplier 1.5 max 1h - summary: VCSA Swap status - info: VCSA Swap component status is red. It is unavailable, or will stop functioning soon. - to: sysadmin - - template: vcsa_database_storage_health_warn - on: vcsa.database_storage_health_status - class: Errors - type: Virtual Machine -component: VMware vCenter - calc: $orange - units: status - every: 10s - warn: $this == 1 - delay: down 1m multiplier 1.5 max 1h - summary: VCSA Database status - info: VCSA Database Storage component status is orange. It is degraded, and may have serious problems. - to: silent - - template: vcsa_database_storage_health_crit - on: vcsa.database_storage_health_status - class: Errors - type: Virtual Machine -component: VMware vCenter - calc: $red - units: status - every: 10s - warn: $this == 1 - delay: down 1m multiplier 1.5 max 1h - summary: VCSA Database status - info: VCSA Database Storage component status is red. It is unavailable, or will stop functioning soon. - to: sysadmin - - template: vcsa_storage_health_warn - on: vcsa.storage_health_status - class: Errors - type: Virtual Machine -component: VMware vCenter - calc: $orange - units: status - every: 10s - warn: $this == 1 - delay: down 1m multiplier 1.5 max 1h - summary: VCSA Storage status - info: VCSA Storage component status is orange. It is degraded, and may have serious problems. - to: silent - - template: vcsa_storage_health_crit - on: vcsa.storage_health_status - class: Errors - type: Virtual Machine -component: VMware vCenter - calc: $red - units: status - every: 10s - warn: $this == 1 - delay: down 1m multiplier 1.5 max 1h - summary: VCSA Storage status - info: VCSA Storage component status is red. It is unavailable, or will stop functioning soon. - to: sysadmin - -# Software updates health: -# - 0: no updates available. -# - 2: non-security updates are available. -# - 3: security updates are available. -# - 4: an error retrieving information on software updates. - - template: vcsa_software_packages_health_warn - on: vcsa.software_packages_health_status - class: Errors - type: Virtual Machine -component: VMware vCenter - calc: $orange - units: status - every: 10s - warn: $this == 1 - delay: down 1m multiplier 1.5 max 1h - summary: VCSA software status - info: VCSA software packages security updates are available. - to: silent diff --git a/health/health.d/vernemq.conf b/health/health.d/vernemq.conf deleted file mode 100644 index 6ea9f99d..00000000 --- a/health/health.d/vernemq.conf +++ /dev/null @@ -1,391 +0,0 @@ - -# Socket errors - - template: vernemq_socket_errors - on: vernemq.socket_errors - class: Errors - type: Messaging -component: VerneMQ - lookup: sum -1m unaligned absolute of socket_error - units: errors - every: 1m - warn: $this > (($status >= $WARNING) ? (0) : (5)) - delay: up 2m down 5m multiplier 1.5 max 2h - summary: VerneMQ socket errors - info: Number of socket errors in the last minute - to: sysadmin - -# Queues dropped/expired/unhandled PUBLISH messages - - template: vernemq_queue_message_drop - on: vernemq.queue_undelivered_messages - class: Errors - type: Messaging -component: VerneMQ - lookup: average -1m unaligned absolute of queue_message_drop - units: dropped messages - every: 1m - warn: $this > (($status >= $WARNING) ? (0) : (5)) - delay: up 2m down 5m multiplier 1.5 max 2h - summary: VerneMQ dropped messages - info: Number of dropped messages due to full queues in the last minute - to: sysadmin - - template: vernemq_queue_message_expired - on: vernemq.queue_undelivered_messages - class: Latency - type: Messaging -component: VerneMQ - lookup: average -1m unaligned absolute of queue_message_expired - units: expired messages - every: 1m - warn: $this > (($status >= $WARNING) ? (0) : (5)) - delay: up 2m down 5m multiplier 1.5 max 2h - summary: VerneMQ expired messages - info: number of messages which expired before delivery in the last minute - to: sysadmin - - template: vernemq_queue_message_unhandled - on: vernemq.queue_undelivered_messages - class: Latency - type: Messaging -component: VerneMQ - lookup: average -1m unaligned absolute of queue_message_unhandled - units: unhandled messages - every: 1m - warn: $this > (($status >= $WARNING) ? (0) : (5)) - delay: up 2m down 5m multiplier 1.5 max 2h - summary: VerneMQ unhandled messages - info: Number of unhandled messages (connections with clean session=true) in the last minute - to: sysadmin - -# Erlang VM - - template: vernemq_average_scheduler_utilization - on: vernemq.average_scheduler_utilization - class: Utilization - type: Messaging -component: VerneMQ - lookup: average -10m unaligned - units: % - every: 1m - warn: $this > (($status >= $WARNING) ? (75) : (85)) - crit: $this > (($status == $CRITICAL) ? (85) : (95)) - delay: down 15m multiplier 1.5 max 1h - summary: VerneMQ scheduler utilization - info: Average scheduler utilization over the last 10 minutes - to: sysadmin - -# Cluster communication and netsplits - - template: vernemq_cluster_dropped - on: vernemq.cluster_dropped - class: Errors - type: Messaging -component: VerneMQ - lookup: sum -1m unaligned - units: KiB - every: 1m - warn: $this > 0 - delay: up 5m down 5m multiplier 1.5 max 1h - summary: VerneMQ dropped traffic - info: Amount of traffic dropped during communication with the cluster nodes in the last minute - to: sysadmin - - template: vernemq_netsplits - on: vernemq.netsplits - class: Workload - type: Messaging -component: VerneMQ - lookup: sum -1m unaligned absolute of netsplit_detected - units: netsplits - every: 10s - warn: $this > 0 - delay: down 5m multiplier 1.5 max 2h - summary: VerneMQ netsplits - info: Number of detected netsplits (split brain situation) in the last minute - to: sysadmin - -# Unsuccessful CONNACK - - template: vernemq_mqtt_connack_sent_reason_unsuccessful - on: vernemq.mqtt_connack_sent_reason - class: Errors - type: Messaging -component: VerneMQ - lookup: average -1m unaligned absolute match-names of !success,* - units: packets - every: 1m - warn: $this > (($status >= $WARNING) ? (0) : (5)) - delay: up 2m down 5m multiplier 1.5 max 2h - summary: VerneMQ unsuccessful CONNACK - info: Number of sent unsuccessful v3/v5 CONNACK packets in the last minute - to: sysadmin - -# Not normal DISCONNECT - - template: vernemq_mqtt_disconnect_received_reason_not_normal - on: vernemq.mqtt_disconnect_received_reason - class: Workload - type: Messaging -component: VerneMQ - lookup: average -1m unaligned absolute match-names of !normal_disconnect,* - units: packets - every: 1m - warn: $this > (($status >= $WARNING) ? (0) : (5)) - delay: up 2m down 5m multiplier 1.5 max 2h - summary: VerneMQ received not normal DISCONNECT - info: Number of received not normal v5 DISCONNECT packets in the last minute - to: sysadmin - - template: vernemq_mqtt_disconnect_sent_reason_not_normal - on: vernemq.mqtt_disconnect_sent_reason - class: Errors - type: Messaging -component: VerneMQ - lookup: average -1m unaligned absolute match-names of !normal_disconnect,* - units: packets - every: 1m - warn: $this > (($status >= $WARNING) ? (0) : (5)) - delay: up 2m down 5m multiplier 1.5 max 2h - summary: VerneMQ sent not normal DISCONNECT - info: Number of sent not normal v5 DISCONNECT packets in the last minute - to: sysadmin - -# SUBSCRIBE errors and unauthorized attempts - - template: vernemq_mqtt_subscribe_error - on: vernemq.mqtt_subscribe_error - class: Errors - type: Messaging -component: VerneMQ - lookup: average -1m unaligned absolute - units: failed ops - every: 1m - warn: $this > (($status >= $WARNING) ? (0) : (5)) - delay: up 2m down 5m multiplier 1.5 max 2h - summary: VerneMQ failed SUBSCRIBE - info: Number of failed v3/v5 SUBSCRIBE operations in the last minute - to: sysadmin - - template: vernemq_mqtt_subscribe_auth_error - on: vernemq.mqtt_subscribe_auth_error - class: Workload - type: Messaging -component: VerneMQ - lookup: average -1m unaligned absolute - units: attempts - every: 1m - warn: $this > (($status >= $WARNING) ? (0) : (5)) - delay: up 2m down 5m multiplier 1.5 max 2h - summary: VerneMQ unauthorized SUBSCRIBE - info: number of unauthorized v3/v5 SUBSCRIBE attempts in the last minute - to: sysadmin - -# UNSUBSCRIBE errors - - template: vernemq_mqtt_unsubscribe_error - on: vernemq.mqtt_unsubscribe_error - class: Errors - type: Messaging -component: VerneMQ - lookup: average -1m unaligned absolute - units: failed ops - every: 1m - warn: $this > (($status >= $WARNING) ? (0) : (5)) - delay: up 2m down 5m multiplier 1.5 max 2h - summary: VerneMQ failed UNSUBSCRIBE - info: Number of failed v3/v5 UNSUBSCRIBE operations in the last minute - to: sysadmin - -# PUBLISH errors and unauthorized attempts - - template: vernemq_mqtt_publish_errors - on: vernemq.mqtt_publish_errors - class: Errors - type: Messaging -component: VerneMQ - lookup: average -1m unaligned absolute - units: failed ops - every: 1m - warn: $this > (($status >= $WARNING) ? (0) : (5)) - delay: up 2m down 5m multiplier 1.5 max 2h - summary: VerneMQ failed PUBLISH - info: Number of failed v3/v5 PUBLISH operations in the last minute - to: sysadmin - - template: vernemq_mqtt_publish_auth_errors - on: vernemq.mqtt_publish_auth_errors - class: Workload - type: Messaging -component: VerneMQ - lookup: average -1m unaligned absolute - units: attempts - every: 1m - warn: $this > (($status >= $WARNING) ? (0) : (5)) - delay: up 2m down 5m multiplier 1.5 max 2h - summary: VerneMQ unauthorized PUBLISH - info: Number of unauthorized v3/v5 PUBLISH attempts in the last minute - to: sysadmin - -# Unsuccessful and unexpected PUBACK - - template: vernemq_mqtt_puback_received_reason_unsuccessful - on: vernemq.mqtt_puback_received_reason - class: Errors - type: Messaging -component: VerneMQ - lookup: average -1m unaligned absolute match-names of !success,* - units: packets - every: 1m - warn: $this > (($status >= $WARNING) ? (0) : (5)) - delay: up 2m down 5m multiplier 1.5 max 2h - summary: VerneMQ unsuccessful received PUBACK - info: Number of received unsuccessful v5 PUBACK packets in the last minute - to: sysadmin - - template: vernemq_mqtt_puback_sent_reason_unsuccessful - on: vernemq.mqtt_puback_sent_reason - class: Errors - type: Messaging -component: VerneMQ - lookup: average -1m unaligned absolute match-names of !success,* - units: packets - every: 1m - warn: $this > (($status >= $WARNING) ? (0) : (5)) - delay: up 2m down 5m multiplier 1.5 max 2h - summary: VerneMQ unsuccessful sent PUBACK - info: Number of sent unsuccessful v5 PUBACK packets in the last minute - to: sysadmin - - template: vernemq_mqtt_puback_unexpected - on: vernemq.mqtt_puback_invalid_error - class: Workload - type: Messaging -component: VerneMQ - lookup: average -1m unaligned absolute - units: messages - every: 1m - warn: $this > (($status >= $WARNING) ? (0) : (5)) - delay: up 2m down 5m multiplier 1.5 max 2h - summary: VerneMQ unnexpected recieved PUBACK - info: Number of received unexpected v3/v5 PUBACK packets in the last minute - to: sysadmin - -# Unsuccessful and unexpected PUBREC - - template: vernemq_mqtt_pubrec_received_reason_unsuccessful - on: vernemq.mqtt_pubrec_received_reason - class: Errors - type: Messaging -component: VerneMQ - lookup: average -1m unaligned absolute match-names of !success,* - units: packets - every: 1m - warn: $this > (($status >= $WARNING) ? (0) : (5)) - delay: up 2m down 5m multiplier 1.5 max 2h - summary: VerneMQ unsuccessful received PUBREC - info: Number of received unsuccessful v5 PUBREC packets in the last minute - to: sysadmin - - template: vernemq_mqtt_pubrec_sent_reason_unsuccessful - on: vernemq.mqtt_pubrec_sent_reason - class: Errors - type: Messaging -component: VerneMQ - lookup: average -1m unaligned absolute match-names of !success,* - units: packets - every: 1m - warn: $this > (($status >= $WARNING) ? (0) : (5)) - delay: up 2m down 5m multiplier 1.5 max 2h - summary: VerneMQ unsuccessful sent PUBREC - info: Number of sent unsuccessful v5 PUBREC packets in the last minute - to: sysadmin - - template: vernemq_mqtt_pubrec_invalid_error - on: vernemq.mqtt_pubrec_invalid_error - class: Workload - type: Messaging -component: VerneMQ - lookup: average -1m unaligned absolute - units: messages - every: 1m - warn: $this > (($status >= $WARNING) ? (0) : (5)) - delay: up 2m down 5m multiplier 1.5 max 2h - summary: VerneMQ invalid received PUBREC - info: Number of received invalid v3 PUBREC packets in the last minute - to: sysadmin - -# Unsuccessful PUBREL - - template: vernemq_mqtt_pubrel_received_reason_unsuccessful - on: vernemq.mqtt_pubrel_received_reason - class: Errors - type: Messaging -component: VerneMQ - lookup: average -1m unaligned absolute match-names of !success,* - units: packets - every: 1m - warn: $this > (($status >= $WARNING) ? (0) : (5)) - delay: up 2m down 5m multiplier 1.5 max 2h - summary: VerneMQ unsuccessful received PUBREL - info: Number of received unsuccessful v5 PUBREL packets in the last minute - to: sysadmin - - template: vernemq_mqtt_pubrel_sent_reason_unsuccessful - on: vernemq.mqtt_pubrel_sent_reason - class: Errors - type: Messaging -component: VerneMQ - lookup: average -1m unaligned absolute match-names of !success,* - units: packets - every: 1m - warn: $this > (($status >= $WARNING) ? (0) : (5)) - delay: up 2m down 5m multiplier 1.5 max 2h - summary: VerneMQ unsuccessful sent PUBREL - info: number of sent unsuccessful v5 PUBREL packets in the last minute - to: sysadmin - -# Unsuccessful and unexpected PUBCOMP - - template: vernemq_mqtt_pubcomp_received_reason_unsuccessful - on: vernemq.mqtt_pubcomp_received_reason - class: Errors - type: Messaging -component: VerneMQ - lookup: average -1m unaligned absolute match-names of !success,* - units: packets - every: 1m - warn: $this > (($status >= $WARNING) ? (0) : (5)) - delay: up 2m down 5m multiplier 1.5 max 2h - summary: VerneMQ unsuccessful received PUBCOMP - info: Number of received unsuccessful v5 PUBCOMP packets in the last minute - to: sysadmin - - template: vernemq_mqtt_pubcomp_sent_reason_unsuccessful - on: vernemq.mqtt_pubcomp_sent_reason - class: Errors - type: Messaging -component: VerneMQ - lookup: average -1m unaligned absolute match-names of !success,* - units: packets - every: 1m - warn: $this > (($status >= $WARNING) ? (0) : (5)) - delay: up 2m down 5m multiplier 1.5 max 2h - summary: VerneMQ unsuccessful sent PUBCOMP - info: number of sent unsuccessful v5 PUBCOMP packets in the last minute - to: sysadmin - - template: vernemq_mqtt_pubcomp_unexpected - on: vernemq.mqtt_pubcomp_invalid_error - class: Workload - type: Messaging -component: VerneMQ - lookup: average -1m unaligned absolute - units: messages - every: 1m - warn: $this > (($status >= $WARNING) ? (0) : (5)) - delay: up 2m down 5m multiplier 1.5 max 2h - summary: VerneMQ unexpected received PUBCOMP - info: number of received unexpected v3/v5 PUBCOMP packets in the last minute - to: sysadmin diff --git a/health/health.d/vsphere.conf b/health/health.d/vsphere.conf deleted file mode 100644 index b8ad9aee..00000000 --- a/health/health.d/vsphere.conf +++ /dev/null @@ -1,70 +0,0 @@ - -# you can disable an alarm notification by setting the 'to' line to: silent - -# -----------------------------------------------Virtual Machine-------------------------------------------------------- - - template: vsphere_vm_cpu_utilization - on: vsphere.vm_cpu_utilization - class: Utilization - type: Virtual Machine -component: CPU - hosts: * - lookup: average -10m unaligned match-names of used - units: % - every: 20s - warn: $this > (($status >= $WARNING) ? (75) : (85)) - crit: $this > (($status == $CRITICAL) ? (85) : (95)) - delay: down 15m multiplier 1.5 max 1h - summary: vSphere CPU utilization for VM ${label:vm} - info: CPU utilization VM ${label:vm} host ${label:host} cluster ${label:cluster} datacenter ${label:datacenter} - to: silent - - template: vsphere_vm_mem_utilization - on: vsphere.vm_mem_utilization - class: Utilization - type: Virtual Machine -component: Memory - hosts: * - calc: $used - units: % - every: 20s - warn: $this > (($status >= $WARNING) ? (80) : (90)) - crit: $this > (($status == $CRITICAL) ? (90) : (98)) - delay: down 15m multiplier 1.5 max 1h - summary: vSphere memory utilization for VM ${label:vm} - info: Memory utilization VM ${label:vm} host ${label:host} cluster ${label:cluster} datacenter ${label:datacenter} - to: silent - -# -----------------------------------------------ESXI host-------------------------------------------------------------- - - template: vsphere_host_cpu_utilization - on: vsphere.host_cpu_utilization - class: Utilization - type: Virtual Machine -component: CPU - hosts: * - lookup: average -10m unaligned match-names of used - units: % - every: 20s - warn: $this > (($status >= $WARNING) ? (75) : (85)) - crit: $this > (($status == $CRITICAL) ? (85) : (95)) - delay: down 15m multiplier 1.5 max 1h - summary: vSphere ESXi CPU utilization for host ${label:host} - info: CPU utilization ESXi host ${label:host} cluster ${label:cluster} datacenter ${label:datacenter} - to: sysadmin - - template: vsphere_host_mem_utilization - on: vsphere.host_mem_utilization - class: Utilization - type: Virtual Machine -component: Memory - hosts: * - calc: $used - units: % - every: 20s - warn: $this > (($status >= $WARNING) ? (80) : (90)) - crit: $this > (($status == $CRITICAL) ? (90) : (98)) - delay: down 15m multiplier 1.5 max 1h - summary: vSphere ESXi Ram utilization for host ${label:host} - info: Memory utilization ESXi host ${label:host} cluster ${label:cluster} datacenter ${label:datacenter} - to: sysadmin diff --git a/health/health.d/web_log.conf b/health/health.d/web_log.conf deleted file mode 100644 index 78f1cc7f..00000000 --- a/health/health.d/web_log.conf +++ /dev/null @@ -1,205 +0,0 @@ - -# unmatched lines - -# the following alarms trigger only when there are enough data. -# we assume there are enough data when: -# -# $1m_total_requests > 120 -# -# i.e. when there are at least 120 requests during the last minute - - template: web_log_1m_total_requests - on: web_log.requests - class: Workload - type: Web Server -component: Web log - lookup: sum -1m unaligned - calc: ($this == 0)?(1):($this) - units: requests - every: 10s - info: number of HTTP requests in the last minute - - template: web_log_1m_unmatched - on: web_log.excluded_requests - class: Errors - type: Web Server -component: Web log - lookup: sum -1m unaligned of unmatched - calc: $this * 100 / $web_log_1m_total_requests - units: % - every: 10s - warn: ($web_log_1m_total_requests > 120) ? ($this > 1) : ( 0 ) - delay: up 1m down 5m multiplier 1.5 max 1h - summary: Web log unparsed - info: Percentage of unparsed log lines over the last minute - to: webmaster - -# ----------------------------------------------------------------------------- -# high level response code alarms - -# the following alarms trigger only when there are enough data. -# we assume there are enough data when: -# -# $1m_requests > 120 -# -# i.e. when there are at least 120 requests during the last minute - - template: web_log_1m_requests - on: web_log.type_requests - class: Workload - type: Web Server -component: Web log - lookup: sum -1m unaligned - calc: ($this == 0)?(1):($this) - units: requests - every: 10s - info: number of HTTP requests in the last minute - - template: web_log_1m_successful - on: web_log.type_requests - class: Workload - type: Web Server -component: Web log - lookup: sum -1m unaligned of success - calc: $this * 100 / $web_log_1m_requests - units: % - every: 10s - warn: ($web_log_1m_requests > 120) ? ($this < (($status >= $WARNING ) ? ( 95 ) : ( 85 )) ) : ( 0 ) - crit: ($web_log_1m_requests > 120) ? ($this < (($status == $CRITICAL) ? ( 85 ) : ( 75 )) ) : ( 0 ) - delay: up 2m down 15m multiplier 1.5 max 1h - summary: Web log successful - info: Ratio of successful HTTP requests over the last minute (1xx, 2xx, 304, 401) - to: webmaster - - template: web_log_1m_redirects - on: web_log.type_requests - class: Workload - type: Web Server -component: Web log - lookup: sum -1m unaligned of redirect - calc: $this * 100 / $web_log_1m_requests - units: % - every: 10s - warn: ($web_log_1m_requests > 120) ? ($this > (($status >= $WARNING ) ? ( 1 ) : ( 20 )) ) : ( 0 ) - delay: up 2m down 15m multiplier 1.5 max 1h - summary: Web log redirects - info: Ratio of redirection HTTP requests over the last minute (3xx except 304) - to: webmaster - - template: web_log_1m_bad_requests - on: web_log.type_requests - class: Errors - type: Web Server -component: Web log - lookup: sum -1m unaligned of bad - calc: $this * 100 / $web_log_1m_requests - units: % - every: 10s - warn: ($web_log_1m_requests > 120) ? ($this > (($status >= $WARNING) ? ( 10 ) : ( 30 )) ) : ( 0 ) - delay: up 2m down 15m multiplier 1.5 max 1h - summary: Web log bad requests - info: Ratio of client error HTTP requests over the last minute (4xx except 401) - to: webmaster - - template: web_log_1m_internal_errors - on: web_log.type_requests - class: Errors - type: Web Server -component: Web log - lookup: sum -1m unaligned of error - calc: $this * 100 / $web_log_1m_requests - units: % - every: 10s - warn: ($web_log_1m_requests > 120) ? ($this > (($status >= $WARNING) ? ( 1 ) : ( 2 )) ) : ( 0 ) - crit: ($web_log_1m_requests > 120) ? ($this > (($status == $CRITICAL) ? ( 2 ) : ( 5 )) ) : ( 0 ) - delay: up 2m down 15m multiplier 1.5 max 1h - summary: Web log server errors - info: Ratio of server error HTTP requests over the last minute (5xx) - to: webmaster - -# ----------------------------------------------------------------------------- -# web slow - -# the following alarms trigger only when there are enough data. -# we assume there are enough data when: -# -# $1m_requests > 120 -# -# i.e. when there are at least 120 requests during the last minute - - template: web_log_10m_response_time - on: web_log.request_processing_time - class: Latency - type: System -component: Web log - lookup: average -10m unaligned of avg - units: ms - every: 30s - info: average HTTP response time over the last 10 minutes - - template: web_log_web_slow - on: web_log.request_processing_time - class: Latency - type: Web Server -component: Web log - lookup: average -1m unaligned of avg - units: ms - every: 10s - green: 500 - red: 1000 - warn: ($web_log_1m_requests > 120) ? ($this > $green && $this > ($web_log_10m_response_time * 2) ) : ( 0 ) - crit: ($web_log_1m_requests > 120) ? ($this > $red && $this > ($web_log_10m_response_time * 4) ) : ( 0 ) - delay: down 15m multiplier 1.5 max 1h - summary: Web log processing time - info: Average HTTP response time over the last 1 minute - options: no-clear-notification - to: webmaster - -# ----------------------------------------------------------------------------- -# web too many or too few requests - -# the following alarms trigger only when there are enough data. -# we assume there are enough data when: -# -# $5m_successful_old > 120 -# -# i.e. when there were at least 120 requests during the 5 minutes starting -# at -10m and ending at -5m - - template: web_log_5m_successful_old - on: web_log.type_requests - class: Workload - type: Web Server -component: Web log - lookup: average -5m at -5m unaligned of success - units: requests/s - every: 30s - info: average number of successful HTTP requests for the 5 minutes starting 10 minutes ago - - template: web_log_5m_successful - on: web_log.type_requests - class: Workload - type: Web Server -component: Web log - lookup: average -5m unaligned of success - units: requests/s - every: 30s - info: average number of successful HTTP requests over the last 5 minutes - - template: web_log_5m_requests_ratio - on: web_log.type_requests - class: Workload - type: Web Server -component: Web log - calc: ($web_log_5m_successful_old > 0)?($web_log_5m_successful * 100 / $web_log_5m_successful_old):(100) - units: % - every: 30s - warn: ($web_log_5m_successful_old > 120) ? ($this > 200 OR $this < 50) : (0) - crit: ($web_log_5m_successful_old > 120) ? ($this > 400 OR $this < 25) : (0) - delay: down 15m multiplier 1.5 max 1h - options: no-clear-notification - summary: Web log 5 minutes requests ratio - info: Ratio of successful HTTP requests over over the last 5 minutes, \ - compared with the previous 5 minutes \ - (clear notification for this alarm will not be sent) - to: webmaster diff --git a/health/health.d/whoisquery.conf b/health/health.d/whoisquery.conf deleted file mode 100644 index 0a328b59..00000000 --- a/health/health.d/whoisquery.conf +++ /dev/null @@ -1,14 +0,0 @@ - - template: whoisquery_days_until_expiration - on: whoisquery.time_until_expiration - class: Utilization - type: Other -component: WHOIS - calc: $expiry - units: seconds - every: 60s - warn: $this < $days_until_expiration_warning*24*60*60 - crit: $this < $days_until_expiration_critical*24*60*60 - summary: Whois expiration time for domain ${label:domain} - info: Time until the domain name registration for ${label:domain} expires - to: webmaster diff --git a/health/health.d/windows.conf b/health/health.d/windows.conf deleted file mode 100644 index 706fcbf2..00000000 --- a/health/health.d/windows.conf +++ /dev/null @@ -1,126 +0,0 @@ - -## CPU - - template: windows_10min_cpu_usage - on: windows.cpu_utilization_total - class: Utilization - type: Windows -component: CPU - os: * - hosts: * - lookup: average -10m unaligned match-names of dpc,user,privileged,interrupt - units: % - every: 1m - warn: $this > (($status >= $WARNING) ? (75) : (85)) - crit: $this > (($status == $CRITICAL) ? (85) : (95)) - delay: down 15m multiplier 1.5 max 1h - summary: CPU utilization - info: Average CPU utilization over the last 10 minutes - to: silent - - -## Memory - - template: windows_ram_in_use - on: windows.memory_utilization - class: Utilization - type: Windows -component: Memory - os: * - hosts: * - calc: ($used) * 100 / ($used + $available) - units: % - every: 10s - warn: $this > (($status >= $WARNING) ? (80) : (90)) - crit: $this > (($status == $CRITICAL) ? (90) : (98)) - delay: down 15m multiplier 1.5 max 1h - summary: Ram utilization - info: Memory utilization - to: sysadmin - - -## Network - - template: windows_inbound_packets_discarded - on: windows.net_nic_discarded - class: Errors - type: Windows -component: Network - os: * - hosts: * - lookup: sum -10m unaligned absolute match-names of inbound - units: packets - every: 1m - warn: $this >= 5 - delay: down 1h multiplier 1.5 max 2h - summary: Inbound network packets discarded - info: Number of inbound discarded packets for the network interface in the last 10 minutes - to: silent - - template: windows_outbound_packets_discarded - on: windows.net_nic_discarded - class: Errors - type: Windows -component: Network - os: * - hosts: * - lookup: sum -10m unaligned absolute match-names of outbound - units: packets - every: 1m - warn: $this >= 5 - delay: down 1h multiplier 1.5 max 2h - summary: Outbound network packets discarded - info: Number of outbound discarded packets for the network interface in the last 10 minutes - to: silent - - template: windows_inbound_packets_errors - on: windows.net_nic_errors - class: Errors - type: Windows -component: Network - os: * - hosts: * - lookup: sum -10m unaligned absolute match-names of inbound - units: packets - every: 1m - warn: $this >= 5 - delay: down 1h multiplier 1.5 max 2h - summary: Inbound network errors - info: Number of inbound errors for the network interface in the last 10 minutes - to: silent - - template: windows_outbound_packets_errors - on: windows.net_nic_errors - class: Errors - type: Windows -component: Network - os: * - hosts: * - lookup: sum -10m unaligned absolute match-names of outbound - units: packets - every: 1m - warn: $this >= 5 - delay: down 1h multiplier 1.5 max 2h - summary: Outbound network errors - info: Number of outbound errors for the network interface in the last 10 minutes - to: silent - - -## Disk - - template: windows_disk_in_use - on: windows.logical_disk_space_usage - class: Utilization - type: Windows -component: Disk - os: * - hosts: * - calc: ($used) * 100 / ($used + $free) - units: % - every: 10s - warn: $this > (($status >= $WARNING) ? (80) : (90)) - crit: $this > (($status == $CRITICAL) ? (90) : (98)) - delay: down 15m multiplier 1.5 max 1h - summary: Disk space usage - info: Disk space utilization - to: sysadmin diff --git a/health/health.d/x509check.conf b/health/health.d/x509check.conf deleted file mode 100644 index d05f3ef0..00000000 --- a/health/health.d/x509check.conf +++ /dev/null @@ -1,26 +0,0 @@ - - template: x509check_days_until_expiration - on: x509check.time_until_expiration - class: Latency - type: Certificates -component: x509 certificates - calc: $expiry - units: seconds - every: 60s - warn: $this < $days_until_expiration_warning*24*60*60 - crit: $this < $days_until_expiration_critical*24*60*60 - summary: x509 certificate expiration for ${label:source} - info: Time until x509 certificate expires for ${label:source} - to: webmaster - - template: x509check_revocation_status - on: x509check.revocation_status - class: Errors - type: Certificates -component: x509 certificates - calc: $revoked - every: 60s - crit: $this != nan AND $this != 0 - summary: x509 certificate revocation status for ${label:source} - info: x509 certificate revocation status (0: revoked, 1: valid) for ${label:source} - to: webmaster diff --git a/health/health.d/zfs.conf b/health/health.d/zfs.conf deleted file mode 100644 index d2a56100..00000000 --- a/health/health.d/zfs.conf +++ /dev/null @@ -1,44 +0,0 @@ - - alarm: zfs_memory_throttle - on: zfs.memory_ops - class: Utilization - type: System -component: File system - lookup: sum -10m unaligned absolute of throttled - units: events - every: 1m - warn: $this > 0 - delay: down 1h multiplier 1.5 max 2h - summary: ZFS ARC growth throttling - info: number of times ZFS had to limit the ARC growth in the last 10 minutes - to: silent - -# ZFS pool state - - template: zfs_pool_state_warn - on: zfspool.state - class: Errors - type: System -component: File system - calc: $degraded - units: boolean - every: 10s - warn: $this > 0 - delay: down 1m multiplier 1.5 max 1h - summary: ZFS pool ${label:pool} state - info: ZFS pool ${label:pool} state is degraded - to: sysadmin - - template: zfs_pool_state_crit - on: zfspool.state - class: Errors - type: System -component: File system - calc: $faulted + $unavail - units: boolean - every: 10s - crit: $this > 0 - delay: down 1m multiplier 1.5 max 1h - summary: Critical ZFS pool ${label:pool} state - info: ZFS pool ${label:pool} state is faulted or unavail - to: sysadmin diff --git a/health/health.h b/health/health.h deleted file mode 100644 index ef246244..00000000 --- a/health/health.h +++ /dev/null @@ -1,110 +0,0 @@ -// SPDX-License-Identifier: GPL-3.0-or-later - -#ifndef NETDATA_HEALTH_H -#define NETDATA_HEALTH_H 1 - -#include "daemon/common.h" - -extern unsigned int default_health_enabled; - -typedef enum __attribute__((packed)) { - HEALTH_ENTRY_FLAG_PROCESSED = 0x00000001, // notifications engine has processed this - HEALTH_ENTRY_FLAG_UPDATED = 0x00000002, // there is a more recent update about this transition - HEALTH_ENTRY_FLAG_EXEC_RUN = 0x00000004, // notification script has been run (this is the intent, not the result) - HEALTH_ENTRY_FLAG_EXEC_FAILED = 0x00000008, // notification script couldn't be run - HEALTH_ENTRY_FLAG_SILENCED = 0x00000010, - HEALTH_ENTRY_RUN_ONCE = 0x00000020, - HEALTH_ENTRY_FLAG_EXEC_IN_PROGRESS = 0x00000040, - HEALTH_ENTRY_FLAG_IS_REPEATING = 0x00000080, - HEALTH_ENTRY_FLAG_SAVED = 0x10000000, // Saved to SQL - HEALTH_ENTRY_FLAG_ACLK_QUEUED = 0x20000000, // Sent to Netdata Cloud - HEALTH_ENTRY_FLAG_NO_CLEAR_NOTIFICATION = 0x80000000, -} HEALTH_ENTRY_FLAGS; - -void health_entry_flags_to_json_array(BUFFER *wb, const char *key, HEALTH_ENTRY_FLAGS flags); - -#ifndef HEALTH_LISTEN_PORT -#define HEALTH_LISTEN_PORT 19998 -#endif - -#ifndef HEALTH_LISTEN_BACKLOG -#define HEALTH_LISTEN_BACKLOG 4096 -#endif - -#ifndef HEALTH_LOG_DEFAULT_HISTORY -#define HEALTH_LOG_DEFAULT_HISTORY 432000 -#endif - -#ifndef HEALTH_LOG_MINIMUM_HISTORY -#define HEALTH_LOG_MINIMUM_HISTORY 86400 -#endif - -#define HEALTH_SILENCERS_MAX_FILE_LEN 10000 - -extern char *silencers_filename; -extern SIMPLE_PATTERN *conf_enabled_alarms; -extern DICTIONARY *health_rrdvars; - -void health_init(void); - -void health_reload(void); - -void health_aggregate_alarms(RRDHOST *host, BUFFER *wb, BUFFER* context, RRDCALC_STATUS status); -void health_alarms2json(RRDHOST *host, BUFFER *wb, int all); -void health_alert2json_conf(RRDHOST *host, BUFFER *wb, CONTEXTS_V2_OPTIONS all); -void health_alarms_values2json(RRDHOST *host, BUFFER *wb, int all); - -void health_api_v1_chart_variables2json(RRDSET *st, BUFFER *buf); -void health_api_v1_chart_custom_variables2json(RRDSET *st, BUFFER *buf); - -int health_alarm_log_open(RRDHOST *host); -void health_alarm_log_save(RRDHOST *host, ALARM_ENTRY *ae); -void health_alarm_log_load(RRDHOST *host); - -ALARM_ENTRY* health_create_alarm_entry( - RRDHOST *host, - uint32_t alarm_id, - uint32_t alarm_event_id, - const uuid_t config_hash_id, - time_t when, - STRING *name, - STRING *chart, - STRING *chart_context, - STRING *chart_id, - STRING *classification, - STRING *component, - STRING *type, - STRING *exec, - STRING *recipient, - time_t duration, - NETDATA_DOUBLE old_value, - NETDATA_DOUBLE new_value, - RRDCALC_STATUS old_status, - RRDCALC_STATUS new_status, - STRING *source, - STRING *units, - STRING *summary, - STRING *info, - int delay, - HEALTH_ENTRY_FLAGS flags); - -void health_alarm_log_add_entry(RRDHOST *host, ALARM_ENTRY *ae); - -void health_readdir(RRDHOST *host, const char *user_path, const char *stock_path, const char *subpath); -char *health_user_config_dir(void); -char *health_stock_config_dir(void); -void health_alarm_log_free(RRDHOST *host); - -void health_alarm_log_free_one_nochecks_nounlink(ALARM_ENTRY *ae); - -void *health_cmdapi_thread(void *ptr); - -char *health_edit_command_from_source(const char *source); -void sql_refresh_hashes(void); - -void health_string2json(BUFFER *wb, const char *prefix, const char *label, const char *value, const char *suffix); - -void health_log_alert_transition_with_trace(RRDHOST *host, ALARM_ENTRY *ae, int line, const char *file, const char *function); -#define health_log_alert(host, ae) health_log_alert_transition_with_trace(host, ae, __LINE__, __FILE__, __FUNCTION__) - -#endif //NETDATA_HEALTH_H diff --git a/health/health_config.c b/health/health_config.c deleted file mode 100644 index 27b2a71a..00000000 --- a/health/health_config.c +++ /dev/null @@ -1,1388 +0,0 @@ -// SPDX-License-Identifier: GPL-3.0-or-later - -#include "health.h" - -#define HEALTH_CONF_MAX_LINE 4096 - -#define HEALTH_ALARM_KEY "alarm" -#define HEALTH_TEMPLATE_KEY "template" -#define HEALTH_ON_KEY "on" -#define HEALTH_HOST_KEY "hosts" -#define HEALTH_OS_KEY "os" -#define HEALTH_PLUGIN_KEY "plugin" -#define HEALTH_MODULE_KEY "module" -#define HEALTH_CHARTS_KEY "charts" -#define HEALTH_LOOKUP_KEY "lookup" -#define HEALTH_CALC_KEY "calc" -#define HEALTH_EVERY_KEY "every" -#define HEALTH_GREEN_KEY "green" -#define HEALTH_RED_KEY "red" -#define HEALTH_WARN_KEY "warn" -#define HEALTH_CRIT_KEY "crit" -#define HEALTH_EXEC_KEY "exec" -#define HEALTH_RECIPIENT_KEY "to" -#define HEALTH_UNITS_KEY "units" -#define HEALTH_SUMMARY_KEY "summary" -#define HEALTH_INFO_KEY "info" -#define HEALTH_CLASS_KEY "class" -#define HEALTH_COMPONENT_KEY "component" -#define HEALTH_TYPE_KEY "type" -#define HEALTH_DELAY_KEY "delay" -#define HEALTH_OPTIONS_KEY "options" -#define HEALTH_REPEAT_KEY "repeat" -#define HEALTH_HOST_LABEL_KEY "host labels" -#define HEALTH_FOREACH_KEY "foreach" -#define HEALTH_CHART_LABEL_KEY "chart labels" - -static inline int health_parse_delay( - size_t line, const char *filename, char *string, - int *delay_up_duration, - int *delay_down_duration, - int *delay_max_duration, - float *delay_multiplier) { - - char given_up = 0; - char given_down = 0; - char given_max = 0; - char given_multiplier = 0; - - char *s = string; - while(*s) { - char *key = s; - - while(*s && !isspace(*s)) s++; - while(*s && isspace(*s)) *s++ = '\0'; - - if(!*key) break; - - char *value = s; - while(*s && !isspace(*s)) s++; - while(*s && isspace(*s)) *s++ = '\0'; - - if(!strcasecmp(key, "up")) { - if (!config_parse_duration(value, delay_up_duration)) { - netdata_log_error("Health configuration at line %zu of file '%s': invalid value '%s' for '%s' keyword", - line, filename, value, key); - } - else given_up = 1; - } - else if(!strcasecmp(key, "down")) { - if (!config_parse_duration(value, delay_down_duration)) { - netdata_log_error("Health configuration at line %zu of file '%s': invalid value '%s' for '%s' keyword", - line, filename, value, key); - } - else given_down = 1; - } - else if(!strcasecmp(key, "multiplier")) { - *delay_multiplier = strtof(value, NULL); - if(isnan(*delay_multiplier) || isinf(*delay_multiplier) || islessequal(*delay_multiplier, 0)) { - netdata_log_error("Health configuration at line %zu of file '%s': invalid value '%s' for '%s' keyword", - line, filename, value, key); - } - else given_multiplier = 1; - } - else if(!strcasecmp(key, "max")) { - if (!config_parse_duration(value, delay_max_duration)) { - netdata_log_error("Health configuration at line %zu of file '%s': invalid value '%s' for '%s' keyword", - line, filename, value, key); - } - else given_max = 1; - } - else { - netdata_log_error("Health configuration at line %zu of file '%s': unknown keyword '%s'", - line, filename, key); - } - } - - if(!given_up) - *delay_up_duration = 0; - - if(!given_down) - *delay_down_duration = 0; - - if(!given_multiplier) - *delay_multiplier = 1.0; - - if(!given_max) { - if((*delay_max_duration) < (*delay_up_duration) * (*delay_multiplier)) - *delay_max_duration = (int)((*delay_up_duration) * (*delay_multiplier)); - - if((*delay_max_duration) < (*delay_down_duration) * (*delay_multiplier)) - *delay_max_duration = (int)((*delay_down_duration) * (*delay_multiplier)); - } - - return 1; -} - -static inline uint32_t health_parse_options(const char *s) { - uint32_t options = 0; - char buf[100+1] = ""; - - while(*s) { - buf[0] = '\0'; - - // skip spaces - while(*s && isspace(*s)) - s++; - - // find the next space - size_t count = 0; - while(*s && count < 100 && !isspace(*s)) - buf[count++] = *s++; - - if(buf[0]) { - buf[count] = '\0'; - - if(!strcasecmp(buf, "no-clear-notification") || !strcasecmp(buf, "no-clear")) - options |= RRDCALC_OPTION_NO_CLEAR_NOTIFICATION; - else - netdata_log_error("Ignoring unknown alarm option '%s'", buf); - } - } - - return options; -} - -static inline int health_parse_repeat( - size_t line, - const char *file, - char *string, - uint32_t *warn_repeat_every, - uint32_t *crit_repeat_every -) { - - char *s = string; - while(*s) { - char *key = s; - - while(*s && !isspace(*s)) s++; - while(*s && isspace(*s)) *s++ = '\0'; - - if(!*key) break; - - char *value = s; - while(*s && !isspace(*s)) s++; - while(*s && isspace(*s)) *s++ = '\0'; - - if(!strcasecmp(key, "off")) { - *warn_repeat_every = 0; - *crit_repeat_every = 0; - return 1; - } - if(!strcasecmp(key, "warning")) { - if (!config_parse_duration(value, (int*)warn_repeat_every)) { - netdata_log_error("Health configuration at line %zu of file '%s': invalid value '%s' for '%s' keyword", - line, file, value, key); - } - } - else if(!strcasecmp(key, "critical")) { - if (!config_parse_duration(value, (int*)crit_repeat_every)) { - netdata_log_error("Health configuration at line %zu of file '%s': invalid value '%s' for '%s' keyword", - line, file, value, key); - } - } - } - - return 1; -} - -static inline int isvariableterm(const char s) { - if(isalnum(s) || s == '.' || s == '_') - return 0; - - return 1; -} - -// If needed, add a prefix key to all possible values in the range -static inline char *health_config_add_key_to_values(char *value) { - BUFFER *wb = buffer_create(HEALTH_CONF_MAX_LINE + 1, NULL); - char key[HEALTH_CONF_MAX_LINE + 1]; - char data[HEALTH_CONF_MAX_LINE + 1]; - - char *s = value; - size_t i = 0; - - key[0] = '\0'; - while(*s) { - if (*s == '=') { - //hold the key - data[i]='\0'; - strncpyz(key, data, HEALTH_CONF_MAX_LINE); - i=0; - } else if (*s == ' ') { - data[i]='\0'; - if (data[0]=='!') - buffer_snprintf(wb, HEALTH_CONF_MAX_LINE, "!%s=%s ", key, data + 1); - else - buffer_snprintf(wb, HEALTH_CONF_MAX_LINE, "%s=%s ", key, data); - i=0; - } else { - data[i++] = *s; - } - s++; - } - - data[i]='\0'; - if (data[0]) { - if (data[0]=='!') - buffer_snprintf(wb, HEALTH_CONF_MAX_LINE, "!%s=%s ", key, data + 1); - else - buffer_snprintf(wb, HEALTH_CONF_MAX_LINE, "%s=%s ", key, data); - } - - char *final = mallocz(HEALTH_CONF_MAX_LINE + 1); - strncpyz(final, buffer_tostring(wb), HEALTH_CONF_MAX_LINE); - buffer_free(wb); - - return final; -} - -static inline void parse_variables_and_store_in_health_rrdvars(char *value, size_t len) { - const char *s = value; - char buffer[RRDVAR_MAX_LENGTH]; - - // $ - while (*s) { - if(*s == '$') { - size_t i = 0; - s++; - - if(*s == '{') { - // ${variable_name} - - s++; - while (*s && *s != '}' && i < len) - buffer[i++] = *s++; - - if(*s == '}') - s++; - } - else { - // $variable_name - - while (*s && !isvariableterm(*s) && i < len) - buffer[i++] = *s++; - } - - buffer[i] = '\0'; - - //TODO: check and try to store only variables - STRING *name_string = rrdvar_name_to_string(buffer); - rrdvar_add("health", health_rrdvars, name_string, RRDVAR_TYPE_CALCULATED, RRDVAR_FLAG_CONFIG_VAR, NULL); - string_freez(name_string); - } else - s++; - } -} - -/** - * Health pattern from Foreach - * - * Create a new simple pattern using the user input - * - * @param s the string that will be used to create the simple pattern. - */ - -static void dimension_remove_pipe_comma(char *str) { - while(*str) { - if(*str == '|' || *str == ',') *str = ' '; - str++; - } -} - -static SIMPLE_PATTERN *health_pattern_from_foreach(const char *s) { - char *convert= strdupz(s); - SIMPLE_PATTERN *val = NULL; - - if(convert) { - dimension_remove_pipe_comma(convert); - val = simple_pattern_create(convert, NULL, SIMPLE_PATTERN_EXACT, true); - freez(convert); - } - - return val; -} - -static inline int health_parse_db_lookup( - size_t line, const char *filename, char *string, - RRDR_TIME_GROUPING *group_method, int *after, int *before, int *every, - RRDCALC_OPTIONS *options, STRING **dimensions, STRING **foreachdim -) { - netdata_log_debug(D_HEALTH, "Health configuration parsing database lookup %zu@%s: %s", line, filename, string); - - if(*dimensions) string_freez(*dimensions); - if(*foreachdim) string_freez(*foreachdim); - *dimensions = NULL; - *foreachdim = NULL; - *after = 0; - *before = 0; - *every = 0; - *options = (*options) & RRDCALC_ALL_OPTIONS_EXCLUDING_THE_RRDR_ONES; // preserve rrdcalc options - - char *s = string, *key; - - // first is the group method - key = s; - while(*s && !isspace(*s)) s++; - while(*s && isspace(*s)) *s++ = '\0'; - if(!*s) { - netdata_log_error("Health configuration invalid chart calculation at line %zu of file '%s': expected group method followed by the 'after' time, but got '%s'", - line, filename, key); - return 0; - } - - if((*group_method = time_grouping_parse(key, RRDR_GROUPING_UNDEFINED)) == RRDR_GROUPING_UNDEFINED) { - netdata_log_error("Health configuration at line %zu of file '%s': invalid group method '%s'", - line, filename, key); - return 0; - } - - // then is the 'after' time - key = s; - while(*s && !isspace(*s)) s++; - while(*s && isspace(*s)) *s++ = '\0'; - - if(!config_parse_duration(key, after)) { - netdata_log_error("Health configuration at line %zu of file '%s': invalid duration '%s' after group method", - line, filename, key); - return 0; - } - - // sane defaults - *every = ABS(*after); - - // now we may have optional parameters - while(*s) { - key = s; - while(*s && !isspace(*s)) s++; - while(*s && isspace(*s)) *s++ = '\0'; - if(!*key) break; - - if(!strcasecmp(key, "at")) { - char *value = s; - while(*s && !isspace(*s)) s++; - while(*s && isspace(*s)) *s++ = '\0'; - - if (!config_parse_duration(value, before)) { - netdata_log_error("Health configuration at line %zu of file '%s': invalid duration '%s' for '%s' keyword", - line, filename, value, key); - } - } - else if(!strcasecmp(key, HEALTH_EVERY_KEY)) { - char *value = s; - while(*s && !isspace(*s)) s++; - while(*s && isspace(*s)) *s++ = '\0'; - - if (!config_parse_duration(value, every)) { - netdata_log_error("Health configuration at line %zu of file '%s': invalid duration '%s' for '%s' keyword", - line, filename, value, key); - } - } - else if(!strcasecmp(key, "absolute") || !strcasecmp(key, "abs") || !strcasecmp(key, "absolute_sum")) { - *options |= RRDR_OPTION_ABSOLUTE; - } - else if(!strcasecmp(key, "min2max")) { - *options |= RRDR_OPTION_MIN2MAX; - } - else if(!strcasecmp(key, "null2zero")) { - *options |= RRDR_OPTION_NULL2ZERO; - } - else if(!strcasecmp(key, "percentage")) { - *options |= RRDR_OPTION_PERCENTAGE; - } - else if(!strcasecmp(key, "unaligned")) { - *options |= RRDR_OPTION_NOT_ALIGNED; - } - else if(!strcasecmp(key, "anomaly-bit")) { - *options |= RRDR_OPTION_ANOMALY_BIT; - } - else if(!strcasecmp(key, "match-ids") || !strcasecmp(key, "match_ids")) { - *options |= RRDR_OPTION_MATCH_IDS; - } - else if(!strcasecmp(key, "match-names") || !strcasecmp(key, "match_names")) { - *options |= RRDR_OPTION_MATCH_NAMES; - } - else if(!strcasecmp(key, "of")) { - char *find = NULL; - if(*s && strcasecmp(s, "all") != 0) { - find = strcasestr(s, " foreach"); - if(find) { - *find = '\0'; - } - *dimensions = string_strdupz(s); - } - - if(!find) { - break; - } - s = ++find; - } - else if(!strcasecmp(key, HEALTH_FOREACH_KEY )) { - *foreachdim = string_strdupz(s); - break; - } - else { - netdata_log_error("Health configuration at line %zu of file '%s': unknown keyword '%s'", - line, filename, key); - } - } - - return 1; -} - -static inline STRING *health_source_file(size_t line, const char *file) { - char buffer[FILENAME_MAX + 1]; - snprintfz(buffer, FILENAME_MAX, "%zu@%s", line, file); - return string_strdupz(buffer); -} - -char *health_edit_command_from_source(const char *source) -{ - char buffer[FILENAME_MAX + 1]; - char *temp = strdupz(source); - char *line_num = strchr(temp, '@'); - char *file_no_path = strrchr(temp, '/'); - - if (likely(file_no_path && line_num)) { - *line_num = '\0'; - snprintfz( - buffer, - FILENAME_MAX, - "sudo %s/edit-config health.d/%s=%s=%s", - netdata_configured_user_config_dir, - file_no_path + 1, - temp, - rrdhost_registry_hostname(localhost)); - } else - buffer[0] = '\0'; - - freez(temp); - return strdupz(buffer); -} - -static inline void strip_quotes(char *s) { - while(*s) { - if(*s == '\'' || *s == '"') *s = ' '; - s++; - } -} - -static inline void alert_config_free(struct alert_config *cfg) -{ - string_freez(cfg->alarm); - string_freez(cfg->template_key); - string_freez(cfg->os); - string_freez(cfg->host); - string_freez(cfg->on); - string_freez(cfg->plugin); - string_freez(cfg->module); - string_freez(cfg->charts); - string_freez(cfg->lookup); - string_freez(cfg->calc); - string_freez(cfg->warn); - string_freez(cfg->crit); - string_freez(cfg->every); - string_freez(cfg->green); - string_freez(cfg->red); - string_freez(cfg->exec); - string_freez(cfg->to); - string_freez(cfg->units); - string_freez(cfg->summary); - string_freez(cfg->info); - string_freez(cfg->classification); - string_freez(cfg->component); - string_freez(cfg->type); - string_freez(cfg->delay); - string_freez(cfg->options); - string_freez(cfg->repeat); - string_freez(cfg->host_labels); - string_freez(cfg->p_db_lookup_dimensions); - string_freez(cfg->p_db_lookup_method); - string_freez(cfg->chart_labels); - string_freez(cfg->source); - freez(cfg); -} - -int sql_store_hashes = 1; -static int health_readfile(const char *filename, void *data) { - RRDHOST *host = (RRDHOST *)data; - - netdata_log_debug(D_HEALTH, "Health configuration reading file '%s'", filename); - - static uint32_t - hash_alarm = 0, - hash_template = 0, - hash_os = 0, - hash_on = 0, - hash_host = 0, - hash_plugin = 0, - hash_module = 0, - hash_charts = 0, - hash_calc = 0, - hash_green = 0, - hash_red = 0, - hash_warn = 0, - hash_crit = 0, - hash_exec = 0, - hash_every = 0, - hash_lookup = 0, - hash_units = 0, - hash_summary = 0, - hash_info = 0, - hash_class = 0, - hash_component = 0, - hash_type = 0, - hash_recipient = 0, - hash_delay = 0, - hash_options = 0, - hash_repeat = 0, - hash_host_label = 0, - hash_chart_label = 0; - - char buffer[HEALTH_CONF_MAX_LINE + 1]; - - if(unlikely(!hash_alarm)) { - hash_alarm = simple_uhash(HEALTH_ALARM_KEY); - hash_template = simple_uhash(HEALTH_TEMPLATE_KEY); - hash_on = simple_uhash(HEALTH_ON_KEY); - hash_os = simple_uhash(HEALTH_OS_KEY); - hash_host = simple_uhash(HEALTH_HOST_KEY); - hash_plugin = simple_uhash(HEALTH_PLUGIN_KEY); - hash_module = simple_uhash(HEALTH_MODULE_KEY); - hash_charts = simple_uhash(HEALTH_CHARTS_KEY); - hash_calc = simple_uhash(HEALTH_CALC_KEY); - hash_lookup = simple_uhash(HEALTH_LOOKUP_KEY); - hash_green = simple_uhash(HEALTH_GREEN_KEY); - hash_red = simple_uhash(HEALTH_RED_KEY); - hash_warn = simple_uhash(HEALTH_WARN_KEY); - hash_crit = simple_uhash(HEALTH_CRIT_KEY); - hash_exec = simple_uhash(HEALTH_EXEC_KEY); - hash_every = simple_uhash(HEALTH_EVERY_KEY); - hash_units = simple_hash(HEALTH_UNITS_KEY); - hash_summary = simple_hash(HEALTH_SUMMARY_KEY); - hash_info = simple_hash(HEALTH_INFO_KEY); - hash_class = simple_uhash(HEALTH_CLASS_KEY); - hash_component = simple_uhash(HEALTH_COMPONENT_KEY); - hash_type = simple_uhash(HEALTH_TYPE_KEY); - hash_recipient = simple_hash(HEALTH_RECIPIENT_KEY); - hash_delay = simple_uhash(HEALTH_DELAY_KEY); - hash_options = simple_uhash(HEALTH_OPTIONS_KEY); - hash_repeat = simple_uhash(HEALTH_REPEAT_KEY); - hash_host_label = simple_uhash(HEALTH_HOST_LABEL_KEY); - hash_chart_label = simple_uhash(HEALTH_CHART_LABEL_KEY); - } - - FILE *fp = fopen(filename, "r"); - if(!fp) { - netdata_log_error("Health configuration cannot read file '%s'.", filename); - return 0; - } - - RRDCALC *rc = NULL; - RRDCALCTEMPLATE *rt = NULL; - struct alert_config *alert_cfg = NULL; - - int ignore_this = 0; - bool filtered_config = false; - size_t line = 0, append = 0; - char *s; - while((s = fgets(&buffer[append], (int)(HEALTH_CONF_MAX_LINE - append), fp)) || append) { - int stop_appending = !s; - line++; - s = trim(buffer); - if(!s || *s == '#') continue; - - append = strlen(s); - if(!stop_appending && s[append - 1] == '\\') { - s[append - 1] = ' '; - append = &s[append] - buffer; - if(append < HEALTH_CONF_MAX_LINE) - continue; - else { - netdata_log_error("Health configuration has too long multi-line at line %zu of file '%s'.", - line, filename); - } - } - append = 0; - - char *key = s; - while(*s && *s != ':') s++; - if(!*s) { - netdata_log_error("Health configuration has invalid line %zu of file '%s'. It does not contain a ':'. Ignoring it.", - line, filename); - continue; - } - *s = '\0'; - s++; - - char *value = s; - key = trim_all(key); - value = trim_all(value); - - if(!key) { - netdata_log_error("Health configuration has invalid line %zu of file '%s'. Keyword is empty. Ignoring it.", - line, filename); - continue; - } - - if(!value) { - netdata_log_error("Health configuration has invalid line %zu of file '%s'. value is empty. Ignoring it.", - line, filename); - continue; - } - - uint32_t hash = simple_uhash(key); - - if(hash == hash_alarm && !strcasecmp(key, HEALTH_ALARM_KEY)) { - if(rc) { - if(!alert_hash_and_store_config(rc->config_hash_id, alert_cfg, sql_store_hashes) || ignore_this) - rrdcalc_free_unused_rrdcalc_loaded_from_config(rc); - else - rrdcalc_add_from_config(host, rc); - - // health_add_alarms_loop(host, rc, ignore_this) ; - } - - if(rt) { - if(!alert_hash_and_store_config(rt->config_hash_id, alert_cfg, sql_store_hashes) || ignore_this) - rrdcalctemplate_free_unused_rrdcalctemplate_loaded_from_config(rt); - else - rrdcalctemplate_add_from_config(host, rt); - - rt = NULL; - } - - if (simple_pattern_matches(conf_enabled_alarms, value)) { - rc = callocz(1, sizeof(RRDCALC)); - rc->next_event_id = 1; - - { - char *tmp = strdupz(value); - if(rrdvar_fix_name(tmp)) - netdata_log_error("Health configuration renamed alarm '%s' to '%s'", value, tmp); - - rc->name = string_strdupz(tmp); - freez(tmp); - } - - rc->source = health_source_file(line, filename); - rc->green = NAN; - rc->red = NAN; - rc->value = NAN; - rc->old_value = NAN; - rc->delay_multiplier = 1.0; - rc->old_status = RRDCALC_STATUS_UNINITIALIZED; - rc->warn_repeat_every = host->health.health_default_warn_repeat_every; - rc->crit_repeat_every = host->health.health_default_crit_repeat_every; - if (alert_cfg) - alert_config_free(alert_cfg); - alert_cfg = callocz(1, sizeof(struct alert_config)); - - alert_cfg->alarm = string_dup(rc->name); - alert_cfg->source = health_source_file(line, filename); - ignore_this = 0; - filtered_config = false; - } else { - rc = NULL; - filtered_config = true; - } - } - else if(hash == hash_template && !strcasecmp(key, HEALTH_TEMPLATE_KEY)) { - if(rc) { -// health_add_alarms_loop(host, rc, ignore_this) ; - if(!alert_hash_and_store_config(rc->config_hash_id, alert_cfg, sql_store_hashes) || ignore_this) - rrdcalc_free_unused_rrdcalc_loaded_from_config(rc); - else - rrdcalc_add_from_config(host, rc); - - rc = NULL; - } - - if(rt) { - if(!alert_hash_and_store_config(rt->config_hash_id, alert_cfg, sql_store_hashes) || ignore_this) - rrdcalctemplate_free_unused_rrdcalctemplate_loaded_from_config(rt); - else - rrdcalctemplate_add_from_config(host, rt); - } - - if (simple_pattern_matches(conf_enabled_alarms, value)) { - rt = callocz(1, sizeof(RRDCALCTEMPLATE)); - - { - char *tmp = strdupz(value); - if(rrdvar_fix_name(tmp)) - netdata_log_error("Health configuration renamed template '%s' to '%s'", value, tmp); - - rt->name = string_strdupz(tmp); - freez(tmp); - } - - rt->source = health_source_file(line, filename); - rt->green = NAN; - rt->red = NAN; - rt->delay_multiplier = (float)1.0; - rt->warn_repeat_every = host->health.health_default_warn_repeat_every; - rt->crit_repeat_every = host->health.health_default_crit_repeat_every; - if (alert_cfg) - alert_config_free(alert_cfg); - alert_cfg = callocz(1, sizeof(struct alert_config)); - - alert_cfg->template_key = string_dup(rt->name); - alert_cfg->source = health_source_file(line, filename); - ignore_this = 0; - filtered_config = false; - } else { - rt = NULL; - filtered_config = true; - } - } - else if(hash == hash_os && !strcasecmp(key, HEALTH_OS_KEY)) { - char *os_match = value; - if (alert_cfg) alert_cfg->os = string_strdupz(value); - SIMPLE_PATTERN *os_pattern = simple_pattern_create(os_match, NULL, SIMPLE_PATTERN_EXACT, true); - - if(!simple_pattern_matches_string(os_pattern, host->os)) { - if(rc) - netdata_log_debug(D_HEALTH, "HEALTH on '%s' ignoring alarm '%s' defined at %zu@%s: host O/S does not match '%s'", rrdhost_hostname(host), rrdcalc_name(rc), line, filename, os_match); - - if(rt) - netdata_log_debug(D_HEALTH, "HEALTH on '%s' ignoring template '%s' defined at %zu@%s: host O/S does not match '%s'", rrdhost_hostname(host), rrdcalctemplate_name(rt), line, filename, os_match); - - ignore_this = 1; - } - - simple_pattern_free(os_pattern); - } - else if(hash == hash_host && !strcasecmp(key, HEALTH_HOST_KEY)) { - char *host_match = value; - if (alert_cfg) alert_cfg->host = string_strdupz(value); - SIMPLE_PATTERN *host_pattern = simple_pattern_create(host_match, NULL, SIMPLE_PATTERN_EXACT, true); - - if(!simple_pattern_matches_string(host_pattern, host->hostname)) { - if(rc) - netdata_log_debug(D_HEALTH, "HEALTH on '%s' ignoring alarm '%s' defined at %zu@%s: hostname does not match '%s'", rrdhost_hostname(host), rrdcalc_name(rc), line, filename, host_match); - - if(rt) - netdata_log_debug(D_HEALTH, "HEALTH on '%s' ignoring template '%s' defined at %zu@%s: hostname does not match '%s'", rrdhost_hostname(host), rrdcalctemplate_name(rt), line, filename, host_match); - - ignore_this = 1; - } - - simple_pattern_free(host_pattern); - } - else if(rc) { - if(hash == hash_on && !strcasecmp(key, HEALTH_ON_KEY)) { - alert_cfg->on = string_strdupz(value); - if(rc->chart) { - if(strcmp(rrdcalc_chart_name(rc), value) != 0) - netdata_log_error("Health configuration at line %zu of file '%s' for alarm '%s' has key '%s' twice, once with value '%s' and later with value '%s'. Using ('%s').", - line, filename, rrdcalc_name(rc), key, rrdcalc_chart_name(rc), value, value); - - string_freez(rc->chart); - } - rc->chart = string_strdupz(value); - } - else if(hash == hash_class && !strcasecmp(key, HEALTH_CLASS_KEY)) { - strip_quotes(value); - - alert_cfg->classification = string_strdupz(value); - if(rc->classification) { - if(strcmp(rrdcalc_classification(rc), value) != 0) - netdata_log_error("Health configuration at line %zu of file '%s' for alarm '%s' has key '%s' twice, once with value '%s' and later with value '%s'. Using ('%s').", - line, filename, rrdcalc_name(rc), key, rrdcalc_classification(rc), value, value); - - string_freez(rc->classification); - } - rc->classification = string_strdupz(value); - } - else if(hash == hash_component && !strcasecmp(key, HEALTH_COMPONENT_KEY)) { - strip_quotes(value); - - alert_cfg->component = string_strdupz(value); - if(rc->component) { - if(strcmp(rrdcalc_component(rc), value) != 0) - netdata_log_error("Health configuration at line %zu of file '%s' for alarm '%s' has key '%s' twice, once with value '%s' and later with value '%s'. Using ('%s').", - line, filename, rrdcalc_name(rc), key, rrdcalc_component(rc), value, value); - - string_freez(rc->component); - } - rc->component = string_strdupz(value); - } - else if(hash == hash_type && !strcasecmp(key, HEALTH_TYPE_KEY)) { - strip_quotes(value); - - alert_cfg->type = string_strdupz(value); - if(rc->type) { - if(strcmp(rrdcalc_type(rc), value) != 0) - netdata_log_error("Health configuration at line %zu of file '%s' for alarm '%s' has key '%s' twice, once with value '%s' and later with value '%s'. Using ('%s').", - line, filename, rrdcalc_name(rc), key, rrdcalc_type(rc), value, value); - - string_freez(rc->type); - } - rc->type = string_strdupz(value); - } - else if(hash == hash_lookup && !strcasecmp(key, HEALTH_LOOKUP_KEY)) { - alert_cfg->lookup = string_strdupz(value); - health_parse_db_lookup(line, filename, value, &rc->group, &rc->after, &rc->before, - &rc->update_every, &rc->options, &rc->dimensions, &rc->foreach_dimension); - - if(rc->foreach_dimension) - rc->foreach_dimension_pattern = health_pattern_from_foreach(rrdcalc_foreachdim(rc)); - - if (rc->after) { - if (rc->dimensions) - alert_cfg->p_db_lookup_dimensions = string_dup(rc->dimensions); - if (rc->group) - alert_cfg->p_db_lookup_method = string_strdupz(time_grouping_method2string(rc->group)); - alert_cfg->p_db_lookup_options = rc->options; - alert_cfg->p_db_lookup_after = rc->after; - alert_cfg->p_db_lookup_before = rc->before; - alert_cfg->p_update_every = rc->update_every; - } - } - else if(hash == hash_every && !strcasecmp(key, HEALTH_EVERY_KEY)) { - alert_cfg->every = string_strdupz(value); - if(!config_parse_duration(value, &rc->update_every)) - netdata_log_error("Health configuration at line %zu of file '%s' for alarm '%s' at key '%s' cannot parse duration: '%s'.", - line, filename, rrdcalc_name(rc), key, value); - alert_cfg->p_update_every = rc->update_every; - } - else if(hash == hash_green && !strcasecmp(key, HEALTH_GREEN_KEY)) { - alert_cfg->green = string_strdupz(value); - char *e; - rc->green = str2ndd(value, &e); - if(e && *e) { - netdata_log_error("Health configuration at line %zu of file '%s' for alarm '%s' at key '%s' leaves this string unmatched: '%s'.", - line, filename, rrdcalc_name(rc), key, e); - } - } - else if(hash == hash_red && !strcasecmp(key, HEALTH_RED_KEY)) { - alert_cfg->red = string_strdupz(value); - char *e; - rc->red = str2ndd(value, &e); - if(e && *e) { - netdata_log_error("Health configuration at line %zu of file '%s' for alarm '%s' at key '%s' leaves this string unmatched: '%s'.", - line, filename, rrdcalc_name(rc), key, e); - } - } - else if(hash == hash_calc && !strcasecmp(key, HEALTH_CALC_KEY)) { - alert_cfg->calc = string_strdupz(value); - const char *failed_at = NULL; - int error = 0; - rc->calculation = expression_parse(value, &failed_at, &error); - if(!rc->calculation) { - netdata_log_error("Health configuration at line %zu of file '%s' for alarm '%s' at key '%s' has unparse-able expression '%s': %s at '%s'", - line, filename, rrdcalc_name(rc), key, value, expression_strerror(error), failed_at); - } - parse_variables_and_store_in_health_rrdvars(value, HEALTH_CONF_MAX_LINE); - } - else if(hash == hash_warn && !strcasecmp(key, HEALTH_WARN_KEY)) { - alert_cfg->warn = string_strdupz(value); - const char *failed_at = NULL; - int error = 0; - rc->warning = expression_parse(value, &failed_at, &error); - if(!rc->warning) { - netdata_log_error("Health configuration at line %zu of file '%s' for alarm '%s' at key '%s' has unparse-able expression '%s': %s at '%s'", - line, filename, rrdcalc_name(rc), key, value, expression_strerror(error), failed_at); - } - parse_variables_and_store_in_health_rrdvars(value, HEALTH_CONF_MAX_LINE); - } - else if(hash == hash_crit && !strcasecmp(key, HEALTH_CRIT_KEY)) { - alert_cfg->crit = string_strdupz(value); - const char *failed_at = NULL; - int error = 0; - rc->critical = expression_parse(value, &failed_at, &error); - if(!rc->critical) { - netdata_log_error("Health configuration at line %zu of file '%s' for alarm '%s' at key '%s' has unparse-able expression '%s': %s at '%s'", - line, filename, rrdcalc_name(rc), key, value, expression_strerror(error), failed_at); - } - parse_variables_and_store_in_health_rrdvars(value, HEALTH_CONF_MAX_LINE); - } - else if(hash == hash_exec && !strcasecmp(key, HEALTH_EXEC_KEY)) { - alert_cfg->exec = string_strdupz(value); - if(rc->exec) { - if(strcmp(rrdcalc_exec(rc), value) != 0) - netdata_log_error("Health configuration at line %zu of file '%s' for alarm '%s' has key '%s' twice, once with value '%s' and later with value '%s'. Using ('%s').", - line, filename, rrdcalc_name(rc), key, rrdcalc_exec(rc), value, value); - - string_freez(rc->exec); - } - rc->exec = string_strdupz(value); - } - else if(hash == hash_recipient && !strcasecmp(key, HEALTH_RECIPIENT_KEY)) { - alert_cfg->to = string_strdupz(value); - if(rc->recipient) { - if(strcmp(rrdcalc_recipient(rc), value) != 0) - netdata_log_error("Health configuration at line %zu of file '%s' for alarm '%s' has key '%s' twice, once with value '%s' and later with value '%s'. Using ('%s').", - line, filename, rrdcalc_name(rc), key, rrdcalc_recipient(rc), value, value); - - string_freez(rc->recipient); - } - rc->recipient = string_strdupz(value); - } - else if(hash == hash_units && !strcasecmp(key, HEALTH_UNITS_KEY)) { - strip_quotes(value); - - alert_cfg->units = string_strdupz(value); - if(rc->units) { - if(strcmp(rrdcalc_units(rc), value) != 0) - netdata_log_error("Health configuration at line %zu of file '%s' for alarm '%s' has key '%s' twice, once with value '%s' and later with value '%s'. Using ('%s').", - line, filename, rrdcalc_name(rc), key, rrdcalc_units(rc), value, value); - - string_freez(rc->units); - } - rc->units = string_strdupz(value); - } - else if(hash == hash_summary && !strcasecmp(key, HEALTH_SUMMARY_KEY)) { - strip_quotes(value); - - alert_cfg->summary = string_strdupz(value); - if(rc->summary) { - if(strcmp(rrdcalc_summary(rc), value) != 0) - netdata_log_error("Health configuration at line %zu of file '%s' for alarm '%s' has key '%s' twice, once with value '%s' and later with value '%s'. Using ('%s').", - line, filename, rrdcalc_name(rc), key, rrdcalc_summary(rc), value, value); - - string_freez(rc->summary); - string_freez(rc->original_summary); - } - rc->summary = string_strdupz(value); - rc->original_summary = string_dup(rc->summary); - } - else if(hash == hash_info && !strcasecmp(key, HEALTH_INFO_KEY)) { - strip_quotes(value); - - alert_cfg->info = string_strdupz(value); - if(rc->info) { - if(strcmp(rrdcalc_info(rc), value) != 0) - netdata_log_error("Health configuration at line %zu of file '%s' for alarm '%s' has key '%s' twice, once with value '%s' and later with value '%s'. Using ('%s').", - line, filename, rrdcalc_name(rc), key, rrdcalc_info(rc), value, value); - - string_freez(rc->info); - string_freez(rc->original_info); - } - rc->info = string_strdupz(value); - rc->original_info = string_dup(rc->info); - } - else if(hash == hash_delay && !strcasecmp(key, HEALTH_DELAY_KEY)) { - alert_cfg->delay = string_strdupz(value); - health_parse_delay(line, filename, value, &rc->delay_up_duration, &rc->delay_down_duration, &rc->delay_max_duration, &rc->delay_multiplier); - } - else if(hash == hash_options && !strcasecmp(key, HEALTH_OPTIONS_KEY)) { - alert_cfg->options = string_strdupz(value); - rc->options |= health_parse_options(value); - } - else if(hash == hash_repeat && !strcasecmp(key, HEALTH_REPEAT_KEY)){ - alert_cfg->repeat = string_strdupz(value); - health_parse_repeat(line, filename, value, - &rc->warn_repeat_every, - &rc->crit_repeat_every); - } - else if(hash == hash_host_label && !strcasecmp(key, HEALTH_HOST_LABEL_KEY)) { - alert_cfg->host_labels = string_strdupz(value); - if(rc->host_labels) { - if(strcmp(rrdcalc_host_labels(rc), value) != 0) - netdata_log_error("Health configuration at line %zu of file '%s' for alarm '%s' has key '%s' twice, once with value '%s' and later with value '%s'.", - line, filename, rrdcalc_name(rc), key, value, value); - - string_freez(rc->host_labels); - simple_pattern_free(rc->host_labels_pattern); - } - - { - char *tmp = simple_pattern_trim_around_equal(value); - rc->host_labels = string_strdupz(tmp); - freez(tmp); - } - rc->host_labels_pattern = simple_pattern_create(rrdcalc_host_labels(rc), NULL, SIMPLE_PATTERN_EXACT, - true); - } - else if(hash == hash_plugin && !strcasecmp(key, HEALTH_PLUGIN_KEY)) { - alert_cfg->plugin = string_strdupz(value); - string_freez(rc->plugin_match); - simple_pattern_free(rc->plugin_pattern); - - rc->plugin_match = string_strdupz(value); - rc->plugin_pattern = simple_pattern_create(rrdcalc_plugin_match(rc), NULL, SIMPLE_PATTERN_EXACT, true); - } - else if(hash == hash_module && !strcasecmp(key, HEALTH_MODULE_KEY)) { - alert_cfg->module = string_strdupz(value); - string_freez(rc->module_match); - simple_pattern_free(rc->module_pattern); - - rc->module_match = string_strdupz(value); - rc->module_pattern = simple_pattern_create(rrdcalc_module_match(rc), NULL, SIMPLE_PATTERN_EXACT, true); - } - else if(hash == hash_chart_label && !strcasecmp(key, HEALTH_CHART_LABEL_KEY)) { - alert_cfg->chart_labels = string_strdupz(value); - if(rc->chart_labels) { - if(strcmp(rrdcalc_chart_labels(rc), value) != 0) - netdata_log_error("Health configuration at line %zu of file '%s' for alarm '%s' has key '%s' twice, once with value '%s' and later with value '%s'.", - line, filename, rrdcalc_name(rc), key, value, value); - - string_freez(rc->chart_labels); - simple_pattern_free(rc->chart_labels_pattern); - } - - { - char *tmp = simple_pattern_trim_around_equal(value); - char *tmp_2 = health_config_add_key_to_values(tmp); - rc->chart_labels = string_strdupz(tmp_2); - freez(tmp); - freez(tmp_2); - } - rc->chart_labels_pattern = simple_pattern_create(rrdcalc_chart_labels(rc), NULL, SIMPLE_PATTERN_EXACT, - true); - } - else { - // "families" has become obsolete and has been removed from standard alarms, but some still have it: - // alarms of obsolete collectors (e.g. fping, wmi). - if (strcmp(key, "families")) - netdata_log_error( - "Health configuration at line %zu of file '%s' for alarm '%s' has unknown key '%s'.", - line, - filename, - rrdcalc_name(rc), - key); - } - } - else if(rt) { - if(hash == hash_on && !strcasecmp(key, HEALTH_ON_KEY)) { - alert_cfg->on = string_strdupz(value); - if(rt->context) { - if(strcmp(string2str(rt->context), value) != 0) - netdata_log_error("Health configuration at line %zu of file '%s' for template '%s' has key '%s' twice, once with value '%s' and later with value '%s'. Using ('%s').", - line, filename, rrdcalctemplate_name(rt), key, string2str(rt->context), value, value); - - string_freez(rt->context); - } - rt->context = string_strdupz(value); - } - else if(hash == hash_class && !strcasecmp(key, HEALTH_CLASS_KEY)) { - strip_quotes(value); - - alert_cfg->classification = string_strdupz(value); - if(rt->classification) { - if(strcmp(rrdcalctemplate_classification(rt), value) != 0) - netdata_log_error("Health configuration at line %zu of file '%s' for alarm '%s' has key '%s' twice, once with value '%s' and later with value '%s'. Using ('%s').", - line, filename, rrdcalctemplate_name(rt), key, rrdcalctemplate_classification(rt), value, value); - - string_freez(rt->classification); - } - rt->classification = string_strdupz(value); - } - else if(hash == hash_component && !strcasecmp(key, HEALTH_COMPONENT_KEY)) { - strip_quotes(value); - - alert_cfg->component = string_strdupz(value); - if(rt->component) { - if(strcmp(rrdcalctemplate_component(rt), value) != 0) - netdata_log_error("Health configuration at line %zu of file '%s' for alarm '%s' has key '%s' twice, once with value '%s' and later with value '%s'. Using ('%s').", - line, filename, rrdcalctemplate_name(rt), key, rrdcalctemplate_component(rt), value, value); - - string_freez(rt->component); - } - rt->component = string_strdupz(value); - } - else if(hash == hash_type && !strcasecmp(key, HEALTH_TYPE_KEY)) { - strip_quotes(value); - - alert_cfg->type = string_strdupz(value); - if(rt->type) { - if(strcmp(rrdcalctemplate_type(rt), value) != 0) - netdata_log_error("Health configuration at line %zu of file '%s' for alarm '%s' has key '%s' twice, once with value '%s' and later with value '%s'. Using ('%s').", - line, filename, rrdcalctemplate_name(rt), key, rrdcalctemplate_type(rt), value, value); - - string_freez(rt->type); - } - rt->type = string_strdupz(value); - } - else if(hash == hash_plugin && !strcasecmp(key, HEALTH_PLUGIN_KEY)) { - alert_cfg->plugin = string_strdupz(value); - string_freez(rt->plugin_match); - simple_pattern_free(rt->plugin_pattern); - - rt->plugin_match = string_strdupz(value); - rt->plugin_pattern = simple_pattern_create(rrdcalctemplate_plugin_match(rt), NULL, SIMPLE_PATTERN_EXACT, - true); - } - else if(hash == hash_module && !strcasecmp(key, HEALTH_MODULE_KEY)) { - alert_cfg->module = string_strdupz(value); - string_freez(rt->module_match); - simple_pattern_free(rt->module_pattern); - - rt->module_match = string_strdupz(value); - rt->module_pattern = simple_pattern_create(rrdcalctemplate_module_match(rt), NULL, SIMPLE_PATTERN_EXACT, - true); - } - else if(hash == hash_charts && !strcasecmp(key, HEALTH_CHARTS_KEY)) { - alert_cfg->charts = string_strdupz(value); - string_freez(rt->charts_match); - simple_pattern_free(rt->charts_pattern); - - rt->charts_match = string_strdupz(value); - rt->charts_pattern = simple_pattern_create(rrdcalctemplate_charts_match(rt), NULL, SIMPLE_PATTERN_EXACT, - true); - } - else if(hash == hash_lookup && !strcasecmp(key, HEALTH_LOOKUP_KEY)) { - alert_cfg->lookup = string_strdupz(value); - health_parse_db_lookup(line, filename, value, &rt->group, &rt->after, &rt->before, - &rt->update_every, &rt->options, &rt->dimensions, &rt->foreach_dimension); - - if(rt->foreach_dimension) - rt->foreach_dimension_pattern = health_pattern_from_foreach(rrdcalctemplate_foreachdim(rt)); - - if (rt->after) { - if (rt->dimensions) - alert_cfg->p_db_lookup_dimensions = string_dup(rt->dimensions); - - if (rt->group) - alert_cfg->p_db_lookup_method = string_strdupz(time_grouping_method2string(rt->group)); - - alert_cfg->p_db_lookup_options = rt->options; - alert_cfg->p_db_lookup_after = rt->after; - alert_cfg->p_db_lookup_before = rt->before; - alert_cfg->p_update_every = rt->update_every; - } - } - else if(hash == hash_every && !strcasecmp(key, HEALTH_EVERY_KEY)) { - alert_cfg->every = string_strdupz(value); - if(!config_parse_duration(value, &rt->update_every)) - netdata_log_error("Health configuration at line %zu of file '%s' for template '%s' at key '%s' cannot parse duration: '%s'.", - line, filename, rrdcalctemplate_name(rt), key, value); - alert_cfg->p_update_every = rt->update_every; - } - else if(hash == hash_green && !strcasecmp(key, HEALTH_GREEN_KEY)) { - alert_cfg->green = string_strdupz(value); - char *e; - rt->green = str2ndd(value, &e); - if(e && *e) { - netdata_log_error("Health configuration at line %zu of file '%s' for template '%s' at key '%s' leaves this string unmatched: '%s'.", - line, filename, rrdcalctemplate_name(rt), key, e); - } - } - else if(hash == hash_red && !strcasecmp(key, HEALTH_RED_KEY)) { - alert_cfg->red = string_strdupz(value); - char *e; - rt->red = str2ndd(value, &e); - if(e && *e) { - netdata_log_error("Health configuration at line %zu of file '%s' for template '%s' at key '%s' leaves this string unmatched: '%s'.", - line, filename, rrdcalctemplate_name(rt), key, e); - } - } - else if(hash == hash_calc && !strcasecmp(key, HEALTH_CALC_KEY)) { - alert_cfg->calc = string_strdupz(value); - const char *failed_at = NULL; - int error = 0; - rt->calculation = expression_parse(value, &failed_at, &error); - if(!rt->calculation) { - netdata_log_error("Health configuration at line %zu of file '%s' for template '%s' at key '%s' has unparse-able expression '%s': %s at '%s'", - line, filename, rrdcalctemplate_name(rt), key, value, expression_strerror(error), failed_at); - } - parse_variables_and_store_in_health_rrdvars(value, HEALTH_CONF_MAX_LINE); - } - else if(hash == hash_warn && !strcasecmp(key, HEALTH_WARN_KEY)) { - alert_cfg->warn = string_strdupz(value); - const char *failed_at = NULL; - int error = 0; - rt->warning = expression_parse(value, &failed_at, &error); - if(!rt->warning) { - netdata_log_error("Health configuration at line %zu of file '%s' for template '%s' at key '%s' has unparse-able expression '%s': %s at '%s'", - line, filename, rrdcalctemplate_name(rt), key, value, expression_strerror(error), failed_at); - } - parse_variables_and_store_in_health_rrdvars(value, HEALTH_CONF_MAX_LINE); - } - else if(hash == hash_crit && !strcasecmp(key, HEALTH_CRIT_KEY)) { - alert_cfg->crit = string_strdupz(value); - const char *failed_at = NULL; - int error = 0; - rt->critical = expression_parse(value, &failed_at, &error); - if(!rt->critical) { - netdata_log_error("Health configuration at line %zu of file '%s' for template '%s' at key '%s' has unparse-able expression '%s': %s at '%s'", - line, filename, rrdcalctemplate_name(rt), key, value, expression_strerror(error), failed_at); - } - parse_variables_and_store_in_health_rrdvars(value, HEALTH_CONF_MAX_LINE); - } - else if(hash == hash_exec && !strcasecmp(key, HEALTH_EXEC_KEY)) { - alert_cfg->exec = string_strdupz(value); - if(rt->exec) { - if(strcmp(rrdcalctemplate_exec(rt), value) != 0) - netdata_log_error("Health configuration at line %zu of file '%s' for template '%s' has key '%s' twice, once with value '%s' and later with value '%s'. Using ('%s').", - line, filename, rrdcalctemplate_name(rt), key, rrdcalctemplate_exec(rt), value, value); - - string_freez(rt->exec); - } - rt->exec = string_strdupz(value); - } - else if(hash == hash_recipient && !strcasecmp(key, HEALTH_RECIPIENT_KEY)) { - alert_cfg->to = string_strdupz(value); - if(rt->recipient) { - if(strcmp(rrdcalctemplate_recipient(rt), value) != 0) - netdata_log_error("Health configuration at line %zu of file '%s' for template '%s' has key '%s' twice, once with value '%s' and later with value '%s'. Using ('%s').", - line, filename, rrdcalctemplate_name(rt), key, rrdcalctemplate_recipient(rt), value, value); - - string_freez(rt->recipient); - } - rt->recipient = string_strdupz(value); - } - else if(hash == hash_units && !strcasecmp(key, HEALTH_UNITS_KEY)) { - strip_quotes(value); - - alert_cfg->units = string_strdupz(value); - if(rt->units) { - if(strcmp(rrdcalctemplate_units(rt), value) != 0) - netdata_log_error("Health configuration at line %zu of file '%s' for template '%s' has key '%s' twice, once with value '%s' and later with value '%s'. Using ('%s').", - line, filename, rrdcalctemplate_name(rt), key, rrdcalctemplate_units(rt), value, value); - - string_freez(rt->units); - } - rt->units = string_strdupz(value); - } - else if(hash == hash_summary && !strcasecmp(key, HEALTH_SUMMARY_KEY)) { - strip_quotes(value); - - alert_cfg->summary = string_strdupz(value); - if(rt->summary) { - if(strcmp(rrdcalctemplate_summary(rt), value) != 0) - netdata_log_error("Health configuration at line %zu of file '%s' for template '%s' has key '%s' twice, once with value '%s' and later with value '%s'. Using ('%s').", - line, filename, rrdcalctemplate_name(rt), key, rrdcalctemplate_summary(rt), value, value); - - string_freez(rt->summary); - } - rt->summary = string_strdupz(value); - } - else if(hash == hash_info && !strcasecmp(key, HEALTH_INFO_KEY)) { - strip_quotes(value); - - alert_cfg->info = string_strdupz(value); - if(rt->info) { - if(strcmp(rrdcalctemplate_info(rt), value) != 0) - netdata_log_error("Health configuration at line %zu of file '%s' for template '%s' has key '%s' twice, once with value '%s' and later with value '%s'. Using ('%s').", - line, filename, rrdcalctemplate_name(rt), key, rrdcalctemplate_info(rt), value, value); - - string_freez(rt->info); - } - rt->info = string_strdupz(value); - } - else if(hash == hash_delay && !strcasecmp(key, HEALTH_DELAY_KEY)) { - alert_cfg->delay = string_strdupz(value); - health_parse_delay(line, filename, value, &rt->delay_up_duration, &rt->delay_down_duration, &rt->delay_max_duration, &rt->delay_multiplier); - } - else if(hash == hash_options && !strcasecmp(key, HEALTH_OPTIONS_KEY)) { - alert_cfg->options = string_strdupz(value); - rt->options |= health_parse_options(value); - } - else if(hash == hash_repeat && !strcasecmp(key, HEALTH_REPEAT_KEY)){ - alert_cfg->repeat = string_strdupz(value); - health_parse_repeat(line, filename, value, - &rt->warn_repeat_every, - &rt->crit_repeat_every); - } - else if(hash == hash_host_label && !strcasecmp(key, HEALTH_HOST_LABEL_KEY)) { - alert_cfg->host_labels = string_strdupz(value); - if(rt->host_labels) { - if(strcmp(rrdcalctemplate_host_labels(rt), value) != 0) - netdata_log_error("Health configuration at line %zu of file '%s' for template '%s' has key '%s' twice, once with value '%s' and later with value '%s'. Using ('%s').", - line, filename, rrdcalctemplate_name(rt), key, rrdcalctemplate_host_labels(rt), value, value); - - string_freez(rt->host_labels); - simple_pattern_free(rt->host_labels_pattern); - } - - { - char *tmp = simple_pattern_trim_around_equal(value); - rt->host_labels = string_strdupz(tmp); - freez(tmp); - } - - rt->host_labels_pattern = simple_pattern_create(rrdcalctemplate_host_labels(rt), NULL, - SIMPLE_PATTERN_EXACT, true); - } - else if(hash == hash_chart_label && !strcasecmp(key, HEALTH_CHART_LABEL_KEY)) { - alert_cfg->chart_labels = string_strdupz(value); - if(rt->chart_labels) { - if(strcmp(rrdcalctemplate_chart_labels(rt), value) != 0) - netdata_log_error("Health configuration at line %zu of file '%s' for template '%s' has key '%s' twice, once with value '%s' and later with value '%s'. Using ('%s').", - line, filename, rrdcalctemplate_name(rt), key, rrdcalctemplate_chart_labels(rt), value, value); - - string_freez(rt->chart_labels); - simple_pattern_free(rt->chart_labels_pattern); - } - - { - char *tmp = simple_pattern_trim_around_equal(value); - char *tmp_2 = health_config_add_key_to_values(tmp); - rt->chart_labels = string_strdupz(tmp_2); - freez(tmp); - freez(tmp_2); - } - rt->chart_labels_pattern = simple_pattern_create(rrdcalctemplate_chart_labels(rt), NULL, - SIMPLE_PATTERN_EXACT, true); - } - else { - if (strcmp(key, "families") != 0) - netdata_log_error("Health configuration at line %zu of file '%s' for template '%s' has unknown key '%s'.", - line, filename, rrdcalctemplate_name(rt), key); - } - } - else { - if (!filtered_config) - netdata_log_error("Health configuration at line %zu of file '%s' has unknown key '%s'. Expected either '" HEALTH_ALARM_KEY "' or '" HEALTH_TEMPLATE_KEY "'.", line, filename, key); - } - } - - if(rc) { - //health_add_alarms_loop(host, rc, ignore_this) ; - if(!alert_hash_and_store_config(rc->config_hash_id, alert_cfg, sql_store_hashes) || ignore_this) - rrdcalc_free_unused_rrdcalc_loaded_from_config(rc); - else - rrdcalc_add_from_config(host, rc); - } - - if(rt) { - if(!alert_hash_and_store_config(rt->config_hash_id, alert_cfg, sql_store_hashes) || ignore_this) - rrdcalctemplate_free_unused_rrdcalctemplate_loaded_from_config(rt); - else - rrdcalctemplate_add_from_config(host, rt); - } - - if (alert_cfg) - alert_config_free(alert_cfg); - - fclose(fp); - return 1; -} - -void sql_refresh_hashes(void) -{ - sql_store_hashes = 1; -} - -void health_readdir(RRDHOST *host, const char *user_path, const char *stock_path, const char *subpath) { - if(unlikely((!host->health.health_enabled) && !rrdhost_flag_check(host, RRDHOST_FLAG_INITIALIZED_HEALTH)) || - !service_running(SERVICE_HEALTH)) { - netdata_log_debug(D_HEALTH, "CONFIG health is not enabled for host '%s'", rrdhost_hostname(host)); - return; - } - - int stock_enabled = (int)config_get_boolean(CONFIG_SECTION_HEALTH, "enable stock health configuration", - CONFIG_BOOLEAN_YES); - - if (!stock_enabled) { - nd_log(NDLS_DAEMON, NDLP_DEBUG, - "[%s]: Netdata will not load stock alarms.", - rrdhost_hostname(host)); - - stock_path = user_path; - } - - if (!health_rrdvars) - health_rrdvars = health_rrdvariables_create(); - - recursive_config_double_dir_load(user_path, stock_path, subpath, health_readfile, (void *) host, 0); - - nd_log(NDLS_DAEMON, NDLP_DEBUG, - "[%s]: Read health configuration.", - rrdhost_hostname(host)); - - sql_store_hashes = 0; -} diff --git a/health/health_json.c b/health/health_json.c deleted file mode 100644 index 124b7d4e..00000000 --- a/health/health_json.c +++ /dev/null @@ -1,265 +0,0 @@ -// SPDX-License-Identifier: GPL-3.0-or-later - -#include "health.h" - -void health_string2json(BUFFER *wb, const char *prefix, const char *label, const char *value, const char *suffix) { - if(value && *value) { - buffer_sprintf(wb, "%s\"%s\":\"", prefix, label); - buffer_strcat_htmlescape(wb, value); - buffer_strcat(wb, "\""); - buffer_strcat(wb, suffix); - } - else - buffer_sprintf(wb, "%s\"%s\":null%s", prefix, label, suffix); -} - -static inline void health_rrdcalc_values2json_nolock(RRDHOST *host, BUFFER *wb, RRDCALC *rc) { - (void)host; - buffer_sprintf(wb, - "\t\t\"%s.%s\": {\n" - "\t\t\t\"id\": %lu,\n" - , rrdcalc_chart_name(rc), rrdcalc_name(rc) - , (unsigned long)rc->id); - - buffer_strcat(wb, "\t\t\t\"value\":"); - buffer_print_netdata_double(wb, rc->value); - buffer_strcat(wb, ",\n"); - - buffer_strcat(wb, "\t\t\t\"last_updated\":"); - buffer_sprintf(wb, "%lu", (unsigned long)rc->last_updated); - buffer_strcat(wb, ",\n"); - - buffer_sprintf(wb, - "\t\t\t\"status\": \"%s\"\n" - , rrdcalc_status2string(rc->status)); - - buffer_strcat(wb, "\t\t}"); -} - -static inline void health_rrdcalc2json_nolock(RRDHOST *host, BUFFER *wb, RRDCALC *rc) { - char value_string[100 + 1]; - format_value_and_unit(value_string, 100, rc->value, rrdcalc_units(rc), -1); - - char hash_id[GUID_LEN + 1]; - uuid_unparse_lower(rc->config_hash_id, hash_id); - - buffer_sprintf(wb, - "\t\t\"%s.%s\": {\n" - "\t\t\t\"id\": %lu,\n" - "\t\t\t\"config_hash_id\": \"%s\",\n" - "\t\t\t\"name\": \"%s\",\n" - "\t\t\t\"chart\": \"%s\",\n" - "\t\t\t\"class\": \"%s\",\n" - "\t\t\t\"component\": \"%s\",\n" - "\t\t\t\"type\": \"%s\",\n" - "\t\t\t\"active\": %s,\n" - "\t\t\t\"disabled\": %s,\n" - "\t\t\t\"silenced\": %s,\n" - "\t\t\t\"exec\": \"%s\",\n" - "\t\t\t\"recipient\": \"%s\",\n" - "\t\t\t\"source\": \"%s\",\n" - "\t\t\t\"units\": \"%s\",\n" - "\t\t\t\"summary\": \"%s\",\n" - "\t\t\t\"info\": \"%s\",\n" - "\t\t\t\"status\": \"%s\",\n" - "\t\t\t\"last_status_change\": %lu,\n" - "\t\t\t\"last_updated\": %lu,\n" - "\t\t\t\"next_update\": %lu,\n" - "\t\t\t\"update_every\": %d,\n" - "\t\t\t\"delay_up_duration\": %d,\n" - "\t\t\t\"delay_down_duration\": %d,\n" - "\t\t\t\"delay_max_duration\": %d,\n" - "\t\t\t\"delay_multiplier\": %f,\n" - "\t\t\t\"delay\": %d,\n" - "\t\t\t\"delay_up_to_timestamp\": %lu,\n" - "\t\t\t\"warn_repeat_every\": \"%u\",\n" - "\t\t\t\"crit_repeat_every\": \"%u\",\n" - "\t\t\t\"value_string\": \"%s\",\n" - "\t\t\t\"last_repeat\": \"%lu\",\n" - "\t\t\t\"times_repeat\": %lu,\n" - , rrdcalc_chart_name(rc), rrdcalc_name(rc) - , (unsigned long)rc->id - , hash_id - , rrdcalc_name(rc) - , rrdcalc_chart_name(rc) - , rc->classification?rrdcalc_classification(rc):"Unknown" - , rc->component?rrdcalc_component(rc):"Unknown" - , rc->type?rrdcalc_type(rc):"Unknown" - , (rc->rrdset)?"true":"false" - , (rc->run_flags & RRDCALC_FLAG_DISABLED)?"true":"false" - , (rc->run_flags & RRDCALC_FLAG_SILENCED)?"true":"false" - , rc->exec?rrdcalc_exec(rc):string2str(host->health.health_default_exec) - , rc->recipient?rrdcalc_recipient(rc):string2str(host->health.health_default_recipient) - , rrdcalc_source(rc) - , rrdcalc_units(rc) - , rrdcalc_summary(rc) - , rrdcalc_info(rc) - , rrdcalc_status2string(rc->status) - , (unsigned long)rc->last_status_change - , (unsigned long)rc->last_updated - , (unsigned long)rc->next_update - , rc->update_every - , rc->delay_up_duration - , rc->delay_down_duration - , rc->delay_max_duration - , rc->delay_multiplier - , rc->delay_last - , (unsigned long)rc->delay_up_to_timestamp - , rc->warn_repeat_every - , rc->crit_repeat_every - , value_string - , (unsigned long)rc->last_repeat - , (unsigned long)rc->times_repeat - ); - - if(unlikely(rc->options & RRDCALC_OPTION_NO_CLEAR_NOTIFICATION)) { - buffer_strcat(wb, "\t\t\t\"no_clear_notification\": true,\n"); - } - - if(RRDCALC_HAS_DB_LOOKUP(rc)) { - if(rc->dimensions) - health_string2json(wb, "\t\t\t", "lookup_dimensions", rrdcalc_dimensions(rc), ",\n"); - - buffer_sprintf(wb, - "\t\t\t\"db_after\": %lu,\n" - "\t\t\t\"db_before\": %lu,\n" - "\t\t\t\"lookup_method\": \"%s\",\n" - "\t\t\t\"lookup_after\": %d,\n" - "\t\t\t\"lookup_before\": %d,\n" - "\t\t\t\"lookup_options\": \"", - (unsigned long) rc->db_after, - (unsigned long) rc->db_before, - time_grouping_method2string(rc->group), - rc->after, - rc->before - ); - buffer_data_options2string(wb, rc->options); - buffer_strcat(wb, "\",\n"); - } - - if(rc->calculation) { - health_string2json(wb, "\t\t\t", "calc", rc->calculation->source, ",\n"); - health_string2json(wb, "\t\t\t", "calc_parsed", rc->calculation->parsed_as, ",\n"); - } - - if(rc->warning) { - health_string2json(wb, "\t\t\t", "warn", rc->warning->source, ",\n"); - health_string2json(wb, "\t\t\t", "warn_parsed", rc->warning->parsed_as, ",\n"); - } - - if(rc->critical) { - health_string2json(wb, "\t\t\t", "crit", rc->critical->source, ",\n"); - health_string2json(wb, "\t\t\t", "crit_parsed", rc->critical->parsed_as, ",\n"); - } - - buffer_strcat(wb, "\t\t\t\"green\":"); - buffer_print_netdata_double(wb, rc->green); - buffer_strcat(wb, ",\n"); - - buffer_strcat(wb, "\t\t\t\"red\":"); - buffer_print_netdata_double(wb, rc->red); - buffer_strcat(wb, ",\n"); - - buffer_strcat(wb, "\t\t\t\"value\":"); - buffer_print_netdata_double(wb, rc->value); - buffer_strcat(wb, "\n"); - - buffer_strcat(wb, "\t\t}"); -} - -void health_aggregate_alarms(RRDHOST *host, BUFFER *wb, BUFFER* contexts, RRDCALC_STATUS status) { - RRDCALC *rc; - int numberOfAlarms = 0; - char *tok = NULL; - char *p = NULL; - - if (contexts) { - p = (char*)buffer_tostring(contexts); - while(p && *p && (tok = strsep_skip_consecutive_separators(&p, ", |"))) { - if(!*tok) continue; - - STRING *tok_string = string_strdupz(tok); - - foreach_rrdcalc_in_rrdhost_read(host, rc) { - if(unlikely(!rc->rrdset || !rc->rrdset->last_collected_time.tv_sec)) - continue; - if (unlikely(!rrdset_is_available_for_exporting_and_alarms(rc->rrdset))) - continue; - if(unlikely(rc->rrdset - && rc->rrdset->context == tok_string - && ((status==RRDCALC_STATUS_RAISED)?(rc->status >= RRDCALC_STATUS_WARNING):rc->status == status))) - numberOfAlarms++; - } - foreach_rrdcalc_in_rrdhost_done(rc); - - string_freez(tok_string); - } - } - else { - foreach_rrdcalc_in_rrdhost_read(host, rc) { - if(unlikely(!rc->rrdset || !rc->rrdset->last_collected_time.tv_sec)) - continue; - if (unlikely(!rrdset_is_available_for_exporting_and_alarms(rc->rrdset))) - continue; - if(unlikely((status==RRDCALC_STATUS_RAISED)?(rc->status >= RRDCALC_STATUS_WARNING):rc->status == status)) - numberOfAlarms++; - } - foreach_rrdcalc_in_rrdhost_done(rc); - } - - buffer_sprintf(wb, "%d", numberOfAlarms); -} - -static void health_alarms2json_fill_alarms(RRDHOST *host, BUFFER *wb, int all, void (*fp)(RRDHOST *, BUFFER *, RRDCALC *)) { - RRDCALC *rc; - int i = 0; - foreach_rrdcalc_in_rrdhost_read(host, rc) { - if(unlikely(!rc->rrdset || !rc->rrdset->last_collected_time.tv_sec)) - continue; - - if (unlikely(!rrdset_is_available_for_exporting_and_alarms(rc->rrdset))) - continue; - - if(likely(!all && !(rc->status == RRDCALC_STATUS_WARNING || rc->status == RRDCALC_STATUS_CRITICAL))) - continue; - - if(likely(i)) buffer_strcat(wb, ",\n"); - fp(host, wb, rc); - i++; - } - foreach_rrdcalc_in_rrdhost_done(rc); -} - -void health_alarms2json(RRDHOST *host, BUFFER *wb, int all) { - buffer_sprintf(wb, "{\n\t\"hostname\": \"%s\"," - "\n\t\"latest_alarm_log_unique_id\": %u," - "\n\t\"status\": %s," - "\n\t\"now\": %lu," - "\n\t\"alarms\": {\n", - rrdhost_hostname(host), - (host->health_log.next_log_id > 0)?(host->health_log.next_log_id - 1):0, - host->health.health_enabled?"true":"false", - (unsigned long)now_realtime_sec()); - - health_alarms2json_fill_alarms(host, wb, all, health_rrdcalc2json_nolock); - -// rrdhost_rdlock(host); -// buffer_strcat(wb, "\n\t},\n\t\"templates\": {"); -// RRDCALCTEMPLATE *rt; -// for(rt = host->templates; rt ; rt = rt->next) -// health_rrdcalctemplate2json_nolock(wb, rt); -// rrdhost_unlock(host); - - buffer_strcat(wb, "\n\t}\n}\n"); -} - -void health_alarms_values2json(RRDHOST *host, BUFFER *wb, int all) { - buffer_sprintf(wb, "{\n\t\"hostname\": \"%s\"," - "\n\t\"alarms\": {\n", - rrdhost_hostname(host)); - - health_alarms2json_fill_alarms(host, wb, all, health_rrdcalc_values2json_nolock); - - buffer_strcat(wb, "\n\t}\n}\n"); -} - diff --git a/health/health_log.c b/health/health_log.c deleted file mode 100644 index fd124ce8..00000000 --- a/health/health_log.c +++ /dev/null @@ -1,235 +0,0 @@ -// SPDX-License-Identifier: GPL-3.0-or-later - -#include "health.h" - -// ---------------------------------------------------------------------------- - -inline void health_alarm_log_save(RRDHOST *host, ALARM_ENTRY *ae) { - sql_health_alarm_log_save(host, ae); -} - - -void health_log_alert_transition_with_trace(RRDHOST *host, ALARM_ENTRY *ae, int line, const char *file, const char *function) { - ND_LOG_STACK lgs[] = { - ND_LOG_FIELD_UUID(NDF_MESSAGE_ID, &health_alert_transition_msgid), - ND_LOG_FIELD_STR(NDF_NIDL_NODE, host->hostname), - ND_LOG_FIELD_STR(NDF_NIDL_INSTANCE, ae->chart_name), - ND_LOG_FIELD_STR(NDF_NIDL_CONTEXT, ae->chart_context), - ND_LOG_FIELD_U64(NDF_ALERT_ID, ae->alarm_id), - ND_LOG_FIELD_U64(NDF_ALERT_UNIQUE_ID, ae->unique_id), - ND_LOG_FIELD_U64(NDF_ALERT_EVENT_ID, ae->alarm_event_id), - ND_LOG_FIELD_UUID(NDF_ALERT_CONFIG_HASH, &ae->config_hash_id), - ND_LOG_FIELD_UUID(NDF_ALERT_TRANSITION_ID, &ae->transition_id), - ND_LOG_FIELD_STR(NDF_ALERT_NAME, ae->name), - ND_LOG_FIELD_STR(NDF_ALERT_CLASS, ae->classification), - ND_LOG_FIELD_STR(NDF_ALERT_COMPONENT, ae->component), - ND_LOG_FIELD_STR(NDF_ALERT_TYPE, ae->type), - ND_LOG_FIELD_STR(NDF_ALERT_EXEC, ae->exec), - ND_LOG_FIELD_STR(NDF_ALERT_RECIPIENT, ae->recipient), - ND_LOG_FIELD_STR(NDF_ALERT_SOURCE, ae->exec), - ND_LOG_FIELD_STR(NDF_ALERT_UNITS, ae->units), - ND_LOG_FIELD_STR(NDF_ALERT_SUMMARY, ae->summary), - ND_LOG_FIELD_STR(NDF_ALERT_INFO, ae->info), - ND_LOG_FIELD_DBL(NDF_ALERT_VALUE, ae->new_value), - ND_LOG_FIELD_DBL(NDF_ALERT_VALUE_OLD, ae->old_value), - ND_LOG_FIELD_TXT(NDF_ALERT_STATUS, rrdcalc_status2string(ae->new_status)), - ND_LOG_FIELD_TXT(NDF_ALERT_STATUS_OLD, rrdcalc_status2string(ae->old_status)), - ND_LOG_FIELD_I64(NDF_ALERT_DURATION, ae->duration), - ND_LOG_FIELD_I64(NDF_RESPONSE_CODE, ae->exec_code), - ND_LOG_FIELD_U64(NDF_ALERT_NOTIFICATION_REALTIME_USEC, ae->delay_up_to_timestamp * USEC_PER_SEC), - ND_LOG_FIELD_END(), - }; - ND_LOG_STACK_PUSH(lgs); - - errno = 0; - - ND_LOG_FIELD_PRIORITY priority = NDLP_INFO; - - switch(ae->new_status) { - case RRDCALC_STATUS_UNDEFINED: - if(ae->old_status >= RRDCALC_STATUS_CLEAR) - priority = NDLP_NOTICE; - else - priority = NDLP_DEBUG; - break; - - default: - case RRDCALC_STATUS_UNINITIALIZED: - case RRDCALC_STATUS_REMOVED: - priority = NDLP_DEBUG; - break; - - case RRDCALC_STATUS_CLEAR: - priority = NDLP_INFO; - break; - - case RRDCALC_STATUS_WARNING: - if(ae->old_status < RRDCALC_STATUS_WARNING) - priority = NDLP_WARNING; - break; - - case RRDCALC_STATUS_CRITICAL: - if(ae->old_status < RRDCALC_STATUS_CRITICAL) - priority = NDLP_CRIT; - break; - } - - netdata_logger(NDLS_HEALTH, priority, file, function, line, - "ALERT '%s' of instance '%s' on node '%s', transitioned from %s to %s", - string2str(ae->name), string2str(ae->chart), string2str(host->hostname), - rrdcalc_status2string(ae->old_status), rrdcalc_status2string(ae->new_status) - ); -} - -// ---------------------------------------------------------------------------- -// health alarm log management - -inline ALARM_ENTRY* health_create_alarm_entry( - RRDHOST *host, - uint32_t alarm_id, - uint32_t alarm_event_id, - const uuid_t config_hash_id, - time_t when, - STRING *name, - STRING *chart, - STRING *chart_context, - STRING *chart_name, - STRING *class, - STRING *component, - STRING *type, - STRING *exec, - STRING *recipient, - time_t duration, - NETDATA_DOUBLE old_value, - NETDATA_DOUBLE new_value, - RRDCALC_STATUS old_status, - RRDCALC_STATUS new_status, - STRING *source, - STRING *units, - STRING *summary, - STRING *info, - int delay, - HEALTH_ENTRY_FLAGS flags -) { - - if (duration < 0) - duration = 0; - - netdata_log_debug(D_HEALTH, "Health adding alarm log entry with id: %u", host->health_log.next_log_id); - - ALARM_ENTRY *ae = callocz(1, sizeof(ALARM_ENTRY)); - ae->name = string_dup(name); - ae->chart = string_dup(chart); - ae->chart_context = string_dup(chart_context); - ae->chart_name = string_dup(chart_name); - - uuid_copy(ae->config_hash_id, *((uuid_t *) config_hash_id)); - - uuid_generate_random(ae->transition_id); - ae->global_id = now_realtime_usec(); - - ae->classification = string_dup(class); - ae->component = string_dup(component); - ae->type = string_dup(type); - ae->exec = string_dup(exec); - ae->recipient = string_dup(recipient); - ae->source = string_dup(source); - ae->units = string_dup(units); - - ae->unique_id = host->health_log.next_log_id++; - ae->alarm_id = alarm_id; - ae->alarm_event_id = alarm_event_id; - ae->when = when; - ae->old_value = old_value; - ae->new_value = new_value; - - char value_string[100 + 1]; - ae->old_value_string = string_strdupz(format_value_and_unit(value_string, 100, ae->old_value, ae_units(ae), -1)); - ae->new_value_string = string_strdupz(format_value_and_unit(value_string, 100, ae->new_value, ae_units(ae), -1)); - - ae->summary = string_dup(summary); - ae->info = string_dup(info); - ae->old_status = old_status; - ae->new_status = new_status; - ae->duration = duration; - ae->delay = delay; - ae->delay_up_to_timestamp = when + delay; - ae->flags |= flags; - - ae->last_repeat = 0; - - if(ae->old_status == RRDCALC_STATUS_WARNING || ae->old_status == RRDCALC_STATUS_CRITICAL) - ae->non_clear_duration += ae->duration; - - return ae; -} - -inline void health_alarm_log_add_entry( - RRDHOST *host, - ALARM_ENTRY *ae -) { - netdata_log_debug(D_HEALTH, "Health adding alarm log entry with id: %u", ae->unique_id); - - __atomic_add_fetch(&host->health_transitions, 1, __ATOMIC_RELAXED); - - // link it - rw_spinlock_write_lock(&host->health_log.spinlock); - ae->next = host->health_log.alarms; - host->health_log.alarms = ae; - host->health_log.count++; - rw_spinlock_write_unlock(&host->health_log.spinlock); - - // match previous alarms - rw_spinlock_read_lock(&host->health_log.spinlock); - ALARM_ENTRY *t; - for(t = host->health_log.alarms ; t ; t = t->next) { - if(t != ae && t->alarm_id == ae->alarm_id) { - if(!(t->flags & HEALTH_ENTRY_FLAG_UPDATED) && !t->updated_by_id) { - t->flags |= HEALTH_ENTRY_FLAG_UPDATED; - t->updated_by_id = ae->unique_id; - ae->updates_id = t->unique_id; - - if((t->new_status == RRDCALC_STATUS_WARNING || t->new_status == RRDCALC_STATUS_CRITICAL) && - (t->old_status == RRDCALC_STATUS_WARNING || t->old_status == RRDCALC_STATUS_CRITICAL)) - ae->non_clear_duration += t->non_clear_duration; - - health_alarm_log_save(host, t); - } - - // no need to continue - break; - } - } - rw_spinlock_read_unlock(&host->health_log.spinlock); - - health_alarm_log_save(host, ae); -} - -inline void health_alarm_log_free_one_nochecks_nounlink(ALARM_ENTRY *ae) { - string_freez(ae->name); - string_freez(ae->chart); - string_freez(ae->chart_context); - string_freez(ae->classification); - string_freez(ae->component); - string_freez(ae->type); - string_freez(ae->exec); - string_freez(ae->recipient); - string_freez(ae->source); - string_freez(ae->units); - string_freez(ae->info); - string_freez(ae->old_value_string); - string_freez(ae->new_value_string); - freez(ae); -} - -inline void health_alarm_log_free(RRDHOST *host) { - rw_spinlock_write_lock(&host->health_log.spinlock); - - ALARM_ENTRY *ae; - while((ae = host->health_log.alarms)) { - host->health_log.alarms = ae->next; - health_alarm_log_free_one_nochecks_nounlink(ae); - } - - rw_spinlock_write_unlock(&host->health_log.spinlock); -} diff --git a/health/notifications/Makefile.am b/health/notifications/Makefile.am deleted file mode 100644 index c462b12f..00000000 --- a/health/notifications/Makefile.am +++ /dev/null @@ -1,52 +0,0 @@ -# SPDX-License-Identifier: GPL-3.0-or-later - -AUTOMAKE_OPTIONS = subdir-objects -MAINTAINERCLEANFILES = $(srcdir)/Makefile.in - -CLEANFILES = \ - alarm-notify.sh \ - $(NULL) - -include $(top_srcdir)/build/subst.inc -SUFFIXES = .in - -dist_libconfig_DATA = \ - health_alarm_notify.conf \ - health_email_recipients.conf \ - $(NULL) - -dist_plugins_SCRIPTS = \ - alarm-notify.sh \ - alarm-email.sh \ - alarm-test.sh \ - $(NULL) - -dist_noinst_DATA = \ - alarm-notify.sh.in \ - README.md \ - $(NULL) - -include alerta/Makefile.inc -include awssns/Makefile.inc -include discord/Makefile.inc -include email/Makefile.inc -include flock/Makefile.inc -include gotify/Makefile.inc -include irc/Makefile.inc -include kavenegar/Makefile.inc -include messagebird/Makefile.inc -include msteams/Makefile.inc -include ntfy/Makefile.inc -include opsgenie/Makefile.inc -include pagerduty/Makefile.inc -include pushbullet/Makefile.inc -include pushover/Makefile.inc -include rocketchat/Makefile.inc -include slack/Makefile.inc -include smstools3/Makefile.inc -include syslog/Makefile.inc -include telegram/Makefile.inc -include twilio/Makefile.inc -include web/Makefile.inc -include matrix/Makefile.inc -include custom/Makefile.inc diff --git a/health/notifications/README.md b/health/notifications/README.md deleted file mode 100644 index 4221f2c4..00000000 --- a/health/notifications/README.md +++ /dev/null @@ -1,207 +0,0 @@ -# Agent alert notifications - -This is a reference documentation for Netdata's Agent alert notification feature, which supports dozens of endpoints, user roles, and more. - -The `script to execute on alarm` line in `netdata.conf` defines the external script that will be called once the alert is triggered. - -The default script is `alarm-notify.sh`. - -> ### Info -> -> This file mentions editing configuration files. -> -> - To edit configuration files in a safe way, we provide the [`edit config` script](https://github.com/netdata/netdata/blob/master/docs/configure/nodes.md#use-edit-config-to-edit-configuration-files) located in your [Netdata config directory](https://github.com/netdata/netdata/blob/master/docs/configure/nodes.md#the-netdata-config-directory) (typically is `/etc/netdata`) that creates the proper file and opens it in an editor automatically. -> Note that to run the script you need to be inside your Netdata config directory. -> -> - Please also note that after most configuration changes you will need to [restart the Agent](https://github.com/netdata/netdata/blob/master/docs/configure/start-stop-restart.md) for the changes to take effect. -> -> It is recommended to use this way for configuring Netdata. - -You can change the default script globally by editing `netdata.conf` and changing the `script to execute on alarm` in the `[health]` section. - -`alarm-notify.sh` is capable of sending notifications: - -- to multiple recipients -- using multiple notification methods -- filtering severity per recipient - -It uses **roles**. For example `sysadmin`, `webmaster`, `dba`, etc. - -Each alert is assigned to one or more roles, using the `to` line of the alert configuration. For example, here is the alert configuration for `ram.conf` that defaults to the role `sysadmin`: - -```conf - alarm: ram_in_use - on: system.ram - class: Utilization - type: System -component: Memory - os: linux - hosts: * - calc: $used * 100 / ($used + $cached + $free + $buffers) - units: % - every: 10s - warn: $this > (($status >= $WARNING) ? (80) : (90)) - crit: $this > (($status == $CRITICAL) ? (90) : (98)) - delay: down 15m multiplier 1.5 max 1h - info: system memory utilization - to: sysadmin -``` - -Then `alarm-notify.sh` uses its own configuration file `health_alarm_notify.conf`, which at the bottom of the file stores the recipients per role, for all notification methods. - -Here is an example, of the `sysadmin`'s role recipients for the email notification. -You can send the notification to multiple recipients by separating the emails with a space. - -```conf - -############################################################################### -# RECIPIENTS PER ROLE - -# ----------------------------------------------------------------------------- -# generic system alerts -# CPU, disks, network interfaces, entropy, etc - -role_recipients_email[sysadmin]="someone@exaple.com someoneelse@example.com" -``` - -Each role may have one or more destinations and one or more notification methods. - -So, for example the `sysadmin` role may send: - -1. emails to admin1@example.com and admin2@example.com -2. pushover.net notifications to USERTOKENS `A`, `B` and `C`. -3. pushbullet.com push notifications to admin1@example.com and admin2@example.com -4. messages to the `#alerts` and `#systems` channels of a Slack workspace. -5. messages to Discord channels `#alerts` and `#systems`. - -## Configuration - -You can edit `health_alarm_notify.conf` using the `edit-config` script to configure: - -- **Settings** per notification method: - - All notification methods except email, require some configuration (i.e. API keys, tokens, destination rooms, channels, etc). Please check this section's content to find the configuration guides for your notification option of choice - -- **Recipients** per role per notification method - - ```conf - role_recipients_email[sysadmin]="${DEFAULT_RECIPIENT_EMAIL}" - role_recipients_pushover[sysadmin]="${DEFAULT_RECIPIENT_PUSHOVER}" - role_recipients_pushbullet[sysadmin]="${DEFAULT_RECIPIENT_PUSHBULLET}" - role_recipients_telegram[sysadmin]="${DEFAULT_RECIPIENT_TELEGRAM}" - role_recipients_slack[sysadmin]="${DEFAULT_RECIPIENT_SLACK}" - ... - ``` - - Here you can change the `${DEFAULT_...}` values to the values of the recipients you want, separated by a space if you have multiple recipients. - -## Testing Alert Notifications - -You can run the following command by hand, to test alerts configuration: - -```sh -# become user netdata -sudo su -s /bin/bash netdata - -# enable debugging info on the console -export NETDATA_ALARM_NOTIFY_DEBUG=1 - -# send test alerts to sysadmin -/usr/libexec/netdata/plugins.d/alarm-notify.sh test - -# send test alerts to any role -/usr/libexec/netdata/plugins.d/alarm-notify.sh test "ROLE" -``` - -If you are [running your own registry](https://github.com/netdata/netdata/blob/master/registry/README.md#run-your-own-registry), add `export NETDATA_REGISTRY_URL=[YOUR_URL]` before calling `alarm-notify.sh`. - -> If you need to dig even deeper, you can trace the execution with `bash -x`. Note that in test mode, `alarm-notify.sh` calls itself with many more arguments. So first do: -> ->```sh ->bash -x /usr/libexec/netdata/plugins.d/alarm-notify.sh test ->``` -> -> And then look in the output for the alarm-notify.sh calls and run the one you want to trace with `bash -x`. - -## Global configuration options - -### Notification Filtering - -When you define recipients per role for notification methods, you can append `|critical` to limit the notifications that are sent. - -In the following examples, the first recipient receives all the alerts, while the second one receives only notifications for alerts that have at some point become critical. -The second user may still receive warning and clear notifications, but only for the event that previously caused a critical alert. - -```conf - email : "user1@example.com user2@example.com|critical" - pushover : "2987343...9437837 8756278...2362736|critical" - telegram : "111827421 112746832|critical" - slack : "alerts disasters|critical" - alerta : "alerts disasters|critical" - flock : "alerts disasters|critical" - discord : "alerts disasters|critical" - twilio : "+15555555555 +17777777777|critical" - messagebird: "+15555555555 +17777777777|critical" - kavenegar : "09155555555 09177777777|critical" - pd : "<pd_service_key_1> <pd_service_key_2>|critical" - irc : "<irc_channel_1> <irc_channel_2>|critical" -``` - -If a per role recipient is set to an empty string, the default recipient of the given -notification method (email, pushover, telegram, slack, alerta, etc.) will be used. - -To disable a notification, use the recipient called: disabled -This works for all notification methods (including the default recipients). - -### Proxy configuration - -If you need to send curl based notifications (pushover, pushbullet, slack, alerta, -flock, discord, telegram) via a proxy, you should set these variables to your proxy address: - -```conf -export http_proxy="http://10.0.0.1:3128/" -export https_proxy="http://10.0.0.1:3128/" -``` - -### Notification images - -Images in notifications need to be downloaded from an Internet facing site. - -To allow notification providers to fetch the icons/images, by default we set the URL of the global public netdata registry. - -If you have an Internet facing netdata (or you have copied the images/ folder -of netdata to your web server), set its URL here, to fetch the notification -images from it. - -```conf -images_base_url="http://my.public.netdata.server:19999" -``` - -### Date handling - -You can configure netdata alerts to send dates in any format you want via editing the `date_format` variable. - -This uses standard `date` command format strings. See `man date` for -more info on what formats are supported. - -Note that this has to start with a '+', otherwise it won't work. - -- For ISO 8601 dates, use `+%FT%T%z` -- For RFC 5322 dates, use `+%a, %d %b %Y %H:%M:%S %z` -- For RFC 3339 dates, use `+%F %T%:z` -- For RFC 1123 dates, use `+%a, %d %b %Y %H:%M:%S %Z` -- For RFC 1036 dates, use `+%A, %d-%b-%y %H:%M:%S %Z` -- For a reasonably local date and time (in that order), use `+%x %X` -- For the old default behavior (compatible with ANSI C's `asctime()` function), leave the `date_format` field empty. - -### Hostname handling - -By default, Netdata will use the simple hostname for the system (the hostname with everything after the first `.` removed) when displaying the hostname in alert notifications. - -If you instead prefer to have Netdata use the host's fully qualified domain name, you can set `use_fdqn` to `YES`. - -This setting does not account for child systems for which the system you are configuring is a parent. - -> ### Note -> -> If the system's host name is overridden in `/etc/netdata.conf` with the `hostname` option, that name will be used unconditionally. diff --git a/health/notifications/alarm-email.sh b/health/notifications/alarm-email.sh deleted file mode 100755 index 69c4c3f8..00000000 --- a/health/notifications/alarm-email.sh +++ /dev/null @@ -1,7 +0,0 @@ -#!/usr/bin/env bash -# SPDX-License-Identifier: GPL-3.0-or-later - -# OBSOLETE - REPLACED WITH -# alarm-notify.sh - -${0/alarm-email.sh/alarm-notify.sh} "${@}" diff --git a/health/notifications/alarm-notify.sh.in b/health/notifications/alarm-notify.sh.in deleted file mode 100755 index 9d95c21d..00000000 --- a/health/notifications/alarm-notify.sh.in +++ /dev/null @@ -1,3630 +0,0 @@ -#!/usr/bin/env bash -#shellcheck source=/dev/null disable=SC2086,SC2154 - -# netdata -# real-time performance and health monitoring, done right! -# (C) 2023 Netdata Inc. -# SPDX-License-Identifier: GPL-3.0-or-later -# -# Script to send alarm notifications for netdata -# -# Features: -# - multiple notification methods -# - multiple roles per alarm -# - multiple recipients per role -# - severity filtering per recipient -# -# Supported notification methods: -# - emails by @ktsaou -# - slack.com notifications by @ktsaou -# - alerta.io notifications by @kattunga -# - discord.com notifications by @lowfive -# - pushover.net notifications by @ktsaou -# - pushbullet.com push notifications by Tiago Peralta @tperalta82 #1070 -# - telegram.org notifications by @hashworks #1002 -# - twilio.com notifications by Levi Blaney @shadycuz #1211 -# - kafka notifications by @ktsaou #1342 -# - pagerduty.com notifications by Jim Cooley @jimcooley #1373 -# - messagebird.com notifications by @tech_no_logical #1453 -# - hipchat notifications by @ktsaou #1561 -# - fleep notifications by @Ferroin -# - prowlapp.com notifications by @Ferroin -# - irc notifications by @manosf -# - custom notifications by @ktsaou -# - syslog messages by @Ferroin -# - Microsoft Team notification by @tioumen -# - RocketChat notifications by @Hermsi1337 #3777 -# - Dynatrace Event by @illumine -# - Opsgenie by @thiaoftsm #9858 -# - Gotify by @coffeegrind123 -# - ntfy.sh by @Dim-P - -# ----------------------------------------------------------------------------- -# testing notifications - -cmd_line="'${0}' $(printf "'%s' " "${@}")" - -if { [ "${1}" = "test" ] || [ "${2}" = "test" ]; } && [ "${#}" -le 2 ]; then - if [ "${2}" = "test" ]; then - recipient="${1}" - else - recipient="${2}" - fi - - [ -z "${recipient}" ] && recipient="sysadmin" - - id=1 - last="CLEAR" - test_res=0 - for x in "WARNING" "CRITICAL" "CLEAR"; do - echo >&2 - echo >&2 "# SENDING TEST ${x} ALARM TO ROLE: ${recipient}" - - "${0}" "${recipient}" "$(hostname)" 1 1 "${id}" "$(date +%s)" "test_alarm" "test.chart" "${x}" "${last}" 100 90 "${0}" 1 $((0 + id)) "units" "this is a test alarm to verify notifications work" "new value" "old value" "evaluated expression" "expression variable values" 0 0 "" "" "Test" "command to edit the alarm=0=$(hostname)" "" "" "a test alarm" - #shellcheck disable=SC2181 - if [ $? -ne 0 ]; then - echo >&2 "# FAILED" - test_res=1 - else - echo >&2 "# OK" - fi - - last="${x}" - id=$((id + 1)) - done - - exit $test_res -fi - -export PATH="${PATH}:/sbin:/usr/sbin:/usr/local/sbin:@sbindir_POST@" -export LC_ALL=C - -# ----------------------------------------------------------------------------- -# logging - -PROGRAM_NAME="$(basename "${0}")" - -# these should be the same with syslog() priorities -NDLP_EMERG=0 # system is unusable -NDLP_ALERT=1 # action must be taken immediately -NDLP_CRIT=2 # critical conditions -NDLP_ERR=3 # error conditions -NDLP_WARN=4 # warning conditions -NDLP_NOTICE=5 # normal but significant condition -NDLP_INFO=6 # informational -NDLP_DEBUG=7 # debug-level messages - -# the max (numerically) log level we will log -LOG_LEVEL=$NDLP_INFO - -set_log_min_priority() { - case "${NETDATA_LOG_LEVEL,,}" in - "emerg" | "emergency") - LOG_LEVEL=$NDLP_EMERG - ;; - - "alert") - LOG_LEVEL=$NDLP_ALERT - ;; - - "crit" | "critical") - LOG_LEVEL=$NDLP_CRIT - ;; - - "err" | "error") - LOG_LEVEL=$NDLP_ERR - ;; - - "warn" | "warning") - LOG_LEVEL=$NDLP_WARN - ;; - - "notice") - LOG_LEVEL=$NDLP_NOTICE - ;; - - "info") - LOG_LEVEL=$NDLP_INFO - ;; - - "debug") - LOG_LEVEL=$NDLP_DEBUG - ;; - esac -} - -set_log_min_priority - -log() { - local level="${1}" - shift 1 - - [[ -n "$level" && -n "$LOG_LEVEL" && "$level" -gt "$LOG_LEVEL" ]] && return - - systemd-cat-native --log-as-netdata --newline="--NEWLINE--" <<EOFLOG -INVOCATION_ID=${NETDATA_INVOCATION_ID} -SYSLOG_IDENTIFIER=${PROGRAM_NAME} -PRIORITY=${level} -THREAD_TAG=alarm-notify -ND_LOG_SOURCE=health -ND_NIDL_NODE=${host} -ND_NIDL_INSTANCE=${chart} -ND_NIDL_CONTEXT=${context} -ND_ALERT_NAME=${name} -ND_ALERT_ID=${alarm_id} -ND_ALERT_UNIQUE_ID=${unique_id} -ND_ALERT_EVENT_ID=${alarm_event_id} -ND_ALERT_TRANSITION_ID=${transition_id//-/} -ND_ALERT_CLASS=${classification} -ND_ALERT_COMPONENT=${component} -ND_ALERT_TYPE=${type} -ND_ALERT_RECIPIENT=${roles} -ND_ALERT_VALUE=${value} -ND_ALERT_VALUE_OLD=${old_value} -ND_ALERT_STATUS=${status} -ND_ALERT_STATUS_OLD=${old_status} -ND_ALERT_UNITS=${units} -ND_ALERT_SUMMARY=${summary} -ND_ALERT_INFO=${info} -ND_ALERT_DURATION=${duration} -ND_REQUEST=${cmd_line} -MESSAGE_ID=6db0018e83e34320ae2a659d78019fb7 -MESSAGE=[ALERT NOTIFICATION]: ${*//\\n/--NEWLINE--} - -EOFLOG - # AN EMPTY LINE IS NEEDED ABOVE -} - -info() { - log "$NDLP_INFO" "${@}" -} - -warning() { - log "$NDLP_WARN" "${@}" -} - -error() { - log "$NDLP_ERR" "${@}" -} - -fatal() { - log "$NDLP_ALERT" "${@}" - exit 1 -} - -debug() { - log "$NDLP_DEBUG" "${@}" -} - -debug=0 -if [ "${NETDATA_ALARM_NOTIFY_DEBUG-0}" = "1" ]; then - debug=1 - LOG_LEVEL=$NDLP_DEBUG -fi - -# ----------------------------------------------------------------------------- -# check for BASH v4+ (required for associative arrays) - -if [ ${BASH_VERSINFO[0]} -lt 4 ]; then - echo >&2 "BASH version 4 or later is required (this is ${BASH_VERSION})." - exit 1 -fi - - -# ----------------------------------------------------------------------------- - -docurl() { - if [ -z "${curl}" ]; then - error "${curl} is unset." - return 1 - fi - - if [ "${debug}" = "1" ]; then - echo >&2 "--- BEGIN curl command ---" - printf >&2 "%q " ${curl} "${@}" - echo >&2 - echo >&2 "--- END curl command ---" - - local out code ret - out=$(mktemp /tmp/netdata-health-alarm-notify-XXXXXXXX) - code=$(${curl} ${curl_options} --write-out "%{http_code}" --output "${out}" --silent --show-error "${@}") - ret=$? - echo >&2 "--- BEGIN received response ---" - cat >&2 "${out}" - echo >&2 - echo >&2 "--- END received response ---" - echo >&2 "RECEIVED HTTP RESPONSE CODE: ${code}" - rm "${out}" - echo "${code}" - return ${ret} - fi - - ${curl} ${curl_options} --write-out "%{http_code}" --output /dev/null --silent --show-error "${@}" - return $? -} - -# ----------------------------------------------------------------------------- -# List of all the notification mechanisms we support. -# Used in a couple of places to write more compact code. - -method_names=" -email -pushover -pushbullet -telegram -slack -alerta -flock -discord -hipchat -twilio -messagebird -pd -fleep -syslog -custom -msteams -kavenegar -prowl -irc -awssns -rocketchat -sms -dynatrace -matrix -ntfy -" - -# ----------------------------------------------------------------------------- -# this is to be overwritten by the config file - -custom_sender() { - info "custom notification mechanism is not configured; not sending ${notification_description}" -} - -# ----------------------------------------------------------------------------- -# defaults to allow running this script by hand - -[ -z "${NETDATA_USER_CONFIG_DIR}" ] && NETDATA_USER_CONFIG_DIR="@configdir_POST@" -[ -z "${NETDATA_STOCK_CONFIG_DIR}" ] && NETDATA_STOCK_CONFIG_DIR="@libconfigdir_POST@" -[ -z "${NETDATA_CACHE_DIR}" ] && NETDATA_CACHE_DIR="@cachedir_POST@" -[ -z "${NETDATA_REGISTRY_URL}" ] && NETDATA_REGISTRY_URL="https://registry.my-netdata.io" -[ -z "${NETDATA_REGISTRY_CLOUD_BASE_URL}" ] && NETDATA_REGISTRY_CLOUD_BASE_URL="https://app.netdata.cloud" - -# ----------------------------------------------------------------------------- -# parse command line parameters - -if [[ ${1} = "unittest" ]]; then - unittest=1 # enable unit testing mode - roles="${2}" # the role that should be used for unit testing - cfgfile="${3}" # the location of the config file to use for unit testing - status="${4}" # the current status : REMOVED, UNINITIALIZED, UNDEFINED, CLEAR, WARNING, CRITICAL - old_status="${5}" # the previous status: REMOVED, UNINITIALIZED, UNDEFINED, CLEAR, WARNING, CRITICAL -elif [[ ${1} = "dump_methods" ]]; then - dump_methods=1 - status="WARNING" -else - roles="${1}" # the roles that should be notified for this event - args_host="${2}" # the host generated this event - unique_id="${3}" # the unique id of this event - alarm_id="${4}" # the unique id of the alarm that generated this event - event_id="${5}" # the incremental id of the event, for this alarm id - when="${6}" # the timestamp this event occurred - name="${7}" # the name of the alarm, as given in netdata health.d entries - chart="${8}" # the name of the chart (type.id) - status="${9}" # the current status : REMOVED, UNINITIALIZED, UNDEFINED, CLEAR, WARNING, CRITICAL - old_status="${10}" # the previous status: REMOVED, UNINITIALIZED, UNDEFINED, CLEAR, WARNING, CRITICAL - value="${11}" # the current value of the alarm - old_value="${12}" # the previous value of the alarm - src="${13}" # the line number and file the alarm has been configured - duration="${14}" # the duration in seconds of the previous alarm state - non_clear_duration="${15}" # the total duration in seconds this is/was non-clear - units="${16}" # the units of the value - info="${17}" # a short description of the alarm - value_string="${18}" # friendly value (with units) - # shellcheck disable=SC2034 - # variable is unused, but https://github.com/netdata/netdata/pull/5164#discussion_r255572947 - old_value_string="${19}" # friendly old value (with units), previously named "old_value_string" - calc_expression="${20}" # contains the expression that was evaluated to trigger the alarm - calc_param_values="${21}" # the values of the parameters in the expression, at the time of the evaluation - total_warnings="${22}" # Total number of alarms in WARNING state - total_critical="${23}" # Total number of alarms in CRITICAL state - total_warn_alarms="${24}" # List of alarms in warning state - total_crit_alarms="${25}" # List of alarms in critical state - classification="${26}" # The class field from .conf files - edit_command_line="${27}" # The command to edit the alarm, with the line number - child_machine_guid="${28}" # the machine_guid of the child - transition_id="${29}" # the transition_id of the alert - summary="${30}" # the summary text field of the alert - context="${31}" # the context of the chart - component="${32}" - type="${33}" -fi - -# ----------------------------------------------------------------------------- -# find a suitable hostname to use, if netdata did not supply a hostname - -if [ -z "${args_host}" ]; then - this_host=$(hostname -s 2>/dev/null) - host="${this_host}" - args_host="${this_host}" -else - host="${args_host}" -fi - -notification_description="notification to '${roles}' for transition from ${old_status} to ${status}, of alert '${name}' = '${value_string}', of instance '${chart}', context '${context}' on host '${host}'" - -# ----------------------------------------------------------------------------- -# screen statuses we don't need to send a notification - -# don't do anything if this is not WARNING, CRITICAL or CLEAR -if [ "${status}" != "WARNING" ] && [ "${status}" != "CRITICAL" ] && [ "${status}" != "CLEAR" ]; then - debug "not sending ${notification_description}" - exit 1 -fi - -# don't do anything if this is CLEAR, but it was not WARNING or CRITICAL -if [ "${clear_alarm_always}" != "YES" ] && [ "${old_status}" != "WARNING" ] && [ "${old_status}" != "CRITICAL" ] && [ "${status}" = "CLEAR" ]; then - debug "not sending ${notification_description}" - exit 1 -fi - -# ----------------------------------------------------------------------------- -# load configuration - -# By default fetch images from the global public registry. -# This is required by default, since all notification methods need to download -# images via the Internet, and private registries might not be reachable. -# This can be overwritten at the configuration file. -images_base_url="https://registry.my-netdata.io" - -# curl options to use -curl_options="" - -# hostname handling -use_fqdn="NO" - -# needed commands -# if empty they will be searched in the system path -curl= -sendmail= - -# enable / disable features -for method_name in ${method_names^^}; do - declare SEND_${method_name}="YES" - declare DEFAULT_RECIPIENT_${method_name} -done - -for method_name in ${method_names}; do - declare -A role_recipients_${method_name} -done - -# slack configs -SLACK_WEBHOOK_URL= - -# Microsoft Teams configs -MSTEAMS_WEBHOOK_URL= - -# Legacy Microsoft Teams configs for backwards compatibility: -declare -A role_recipients_msteam - -# rocketchat configs -ROCKETCHAT_WEBHOOK_URL= - -# alerta configs -ALERTA_WEBHOOK_URL= -ALERTA_API_KEY= - -# flock configs -FLOCK_WEBHOOK_URL= - -# discord configs -DISCORD_WEBHOOK_URL= - -# pushover configs -PUSHOVER_APP_TOKEN= - -# pushbullet configs -PUSHBULLET_ACCESS_TOKEN= -PUSHBULLET_SOURCE_DEVICE= - -# twilio configs -TWILIO_ACCOUNT_SID= -TWILIO_ACCOUNT_TOKEN= -TWILIO_NUMBER= - -# hipchat configs -HIPCHAT_SERVER= -HIPCHAT_AUTH_TOKEN= - -# messagebird configs -MESSAGEBIRD_ACCESS_KEY= -MESSAGEBIRD_NUMBER= - -# kavenegar configs -KAVENEGAR_API_KEY= -KAVENEGAR_SENDER= - -# telegram configs -TELEGRAM_BOT_TOKEN= - -# kafka configs -SEND_KAFKA="YES" -KAFKA_URL= -KAFKA_SENDER_IP= - -# pagerduty.com configs -PD_SERVICE_KEY= -USE_PD_VERSION= - -# fleep.io configs -FLEEP_SENDER="${host}" - -# Amazon SNS configs -AWSSNS_MESSAGE_FORMAT= - -# Matrix configs -MATRIX_HOMESERVER= -MATRIX_ACCESSTOKEN= - -# syslog configs -SYSLOG_FACILITY= - -# email configs -EMAIL_SENDER= -EMAIL_CHARSET=$(locale charmap 2>/dev/null) -EMAIL_THREADING= -EMAIL_PLAINTEXT_ONLY= - -# irc configs -IRC_NICKNAME= -IRC_REALNAME= -IRC_NETWORK= -IRC_PORT=6667 - -# dynatrace configs -DYNATRACE_SPACE= -DYNATRACE_SERVER= -DYNATRACE_TOKEN= -DYNATRACE_TAG_VALUE= -DYNATRACE_ANNOTATION_TYPE= -DYNATRACE_EVENT= -SEND_DYNATRACE= - -# gotify configs -GOTIFY_APP_URL= -GOTIFY_APP_TOKEN= - -# opsgenie configs -OPSGENIE_API_KEY= - -# load the stock and user configuration files -# these will overwrite the variables above - -if [ ${unittest} ]; then - if source "${cfgfile}"; then - error "Failed to load requested config file." - exit 1 - fi -else - for CONFIG in "${NETDATA_STOCK_CONFIG_DIR}/health_alarm_notify.conf" "${NETDATA_USER_CONFIG_DIR}/health_alarm_notify.conf"; do - if [ -f "${CONFIG}" ]; then - debug "Loading config file '${CONFIG}'..." - source "${CONFIG}" || error "Failed to load config file '${CONFIG}'." - else - debug "Cannot find file '${CONFIG}'." - fi - done -fi - -if [[ ! $curl_options =~ .*\--connect-timeout ]]; then - curl_options+=" --connect-timeout 5" -fi - -OPSGENIE_API_URL=${OPSGENIE_API_URL:-"https://api.opsgenie.com"} - -# If we didn't autodetect the character set for e-mail and it wasn't -# set by the user, we need to set it to a reasonable default. UTF-8 -# should be correct for almost all modern UNIX systems. -if [ -z ${EMAIL_CHARSET} ]; then - EMAIL_CHARSET="UTF-8" -fi - -# If we've been asked to use FQDN's for the URL's in the alarm, do so, -# unless we're sending an alarm for a child system which we can't get the -# FQDN of easily. -if [ "${use_fqdn}" = "YES" ] && [ "${host}" = "$(hostname -s 2>/dev/null)" ]; then - host="$(hostname -f 2>/dev/null)" -fi - - -# ----------------------------------------------------------------------------- -# migrate old Microsoft Teams configuration keys after loading configuration - -msteams_migration() { - SEND_MSTEAMS=${SEND_MSTEAM:-$SEND_MSTEAMS} - unset -v SEND_MSTEAM - DEFAULT_RECIPIENT_MSTEAMS=${DEFAULT_RECIPIENT_MSTEAM:-$DEFAULT_RECIPIENT_MSTEAMS} - MSTEAMS_WEBHOOK_URL=${MSTEAM_WEBHOOK_URL:-$MSTEAMS_WEBHOOK_URL} - MSTEAMS_ICON_DEFAULT=${MSTEAM_ICON_DEFAULT:-$MSTEAMS_ICON_DEFAULT} - MSTEAMS_ICON_CLEAR=${MSTEAM_ICON_CLEAR:-$MSTEAMS_ICON_CLEAR} - MSTEAMS_ICON_WARNING=${MSTEAM_ICON_WARNING:-$MSTEAMS_ICON_WARNING} - MSTEAMS_ICON_CRITICAL=${MSTEAM_ICON_CRITICAL:-$MSTEAMS_ICON_CRITICAL} - MSTEAMS_COLOR_DEFAULT=${MSTEAM_COLOR_DEFAULT:-$MSTEAMS_COLOR_DEFAULT} - MSTEAMS_COLOR_CLEAR=${MSTEAM_COLOR_CLEAR:-$MSTEAMS_COLOR_CLEAR} - MSTEAMS_COLOR_WARNING=${MSTEAM_COLOR_WARNING:-$MSTEAMS_COLOR_WARNING} - MSTEAMS_COLOR_CRITICAL=${MSTEAM_COLOR_CRITICAL:-$MSTEAMS_COLOR_CRITICAL} - - # migrate role specific recipients: - for key in "${!role_recipients_msteam[@]}"; do - # Disable check, if role_recipients_msteams is ever used: - # The role_recipients_$method are created and used programmatically - # by iterating over $methods. shellcheck therefore doesn't realize - # that role_recipients_msteams is actually used in the block - # "find the recipients' addresses per method". - # shellcheck disable=SC2034 - role_recipients_msteams["$key"]="${role_recipients_msteam["$key"]}" - done -} - -msteams_migration - -# ----------------------------------------------------------------------------- -# filter a recipient based on alarm event severity - -filter_recipient_by_criticality() { - local method="${1}" recipient_arg="${2}" - local tracking_dir tracking_file modifier modifiers recipient="${recipient_arg/|*/}" - local mod_critical=0 mod_noclear=0 mod_nowarn=0 - - # no severity filtering for this person - [ "${recipient}" = "${recipient_arg}" ] && return 0 - - # find out which modifiers are set - modifiers="${recipient_arg#*|}" - modifiers="${modifiers//|/ }" # replace pipes with spaces - modifiers="${modifiers,,}" # lowercase - for modifier in ${modifiers}; do - case "${modifier}" in - critical) mod_critical=1 ;; - noclear) mod_noclear=1 ;; - nowarn) mod_nowarn=1 ;; - - *) - error "SEVERITY FILTERING for ${recipient_arg} VIA ${method}: invalid modifier '${modifier}'." - # invalid modifier, always send notification - return 0 - ;; - esac - done - - # set status tracking directory/file var - tracking_dir="${NETDATA_CACHE_DIR}/alarm-notify/${method}/${recipient}" - tracking_file="${tracking_dir}/${alarm_id}" - - # create the status tracking directory for this user if "critical" modifier is set - [ "${mod_critical}" == "1" ] && [ ! -d "${tracking_dir}" ] && mkdir -p "${tracking_dir}" - - case "${status}" in - CRITICAL) - # "critical" modifier set, create tracking file for future status changes - if [ "${mod_critical}" == "1" ]; then - touch "${tracking_file}" - debug "SEVERITY FILTERING for ${recipient_arg} VIA ${method}: ALLOW: the alarm is CRITICAL (will now receive next status change)" - return 0 - fi - - # always send CRITICAL notification - debug "SEVERITY FILTERING for ${recipient_arg} VIA ${method}: ALLOW: the alarm is CRITICAL" - return 0 - ;; - - WARNING) - # "nowarn" modifier set, block notification - if [ "${mod_nowarn}" == "1" ]; then - debug "SEVERITY FILTERING for ${recipient_arg} VIA ${method}: BLOCK: recipient should not receive this notification (nowarn modifier set)" - return 1 - fi - - # "critical" modifier not set, send notification - if [ "${mod_critical}" == "0" ]; then - debug "SEVERITY FILTERING for ${recipient_arg} VIA ${method}: ALLOW: the alarm is WARNING" - return 0 - fi - - # "critical" modifier set, send notification if tracking file exists - if [ "${mod_critical}" == "1" ] && [ -f "${tracking_file}" ]; then - debug "SEVERITY FILTERING for ${recipient_arg} VIA ${method}: ALLOW: recipient has been notified for this alarm in the past (will still receive next status change)" - return 0 - fi - ;; - - CLEAR) - # remove tracking file - [ -f "${tracking_file}" ] && rm "${tracking_file}" - - # "noclear" modifier set, block notification - if [ "${mod_noclear}" == "1" ]; then - debug "SEVERITY FILTERING for ${recipient_arg} VIA ${method}: BLOCK: recipient should not receive this notification (noclear modifier set)" - return 1 - fi - - # "critical" modifier not set, send notification - if [ "${mod_critical}" == "0" ]; then - debug "SEVERITY FILTERING for ${recipient_arg} VIA ${method}: ALLOW: the alarm is CLEAR" - return 0 - fi - - # "critical" modifier set, send notification if tracking file exists - if [ "${mod_critical}" == "1" ] && [ -f "${tracking_file}" ]; then - debug "SEVERITY FILTERING for ${recipient_arg} VIA ${method}: ALLOW: recipient has been notified for this alarm in the past (no status change will be sent from now)" - return 0 - fi - ;; - - *) - # "critical" modifier set, send notification if tracking file exists - if [ "${mod_critical}" == "1" ] && [ -f "${tracking_file}" ]; then - debug "SEVERITY FILTERING for ${recipient_arg} VIA ${method}: ALLOW: recipient has been notified for this alarm in the past (will still receive next status change)" - return 0 - fi - ;; - esac - - debug "SEVERITY FILTERING for ${recipient_arg} VIA ${method}: BLOCK: recipient should not receive this notification" - return 1 -} - -# ----------------------------------------------------------------------------- -# check the configured targets - -# check email -if [ "${SEND_EMAIL}" = "AUTO" ]; then - if command -v curl >/dev/null 2>&1; then - SEND_EMAIL="YES" - else - SEND_EMAIL="NO" - fi -fi - -# check slack -[ -z "${SLACK_WEBHOOK_URL}" ] && SEND_SLACK="NO" - -# check rocketchat -[ -z "${ROCKETCHAT_WEBHOOK_URL}" ] && SEND_ROCKETCHAT="NO" - -# check alerta -[ -z "${ALERTA_WEBHOOK_URL}" ] && SEND_ALERTA="NO" - -# check flock -[ -z "${FLOCK_WEBHOOK_URL}" ] && SEND_FLOCK="NO" - -# check discord -[ -z "${DISCORD_WEBHOOK_URL}" ] && SEND_DISCORD="NO" - -# check pushover -[ -z "${PUSHOVER_APP_TOKEN}" ] && SEND_PUSHOVER="NO" - -# check pushbullet -[ -z "${PUSHBULLET_ACCESS_TOKEN}" ] && SEND_PUSHBULLET="NO" - -# check twilio -{ [ -z "${TWILIO_ACCOUNT_TOKEN}" ] || [ -z "${TWILIO_ACCOUNT_SID}" ] || [ -z "${TWILIO_NUMBER}" ]; } && SEND_TWILIO="NO" - -# check hipchat -[ -z "${HIPCHAT_AUTH_TOKEN}" ] && SEND_HIPCHAT="NO" - -# check messagebird -{ [ -z "${MESSAGEBIRD_ACCESS_KEY}" ] || [ -z "${MESSAGEBIRD_NUMBER}" ]; } && SEND_MESSAGEBIRD="NO" - -# check kavenegar -{ [ -z "${KAVENEGAR_API_KEY}" ] || [ -z "${KAVENEGAR_SENDER}" ]; } && SEND_KAVENEGAR="NO" - -# check telegram -[ -z "${TELEGRAM_BOT_TOKEN}" ] && SEND_TELEGRAM="NO" - -# check kafka -{ [ -z "${KAFKA_URL}" ] || [ -z "${KAFKA_SENDER_IP}" ]; } && SEND_KAFKA="NO" - -# check irc -[ -z "${IRC_NETWORK}" ] && SEND_IRC="NO" - -# check fleep -#shellcheck disable=SC2153 -{ [ -z "${FLEEP_SERVER}" ] || [ -z "${FLEEP_SENDER}" ]; } && SEND_FLEEP="NO" - -# check dynatrace -{ [ -z "${DYNATRACE_SPACE}" ] || - [ -z "${DYNATRACE_SERVER}" ] || - [ -z "${DYNATRACE_TOKEN}" ] || - [ -z "${DYNATRACE_TAG_VALUE}" ] || - [ -z "${DYNATRACE_EVENT}" ]; } && SEND_DYNATRACE="NO" - -# check opsgenie -[ -z "${OPSGENIE_API_KEY}" ] && SEND_OPSGENIE="NO" - -# check matrix -{ [ -z "${MATRIX_HOMESERVER}" ] || [ -z "${MATRIX_ACCESSTOKEN}" ]; } && SEND_MATRIX="NO" - -# check gotify -{ [ -z "${GOTIFY_APP_TOKEN}" ] || [ -z "${GOTIFY_APP_URL}" ]; } && SEND_GOTIFY="NO" - -# check ntfy -[ -z "${DEFAULT_RECIPIENT_NTFY}" ] && SEND_NTFY="NO" - -# check msteams -[ -z "${MSTEAMS_WEBHOOK_URL}" ] && SEND_MSTEAMS="NO" - -# check pd -[ -z "${DEFAULT_RECIPIENT_PD}" ] && SEND_PD="NO" - -# check prowl -[ -z "${DEFAULT_RECIPIENT_PROWL}" ] && SEND_PROWL="NO" - -# check custom -[ -z "${DEFAULT_RECIPIENT_CUSTOM}" ] && SEND_CUSTOM="NO" - -# ----------------------------------------------------------------------------- -# check the availability of targets - -check_supported_targets() { - local log=${1} - shift - - if [ "${SEND_PUSHOVER}" = "YES" ] || - [ "${SEND_SLACK}" = "YES" ] || - [ "${SEND_ROCKETCHAT}" = "YES" ] || - [ "${SEND_ALERTA}" = "YES" ] || - [ "${SEND_PD}" = "YES" ] || - [ "${SEND_FLOCK}" = "YES" ] || - [ "${SEND_DISCORD}" = "YES" ] || - [ "${SEND_HIPCHAT}" = "YES" ] || - [ "${SEND_TWILIO}" = "YES" ] || - [ "${SEND_MESSAGEBIRD}" = "YES" ] || - [ "${SEND_KAVENEGAR}" = "YES" ] || - [ "${SEND_TELEGRAM}" = "YES" ] || - [ "${SEND_PUSHBULLET}" = "YES" ] || - [ "${SEND_KAFKA}" = "YES" ] || - [ "${SEND_FLEEP}" = "YES" ] || - [ "${SEND_PROWL}" = "YES" ] || - [ "${SEND_MATRIX}" = "YES" ] || - [ "${SEND_CUSTOM}" = "YES" ] || - [ "${SEND_MSTEAMS}" = "YES" ] || - [ "${SEND_DYNATRACE}" = "YES" ] || - [ "${SEND_OPSGENIE}" = "YES" ] || - [ "${SEND_GOTIFY}" = "YES" ] || - [ "${SEND_NTFY}" = "YES" ]; then - # if we need curl, check for the curl command - if [ -z "${curl}" ]; then - curl="$(command -v curl 2>/dev/null)" - fi - if [ -z "${curl}" ]; then - $log "Cannot find curl command in the system path. Disabling all curl based notifications." - SEND_PUSHOVER="NO" - SEND_PUSHBULLET="NO" - SEND_TELEGRAM="NO" - SEND_SLACK="NO" - SEND_MSTEAMS="NO" - SEND_ROCKETCHAT="NO" - SEND_ALERTA="NO" - SEND_PD="NO" - SEND_FLOCK="NO" - SEND_DISCORD="NO" - SEND_TWILIO="NO" - SEND_HIPCHAT="NO" - SEND_MESSAGEBIRD="NO" - SEND_KAVENEGAR="NO" - SEND_KAFKA="NO" - SEND_FLEEP="NO" - SEND_PROWL="NO" - SEND_MATRIX="NO" - SEND_CUSTOM="NO" - SEND_DYNATRACE="NO" - SEND_OPSGENIE="NO" - SEND_GOTIFY="NO" - SEND_NTFY="NO" - fi - fi - - if [ "${SEND_SMS}" = "YES" ]; then - if [ -z "${sendsms}" ]; then - sendsms="$(command -v sendsms 2>/dev/null)" - fi - if [ -z "${sendsms}" ]; then - SEND_SMS="NO" - fi - fi - # if we need sendmail, check for the sendmail command - if [ "${SEND_EMAIL}" = "YES" ] && [ -z "${sendmail}" ]; then - sendmail="$(command -v sendmail 2>/dev/null)" - if [ -z "${sendmail}" ]; then - $log "Cannot find sendmail command in the system path. Disabling email notifications." - SEND_EMAIL="NO" - fi - fi - - # if we need logger, check for the logger command - if [ "${SEND_SYSLOG}" = "YES" ] && [ -z "${logger}" ]; then - logger="$(command -v logger 2>/dev/null)" - if [ -z "${logger}" ]; then - $log "Cannot find logger command in the system path. Disabling syslog notifications." - SEND_SYSLOG="NO" - fi - fi - - # if we need aws, check for the aws command - if [ "${SEND_AWSSNS}" = "YES" ] && [ -z "${aws}" ]; then - aws="$(command -v aws 2>/dev/null)" - if [ -z "${aws}" ]; then - $log "Cannot find aws command in the system path. Disabling Amazon SNS notifications." - SEND_AWSSNS="NO" - fi - fi - - # if we need nc, check for the nc command - if [ "${SEND_IRC}" = "YES" ] && [ -z "${nc}" ]; then - nc="$(command -v nc 2>/dev/null)" - if [ -z "${nc}" ]; then - $log "Cannot find nc command in the system path. Disabling IRC notifications." - SEND_IRC="NO" - fi - fi -} - -if [ ${dump_methods} ]; then - check_supported_targets debug - for name in "${!SEND_@}"; do - if [ "${!name}" = "YES" ]; then - echo "$name" - fi - done - exit 0 -fi - -# ----------------------------------------------------------------------------- -# find the recipients' addresses per method - -# netdata may call us with multiple roles, and roles may have multiple but -# overlapping recipients - so, here we find the unique recipients. -have_to_send_something="NO" -for method_name in ${method_names}; do - send_var="SEND_${method_name^^}" - if [ "${!send_var}" = "NO" ]; then - continue - fi - - declare -A arr_var=() - - for x in ${roles//,/ }; do - # the roles 'silent' and 'disabled' mean: - # don't send a notification for this role - if [ "${x}" = "silent" ] || [ "${x}" = "disabled" ]; then - continue - fi - - role_recipients="role_recipients_${method_name}[$x]" - default_recipient_var="DEFAULT_RECIPIENT_${method_name^^}" - - a="${!role_recipients}" - [ -z "${a}" ] && a="${!default_recipient_var}" - for r in ${a//,/ }; do - [ "${r}" != "disabled" ] && filter_recipient_by_criticality ${method_name} "${r}" && arr_var[${r/|*/}]="1" - done - done - - # build the list of recipients - to_var="to_${method_name}" - declare to_${method_name}="${!arr_var[*]}" - - if [ -z "${!to_var}" ]; then - declare ${send_var}="NO" - else - have_to_send_something="YES" - fi -done - -# ----------------------------------------------------------------------------- -# handle fixup of the email recipient list. - -fix_to_email() { - to_email= - while [ -n "${1}" ]; do - [ -n "${to_email}" ] && to_email="${to_email}, " - to_email="${to_email}${1}" - shift 1 - done -} - -# ${to_email} without quotes here -fix_to_email ${to_email} - -# ----------------------------------------------------------------------------- -# handle output if we're running in unit test mode -if [ ${unittest} ]; then - for method_name in ${method_names}; do - to_var="to_${method_name}" - echo "results: ${method_name}: ${!to_var}" - done - exit 0 -fi - -# ----------------------------------------------------------------------------- -# check that we have at least a method enabled -proceed=0 -for method in "${SEND_EMAIL}" \ - "${SEND_PUSHOVER}" \ - "${SEND_TELEGRAM}" \ - "${SEND_SLACK}" \ - "${SEND_ROCKETCHAT}" \ - "${SEND_ALERTA}" \ - "${SEND_FLOCK}" \ - "${SEND_DISCORD}" \ - "${SEND_TWILIO}" \ - "${SEND_HIPCHAT}" \ - "${SEND_MESSAGEBIRD}" \ - "${SEND_KAVENEGAR}" \ - "${SEND_PUSHBULLET}" \ - "${SEND_KAFKA}" \ - "${SEND_PD}" \ - "${SEND_FLEEP}" \ - "${SEND_PROWL}" \ - "${SEND_MATRIX}" \ - "${SEND_CUSTOM}" \ - "${SEND_IRC}" \ - "${SEND_AWSSNS}" \ - "${SEND_SYSLOG}" \ - "${SEND_SMS}" \ - "${SEND_MSTEAMS}" \ - "${SEND_DYNATRACE}" \ - "${SEND_OPSGENIE}" \ - "${SEND_GOTIFY}" \ - "${SEND_NTFY}" ; do - - if [ "${method}" == "YES" ]; then - proceed=1 - break - fi -done - -if [ "$proceed" -eq 0 ]; then - if [ "${have_to_send_something}" = "NO" ]; then - debug "All notification methods are disabled; not sending ${notification_description}." - exit 0 - else - fatal "All notification methods are disabled; not sending ${notification_description}." - fi -fi - -check_supported_targets error - -# ----------------------------------------------------------------------------- -# get the date the alarm happened - -date=$(date --date=@${when} "${date_format}" 2>/dev/null) -[ -z "${date}" ] && date=$(date "${date_format}" 2>/dev/null) -[ -z "${date}" ] && date=$(date --date=@${when} 2>/dev/null) -[ -z "${date}" ] && date=$(date 2>/dev/null) - -# ----------------------------------------------------------------------------- -# get the date in utc the alarm happened - -date_utc=$(date --date=@${when} "${date_format}" -u 2>/dev/null) -[ -z "${date_utc}" ] && date_utc=$(date -u "${date_format}" 2>/dev/null) -[ -z "${date_utc}" ] && date_utc=$(date -u --date=@${when} 2>/dev/null) -[ -z "${date_utc}" ] && date_utc=$(date -u 2>/dev/null) - -# ---------------------------------------------------------------------------- -# prepare some extra headers if we've been asked to thread e-mails -if [ "${SEND_EMAIL}" == "YES" ] && [ "${EMAIL_THREADING}" != "NO" ]; then - email_thread_headers="In-Reply-To: <${chart}-${name}@${host}>\\r\\nReferences: <${chart}-${name}@${host}>" -else - email_thread_headers= -fi - -# ----------------------------------------------------------------------------- -# function to URL encode a string - -urlencode() { - local string="${1}" strlen encoded pos c o - - strlen=${#string} - for ((pos = 0; pos < strlen; pos++)); do - c=${string:pos:1} - case "${c}" in - [-_.~a-zA-Z0-9]) - o="${c}" - ;; - - *) - printf -v o '%%%02x' "'${c}" - ;; - esac - encoded+="${o}" - done - - REPLY="${encoded}" - echo "${REPLY}" -} - -# ----------------------------------------------------------------------------- -# function to convert a duration in seconds, to a human readable duration -# using DAYS, MINUTES, SECONDS - -duration4human() { - local s="${1}" d=0 h=0 m=0 ds="day" hs="hour" ms="minute" ss="second" ret - d=$((s / 86400)) - s=$((s - (d * 86400))) - h=$((s / 3600)) - s=$((s - (h * 3600))) - m=$((s / 60)) - s=$((s - (m * 60))) - - if [ ${d} -gt 0 ]; then - [ ${m} -ge 30 ] && h=$((h + 1)) - [ ${d} -gt 1 ] && ds="days" - [ ${h} -gt 1 ] && hs="hours" - if [ ${h} -gt 0 ]; then - ret="${d} ${ds} and ${h} ${hs}" - else - ret="${d} ${ds}" - fi - elif [ ${h} -gt 0 ]; then - [ ${s} -ge 30 ] && m=$((m + 1)) - [ ${h} -gt 1 ] && hs="hours" - [ ${m} -gt 1 ] && ms="minutes" - if [ ${m} -gt 0 ]; then - ret="${h} ${hs} and ${m} ${ms}" - else - ret="${h} ${hs}" - fi - elif [ ${m} -gt 0 ]; then - [ ${m} -gt 1 ] && ms="minutes" - [ ${s} -gt 1 ] && ss="seconds" - if [ ${s} -gt 0 ]; then - ret="${m} ${ms} and ${s} ${ss}" - else - ret="${m} ${ms}" - fi - else - [ ${s} -gt 1 ] && ss="seconds" - ret="${s} ${ss}" - fi - - REPLY="${ret}" - echo "${REPLY}" -} - -# ----------------------------------------------------------------------------- -# email sender - -send_email() { - local ret opts=() sender_email="${EMAIL_SENDER}" sender_name= - if [ "${SEND_EMAIL}" = "YES" ]; then - - if [ -n "${EMAIL_SENDER}" ]; then - if [[ ${EMAIL_SENDER} =~ ^\".*\"\ \<.*\>$ ]]; then - # the name includes double quotes - sender_email="$(echo "${EMAIL_SENDER}" | cut -d '<' -f 2 | cut -d '>' -f 1)" - sender_name="$(echo "${EMAIL_SENDER}" | cut -d '"' -f 2)" - elif [[ ${EMAIL_SENDER} =~ ^\'.*\'\ \<.*\>$ ]]; then - # the name includes single quotes - sender_email="$(echo "${EMAIL_SENDER}" | cut -d '<' -f 2 | cut -d '>' -f 1)" - sender_name="$(echo "${EMAIL_SENDER}" | cut -d "'" -f 2)" - elif [[ ${EMAIL_SENDER} =~ ^.*\ \<.*\>$ ]]; then - # the name does not have any quotes - sender_email="$(echo "${EMAIL_SENDER}" | cut -d '<' -f 2 | cut -d '>' -f 1)" - sender_name="$(echo "${EMAIL_SENDER}" | cut -d '<' -f 1)" - fi - fi - - [ -n "${sender_email}" ] && opts+=(-f "${sender_email}") - [ -n "${sender_name}" ] && ${sendmail} -F 2>&1 | head -1 | grep -qv "sendmail: unrecognized option: F" && opts+=(-F "${sender_name}") - - if [ "${debug}" = "1" ]; then - echo >&2 "--- BEGIN sendmail command ---" - printf >&2 "%q " "${sendmail}" -t "${opts[@]}" - echo >&2 - echo >&2 "--- END sendmail command ---" - fi - - local cmd_output - cmd_output=$("${sendmail}" -t "${opts[@]}" 2>&1) - ret=$? - - if [ ${ret} -eq 0 ]; then - info "sent email to '${to_email}' for ${notification_description}" - return 0 - else - error "failed to send email to '${to_email}' for ${notification_description}, with error code ${ret} (${cmd_output})." - return 1 - fi - fi - - return 1 -} - -# ----------------------------------------------------------------------------- -# pushover sender - -send_pushover() { - local apptoken="${1}" usertokens="${2}" when="${3}" url="${4}" status="${5}" title="${6}" message="${7}" httpcode sent=0 user priority - - if [ "${SEND_PUSHOVER}" = "YES" ] && [ -n "${apptoken}" ] && [ -n "${usertokens}" ] && [ -n "${title}" ] && [ -n "${message}" ]; then - - # https://pushover.net/api - priority=-2 - case "${status}" in - CLEAR) priority=-1 ;; # low priority: no sound or vibration - WARNING) priority=0 ;; # normal priority: respect quiet hours - CRITICAL) priority=1 ;; # high priority: bypass quiet hours - *) priority=-2 ;; # lowest priority: no notification at all - esac - - for user in ${usertokens}; do - httpcode=$(docurl \ - --form-string "token=${apptoken}" \ - --form-string "user=${user}" \ - --form-string "html=1" \ - --form-string "title=${title}" \ - --form-string "message=${message}" \ - --form-string "timestamp=${when}" \ - --form-string "url=${url}" \ - --form-string "url_title=Open netdata dashboard to view the alarm" \ - --form-string "priority=${priority}" \ - https://api.pushover.net/1/messages.json) - - if [ "${httpcode}" = "200" ]; then - info "sent pushover notification to '${user}' for ${notification_description}" - sent=$((sent + 1)) - else - error "failed to send pushover notification to '${user}' for ${notification_description}, with HTTP response status code ${httpcode}." - fi - done - - [ ${sent} -gt 0 ] && return 0 - fi - - return 1 -} - -# ----------------------------------------------------------------------------- -# pushbullet sender - -send_pushbullet() { - local userapikey="${1}" source_device="${2}" recipients="${3}" url="${4}" title="${5}" message="${6}" httpcode sent=0 userOrChannelTag - if [ "${SEND_PUSHBULLET}" = "YES" ] && [ -n "${userapikey}" ] && [ -n "${recipients}" ] && [ -n "${message}" ] && [ -n "${title}" ]; then - - # https://docs.pushbullet.com/#create-push - # Accept specification of user(s) (PushBullet account email address) and/or channel tag(s), separated by spaces. - # If recipient begins with a "#" then send to channel tag, otherwise send to email recipient. - - for userOrChannelTag in ${recipients}; do - if [ "${userOrChannelTag::1}" = "#" ]; then - userOrChannelTag_type="channel_tag" - userOrChannelTag="${userOrChannelTag:1}" # Remove hash from start of channel tag (required by pushbullet API) - else - userOrChannelTag_type="email" - fi - - httpcode=$(docurl \ - --header 'Access-Token: '${userapikey}'' \ - --header 'Content-Type: application/json' \ - --data-binary @<( - cat <<EOF - {"title": "${title}", - "type": "link", - "${userOrChannelTag_type}": "${userOrChannelTag}", - "body": "$(echo -n ${message})", - "url": "${url}", - "source_device_iden": "${source_device}"} -EOF - ) "https://api.pushbullet.com/v2/pushes" -X POST) - - if [ "${httpcode}" = "200" ]; then - info "sent pushbullet notification to '${userOrChannelTag}' for ${notification_description}" - sent=$((sent + 1)) - else - error "failed to send pushbullet notification to '${userOrChannelTag}' for ${notification_description}, with HTTP response status code ${httpcode}." - fi - done - - [ ${sent} -gt 0 ] && return 0 - fi - - return 1 -} - -# ----------------------------------------------------------------------------- -# kafka sender - -send_kafka() { - local httpcode sent=0 - if [ "${SEND_KAFKA}" = "YES" ]; then - httpcode=$(docurl -X POST \ - --data "{host_ip:\"${KAFKA_SENDER_IP}\",when:${when},name:\"${name}\",chart:\"${chart}\",status:\"${status}\",old_status:\"${old_status}\",value:${value},old_value:${old_value},duration:${duration},non_clear_duration:${non_clear_duration},units:\"${units}\",info:\"${info}\"}" \ - "${KAFKA_URL}") - - if [ "${httpcode}" = "204" ]; then - info "sent kafka data to '${KAFKA_SENDER_IP}' for ${notification_description}" - sent=$((sent + 1)) - else - error "failed to send kafka data to '${KAFKA_SENDER_IP}' for ${notification_description}, with HTTP response status code ${httpcode}." - fi - - [ ${sent} -gt 0 ] && return 0 - fi - - return 1 -} - -# ----------------------------------------------------------------------------- -# pagerduty.com sender - -send_pd() { - local recipients="${1}" sent=0 severity current_time payload url response_code - unset t - case ${status} in - CLEAR) t='resolve' ; severity='info' ;; - WARNING) t='trigger' ; severity='warning' ;; - CRITICAL) t='trigger' ; severity='critical' ;; - esac - - if [ ${SEND_PD} = "YES" ] && [ -n "${t}" ]; then - if [ "$(uname)" == "Linux" ]; then - current_time=$(date -d @${when} +'%Y-%m-%dT%H:%M:%S.000') - else - current_time=$(date -r ${when} +'%Y-%m-%dT%H:%M:%S.000') - fi - for PD_SERVICE_KEY in ${recipients}; do - d="${status} ${name} = ${value_string} - ${host}" - if [ ${USE_PD_VERSION} = "2" ]; then - payload="$( - cat <<EOF - { - "payload" : { - "summary": "${info:0:1024}", - "source" : "${args_host}", - "severity" : "${severity}", - "timestamp" : "${current_time}", - "class" : "${chart}", - "custom_details": { - "value_w_units": "${value_string}", - "when": "${when}", - "duration" : "${duration}", - "roles": "${roles}", - "alarm_id" : "${alarm_id}", - "name" : "${name}", - "chart" : "${chart}", - "status" : "${status}", - "old_status" : "${old_status}", - "value" : "${value}", - "old_value" : "${old_value}", - "src" : "${src}", - "non_clear_duration" : "${non_clear_duration}", - "units" : "${units}", - "info" : "${info}" - } - }, - "routing_key": "${PD_SERVICE_KEY}", - "event_action": "${t}", - "dedup_key": "${unique_id}" - } -EOF - )" - url="https://events.pagerduty.com/v2/enqueue" - response_code="202" - else - payload="$( - cat <<EOF - { - "service_key": "${PD_SERVICE_KEY}", - "event_type": "${t}", - "incident_key" : "${alarm_id}", - "description": "${d}", - "details": { - "value_w_units": "${value_string}", - "when": "${when}", - "duration" : "${duration}", - "roles": "${roles}", - "alarm_id" : "${alarm_id}", - "name" : "${name}", - "chart" : "${chart}", - "status" : "${status}", - "old_status" : "${old_status}", - "value" : "${value}", - "old_value" : "${old_value}", - "src" : "${src}", - "non_clear_duration" : "${non_clear_duration}", - "units" : "${units}", - "info" : "${info}" - } - } -EOF - )" - url="https://events.pagerduty.com/generic/2010-04-15/create_event.json" - response_code="200" - fi - httpcode=$(docurl -X POST --data "${payload}" ${url}) - if [ "${httpcode}" = "${response_code}" ]; then - info "sent pagerduty event for ${notification_description}" - sent=$((sent + 1)) - else - error "failed to send pagerduty event for ${notification_description}, with HTTP response status code ${httpcode}." - fi - done - - [ ${sent} -gt 0 ] && return 0 - fi - - return 1 -} - -# ----------------------------------------------------------------------------- -# twilio sender - -send_twilio() { - local accountsid="${1}" accounttoken="${2}" twilionumber="${3}" recipients="${4}" title="${5}" message="${6}" httpcode sent=0 user - if [ "${SEND_TWILIO}" = "YES" ] && [ -n "${accountsid}" ] && [ -n "${accounttoken}" ] && [ -n "${twilionumber}" ] && [ -n "${recipients}" ] && [ -n "${message}" ] && [ -n "${title}" ]; then - #https://www.twilio.com/packages/labs/code/bash/twilio-sms - for user in ${recipients}; do - httpcode=$(docurl -X POST \ - --data-urlencode "From=${twilionumber}" \ - --data-urlencode "To=${user}" \ - --data-urlencode "Body=${title} ${message}" \ - -u "${accountsid}:${accounttoken}" \ - "https://api.twilio.com/2010-04-01/Accounts/${accountsid}/Messages.json") - - if [ "${httpcode}" = "201" ]; then - info "sent Twilio SMS to '${user}' for ${notification_description}" - sent=$((sent + 1)) - else - error "failed to send Twilio SMS to '${user}' for ${notification_description}, with HTTP response status code ${httpcode}." - fi - done - - [ ${sent} -gt 0 ] && return 0 - fi - - return 1 -} - -# ----------------------------------------------------------------------------- -# hipchat sender - -send_hipchat() { - local authtoken="${1}" recipients="${2}" message="${3}" httpcode sent=0 room color msg_format notify - - # remove <small></small> from the message - message="${message//<small>/}" - message="${message//<\/small>/}" - - if [ "${SEND_HIPCHAT}" = "YES" ] && [ -n "${HIPCHAT_SERVER}" ] && [ -n "${authtoken}" ] && [ -n "${recipients}" ] && [ -n "${message}" ]; then - # Valid values: html, text. - # Defaults to 'html'. - msg_format="html" - - # Background color for message. Valid values: yellow, green, red, purple, gray, random. Defaults to 'yellow'. - case "${status}" in - WARNING) color="yellow" ;; - CRITICAL) color="red" ;; - CLEAR) color="green" ;; - *) color="gray" ;; - esac - - # Whether this message should trigger a user notification (change the tab color, play a sound, notify mobile phones, etc). - # Each recipient's notification preferences are taken into account. - # Defaults to false. - notify="true" - - for room in ${recipients}; do - httpcode=$(docurl -X POST \ - -H "Content-type: application/json" \ - -H "Authorization: Bearer ${authtoken}" \ - -d "{\"color\": \"${color}\", \"from\": \"${host}\", \"message_format\": \"${msg_format}\", \"message\": \"${message}\", \"notify\": \"${notify}\"}" \ - "https://${HIPCHAT_SERVER}/v2/room/${room}/notification") - - if [ "${httpcode}" = "204" ]; then - info "sent HipChat notification to '${room}' for ${notification_description}" - sent=$((sent + 1)) - else - error "failed to send HipChat notification to '${room}' for ${notification_description}, with HTTP response status code ${httpcode}." - fi - done - - [ ${sent} -gt 0 ] && return 0 - fi - - return 1 -} - -# ----------------------------------------------------------------------------- -# messagebird sender - -send_messagebird() { - local accesskey="${1}" messagebirdnumber="${2}" recipients="${3}" title="${4}" message="${5}" httpcode sent=0 user - if [ "${SEND_MESSAGEBIRD}" = "YES" ] && [ -n "${accesskey}" ] && [ -n "${messagebirdnumber}" ] && [ -n "${recipients}" ] && [ -n "${message}" ] && [ -n "${title}" ]; then - #https://developers.messagebird.com/docs/messaging - for user in ${recipients}; do - httpcode=$(docurl -X POST \ - --data-urlencode "originator=${messagebirdnumber}" \ - --data-urlencode "recipients=${user}" \ - --data-urlencode "body=${title} ${message}" \ - --data-urlencode "datacoding=auto" \ - -H "Authorization: AccessKey ${accesskey}" \ - "https://rest.messagebird.com/messages") - - if [ "${httpcode}" = "201" ]; then - info "sent Messagebird SMS to '${user}' for ${notification_description}" - sent=$((sent + 1)) - else - error "failed to send Messagebird SMS to '${user}' for ${notification_description}, with HTTP response status code ${httpcode}." - fi - done - - [ ${sent} -gt 0 ] && return 0 - fi - - return 1 -} - -# ----------------------------------------------------------------------------- -# kavenegar sender - -send_kavenegar() { - local API_KEY="${1}" kavenegarsender="${2}" recipients="${3}" title="${4}" message="${5}" httpcode sent=0 user - if [ "${SEND_KAVENEGAR}" = "YES" ] && [ -n "${API_KEY}" ] && [ -n "${kavenegarsender}" ] && [ -n "${recipients}" ] && [ -n "${message}" ] && [ -n "${title}" ]; then - # http://api.kavenegar.com/v1/{API-KEY}/sms/send.json - for user in ${recipients}; do - httpcode=$(docurl -X POST http://api.kavenegar.com/v1/${API_KEY}/sms/send.json \ - --data-urlencode "sender=${kavenegarsender}" \ - --data-urlencode "receptor=${user}" \ - --data-urlencode "message=${title} ${message}") - - if [ "${httpcode}" = "200" ]; then - info "sent Kavenegar SMS to '${user}' for ${notification_description}" - sent=$((sent + 1)) - else - error "failed to send Kavenegar SMS to '${user}' for ${notification_description}, with HTTP response status code ${httpcode}." - fi - done - - [ ${sent} -gt 0 ] && return 0 - fi - - return 1 -} - -# ----------------------------------------------------------------------------- -# telegram sender - -send_telegram() { - local bottoken="${1}" chatids="${2}" message="${3}" httpcode sent=0 chatid emoji disableNotification="" - - if [ "${status}" = "CLEAR" ]; then disableNotification="--data-urlencode disable_notification=true"; fi - - case "${status}" in - WARNING) emoji="⚠️" ;; - CRITICAL) emoji="🔴" ;; - CLEAR) emoji="✅" ;; - *) emoji="⚪️" ;; - esac - - if [ "${SEND_TELEGRAM}" = "YES" ] && [ -n "${bottoken}" ] && [ -n "${chatids}" ] && [ -n "${message}" ]; then - for chatid in ${chatids}; do - notify_telegram=1 - notify_retries=${TELEGRAM_RETRIES_ON_LIMIT:-0} - - while [ ${notify_telegram} -eq 1 ]; do - # https://core.telegram.org/bots/api#sendmessage - httpcode=$(docurl ${disableNotification} \ - --data-urlencode "parse_mode=HTML" \ - --data-urlencode "disable_web_page_preview=true" \ - --data-urlencode "text=${emoji} ${message}" \ - "https://api.telegram.org/bot${bottoken}/sendMessage?chat_id=${chatid}") - - notify_telegram=0 - - if [ "${httpcode}" = "200" ]; then - info "sent telegram notification to '${chatid}' for ${notification_description}" - sent=$((sent + 1)) - elif [ "${httpcode}" = "401" ]; then - error "failed to send telegram notification to '${chatid}' for ${notification_description}, wrong bot token." - elif [ "${httpcode}" = "429" ]; then - if [ "$notify_retries" -gt 0 ]; then - error "failed to send telegram notification to '${chatid}' for ${notification_description}, rate limit exceeded, retrying after 1s." - notify_retries=$((notify_retries - 1)) - notify_telegram=1 - sleep 1 - else - error "failed to send telegram notification to '${chatid}' for ${notification_description}, rate limit exceeded." - fi - else - error "failed to send telegram notification to '${chatid}' for ${notification_description}, with HTTP response status code ${httpcode}." - fi - done - done - - [ ${sent} -gt 0 ] && return 0 - fi - - return 1 -} - -# ----------------------------------------------------------------------------- -# Microsoft Team sender - -send_msteams() { - - local webhook="${1}" channels="${2}" httpcode sent=0 channel color payload - - [ "${SEND_MSTEAMS}" != "YES" ] && return 1 - - case "${status}" in - WARNING) icon="${MSTEAMS_ICON_WARNING}" && color="${MSTEAMS_COLOR_WARNING}" ;; - CRITICAL) icon="${MSTEAMS_ICON_CRITICAL}" && color="${MSTEAMS_COLOR_CRITICAL}" ;; - CLEAR) icon="${MSTEAMS_ICON_CLEAR}" && color="${MSTEAMS_COLOR_CLEAR}" ;; - *) icon="${MSTEAMS_ICON_DEFAULT}" && color="${MSTEAMS_COLOR_DEFAULT}" ;; - esac - - for channel in ${channels}; do - ## More details are available here regarding the payload syntax options : https://docs.microsoft.com/en-us/outlook/actionable-messages/message-card-reference - ## Online designer : https://adaptivecards.io/designer/ - payload="$( - cat <<EOF - { - "@context": "http://schema.org/extensions", - "@type": "MessageCard", - "themeColor": "${color}", - "title": "$icon Alert ${status} from netdata for ${host}", - "text": "${host} ${status_message}, ${chart}, *${alarm}*", - "potentialAction": [ - { - "@type": "OpenUri", - "name": "Netdata", - "targets": [ - { "os": "default", "uri": "${goto_url}" } - ] - } - ] - } -EOF - )" - - # Replacing in the webhook CHANNEL string by the MS Teams channel name from conf file. - cur_webhook="${webhook//CHANNEL/${channel}}" - - httpcode=$(docurl -H "Content-Type: application/json" -d "${payload}" "${cur_webhook}") - - if [ "${httpcode}" = "200" ]; then - info "sent Microsoft team notification to '${cur_webhook}' for ${notification_description}" - sent=$((sent + 1)) - else - error "failed to send Microsoft team to '${cur_webhook}' for ${notification_description}, with HTTP response status code ${httpcode}." - fi - done - - [ ${sent} -gt 0 ] && return 0 - - return 1 -} - -# slack sender - -send_slack() { - local webhook="${1}" channels="${2}" httpcode sent=0 channel color payload - - [ "${SEND_SLACK}" != "YES" ] && return 1 - - case "${status}" in - WARNING) color="warning" ;; - CRITICAL) color="danger" ;; - CLEAR) color="good" ;; - *) color="#777777" ;; - esac - - for channel in ${channels}; do - # Default entry in the recipient is without a hash in front (backwards-compatible). Accept specification of channel or user. - if [ "${channel::1}" != "#" ] && [ "${channel::1}" != "@" ]; then channel="#$channel"; fi - - # If channel is equal to "#" then do not send the channel attribute at all. Slack also defines channels and users in webhooks. - if [ "${channel}" = "#" ]; then - ch="" - chstr="without specifying a channel" - else - ch="\"channel\": \"${channel}\"," - chstr="to '${channel}'" - fi - - payload="$( - cat <<EOF - { - $ch - "username": "netdata on ${host}", - "icon_url": "${images_base_url}/images/banner-icon-144x144.png", - "text": "${host} ${status_message}, \`${chart}\`, *${alarm}*", - "attachments": [ - { - "fallback": "${alarm} - ${chart} - ${info}", - "color": "${color}", - "title": "${alarm}", - "title_link": "${goto_url}", - "text": "${info}", - "fields": [ - { - "title": "${chart}", - "value": "chart", - "short": true - } - ], - "thumb_url": "${image}", - "footer": "by ${host}", - "ts": ${when} - } - ] - } -EOF - )" - - httpcode=$(docurl -X POST --data-urlencode "payload=${payload}" "${webhook}") - if [ "${httpcode}" = "200" ]; then - info "sent slack notification ${chstr} for ${notification_description}" - sent=$((sent + 1)) - else - error "failed to send slack notification ${chstr} for ${notification_description}, with HTTP response status code ${httpcode}." - fi - done - - [ ${sent} -gt 0 ] && return 0 - - return 1 -} - -# ----------------------------------------------------------------------------- -# rocketchat sender - -send_rocketchat() { - local webhook="${1}" channels="${2}" httpcode sent=0 channel color payload - - [ "${SEND_ROCKETCHAT}" != "YES" ] && return 1 - - case "${status}" in - WARNING) color="warning" ;; - CRITICAL) color="danger" ;; - CLEAR) color="good" ;; - *) color="#777777" ;; - esac - - for channel in ${channels}; do - payload="$( - cat <<EOF - { - "channel": "#${channel}", - "alias": "netdata on ${host}", - "avatar": "${images_base_url}/images/banner-icon-144x144.png", - "text": "${host} ${status_message}, \`${chart}\`, *${alarm}*", - "attachments": [ - { - "color": "${color}", - "title": "${alarm}", - "title_link": "${goto_url}", - "text": "${info}", - "fields": [ - { - "title": "${chart}", - "short": true, - "value": "chart" - } - ], - "thumb_url": "${image}", - "ts": "${when}" - } - ] - } -EOF - )" - - httpcode=$(docurl -X POST --data-urlencode "payload=${payload}" "${webhook}") - if [ "${httpcode}" = "200" ]; then - info "sent rocketchat notification to '${channel}' for ${notification_description}" - sent=$((sent + 1)) - else - error "failed to send rocketchat notification to '${channel}' for ${notification_description}, with HTTP response status code ${httpcode}." - fi - done - - [ ${sent} -gt 0 ] && return 0 - - return 1 -} - -# ----------------------------------------------------------------------------- -# alerta sender - -send_alerta() { - local webhook="${1}" channels="${2}" httpcode sent=0 channel severity resource event payload auth - - [ "${SEND_ALERTA}" != "YES" ] && return 1 - - case "${status}" in - CRITICAL) severity="critical" ;; - WARNING) severity="warning" ;; - CLEAR) severity="cleared" ;; - *) severity="indeterminate" ;; - esac - - if [[ ${chart} == httpcheck* ]]; then - resource=$chart - event=$name - else - resource="${host}" - event="${chart}.${name}" - fi - - for channel in ${channels}; do - payload="$( - cat <<EOF - { - "resource": "${resource}", - "event": "${event}", - "environment": "${channel}", - "severity": "${severity}", - "service": ["Netdata"], - "group": "Performance", - "value": "${value_string}", - "text": "${info}", - "tags": ["alarm_id:${alarm_id}"], - "attributes": { - "roles": "${roles}", - "name": "${name}", - "chart": "${chart}", - "source": "${src}", - "moreInfo": "<a href=\"${goto_url}\">View Netdata</a>" - }, - "origin": "netdata/${host}", - "type": "netdataAlarm", - "rawData": "${BASH_ARGV[@]}" - } -EOF - )" - - if [ -n "${ALERTA_API_KEY}" ]; then - auth="Key ${ALERTA_API_KEY}" - fi - - httpcode=$(docurl -X POST "${webhook}/alert" -H "Content-Type: application/json" -H "Authorization: $auth" --data "${payload}") - - if [ "${httpcode}" = "200" ] || [ "${httpcode}" = "201" ]; then - info "sent alerta notification to '${channel}' for ${notification_description}" - sent=$((sent + 1)) - elif [ "${httpcode}" = "202" ]; then - info "suppressed alerta notification to '${channel}' for ${notification_description}" - else - error "failed to send alerta notification to '${channel}' for ${notification_description}, with HTTP response status code ${httpcode}." - fi - done - - [ ${sent} -gt 0 ] && return 0 - - return 1 -} - -# ----------------------------------------------------------------------------- -# flock sender - -send_flock() { - local webhook="${1}" channels="${2}" httpcode sent=0 channel color payload - - [ "${SEND_FLOCK}" != "YES" ] && return 1 - - case "${status}" in - WARNING) color="warning" ;; - CRITICAL) color="danger" ;; - CLEAR) color="good" ;; - *) color="#777777" ;; - esac - - for channel in ${channels}; do - httpcode=$(docurl -X POST "${webhook}" -H "Content-Type: application/json" -d "{ - \"sendAs\": { - \"name\" : \"netdata on ${host}\", - \"profileImage\" : \"${images_base_url}/images/banner-icon-144x144.png\" - }, - \"text\": \"${host} *${status_message}*\", - \"timestamp\": \"${when}\", - \"attachments\": [ - { - \"description\": \"${chart} - ${info}\", - \"color\": \"${color}\", - \"title\": \"${alarm}\", - \"url\": \"${goto_url}\", - \"text\": \"${info}\", - \"views\": { - \"image\": { - \"original\": { \"src\": \"${image}\", \"width\": 400, \"height\": 400 }, - \"thumbnail\": { \"src\": \"${image}\", \"width\": 50, \"height\": 50 }, - \"filename\": \"${image}\" - } - } - } - ] - }") - if [ "${httpcode}" = "200" ]; then - info "sent flock notification to '${channel}' for ${notification_description}" - sent=$((sent + 1)) - else - error "failed to send flock notification to '${channel}' for ${notification_description}, with HTTP response status code ${httpcode}." - fi - done - - [ ${sent} -gt 0 ] && return 0 - - return 1 -} - -# ----------------------------------------------------------------------------- -# discord sender - -send_discord() { - local webhook="${1}/slack" channels="${2}" httpcode sent=0 channel color payload username - - [ "${SEND_DISCORD}" != "YES" ] && return 1 - - case "${status}" in - WARNING) color="warning" ;; - CRITICAL) color="danger" ;; - CLEAR) color="good" ;; - *) color="#777777" ;; - esac - - for channel in ${channels}; do - username="netdata on ${host}" - [ ${#username} -gt 32 ] && username="${username:0:29}..." - - payload="$( - cat <<EOF - { - "channel": "#${channel}", - "username": "${username}", - "text": "${host} ${status_message}, \`${chart}\`, *${alarm}*", - "icon_url": "${images_base_url}/images/banner-icon-144x144.png", - "attachments": [ - { - "color": "${color}", - "title": "${alarm}", - "title_link": "${goto_url}", - "text": "${info}", - "fields": [ - { - "title": "${chart}" - } - ], - "thumb_url": "${image}", - "footer_icon": "${images_base_url}/images/banner-icon-144x144.png", - "footer": "${host}", - "ts": ${when} - } - ] - } -EOF - )" - - httpcode=$(docurl -X POST --data-urlencode "payload=${payload}" "${webhook}") - if [ "${httpcode}" = "200" ]; then - info "sent discord notification to '${channel}' for ${notification_description}" - sent=$((sent + 1)) - else - error "failed to send discord notification to '${channel}' for ${notification_description}, with HTTP response status code ${httpcode}." - fi - done - - [ ${sent} -gt 0 ] && return 0 - - return 1 -} - -# ----------------------------------------------------------------------------- -# fleep sender - -send_fleep() { - local httpcode sent=0 webhooks="${1}" data message - if [ "${SEND_FLEEP}" = "YES" ]; then - message="${host} ${status_message}, \`${chart}\`, *${alarm}*\\n${info}" - - for hook in ${webhooks}; do - data="{ " - data="${data} 'message': '${message}', " - data="${data} 'user': '${FLEEP_SENDER}' " - data="${data} }" - - httpcode=$(docurl -X POST --data "${data}" "https://fleep.io/hook/${hook}") - - if [ "${httpcode}" = "200" ]; then - info "sent fleep data to user '${FLEEP_SENDER}' for ${notification_description}" - sent=$((sent + 1)) - else - error "failed to send fleep data to user '${FLEEP_SENDER}' for ${notification_description}, with HTTP response status code ${httpcode}." - fi - done - - [ ${sent} -gt 0 ] && return 0 - fi - - return 1 -} - -# ----------------------------------------------------------------------------- -# Prowl sender - -send_prowl() { - local httpcode sent=0 data message keys prio=0 alarm_url event - if [ "${SEND_PROWL}" = "YES" ]; then - message="$(urlencode "${host} ${status_message}, \`${chart}\`, *${alarm}*\\n${info}")" - message="description=${message}" - keys="$(urlencode "$(echo "${1}" | tr ' ' ,)")" - keys="apikey=${keys}" - app="application=Netdata" - - case "${status}" in - CRITICAL) - prio=2 - ;; - WARNING) - prio=1 - ;; - esac - prio="priority=${prio}" - - alarm_url="$(urlencode ${goto_url})" - alarm_url="url=${alarm_url}" - event="$(urlencode "${host} ${status_message}")" - event="event=${event}" - - data="${keys}&${prio}&${alarm_url}&${app}&${event}&${message}" - - httpcode=$(docurl -X POST --data "${data}" "https://api.prowlapp.com/publicapi/add") - - if [ "${httpcode}" = "200" ]; then - info "sent prowl event for ${notification_description}" - sent=1 - else - error "failed to send prowl event for ${notification_description}, with HTTP response status code ${httpcode}." - fi - - [ ${sent} -gt 0 ] && return 0 - fi - - return 1 -} - -# ----------------------------------------------------------------------------- -# irc sender - -send_irc() { - local NICKNAME="${1}" REALNAME="${2}" CHANNELS="${3}" NETWORK="${4}" PORT="${5}" SERVERNAME="${6}" MESSAGE="${7}" sent=0 channel color send_alarm reply_codes error - - if [ "${SEND_IRC}" = "YES" ] && [ -n "${NICKNAME}" ] && [ -n "${REALNAME}" ] && [ -n "${CHANNELS}" ] && [ -n "${NETWORK}" ] && [ -n "${SERVERNAME}" ] && [ -n "${PORT}" ]; then - case "${status}" in - WARNING) color="warning" ;; - CRITICAL) color="danger" ;; - CLEAR) color="good" ;; - *) color="#777777" ;; - esac - - SNDMESSAGE="${MESSAGE//$'\n'/", "}" - for CHANNEL in ${CHANNELS}; do - error=0 - send_alarm=$(echo -e "USER ${NICKNAME} guest ${REALNAME} ${SERVERNAME}\\nNICK ${NICKNAME}\\nJOIN ${CHANNEL}\\nPRIVMSG ${CHANNEL} :${SNDMESSAGE}\\nQUIT\\n" \ | ${nc} "${NETWORK}" "${PORT}") - reply_codes=$(echo "${send_alarm}" | cut -d ' ' -f 2 | grep -o '[0-9]*') - for code in ${reply_codes}; do - if [ "${code}" -ge 400 ] && [ "${code}" -le 599 ]; then - error=1 - break - fi - done - - if [ "${error}" -eq 0 ]; then - info "sent irc notification to '${CHANNEL}' for ${notification_description}" - sent=$((sent + 1)) - else - error "failed to send irc notification to '${CHANNEL}' for ${notification_description}, with error code ${code}." - fi - done - fi - - [ ${sent} -gt 0 ] && return 0 - - return 1 -} - -# ----------------------------------------------------------------------------- -# Amazon SNS sender - -send_awssns() { - local targets="${1}" message='' sent=0 region='' - local default_format="${status} on ${host} at ${date}: ${chart} ${value_string}" - - [ "${SEND_AWSSNS}" = "YES" ] || return 1 - - message=${AWSSNS_MESSAGE_FORMAT:-${default_format}} - - for target in ${targets}; do - # Extract the region from the target ARN. We need to explicitly specify the region so that it matches up correctly. - region="$(echo ${target} | cut -f 4 -d ':')" - if ${aws} sns publish --region "${region}" --subject "${host} ${status_message} - ${name//_/ } - ${chart}" --message "${message}" --target-arn ${target} &>/dev/null; then - info "sent Amazon SNS notification to '${target}' for ${notification_description}" - sent=$((sent + 1)) - else - error "failed to send Amazon SNS notification to '${target}' for ${notification_description}" - fi - done - - [ ${sent} -gt 0 ] && return 0 - - return 1 -} - -# ----------------------------------------------------------------------------- -# Matrix sender - -send_matrix() { - local homeserver="${1}" webhook accesstoken rooms="${2}" httpcode sent=0 payload - - [ "${SEND_MATRIX}" != "YES" ] && return 1 - [ -z "${MATRIX_ACCESSTOKEN}" ] && return 1 - - accesstoken="${MATRIX_ACCESSTOKEN}" - - case "${status}" in - WARNING) emoji="⚠️" ;; - CRITICAL) emoji="🔴" ;; - CLEAR) emoji="✅" ;; - *) emoji="⚪️" ;; - esac - - for room in ${rooms}; do - webhook="$homeserver/_matrix/client/r0/rooms/$(urlencode $room)/send/m.room.message?access_token=$accesstoken" - payload="$( - cat <<EOF - { - "msgtype": "m.notice", - "format": "org.matrix.custom.html", - "formatted_body": "${emoji} ${host} ${status_message} - <b>${name//_/ }</b><br>${chart}<br><a href=\"${goto_url}\">${alarm}</a><br><i>${info}</i>", - "body": "${emoji} ${host} ${status_message} - ${name//_/ } ${chart} ${goto_url} ${alarm} ${info}" - } -EOF - )" - - httpcode=$(docurl -X POST --data "${payload}" "${webhook}") - if [ "${httpcode}" == "200" ]; then - info "sent Matrix notification to '${room}' for ${notification_description}" - sent=$((sent + 1)) - else - error "failed to send Matrix notification to '${room}' for ${notification_description}, with HTTP response status code ${httpcode}." - fi - done - - [ ${sent} -gt 0 ] && return 0 - - return 1 -} - -# ----------------------------------------------------------------------------- -# syslog sender - -send_syslog() { - local facility=${SYSLOG_FACILITY:-"local6"} level='info' targets="${1}" - local priority='' message='' server='' port='' prefix='' - local temp1='' temp2='' - - [ "${SEND_SYSLOG}" = "YES" ] || return 1 - - if [ "${status}" = "CRITICAL" ]; then - level='crit' - elif [ "${status}" = "WARNING" ]; then - level='warning' - fi - - for target in ${targets}; do - priority="${facility}.${level}" - message='' - server='' - port='' - prefix='' - temp1='' - temp2='' - - prefix=$(echo ${target} | cut -d '/' -f 2) - temp1=$(echo ${target} | cut -d '/' -f 1) - - if [ ${prefix} != ${temp1} ]; then - if (echo ${temp1} | grep -q '@'); then - temp2=$(echo ${temp1} | cut -d '@' -f 1) - server=$(echo ${temp1} | cut -d '@' -f 2) - - if [ ${temp2} != ${server} ]; then - priority=${temp2} - fi - - port=$(echo ${server} | rev | cut -d ':' -f 1 | rev) - - if (echo ${server} | grep -E -q '\[.*\]'); then - if (echo ${port} | grep -q ']'); then - port='' - else - server=$(echo ${server} | rev | cut -d ':' -f 2- | rev) - fi - else - if [ ${port} = ${server} ]; then - port='' - else - server=$(echo ${server} | cut -d ':' -f 1) - fi - fi - else - priority=${temp1} - fi - fi - - message="${prefix} ${status} on ${host} at ${date}: ${chart} ${value_string}" - - if [ ${server} ]; then - logger_options="${logger_options} -n ${server}" - if [ ${port} ]; then - logger_options="${logger_options} -P ${port}" - fi - fi - - ${logger} -p ${priority} ${logger_options} "${message}" - done - - return $? -} - -# ----------------------------------------------------------------------------- -# SMS sender - -send_sms() { - local recipients="${1}" errcode errmessage sent=0 - - # Human readable SMS - local msg="${host} ${status_message}: ${chart}, ${alarm}" - - # limit it to 160 characters - msg="${msg:0:160}" - - if [ "${SEND_SMS}" = "YES" ] && [ -n "${sendsms}" ] && [ -n "${recipients}" ] && [ -n "${msg}" ]; then - # http://api.kavenegar.com/v1/{API-KEY}/sms/send.json - for phone in ${recipients}; do - errmessage=$($sendsms $phone "$msg" 2>&1) - errcode=$? - if [ ${errcode} -eq 0 ]; then - info "sent smstools3 SMS to '${user}' for ${notification_description}" - sent=$((sent + 1)) - else - error "failed to send smstools3 SMS to '${user}' for ${notification_description}, with error code ${errcode}: ${errmessage}." - fi - done - - [ ${sent} -gt 0 ] && return 0 - fi - - return 1 -} - -# ----------------------------------------------------------------------------- -# Dynatrace sender - -send_dynatrace() { - [ "${SEND_DYNATRACE}" != "YES" ] && return 1 - - local dynatrace_url="${DYNATRACE_SERVER}/e/${DYNATRACE_SPACE}/api/v1/events" - local description="Netdata Notification for: ${host} ${chart}.${name} is ${status}" - local payload="" - - payload=$(cat <<EOF -{ - "title": "Netdata Alarm from ${host}", - "source" : "${DYNATRACE_ANNOTATION_TYPE}", - "description" : "${description}", - "eventType": "${DYNATRACE_EVENT}", - "attachRules":{ - "tagRule":[{ - "meTypes":["HOST"], - "tags":["${DYNATRACE_TAG_VALUE}"] - }] - }, - "customProperties":{ - "description": "${description}" - } -} -EOF -) - - # echo ${payload} - - httpcode=$(docurl -X POST -H "Authorization: Api-token ${DYNATRACE_TOKEN}" -H "Content-Type: application/json" -d "${payload}" ${dynatrace_url}) - ret=$? - - - if [ ${ret} -eq 0 ]; then - if [ "${httpcode}" = "200" ]; then - info "sent Dynatrace event '${DYNATRACE_EVENT}' to '${DYNATRACE_SERVER}' for ${notification_description}" - return 0 - else - warning "failed to send Dynatrace event to '${DYNATRACE_SERVER}' for ${notification_description}, with HTTP response status code ${httpcode}" - return 1 - fi - else - error "failed to sent Dynatrace '${DYNATRACE_EVENT}' to '${DYNATRACE_SERVER}' for ${notification_description}, with code ${ret}." - return 1 - fi -} - -# ----------------------------------------------------------------------------- -# Opsgenie sender - -send_opsgenie() { - local payload httpcode oldv currv priority - [ "${SEND_OPSGENIE}" != "YES" ] && return 1 - - if [ -z "${OPSGENIE_API_KEY}" ] ; then - info "Can't send Opsgenie notification, because OPSGENIE_API_KEY is not defined" - return 1 - fi - - # Priority for OpsGenie alert (https://support.atlassian.com/opsgenie/docs/update-alert-priority-level/) - case "${status}" in - CRITICAL) priority="P1" ;; # Critical is P1 - WARNING) priority="P3" ;; # Warning is P3 - CLEAR) priority="P5" ;; # Clear is P5 - *) priority="P3" ;; # OpsGenie's default alert level is P3 - esac - - # We are sending null when values are nan to avoid errors while JSON message is parsed - [ "${old_value}" != "nan" ] && oldv="${old_value}" || oldv="null" - [ "${value}" != "nan" ] && currv="${value}" || currv="null" - - payload=$(cat <<EOF - { - "host" : "${host}", - "unique_id" : "${unique_id}", - "alarmId" : ${alarm_id}, - "eventId" : ${event_id}, - "chart" : "${chart}", - "when": ${when}, - "name" : "${name}", - "priority" : "${priority}", - "status" : "${status}", - "old_status" : "${old_status}", - "value" : ${currv}, - "old_value" : ${oldv}, - "duration": ${duration}, - "non_clear_duration": ${non_clear_duration}, - "units" : "${units}", - "info" : "${status_message}, ${info}", - "calc_expression" : "${calc_expression}", - "total_warnings" : "${total_warnings}", - "total_critical" : "${total_critical}", - "src" : "${src}" - } -EOF -) - - httpcode=$(docurl -X POST -H "Content-Type: application/json" -d "${payload}" "${OPSGENIE_API_URL}/v1/json/integrations/webhooks/netdata?apiKey=${OPSGENIE_API_KEY}") - # https://docs.opsgenie.com/docs/alert-api#create-alert - if [ "${httpcode}" = "200" ]; then - info "sent opsgenie event for ${notification_description}" - else - error "failed to send opsgenie event for ${notification_description}, with HTTP response status code ${httpcode}." - return 1 - fi - - return 0 -} - -# ----------------------------------------------------------------------------- -# Gotify sender - -send_gotify() { - local payload httpcode priority - [ "${SEND_GOTIFY}" != "YES" ] && return 1 - - if [ -z "${GOTIFY_APP_TOKEN}" ] ; then - info "Can't send Gotify notification, because GOTIFY_APP_TOKEN is not defined" - return 1 - fi - - # priority for Gotify Android app - case "${status}" in - CRITICAL) priority=10 ;; # sound + vibration - WARNING) priority=4 ;; # sound - *) priority=1 ;; # notification only - esac - - payload=$(cat <<EOF - { - "title" : "${status}, ${name} = ${value_string}, on ${host}", - "message" : "${date}: ${chart} ${value_string}", - "priority" : ${priority} - } -EOF -) - - httpcode=$(docurl -X POST -H "Content-Type: application/json" -d "${payload}" "${GOTIFY_APP_URL}/message?token=${GOTIFY_APP_TOKEN}") - if [ "${httpcode}" = "200" ]; then - info "sent gotify event for ${notification_description}" - else - error "failed to send gotify event for ${notification_description}, with HTTP response status code ${httpcode}." - return 1 - fi - - return 0 -} - -# ----------------------------------------------------------------------------- -# ntfy sender - -send_ntfy() { - local httpcode priority recipients=${1} sent=0 msg - - [ "${SEND_NTFY}" != "YES" ] && return 1 - - case "${status}" in - WARNING) emoji="warning" ;; - CRITICAL) emoji="red_circle" ;; - CLEAR) emoji="white_check_mark" ;; - *) emoji="white_circle" ;; - esac - - case ${status} in - WARNING) priority="high";; - CRITICAL) priority="urgent";; - *) priority="default" ;; - esac - - # Adding ntfy header generation logic - # Heavily inspired by https://github.com/nickexyz/ntfy-shellscripts/blob/main/sabnzbd.sh - tmp_header="" - if [[ -n "${NTFY_USERNAME}" ]] && [[ -n "${NTFY_PASSWORD}" ]]; then - ntfy_base64=$( echo -n "$NTFY_USERNAME:$NTFY_PASSWORD" | base64 ) - tmp_header="Authorization: Basic ${ntfy_base64}" - elif [ -n "${NTFY_ACCESS_TOKEN}" ]; then - tmp_header="Authorization: Bearer ${NTFY_ACCESS_TOKEN}" - fi - ntfy_auth_header=() - if [ -n "${tmp_header}" ]; then - ntfy_auth_header=("-H" "${tmp_header}") - fi - for recipient in ${recipients}; do - msg="${host} ${status_message}: ${alarm} - ${info}" - httpcode=$(docurl -X POST \ - "${ntfy_auth_header[@]}" \ - -H "Icon: https://raw.githubusercontent.com/netdata/netdata/master/web/gui/dashboard/images/favicon-196x196.png" \ - -H "Title: ${host}: ${name//_/ }" \ - -H "Tags: ${emoji}" \ - -H "Priority: ${priority}" \ - -H "Actions: view, View node, ${goto_url}, clear=true;" \ - -d "${msg}" \ - ${recipient}) - if [ "${httpcode}" == "200" ]; then - info "sent ntfy notification to '${recipient}' for ${notification_description}" - sent=$((sent + 1)) - else - error "failed to send ntfy notification to '${recipient}' for ${notification_description}, with HTTP response status code ${httpcode}." - fi - done - - [ ${sent} -gt 0 ] && return 0 - - return 1 -} - -# ----------------------------------------------------------------------------- -# prepare the content of the notification - -# the url to send the user on click -urlencode "${args_host}" >/dev/null -url_host="${REPLY}" -urlencode "${chart}" >/dev/null -url_chart="${REPLY}" -urlencode "${name}" >/dev/null -url_name="${REPLY}" -urlencode "${value_string}" >/dev/null -url_value_string="${REPLY}" - -redirect_params="host=${url_host}&chart=${url_chart}&alarm=${url_name}&alarm_unique_id=${unique_id}&alarm_id=${alarm_id}&alarm_event_id=${event_id}&alarm_when=${when}&alarm_status=${status}&alarm_chart=${chart}&alarm_value=${url_value_string}" - -if [ -z "${NETDATA_REGISTRY_UNIQUE_ID}" ]; then - if [ -f "@registrydir_POST@/netdata.public.unique.id" ]; then - NETDATA_REGISTRY_UNIQUE_ID="$(cat "@registrydir_POST@/netdata.public.unique.id")" - else - error "failed to identify this agent via its NETDATA_REGISTRY_UNIQUE_ID." - fi -fi - -goto_url="${NETDATA_REGISTRY_URL}/registry-alert-redirect.html?agent_machine_guid=${NETDATA_REGISTRY_UNIQUE_ID}&host_machine_guid=${child_machine_guid}&transition_id=${transition_id}&${redirect_params}" - -# the severity of the alarm -severity="${status}" - -# the time the alarm was raised -duration4human ${duration} >/dev/null -duration_txt="${REPLY}" -duration4human ${non_clear_duration} >/dev/null -non_clear_duration_txt="${REPLY}" -raised_for="(was ${old_status,,} for ${duration_txt})" - -# the key status message -status_message="status unknown" - -# the color of the alarm -color="grey" - -# the alarm value -alarm="${summary//_/ } = ${value_string}" - -# the image of the alarm -image="${images_base_url}/images/banner-icon-144x144.png" - -# have a default email status, in case the following case does not catch it -status_email_subject="${status}" - -# prepare the title based on status -case "${status}" in -CRITICAL) - image="${images_base_url}/images/alert-128-red.png" - alarm_badge="https://app.netdata.cloud/static/email/img/label_critical.png" - status_message="is critical" - status_email_subject="Critical" - color="#ca414b" - rich_status_raised_for="Raised to critical, for ${non_clear_duration_txt}" - background_color="#FFEBEF" - border_color="#FF4136" - text_color="#FF4136" - action_text_color="#FFFFFF" - ;; - -WARNING) - image="${images_base_url}/images/alert-128-orange.png" - alarm_badge="https://app.netdata.cloud/static/email/img/label_warning.png" - status_message="needs attention" - status_email_subject="Warning" - color="#ffc107" - rich_status_raised_for="Raised to warning, for ${non_clear_duration_txt}" - background_color="#FFF8E1" - border_color="#FFC300" - text_color="#536775" - action_text_color="#35414A" - ;; - -CLEAR) - image="${images_base_url}/images/check-mark-2-128-green.png" - alarm_badge="https://app.netdata.cloud/static/email/img/label_recovered.png" - status_message="recovered" - status_email_subject="Clear" - color="#77ca6d" - rich_status_raised_for= - background_color="#E5F5E8" - border_color="#68C47D" - text_color="#00AB44" - action_text_color="#FFFFFF" - ;; -esac - -# the html email subject -html_email_subject="${status_email_subject}, ${summary} = ${value_string}, on ${host}" - -if [ "${status}" = "CLEAR" ]; then - severity="Recovered from ${old_status}" - if [ ${non_clear_duration} -gt ${duration} ]; then - raised_for="(alarm was raised for ${non_clear_duration_txt})" - fi - rich_status_raised_for="Recovered from ${old_status,,}, ${raised_for}" - - # don't show the value when the status is CLEAR - # for certain alarms, this value might not have any meaning - alarm="${summary//_/ } ${raised_for}" - html_email_subject="${status_email_subject}, ${summary} ${raised_for}, on ${host}" - -elif { [ "${old_status}" = "WARNING" ] && [ "${status}" = "CRITICAL" ]; }; then - severity="Escalated to ${status}" - if [ ${non_clear_duration} -gt ${duration} ]; then - raised_for="(alarm is raised for ${non_clear_duration_txt})" - fi - rich_status_raised_for="Escalated to critical, ${raised_for}" - -elif { [ "${old_status}" = "CRITICAL" ] && [ "${status}" = "WARNING" ]; }; then - severity="Demoted to ${status}" - if [ ${non_clear_duration} -gt ${duration} ]; then - raised_for="(alarm is raised for ${non_clear_duration_txt})" - fi - rich_status_raised_for="Demoted to warning, ${raised_for}" - -else - raised_for= -fi - -# prepare HTML versions of elements -info_html= -[ -n "${info}" ] && info_html=" <small><br/>${info}</small>" - -raised_for_html= -[ -n "${raised_for}" ] && raised_for_html="<br/><small>${raised_for}</small>" - -# ----------------------------------------------------------------------------- -# send the slack notification - -# slack aggregates posts from the same username -# so we use "${host} ${status}" as the bot username, to make them diff - -send_slack "${SLACK_WEBHOOK_URL}" "${to_slack}" -SENT_SLACK=$? - -# ----------------------------------------------------------------------------- -# send the Microsoft Teams notification - -# Microsoft teams aggregates posts from the same username -# so we use "${host} ${status}" as the bot username, to make them diff - -send_msteams "${MSTEAMS_WEBHOOK_URL}" "${to_msteams}" -SENT_MSTEAMS=$? - -# ----------------------------------------------------------------------------- -# send the rocketchat notification - -# rocketchat aggregates posts from the same username -# so we use "${host} ${status}" as the bot username, to make them diff - -send_rocketchat "${ROCKETCHAT_WEBHOOK_URL}" "${to_rocketchat}" -SENT_ROCKETCHAT=$? - -# ----------------------------------------------------------------------------- -# send the alerta notification - -# alerta aggregates posts from the same username -# so we use "${host} ${status}" as the bot username, to make them diff - -send_alerta "${ALERTA_WEBHOOK_URL}" "${to_alerta}" -SENT_ALERTA=$? - -# ----------------------------------------------------------------------------- -# send the flock notification - -# flock aggregates posts from the same username -# so we use "${host} ${status}" as the bot username, to make them diff - -send_flock "${FLOCK_WEBHOOK_URL}" "${to_flock}" -SENT_FLOCK=$? - -# ----------------------------------------------------------------------------- -# send the discord notification - -# discord aggregates posts from the same username -# so we use "${host} ${status}" as the bot username, to make them diff - -send_discord "${DISCORD_WEBHOOK_URL}" "${to_discord}" -SENT_DISCORD=$? - -# ----------------------------------------------------------------------------- -# send the pushover notification - -send_pushover "${PUSHOVER_APP_TOKEN}" "${to_pushover}" "${when}" "${goto_url}" "${status}" "${host} ${status_message} - ${name//_/ } - ${chart}" " -<font color=\"${color}\"><b>${alarm}</b></font>${info_html}<br/> -<small><b>${chart}</b><br/>Chart<br/> </small> -<small><b>${severity}</b><br/>Severity<br/> </small> -<small><b>${date}${raised_for_html}</b><br/>Time<br/> </small> -<a href=\"${goto_url}\">View Netdata</a><br/> -<small><small>The source of this alarm is line ${src}</small></small> -" - -SENT_PUSHOVER=$? - -# ----------------------------------------------------------------------------- -# send the pushbullet notification - -send_pushbullet "${PUSHBULLET_ACCESS_TOKEN}" "${PUSHBULLET_SOURCE_DEVICE}" "${to_pushbullet}" "${goto_url}" "${host} ${status_message} - ${name//_/ } - ${chart}" "${alarm}\\n -Severity: ${severity}\\n -Chart: ${chart}\\n -${date}\\n -The source of this alarm is line ${src}" - -SENT_PUSHBULLET=$? - -# ----------------------------------------------------------------------------- -# send the twilio SMS - -send_twilio "${TWILIO_ACCOUNT_SID}" "${TWILIO_ACCOUNT_TOKEN}" "${TWILIO_NUMBER}" "${to_twilio}" "${host} ${status_message} - ${name//_/ } - ${chart}" "${alarm} -Severity: ${severity} -Chart: ${chart} -${info}" - -SENT_TWILIO=$? - -# ----------------------------------------------------------------------------- -# send the messagebird SMS - -send_messagebird "${MESSAGEBIRD_ACCESS_KEY}" "${MESSAGEBIRD_NUMBER}" "${to_messagebird}" "${host} ${status_message} - ${name//_/ } - ${chart}" "${alarm} -Severity: ${severity} -Chart: ${chart} -${info}" - -SENT_MESSAGEBIRD=$? - -# ----------------------------------------------------------------------------- -# send the kavenegar SMS - -send_kavenegar "${KAVENEGAR_API_KEY}" "${KAVENEGAR_SENDER}" "${to_kavenegar}" "${host} ${status_message} - ${name//_/ } - ${chart}" "${alarm} -Severity: ${severity} -Chart: ${chart} -${info}" - -SENT_KAVENEGAR=$? - -# ----------------------------------------------------------------------------- -# send the telegram.org message - -# https://core.telegram.org/bots/api#formatting-options -send_telegram "${TELEGRAM_BOT_TOKEN}" "${to_telegram}" "${host} ${status_message} - <b>${name//_/ }</b> -${chart} -<a href=\"${goto_url}\">${alarm}</a> -<i>${info}</i>" - -SENT_TELEGRAM=$? - -# ----------------------------------------------------------------------------- -# send the kafka message - -send_kafka -SENT_KAFKA=$? - -# ----------------------------------------------------------------------------- -# send the pagerduty.com message - -send_pd "${to_pd}" -SENT_PD=$? - -# ----------------------------------------------------------------------------- -# send the fleep message - -send_fleep "${to_fleep}" -SENT_FLEEP=$? - -# ----------------------------------------------------------------------------- -# send the Prowl message - -send_prowl "${to_prowl}" -SENT_PROWL=$? - -# ----------------------------------------------------------------------------- -# send the irc message - -send_irc "${IRC_NICKNAME}" "${IRC_REALNAME}" "${to_irc}" "${IRC_NETWORK}" "${IRC_PORT}" "${host}" "${host} ${status_message} - ${name//_/ } - ${chart} ----- ${alarm} -Severity: ${severity} -Chart: ${chart} -${info}" - -SENT_IRC=$? - -# ----------------------------------------------------------------------------- -# send the SMS message with smstools3 - -send_sms "${to_sms}" - -SENT_SMS=$? - -# ----------------------------------------------------------------------------- -# send the custom message - -send_custom() { - # is it enabled? - [ "${SEND_CUSTOM}" != "YES" ] && return 1 - - # do we have any sender? - [ -z "${1}" ] && return 1 - - # call the custom_sender function - custom_sender "${@}" -} - -send_custom "${to_custom}" -SENT_CUSTOM=$? - -# ----------------------------------------------------------------------------- -# send hipchat message - -send_hipchat "${HIPCHAT_AUTH_TOKEN}" "${to_hipchat}" " \ -${host} ${status_message}<br/> \ -<b>${alarm}</b> ${info_html}<br/> \ -<b>${chart}</b><br/> \ -<b>${date}${raised_for_html}</b><br/> \ -<a href=\\\"${goto_url}\\\">View netdata dashboard</a> \ -(source of alarm ${src}) \ -" - -SENT_HIPCHAT=$? - -# ----------------------------------------------------------------------------- -# send the Amazon SNS message - -send_awssns "${to_awssns}" - -SENT_AWSSNS=$? - -# ----------------------------------------------------------------------------- -# send the Matrix message -send_matrix "${MATRIX_HOMESERVER}" "${to_matrix}" - -SENT_MATRIX=$? - - -# ----------------------------------------------------------------------------- -# send the syslog message - -send_syslog "${to_syslog}" - -SENT_SYSLOG=$? - -# ----------------------------------------------------------------------------- -# send the email - -IFS='' read -r -d '' email_plaintext_part <<EOF -Content-Type: text/plain; encoding=${EMAIL_CHARSET} -Content-Disposition: inline -Content-Transfer-Encoding: 8bit - -${host} ${status_message} - -${alarm} ${info} -${raised_for} - -Chart : ${chart} -Severity: ${severity} -URL : ${goto_url} -Source : ${src} -Date : ${date} -Notification generated on ${host} - -Evaluated Expression : ${calc_expression} -Expression Variables : ${calc_param_values} - -The host has ${total_warnings} WARNING and ${total_critical} CRITICAL alarm(s) raised. -EOF - -if [[ "${EMAIL_PLAINTEXT_ONLY}" == "YES" ]]; then - -send_email <<EOF -To: ${to_email} -Subject: ${host} ${status_message} - ${name//_/ } - ${chart} -MIME-Version: 1.0 -Content-Type: multipart/alternative; boundary="multipart-boundary" -${email_thread_headers} -X-Netdata-Severity: ${status,,} -X-Netdata-Alert-Name: $name -X-Netdata-Chart: $chart -X-Netdata-Classification: $classification -X-Netdata-Host: $host -X-Netdata-Role: $roles - -This is a MIME-encoded multipart message - ---multipart-boundary -${email_plaintext_part} ---multipart-boundary-- -EOF - -else - -now=$(date "+%s") - -if [ -n "$total_warn_alarms" ]; then - while read -d, -r pair; do - IFS='=' read -r key val <<<"$pair" - - date_w=$(date --date=@${val} "${date_format}" 2>/dev/null) - [ -z "${date_w}" ] && date_w=$(date "${date_format}" 2>/dev/null) - [ -z "${date_w}" ] && date_w=$(date --date=@${val} 2>/dev/null) - [ -z "${date_w}" ] && date_w=$(date 2>/dev/null) - - elapsed=$((now - val)) - - duration4human ${elapsed} >/dev/null - elapsed_txt="${REPLY}" - - WARN_ALARMS+=" - <div class=\"set-font\" style=\"font-family: 'IBM Plex Sans', sans-serif; background: #FFFFFF; background-color: #FFFFFF; margin: 0px auto; max-width: 600px;\"> - <table align=\"center\" border=\"0\" cellpadding=\"0\" cellspacing=\"0\" role=\"presentation\" style=\"background:#FFFFFF;background-color:#FFFFFF;width:100%;\"> - <tbody> - <tr> - <td style=\"border-top:8px solid #F7F8F8;direction:ltr;font-size:0px;padding:20px 0;text-align:center;\"> - <!--[if mso | IE]><table role=\"presentation\" border=\"0\" cellpadding=\"0\" cellspacing=\"0\"><tr><td class=\"\" style=\"vertical-align:top;width:300px;\" ><![endif]--> - <div class=\"mj-column-per-50 mj-outlook-group-fix\" style=\"font-size:0px;text-align:left;direction:ltr;display:inline-block;vertical-align:top;width:50%;\"> - <table border=\"0\" cellpadding=\"0\" cellspacing=\"0\" role=\"presentation\" style=\"vertical-align:top;\" width=\"100%\"> - <tbody> - <tr> - <td align=\"left\" style=\"font-size:0px;padding:10px 25px;word-break:break-word;\"> - <div style=\"font-family:Open Sans, sans-serif;font-size:14px;font-weight:600;line-height:1;text-align:left;color:#35414A;\">${key}</div> - </td> - </tr> - <tr> - <td align=\"left\" style=\"font-size:0px;padding:10px 25px;padding-top:2px;word-break:break-word;\"> - <div style=\"font-family:Open Sans, sans-serif;font-size:12px;line-height:1;text-align:left;color:#35414A;\">${date_w}</div> - </td> - </tr> - </tbody> - </table> - </div> - <!--[if mso | IE]></td><td class=\"\" style=\"vertical-align:top;width:300px;\" ><![endif]--> - <div class=\"mj-column-per-50 mj-outlook-group-fix\" style=\"font-size:0px;text-align:left;direction:ltr;display:inline-block;vertical-align:top;width:50%;\"> - <table border=\"0\" cellpadding=\"0\" cellspacing=\"0\" role=\"presentation\" width=\"100%\"> - <tbody> - <tr> - <td style=\"vertical-align:top;padding-top:13px;\"> - <table border=\"0\" cellpadding=\"0\" cellspacing=\"0\" role=\"presentation\" style width=\"100%\"> - <tbody> - <tr> - <td align=\"right\" style=\"font-size:0px;padding:10px 25px;word-break:break-word;\"> - <div style=\"font-family:Open Sans, sans-serif;font-size:13px;line-height:1;text-align:right;color:#555555;\"><span style=\"background-color:#FFF8E1; border: 1px solid #FFC300; border-radius:36px; padding: 2px 12px; margin-top: 20px; white-space: nowrap\"> - Warning for ${elapsed_txt} - </span></div> - </td> - </tr> - </tbody> - </table> - </td> - </tr> - </tbody> - </table> - </div> - <!--[if mso | IE]></td></tr></table><![endif]--> - </td> - </tr> - </tbody> - </table> - </div> - " - - done <<<"$total_warn_alarms," -fi - -if [ -n "$total_crit_alarms" ]; then - while read -d, -r pair; do - IFS='=' read -r key val <<<"$pair" - - date_c=$(date --date=@${val} "${date_format}" 2>/dev/null) - [ -z "${date_c}" ] && date_c=$(date "${date_format}" 2>/dev/null) - [ -z "${date_c}" ] && date_c=$(date --date=@${val} 2>/dev/null) - [ -z "${date_c}" ] && date_c=$(date 2>/dev/null) - - elapsed=$((now - val)) - - duration4human ${elapsed} >/dev/null - elapsed_txt="${REPLY}" - - CRIT_ALARMS+=" - <div class=\"set-font\" style=\"font-family: 'IBM Plex Sans', sans-serif; background: #FFFFFF; background-color: #FFFFFF; margin: 0px auto; max-width: 600px;\"> - <table align=\"center\" border=\"0\" cellpadding=\"0\" cellspacing=\"0\" role=\"presentation\" style=\"background:#FFFFFF;background-color:#FFFFFF;width:100%;\"> - <tbody> - <tr> - <td style=\"border-top:8px solid #F7F8F8;direction:ltr;font-size:0px;padding:20px 0;text-align:center;\"> - <!--[if mso | IE]><table role=\"presentation\" border=\"0\" cellpadding=\"0\" cellspacing=\"0\"><tr><td class=\"\" style=\"vertical-align:top;width:300px;\" ><![endif]--> - <div class=\"mj-column-per-50 mj-outlook-group-fix\" style=\"font-size:0px;text-align:left;direction:ltr;display:inline-block;vertical-align:top;width:50%;\"> - <table border=\"0\" cellpadding=\"0\" cellspacing=\"0\" role=\"presentation\" style=\"vertical-align:top;\" width=\"100%\"> - <tbody> - <tr> - <td align=\"left\" style=\"font-size:0px;padding:10px 25px;word-break:break-word;\"> - <div style=\"font-family:Open Sans, sans-serif;font-size:14px;font-weight:600;line-height:1;text-align:left;color:#35414A;\">${key}</div> - </td> - </tr> - <tr> - <td align=\"left\" style=\"font-size:0px;padding:10px 25px;padding-top:2px;word-break:break-word;\"> - <div style=\"font-family:Open Sans, sans-serif;font-size:12px;line-height:1;text-align:left;color:#35414A;\">${date_c}</div> - </td> - </tr> - </tbody> - </table> - </div> - <!--[if mso | IE]></td><td class=\"\" style=\"vertical-align:top;width:300px;\" ><![endif]--> - <div class=\"mj-column-per-50 mj-outlook-group-fix\" style=\"font-size:0px;text-align:left;direction:ltr;display:inline-block;vertical-align:top;width:50%;\"> - <table border=\"0\" cellpadding=\"0\" cellspacing=\"0\" role=\"presentation\" width=\"100%\"> - <tbody> - <tr> - <td style=\"vertical-align:top;padding-top:13px;\"> - <table border=\"0\" cellpadding=\"0\" cellspacing=\"0\" role=\"presentation\" style width=\"100%\"> - <tbody> - <tr> - <td align=\"right\" style=\"font-size:0px;padding:10px 25px;word-break:break-word;\"> - <div style=\"font-family:Open Sans, sans-serif;font-size:13px;line-height:1;text-align:right;color:#35414A;\"><span style=\"background-color:#FFEBEF; border: 1px solid #FF4136; border-radius:36px; padding: 2px 12px; margin-top: 20px; white-space: nowrap\"> - Critical for ${elapsed_txt} - </span></div> - </td> - </tr> - </tbody> - </table> - </td> - </tr> - </tbody> - </table> - </div> - <!--[if mso | IE]></td></tr></table><![endif]--> - </td> - </tr> - </tbody> - </table> - </div> - " - - done <<<"$total_crit_alarms," -fi - -if (( total_warnings + total_critical > 15 )); then - EXTRA_ALARMS_LIST_TEXT="(Showing latest 15 alerts)" -fi - -if [ -n "$edit_command_line" ]; then - IFS='=' read -r edit_command line s_host <<<"$edit_command_line" -fi - -IFS='' read -r -d '' email_html_part <<EOF -Content-Type: text/html; encoding=${EMAIL_CHARSET} -Content-Disposition: inline -Content-Transfer-Encoding: 8bit - -<!doctype html> -<html xmlns="http://www.w3.org/1999/xhtml" xmlns:v="urn:schemas-microsoft-com:vml" xmlns:o="urn:schemas-microsoft-com:office:office"> -<head> - <title> - </title> - <!--[if !mso]><!--> - <meta http-equiv="X-UA-Compatible" content="IE=edge"> - <!--<![endif]--> - <meta http-equiv="Content-Type" content="text/html; charset=UTF-8"> - <meta name="viewport" content="width=device-width, initial-scale=1"> - <style type="text/css"> - #outlook a { padding:0; } - body { margin:0;padding:0;-webkit-text-size-adjust:100%;-ms-text-size-adjust:100%; } - table, td { border-collapse:collapse;mso-table-lspace:0pt;mso-table-rspace:0pt; } - img { border:0;height:auto;line-height:100%; outline:none;text-decoration:none;-ms-interpolation-mode:bicubic; } - p { display:block;margin:13px 0; } - </style> - <!--[if mso]> - <xml> - <o:OfficeDocumentSettings> - <o:AllowPNG/> - <o:PixelsPerInch>96</o:PixelsPerInch> - </o:OfficeDocumentSettings> - </xml> - <![endif]--> - <!--[if lte mso 11]> - <style type="text/css"> - .mj-outlook-group-fix { width:100% !important; } - </style> - <![endif]--> - <!--[if !mso]><!--> - <link href="https://fonts.googleapis.com/css2?family=Open+Sans:wght@300;400;500;600;700&display=swap" rel="stylesheet" type="text/css"> - <link href="https://fonts.googleapis.com/css?family=Ubuntu:300,400,500,700" rel="stylesheet" type="text/css"> - <style type="text/css"> - @import url(https://fonts.googleapis.com/css2?family=Open+Sans:wght@300;400;500;600;700&display=swap); - @import url(https://fonts.googleapis.com/css?family=Ubuntu:300,400,500,700); - </style> - <!--<![endif]--> - <style type="text/css"> - @media only screen and (min-width:100px) { - .mj-column-px-130 { width:130px !important; max-width: 130px; } - .mj-column-per-50 { width:50% !important; max-width: 50%; } - .mj-column-per-70 { width:70% !important; max-width: 70%; } - .mj-column-per-30 { width:30% !important; max-width: 30%; } - .mj-column-per-100 { width:100% !important; max-width: 100%; } - .mj-column-px-66 { width:66px !important; max-width: 66px; } - .mj-column-px-400 { width:400px !important; max-width: 400px; } - } - </style> - <style type="text/css"> - @media only screen and (max-width:100px) { - table.mj-full-width-mobile { width: 100% !important; } - td.mj-full-width-mobile { width: auto !important; } - } - </style> -</head> -<body style="word-spacing:normal;"> -<div class="svgbg" style="background-image: url('https://staging.netdata.cloud/static/email/img/isotype_600.png'); background-repeat: no-repeat; background-position: top center; background-size: 600px 192px;"> - <!--[if mso | IE]><table align="center" border="0" cellpadding="0" cellspacing="0" class="" style="width:600px;" width="600" ><tr><td style="line-height:0px;font-size:0px;mso-line-height-rule:exactly;"><![endif]--> - <div style="margin:0px auto;max-width:600px;"> - <table align="center" border="0" cellpadding="0" cellspacing="0" role="presentation" style="width:100%;"> - <tbody> - <tr> - <td style="direction:ltr;font-size:0px;padding:20px 0;padding-bottom:50px;padding-left:0;text-align:left;"> - <!--[if mso | IE]><table role="presentation" border="0" cellpadding="0" cellspacing="0"><tr><td class="" style="vertical-align:top;width:130px;" ><![endif]--> - <div class="mj-column-px-130 mj-outlook-group-fix" style="font-size:0px;text-align:left;direction:ltr;display:inline-block;vertical-align:top;width:130px;"> - <table border="0" cellpadding="0" cellspacing="0" role="presentation" style="vertical-align:top;" width="100%"> - <tbody> - <tr> - <td align="center" style="font-size:0px;padding:10px 25px;padding-right:0;padding-left:0;word-break:break-word;"> - <table border="0" cellpadding="0" cellspacing="0" role="presentation" style="border-collapse:collapse;border-spacing:0px;"> - <tbody> - <tr> - <td style="width:130px;"> - <img alt="Netdata Logo" height="auto" src="https://app.netdata.cloud/static/email/img/full_logo.png" style="border:0;display:block;outline:none;text-decoration:none;height:auto;width:100%;font-size:13px;" width="130"> - </td> - </tr> - </tbody> - </table> - </td> - </tr> - </tbody> - </table> - </div> - <!--[if mso | IE]></td><td class="" style="vertical-align:top;width:300px;" ><![endif]--> - <div class="mj-column-per-50 mj-outlook-group-fix" style="font-size:0px;text-align:left;direction:ltr;display:inline-block;vertical-align:top;width:50%;"> - <table border="0" cellpadding="0" cellspacing="0" role="presentation" width="100%"> - <tbody> - <tr> - <td style="vertical-align:top;padding-top:4px;"> - <table border="0" cellpadding="0" cellspacing="0" role="presentation" style width="100%"> - <tbody> - <tr> - <td align="left" style="font-size:0px;padding:10px 25px;padding-left:10px;word-break:break-word;"> - <div style="font-family:Open Sans, sans-serif;font-size:16px;line-height:1;text-align:left;color:#35414A;">Notification</div> - </td> - </tr> - </tbody> - </table> - </td> - </tr> - </tbody> - </table> - </div> - <!--[if mso | IE]></td></tr></table><![endif]--> - </td> - </tr> - </tbody> - </table> - </div> - <!--[if mso | IE]></td></tr></table><table align="center" border="0" cellpadding="0" cellspacing="0" class="no-collapse-outlook" style="width:600px;" width="600" ><tr><td style="line-height:0px;font-size:0px;mso-line-height-rule:exactly;"><![endif]--> - <div class="no-collapse" style="border-collapse: initial; margin: 0px auto; border-radius: 4px; max-width: 600px;"> - <table align="center" border="0" cellpadding="0" cellspacing="0" role="presentation" style="width:100%;border-radius:4px;"> - <tbody> - <tr> - <td style="border:1px solid ${border_color};direction:ltr;font-size:0px;padding:20px 0;text-align:center;"> - <!--[if mso | IE]><table role="presentation" border="0" cellpadding="0" cellspacing="0"><tr><td class="set-font-outlook" width="600px" ><table align="center" border="0" cellpadding="0" cellspacing="0" class="set-font-outlook" style="width:598px;" width="598" ><tr><td style="line-height:0px;font-size:0px;mso-line-height-rule:exactly;"><![endif]--> - <div class="set-font" style="font-family: 'IBM Plex Sans', sans-serif; margin: 0px auto; max-width: 598px;"> - <table align="center" border="0" cellpadding="0" cellspacing="0" role="presentation" style="width:100%;"> - <tbody> - <tr> - <td style="direction:ltr;font-size:0px;padding:20px 0;padding-bottom:0;padding-top:0;text-align:center;"> - <!--[if mso | IE]><table role="presentation" border="0" cellpadding="0" cellspacing="0"><tr><td class="" style="vertical-align:top;width:418.6px;" ><![endif]--> - <div class="mj-column-per-70 mj-outlook-group-fix" style="font-size:0px;text-align:left;direction:ltr;display:inline-block;vertical-align:top;width:70%;"> - <table border="0" cellpadding="0" cellspacing="0" role="presentation" style="vertical-align:top;" width="100%"> - <tbody> - <tr> - <td align="left" style="font-size:0px;padding:10px 25px;padding-top:15px;word-break:break-word;"> - <div style="font-family:Open Sans, sans-serif;font-size:20px;font-weight:700;line-height:1;text-align:left;color:#35414A;">${summary}</div> - </td> - </tr> - </tbody> - </table> - </div> - <!--[if mso | IE]></td><td class="" style="vertical-align:top;width:179.4px;" ><![endif]--> - <div class="mj-column-per-30 mj-outlook-group-fix" style="font-size:0px;text-align:left;direction:ltr;display:inline-block;vertical-align:top;width:30%;"> - <table border="0" cellpadding="0" cellspacing="0" role="presentation" style="vertical-align:top;" width="100%"> - <tbody> - <tr> - <td align="right" style="font-size:0px;padding:10px 25px;padding-right:25px;word-break:break-word;"> - <table border="0" cellpadding="0" cellspacing="0" role="presentation" style="border-collapse:collapse;border-spacing:0px;"> - <tbody> - <tr> - <td style="width:100px;"> - <img height="auto" src="${alarm_badge}" style="border:0;display:block;outline:none;text-decoration:none;height:auto;width:100%;font-size:13px;" width="100"/> - </td> - </tr> - </tbody> - </table> - </td> - </tr> - </tbody> - </table> - </div> - <!--[if mso | IE]></td></tr></table><![endif]--> - </td> - </tr> - </tbody> - </table> - </div> - <!--[if mso | IE]></td></tr></table></td></tr><tr><td class="set-font-outlook" width="600px" ><table align="center" border="0" cellpadding="0" cellspacing="0" class="set-font-outlook" style="width:598px;" width="598" ><tr><td style="line-height:0px;font-size:0px;mso-line-height-rule:exactly;"><![endif]--> - <div class="set-font" style="font-family: 'IBM Plex Sans', sans-serif; margin: 0px auto; max-width: 598px;"> - <table align="center" border="0" cellpadding="0" cellspacing="0" role="presentation" style="width:100%;"> - <tbody> - <tr> - <td style="direction:ltr;font-size:0px;padding:0;text-align:center;"> - <!--[if mso | IE]><table role="presentation" border="0" cellpadding="0" cellspacing="0"><tr><td class="" style="vertical-align:top;width:598px;" ><![endif]--> - <div class="mj-column-per-100 mj-outlook-group-fix" style="font-size:0px;text-align:left;direction:ltr;display:inline-block;vertical-align:top;width:100%;"> - <table border="0" cellpadding="0" cellspacing="0" role="presentation" style="vertical-align:top;" width="100%"> - <tbody> - <tr> - <td align="left" style="font-size:0px;padding:10px 25px;padding-top:0;word-break:break-word;"> - <div style="font-family:IBM Plex Sans, sans-serif;font-size:16px;line-height:1;text-align:left;color:#35414A;">on ${host}</div> - </td> - </tr> - </tbody> - </table> - </div> - <!--[if mso | IE]></td></tr></table><![endif]--> - </td> - </tr> - </tbody> - </table> - </div> - <!--[if mso | IE]></td></tr></table></td></tr><tr><td class="set-font-outlook" width="600px" ><table align="center" border="0" cellpadding="0" cellspacing="0" class="set-font-outlook" style="width:598px;" width="598" ><tr><td style="line-height:0px;font-size:0px;mso-line-height-rule:exactly;"><![endif]--> - <div class="set-font" style="font-family: 'IBM Plex Sans', sans-serif; margin: 0px auto; max-width: 598px;"> - <table align="center" border="0" cellpadding="0" cellspacing="0" role="presentation" style="width:100%;"> - <tbody> - <tr> - <td style="direction:ltr;font-size:0px;padding:20px 0;text-align:center;"> - <!--[if mso | IE]><table role="presentation" border="0" cellpadding="0" cellspacing="0"><tr><td class="" style="vertical-align:top;width:598px;" ><![endif]--> - <div class="mj-column-per-100 mj-outlook-group-fix" style="font-size:0px;text-align:left;direction:ltr;display:inline-block;vertical-align:top;width:100%;"> - <table border="0" cellpadding="0" cellspacing="0" role="presentation" style="vertical-align:top;" width="100%"> - <tbody> - <tr> - <td align="left" style="font-size:0px;padding:10px 25px;padding-top:0;word-break:break-word;"> - <div style="font-family:Open Sans, sans-serif;font-size:26px;font-weight:700;line-height:1;text-align:left;color:#35414A;"><span style="color: ${text_color}; font-size:26px; background: ${background_color}; padding:4px 24px; border-radius: 36px">${value_string} - </span></div> - </td> - </tr> - </tbody> - </table> - </div> - <!--[if mso | IE]></td></tr></table><![endif]--> - </td> - </tr> - </tbody> - </table> - </div> - <!--[if mso | IE]></td></tr></table></td></tr><tr><td class="set-font-outlook" width="600px" ><table align="center" border="0" cellpadding="0" cellspacing="0" class="set-font-outlook" style="width:598px;" width="598" ><tr><td style="line-height:0px;font-size:0px;mso-line-height-rule:exactly;"><![endif]--> - <div class="set-font" style="font-family: 'IBM Plex Sans', sans-serif; margin: 0px auto; max-width: 598px;"> - <table align="center" border="0" cellpadding="0" cellspacing="0" role="presentation" style="width:100%;"> - <tbody> - <tr> - <td style="direction:ltr;font-size:0px;padding:20px 0;padding-bottom:0;padding-top:0;text-align:center;"> - <!--[if mso | IE]><table role="presentation" border="0" cellpadding="0" cellspacing="0"><tr><td class="" style="vertical-align:top;width:598px;" ><![endif]--> - <div class="mj-column-per-100 mj-outlook-group-fix" style="font-size:0px;text-align:left;direction:ltr;display:inline-block;vertical-align:top;width:100%;"> - <table border="0" cellpadding="0" cellspacing="0" role="presentation" style="vertical-align:top;" width="100%"> - <tbody> - <tr> - <td align="left" style="font-size:0px;padding:10px 25px;padding-top:0;word-break:break-word;"> - <div style="font-family:Open Sans, sans-serif;font-size:16px;line-height:21px;text-align:left;color:#35414A;">Details: ${info}</div> - </td> - </tr> - </tbody> - </table> - </div> - <!--[if mso | IE]></td></tr></table><![endif]--> - </td> - </tr> - </tbody> - </table> - </div> - <!--[if mso | IE]></td></tr></table></td></tr><tr><td class="set-font-outlook" width="600px" ><table align="center" border="0" cellpadding="0" cellspacing="0" class="set-font-outlook" style="width:598px;" width="598" ><tr><td style="line-height:0px;font-size:0px;mso-line-height-rule:exactly;"><![endif]--> - <div class="set-font" style="font-family: 'IBM Plex Sans', sans-serif; margin: 0px auto; max-width: 598px;"> - <table align="center" border="0" cellpadding="0" cellspacing="0" role="presentation" style="width:100%;"> - <tbody> - <tr> - <td style="direction:ltr;font-size:0px;padding:20px 0;padding-bottom:0;padding-top:0;text-align:center;"> - <!--[if mso | IE]><table role="presentation" border="0" cellpadding="0" cellspacing="0"><tr><td class="" style="vertical-align:top;width:598px;" ><![endif]--> - <div class="mj-column-per-100 mj-outlook-group-fix" style="font-size:0px;text-align:left;direction:ltr;display:inline-block;vertical-align:top;width:100%;"> - <table border="0" cellpadding="0" cellspacing="0" role="presentation" style="vertical-align:top;" width="100%"> - <tbody> - <tr> - <td align="center" vertical-align="middle" style="font-size:0px;padding:10px 25px;word-break:break-word;"> - <table border="0" cellpadding="0" cellspacing="0" role="presentation" style="border-collapse:separate;width:100%;line-height:100%;"> - <tr> - <td - align="center" bgcolor="${border_color}" role="presentation" style="border:none;border-radius:3px;cursor:auto;height:44px;background:${border_color};" valign="middle"> - <p style="display:block;background:${border_color};color:#ffffff;font-size:13px;font-weight:600;line-height:44px;margin:0;text-decoration:none;text-transform:none;mso-padding-alt:0px;border-radius:3px;"> - <a href="${goto_url}" style="color: ${action_text_color}; text-decoration: none; width: 100%; display: inline-block">GO TO CHART</a> - </p> - </td> - </tr> - </table> - </td> - </tr> - </tbody> - </table> - </div> - <!--[if mso | IE]></td></tr></table><![endif]--> - </td> - </tr> - </tbody> - </table> - </div> - <!--[if mso | IE]></td></tr></table></td></tr></table><![endif]--> - </td> - </tr> - </tbody> - </table> - </div> - <!--[if mso | IE]></td></tr></table><![endif]--> - <div style="height:32px;line-height:32px;"> </div> - <!--[if mso | IE]><table align="center" border="0" cellpadding="0" cellspacing="0" class="set-font-outlook" style="width:600px;" width="600" ><tr><td style="line-height:0px;font-size:0px;mso-line-height-rule:exactly;"><![endif]--> - <div class="set-font" style="font-family: 'IBM Plex Sans', sans-serif; background: ${background_color}; background-color: ${background_color}; margin: 0px auto; border-radius: 4px; max-width: 600px;"> - <table align="center" border="0" cellpadding="0" cellspacing="0" role="presentation" style="background:${background_color};background-color:${background_color};width:100%;border-radius:4px;"> - <tbody> - <tr> - <td style="direction:ltr;font-size:0px;padding:20px 0;text-align:center;"> - <!--[if mso | IE]><table role="presentation" border="0" cellpadding="0" cellspacing="0"><tr><td class="" style="vertical-align:top;width:600px;" ><![endif]--> - <div class="mj-column-per-100 mj-outlook-group-fix" style="font-size:0px;text-align:left;direction:ltr;display:inline-block;vertical-align:top;width:100%;"> - <table border="0" cellpadding="0" cellspacing="0" role="presentation" style="vertical-align:top;" width="100%"> - <tbody> - <tr> - <td align="left" style="font-size:0px;padding:10px 25px;padding-bottom:6px;word-break:break-word;"> - <div style="font-family:Open Sans, sans-serif;font-size:18px;line-height:1;text-align:left;color:#35414A;">Alert: - <span style="font-weight:700; font-size:20px">${name}</span></div> - </td> - </tr> - <tr> - <td align="left" style="font-size:0px;padding:10px 25px;padding-top:0;word-break:break-word;"> - <div style="font-family:Open Sans, sans-serif;font-size:18px;line-height:1;text-align:left;color:#35414A;">Chart: - <span style="font-weight:700; font-size:20px">${chart}</span></div> - </td> - </tr> - <tr> - <td align="left" style="font-size:0px;padding:10px 25px;padding-top:4px;word-break:break-word;"> - <div style="font-family:Open Sans, sans-serif;font-size:14px;line-height:1;text-align:left;color:#35414A;">${rich_status_raised_for}</div> - </td> - </tr> - <tr> - <td align="center" style="font-size:0px;padding:10px 25px;word-break:break-word;"> - <p style="border-top:solid 1px lightgrey;font-size:1px;margin:0px auto;width:100%;"> - </p> - <!--[if mso | IE]><table align="center" border="0" cellpadding="0" cellspacing="0" style="border-top:solid 1px lightgrey;font-size:1px;margin:0px auto;width:550px;" role="presentation" width="550px" ><tr><td style="height:0;line-height:0;"> - </td></tr></table><![endif]--> - </td> - </tr> - <tr> - <td align="left" style="font-size:0px;padding:10px 25px;padding-bottom:6px;word-break:break-word;"> - <div style="font-family:Open Sans, sans-serif;font-size:16px;line-height:1;text-align:left;color:#35414A;">On - <span style="font-weight:600">${date}</span></div> - </td> - </tr> - <tr> - <td align="left" style="font-size:0px;padding:10px 25px;padding-top:0;word-break:break-word;"> - <div style="font-family:Open Sans, sans-serif;font-size:16px;line-height:1;text-align:left;color:#35414A;">By: - <span style="font-weight:600">${host}</span></div> - </td> - </tr> - <tr> - <td align="left" style="font-size:0px;padding:10px 25px;padding-top:4px;word-break:break-word;"> - <div style="font-family:Open Sans, sans-serif;font-size:14px;line-height:1;text-align:left;color:#35414A;">Global time: - <span style="font-weight:600">${date_utc}</span></div> - </td> - </tr> - <tr> - <td align="center" style="font-size:0px;padding:10px 25px;word-break:break-word;"> - <p style="border-top:solid 1px lightgrey;font-size:1px;margin:0px auto;width:100%;"> - </p> - <!--[if mso | IE]><table align="center" border="0" cellpadding="0" cellspacing="0" style="border-top:solid 1px lightgrey;font-size:1px;margin:0px auto;width:550px;" role="presentation" width="550px" ><tr><td style="height:0;line-height:0;"> - </td></tr></table><![endif]--> - </td> - </tr> - <tr> - <td align="left" style="font-size:0px;padding:10px 25px;padding-bottom:6px;word-break:break-word;"> - <div style="font-family:Open Sans, sans-serif;font-size:16px;line-height:1;text-align:left;color:#35414A;">Classification: - <span style="font-weight:600">${classification}</span></div> - </td> - </tr> - <tr> - <td align="left" style="font-size:0px;padding:10px 25px;padding-top:0;word-break:break-word;"> - <div style="font-family:Open Sans, sans-serif;font-size:16px;line-height:1;text-align:left;color:#35414A;">Role: - <span style="font-weight:600">${roles}</span></div> - </td> - </tr> - </tbody> - </table> - </div> - <!--[if mso | IE]></td></tr></table><![endif]--> - </td> - </tr> - </tbody> - </table> - </div> - <!--[if mso | IE]></td></tr></table><table align="center" border="0" cellpadding="0" cellspacing="0" class="set-font-outlook" style="width:600px;" width="600" ><tr><td style="line-height:0px;font-size:0px;mso-line-height-rule:exactly;"><![endif]--> - <div class="set-font" style="font-family: 'IBM Plex Sans', sans-serif; margin: 0px auto; max-width: 600px;"> - <table align="center" border="0" cellpadding="0" cellspacing="0" role="presentation" style="width:100%;"> - <tbody> - <tr> - <td style="direction:ltr;font-size:0px;padding:20px 0;padding-left:25px;text-align:left;"> - <!--[if mso | IE]><table role="presentation" border="0" cellpadding="0" cellspacing="0"><tr><td class="" style="vertical-align:top;width:66px;" ><![endif]--> - <div class="mj-column-px-66 mj-outlook-group-fix" style="font-size:0px;text-align:left;direction:ltr;display:inline-block;vertical-align:top;width:66px;"> - <table border="0" cellpadding="0" cellspacing="0" role="presentation" width="100%"> - <tbody> - <tr> - <td style="vertical-align:top;padding:0;"> - <table border="0" cellpadding="0" cellspacing="0" role="presentation" style width="100%"> - <tbody> - <tr> - <td align="left" style="font-size:0px;padding:10px 25px;padding-right:0;padding-left:0;word-break:break-word;"> - <table border="0" cellpadding="0" cellspacing="0" role="presentation" style="border-collapse:collapse;border-spacing:0px;"> - <tbody> - <tr> - <td style="width:48px;"> - <img height="auto" src="https://app.netdata.cloud/static/email/img/community_icon.png" style="border:0;display:block;outline:none;text-decoration:none;height:auto;width:100%;font-size:13px;" width="48"> - </td> - </tr> - </tbody> - </table> - </td> - </tr> - </tbody> - </table> - </td> - </tr> - </tbody> - </table> - </div> - <!--[if mso | IE]></td><td align="left" class="" style="vertical-align:top;width:400px;" ><![endif]--> - <div class="mj-column-px-400 mj-outlook-group-fix" style="font-size:0px;text-align:left;direction:ltr;display:inline-block;vertical-align:top;width:400px;"> - <table border="0" cellpadding="0" cellspacing="0" role="presentation" width="100%"> - <tbody> - <tr> - <td style="vertical-align:top;padding-left:0;"> - <table border="0" cellpadding="0" cellspacing="0" role="presentation" style width="100%"> - <tbody> - <tr> - <td align="left" style="font-size:0px;padding:10px 25px;padding-left:0;word-break:break-word;"> - <div style="font-family:Open Sans, sans-serif;font-size:16px;font-weight:700;line-height:1;text-align:left;color:#35414A;">Want to know more about this alert?</div> - </td> - </tr> - <tr> - <td align="left" style="font-size:0px;padding:10px 25px;padding-left:0;word-break:break-word;"> - <div style="font-family:Open Sans, sans-serif;font-size:14px;line-height:1.3;text-align:left;color:#35414A;">Join the troubleshooting discussion for this alert on our <a href="https://community.netdata.cloud/t/${name//[._]/-}" class="link" style="color: #00AB44; text-decoration: none;">community forums</a>.</div> - </td> - </tr> - </tbody> - </table> - </td> - </tr> - </tbody> - </table> - </div> - <!--[if mso | IE]></td></tr></table><![endif]--> - </td> - </tr> - </tbody> - </table> - </div> - <!--[if mso | IE]></td></tr></table><table align="center" border="0" cellpadding="0" cellspacing="0" class="set-font-outlook" style="width:600px;" width="600" ><tr><td style="line-height:0px;font-size:0px;mso-line-height-rule:exactly;"><![endif]--> - <div class="set-font" style="font-family: 'IBM Plex Sans', sans-serif; margin: 0px auto; max-width: 600px;"> - <table align="center" border="0" cellpadding="0" cellspacing="0" role="presentation" style="width:100%;"> - <tbody> - <tr> - <td style="direction:ltr;font-size:0px;padding:20px 0;padding-left:25px;text-align:left;"> - <!--[if mso | IE]><table role="presentation" border="0" cellpadding="0" cellspacing="0"><tr><td class="" style="vertical-align:top;width:66px;" ><![endif]--> - <div class="mj-column-px-66 mj-outlook-group-fix" style="font-size:0px;text-align:left;direction:ltr;display:inline-block;vertical-align:top;width:66px;"> - <table border="0" cellpadding="0" cellspacing="0" role="presentation" width="100%"> - <tbody> - <tr> - <td style="vertical-align:top;padding:0;"> - <table border="0" cellpadding="0" cellspacing="0" role="presentation" style width="100%"> - <tbody> - <tr> - <td align="left" style="font-size:0px;padding:10px 25px;padding-right:0;padding-left:0;word-break:break-word;"> - <table border="0" cellpadding="0" cellspacing="0" role="presentation" style="border-collapse:collapse;border-spacing:0px;"> - <tbody> - <tr> - <td style="width:48px;"> - <img height="auto" src="https://app.netdata.cloud/static/email/img/configure_icon.png" style="border:0;display:block;outline:none;text-decoration:none;height:auto;width:100%;font-size:13px;" width="48"> - </td> - </tr> - </tbody> - </table> - </td> - </tr> - </tbody> - </table> - </td> - </tr> - </tbody> - </table> - </div> - <!--[if mso | IE]></td><td align="left" class="" style="vertical-align:top;width:400px;" ><![endif]--> - <div class="mj-column-px-400 mj-outlook-group-fix" style="font-size:0px;text-align:left;direction:ltr;display:inline-block;vertical-align:top;width:400px;"> - <table border="0" cellpadding="0" cellspacing="0" role="presentation" width="100%"> - <tbody> - <tr> - <td style="vertical-align:top;padding-left:0;"> - <table border="0" cellpadding="0" cellspacing="0" role="presentation" style width="100%"> - <tbody> - <tr> - <td align="left" style="font-size:0px;padding:10px 25px;padding-left:0;word-break:break-word;"> - <div style="font-family:Open Sans, sans-serif;font-size:16px;font-weight:700;line-height:1;text-align:left;color:#35414A;">Need to configure this alert?</div> - </td> - </tr> - <tr> - <td align="left" style="font-size:0px;padding:10px 25px;padding-left:0;word-break:break-word;"> - <div style="font-family:Open Sans, sans-serif;font-size:14px;line-height:1.3;text-align:left;color:#35414A;"><span style="color: #00AB44"><a href="https://learn.netdata.cloud/docs/agent/health/notifications#:~:text=To%20edit%20it%20on%20your,have%20one%20or%20more%20destinations" class="link" style="color: #00AB44; text-decoration: none;">Edit</a></span> this alert's configuration file by logging into $s_host and running the following command:</div> - </td> - </tr> - <tr> - <td align="left" style="font-size:0px;padding:10px 25px;padding-top:8px;padding-left:0;word-break:break-word;"> - <div style="font-family:Open Sans, sans-serif;font-size:12px;line-height:1.3;text-align:left;color:#35414A;">${edit_command} <br> - <br>The alarm to edit is at line ${line}</div> - </td> - </tr> - </tbody> - </table> - </td> - </tr> - </tbody> - </table> - </div> - <!--[if mso | IE]></td></tr></table><![endif]--> - </td> - </tr> - </tbody> - </table> - </div> - <!--[if mso | IE]></td></tr></table><table align="center" border="0" cellpadding="0" cellspacing="0" class="history-wrapper-outlook" style="width:600px;" width="600" ><tr><td style="line-height:0px;font-size:0px;mso-line-height-rule:exactly;"><![endif]--> - <div class="history-wrapper" style="background: #F7F8F8; background-color: #F7F8F8; margin: 0px auto; max-width: 100%;"> - <table align="center" border="0" cellpadding="0" cellspacing="0" role="presentation" style="background:#F7F8F8;background-color:#F7F8F8;width:100%;"> - <tbody> - <tr> - <td style="direction:ltr;font-size:0px;padding:0;padding-bottom:24px;text-align:center;"> - <!--[if mso | IE]><table role="presentation" border="0" cellpadding="0" cellspacing="0"><tr><td class="set-font-outlook" width="600px" ><table align="center" border="0" cellpadding="0" cellspacing="0" class="set-font-outlook" style="width:600px;" width="600" ><tr><td style="line-height:0px;font-size:0px;mso-line-height-rule:exactly;"><![endif]--> - <div class="set-font" style="font-family: 'IBM Plex Sans', sans-serif; margin: 0px auto; max-width: 600px;"> - <table align="center" border="0" cellpadding="0" cellspacing="0" role="presentation" style="width:100%;"> - <tbody> - <tr> - <td style="direction:ltr;font-size:0px;padding:20px 0;padding-bottom:12px;text-align:center;"> - <!--[if mso | IE]><table role="presentation" border="0" cellpadding="0" cellspacing="0"><tr><td class="" style="vertical-align:top;width:600px;" ><![endif]--> - <div class="mj-column-per-100 mj-outlook-group-fix" style="font-size:0px;text-align:left;direction:ltr;display:inline-block;vertical-align:top;width:100%;"> - <table border="0" cellpadding="0" cellspacing="0" role="presentation" style="vertical-align:top;" width="100%"> - <tbody> - <tr> - <td align="left" style="font-size:0px;padding:10px 25px;word-break:break-word;"> - <div style="font-family:Open Sans, sans-serif;font-size:16px;line-height:1;text-align:center;color:#35414A;">The node has - <span style="font-weight:600">${total_warnings} warning</span> - and - <span style="font-weight:600">${total_critical} critical</span> - additional active alert(s)</div> - </td> - </tr> - <td align="left" style="font-size:0px;padding:10px 25px;word-break:break-word;"> - <div style="font-family:Open Sans, sans-serif;font-size:12px;line-height:1;text-align:center;color:#35414A;">${EXTRA_ALARMS_LIST_TEXT}</div> - </td> - </tr> - </tbody> - </table> - </div> - <!--[if mso | IE]></td></tr></table><![endif]--> - </td> - </tr> - </tbody> - </table> - </div> - ${CRIT_ALARMS} - ${WARN_ALARMS} - <!--[if mso | IE]></td></tr></table></td></tr></table><![endif]--> - </td> - </tr> - </tbody> - </table> - </div> - <!--[if mso | IE]></td></tr></table><table align="center" border="0" cellpadding="0" cellspacing="0" class="set-font-outlook" style="width:600px;" width="600" ><tr><td style="line-height:0px;font-size:0px;mso-line-height-rule:exactly;"><![endif]--> - <div class="set-font" style="font-family: 'IBM Plex Sans', sans-serif; margin: 0px auto; max-width: 600px;"> - <table align="center" border="0" cellpadding="0" cellspacing="0" role="presentation" style="width:100%;"> - <tbody> - <tr> - <td style="direction:ltr;font-size:0px;padding:20px 0;text-align:center;"> - <!--[if mso | IE]><table role="presentation" border="0" cellpadding="0" cellspacing="0"><tr><td class="" style="vertical-align:top;width:600px;" ><![endif]--> - <div class="mj-column-per-100 mj-outlook-group-fix" style="font-size:0px;text-align:left;direction:ltr;display:inline-block;vertical-align:top;width:100%;"> - <table border="0" cellpadding="0" cellspacing="0" role="presentation" width="100%"> - <tbody> - <tr> - <td style="vertical-align:top;padding-top:44px;padding-bottom:12px;"> - <table border="0" cellpadding="0" cellspacing="0" role="presentation" style width="100%"> - <tbody> - <tr> - <td align="left" style="font-size:0px;padding:10px 25px;padding-top:0;padding-bottom:0;word-break:break-word;"> - <div style="font-family:Open Sans, sans-serif;font-size:13px;line-height:1;text-align:center;color:#35414A;">© Netdata $(date +'%Y') - The real-time performance and health monitoring</div> - </td> - </tr> - </tbody> - </table> - </td> - </tr> - </tbody> - </table> - </div> - <!--[if mso | IE]></td></tr></table><![endif]--> - </td> - </tr> - </tbody> - </table> - </div> - <!--[if mso | IE]></td></tr></table><![endif]--> -</div> -</body> -</html> -EOF - -send_email <<EOF -To: ${to_email} -Subject: ${html_email_subject} -MIME-Version: 1.0 -Content-Type: multipart/alternative; boundary="multipart-boundary" -${email_thread_headers} -X-Netdata-Severity: ${status,,} -X-Netdata-Alert-Name: $name -X-Netdata-Chart: $chart -X-Netdata-Classification: $classification -X-Netdata-Host: $host -X-Netdata-Role: $roles - -This is a MIME-encoded multipart message - ---multipart-boundary -${email_plaintext_part} ---multipart-boundary -${email_html_part} ---multipart-boundary-- -EOF - -fi - -SENT_EMAIL=$? - -# ----------------------------------------------------------------------------- -# send the EVENT to Dynatrace -send_dynatrace "${host}" "${chart}" "${name}" "${status}" -SENT_DYNATRACE=$? - -# ----------------------------------------------------------------------------- -# send messages to Opsgenie -send_opsgenie -SENT_OPSGENIE=$? - -# ----------------------------------------------------------------------------- -# send messages to Gotify -send_gotify -SENT_GOTIFY=$? - -# ----------------------------------------------------------------------------- -# send messages to ntfy -send_ntfy "${DEFAULT_RECIPIENT_NTFY}" -SENT_NTFY=$? - -# ----------------------------------------------------------------------------- -# let netdata know -for state in "${SENT_EMAIL}" \ - "${SENT_PUSHOVER}" \ - "${SENT_TELEGRAM}" \ - "${SENT_SLACK}" \ - "${SENT_ROCKETCHAT}" \ - "${SENT_ALERTA}" \ - "${SENT_FLOCK}" \ - "${SENT_DISCORD}" \ - "${SENT_TWILIO}" \ - "${SENT_HIPCHAT}" \ - "${SENT_MESSAGEBIRD}" \ - "${SENT_KAVENEGAR}" \ - "${SENT_PUSHBULLET}" \ - "${SENT_KAFKA}" \ - "${SENT_PD}" \ - "${SENT_FLEEP}" \ - "${SENT_PROWL}" \ - "${SENT_CUSTOM}" \ - "${SENT_IRC}" \ - "${SENT_AWSSNS}" \ - "${SENT_MATRIX}" \ - "${SENT_SYSLOG}" \ - "${SENT_SMS}" \ - "${SENT_MSTEAMS}" \ - "${SENT_DYNATRACE}" \ - "${SENT_OPSGENIE}" \ - "${SENT_GOTIFY}" \ - "${SENT_NTFY}"; do - if [ "${state}" -eq 0 ]; then - # we sent something - exit 0 - fi -done -# we did not send anything -exit 1 diff --git a/health/notifications/alarm-test.sh b/health/notifications/alarm-test.sh deleted file mode 100755 index 828aa756..00000000 --- a/health/notifications/alarm-test.sh +++ /dev/null @@ -1,12 +0,0 @@ -#!/usr/bin/env bash - -# netdata -# real-time performance and health monitoring, done right! -# (C) 2017 Costa Tsaousis <costa@tsaousis.gr> -# SPDX-License-Identifier: GPL-3.0-or-later -# -# Script to test alarm notifications for netdata - -dir="$(dirname "${0}")" -"${dir}/alarm-notify.sh" test "${1}" -exit $? diff --git a/health/notifications/alerta/Makefile.inc b/health/notifications/alerta/Makefile.inc deleted file mode 100644 index 10f26b0c..00000000 --- a/health/notifications/alerta/Makefile.inc +++ /dev/null @@ -1,12 +0,0 @@ -# SPDX-License-Identifier: GPL-3.0-or-later - -# THIS IS NOT A COMPLETE Makefile -# IT IS INCLUDED BY ITS PARENT'S Makefile.am -# IT IS REQUIRED TO REFERENCE ALL FILES RELATIVE TO THE PARENT - -# install these files -dist_noinst_DATA += \ - alerta/README.md \ - alerta/Makefile.inc \ - $(NULL) - diff --git a/health/notifications/alerta/README.md b/health/notifications/alerta/README.md deleted file mode 100644 index 02f9f45e..00000000 --- a/health/notifications/alerta/README.md +++ /dev/null @@ -1,128 +0,0 @@ -<!--startmeta -custom_edit_url: "https://github.com/netdata/netdata/edit/master/health/notifications/alerta/README.md" -meta_yaml: "https://github.com/netdata/netdata/edit/master/health/notifications/alerta/metadata.yaml" -sidebar_label: "Alerta" -learn_status: "Published" -learn_rel_path: "Alerting/Notifications/Agent Dispatched Notifications" -message: "DO NOT EDIT THIS FILE DIRECTLY, IT IS GENERATED BY THE NOTIFICATION'S metadata.yaml FILE" -endmeta--> - -# Alerta - - -<img src="https://netdata.cloud/img/alerta.png" width="150"/> - - -The [Alerta](https://alerta.io/) monitoring system is a tool used to consolidate and de-duplicate alerts from multiple sources for quick ‘at-a-glance’ visualization. With just one system you can monitor alerts from many other monitoring tools on a single screen. -You can send Netdata alerts to Alerta to see alerts coming from many Netdata hosts or also from a multi-host Netdata configuration. - - - -<img src="https://img.shields.io/badge/maintained%20by-Netdata-%2300ab44" /> - -## Setup - -### Prerequisites - -#### - -- A working Alerta instance -- An Alerta API key (if authentication in Alerta is enabled) -- Access to the terminal where Netdata Agent is running - - - -### Configuration - -#### File - -The configuration file name for this integration is `health_alarm_notify.conf`. - - -You can edit the configuration file using the `edit-config` script from the -Netdata [config directory](https://github.com/netdata/netdata/blob/master/docs/configure/nodes.md#the-netdata-config-directory). - -```bash -cd /etc/netdata 2>/dev/null || cd /opt/netdata/etc/netdata -sudo ./edit-config health_alarm_notify.conf -``` -#### Options - -The following options can be defined for this notification - -<details><summary>Config Options</summary> - -| Name | Description | Default | Required | -|:----|:-----------|:-------|:--------:| -| SEND_ALERTA | Set `SEND_ALERTA` to YES | | yes | -| ALERTA_WEBHOOK_URL | set `ALERTA_WEBHOOK_URL` to the API url you defined when you installed the Alerta server. | | yes | -| ALERTA_API_KEY | Set `ALERTA_API_KEY` to your API key. | | yes | -| DEFAULT_RECIPIENT_ALERTA | Set `DEFAULT_RECIPIENT_ALERTA` to the default recipient environment you want the alert notifications to be sent to. All roles will default to this variable if left unconfigured. | | yes | -| DEFAULT_RECIPIENT_CUSTOM | Set different recipient environments per role, by editing `DEFAULT_RECIPIENT_CUSTOM` with the environment name of your choice | | no | - -##### ALERTA_API_KEY - -You will need an API key to send messages from any source, if Alerta is configured to use authentication (recommended). To create a new API key: -1. Go to Configuration > API Keys. -2. Create a new API key called "netdata" with `write:alerts` permission. - - -##### DEFAULT_RECIPIENT_CUSTOM - -The `DEFAULT_RECIPIENT_CUSTOM` can be edited in the following entries at the bottom of the same file: - -```conf -role_recipients_alerta[sysadmin]="Systems" -role_recipients_alerta[domainadmin]="Domains" -role_recipients_alerta[dba]="Databases Systems" -role_recipients_alerta[webmaster]="Marketing Development" -role_recipients_alerta[proxyadmin]="Proxy" -role_recipients_alerta[sitemgr]="Sites" -``` - -The values you provide should be defined as environments in `/etc/alertad.conf` with `ALLOWED_ENVIRONMENTS` option. - - -</details> - -#### Examples - -##### Basic Configuration - - - -```yaml -#------------------------------------------------------------------------------ -# alerta (alerta.io) global notification options - -SEND_ALERTA="YES" -ALERTA_WEBHOOK_URL="http://yourserver/alerta/api" -ALERTA_API_KEY="INSERT_YOUR_API_KEY_HERE" -DEFAULT_RECIPIENT_ALERTA="Production" - -``` - - -## Troubleshooting - -### Test Notification - -You can run the following command by hand, to test alerts configuration: - -```bash -# become user netdata -sudo su -s /bin/bash netdata - -# enable debugging info on the console -export NETDATA_ALARM_NOTIFY_DEBUG=1 - -# send test alarms to sysadmin -/usr/libexec/netdata/plugins.d/alarm-notify.sh test - -# send test alarms to any role -/usr/libexec/netdata/plugins.d/alarm-notify.sh test "ROLE" -``` - -Note that this will test _all_ alert mechanisms for the selected role. - - diff --git a/health/notifications/alerta/metadata.yaml b/health/notifications/alerta/metadata.yaml deleted file mode 100644 index f815032b..00000000 --- a/health/notifications/alerta/metadata.yaml +++ /dev/null @@ -1,90 +0,0 @@ -# yamllint disable rule:line-length ---- -- id: 'notify-alerta' - meta: - name: 'Alerta' - link: 'https://alerta.io/' - categories: - - notify.agent - icon_filename: 'alerta.png' - keywords: - - Alerta - overview: - notification_description: | - The [Alerta](https://alerta.io/) monitoring system is a tool used to consolidate and de-duplicate alerts from multiple sources for quick ‘at-a-glance’ visualization. With just one system you can monitor alerts from many other monitoring tools on a single screen. - You can send Netdata alerts to Alerta to see alerts coming from many Netdata hosts or also from a multi-host Netdata configuration. - notification_limitations: '' - setup: - prerequisites: - list: - - title: '' - description: | - - A working Alerta instance - - An Alerta API key (if authentication in Alerta is enabled) - - Access to the terminal where Netdata Agent is running - configuration: - file: - name: 'health_alarm_notify.conf' - options: - description: 'The following options can be defined for this notification' - folding: - title: 'Config Options' - enabled: true - list: - - name: 'SEND_ALERTA' - default_value: '' - description: "Set `SEND_ALERTA` to YES" - required: true - - name: 'ALERTA_WEBHOOK_URL' - default_value: '' - description: "set `ALERTA_WEBHOOK_URL` to the API url you defined when you installed the Alerta server." - required: true - - name: 'ALERTA_API_KEY' - default_value: '' - description: "Set `ALERTA_API_KEY` to your API key." - required: true - detailed_description: | - You will need an API key to send messages from any source, if Alerta is configured to use authentication (recommended). To create a new API key: - 1. Go to Configuration > API Keys. - 2. Create a new API key called "netdata" with `write:alerts` permission. - - name: 'DEFAULT_RECIPIENT_ALERTA' - default_value: '' - description: "Set `DEFAULT_RECIPIENT_ALERTA` to the default recipient environment you want the alert notifications to be sent to. All roles will default to this variable if left unconfigured." - required: true - - name: 'DEFAULT_RECIPIENT_CUSTOM' - default_value: '' - description: "Set different recipient environments per role, by editing `DEFAULT_RECIPIENT_CUSTOM` with the environment name of your choice" - required: false - detailed_description: | - The `DEFAULT_RECIPIENT_CUSTOM` can be edited in the following entries at the bottom of the same file: - - ```conf - role_recipients_alerta[sysadmin]="Systems" - role_recipients_alerta[domainadmin]="Domains" - role_recipients_alerta[dba]="Databases Systems" - role_recipients_alerta[webmaster]="Marketing Development" - role_recipients_alerta[proxyadmin]="Proxy" - role_recipients_alerta[sitemgr]="Sites" - ``` - - The values you provide should be defined as environments in `/etc/alertad.conf` with `ALLOWED_ENVIRONMENTS` option. - examples: - folding: - enabled: true - title: '' - list: - - name: 'Basic Configuration' - folding: - enabled: false - description: '' - config: | - #------------------------------------------------------------------------------ - # alerta (alerta.io) global notification options - - SEND_ALERTA="YES" - ALERTA_WEBHOOK_URL="http://yourserver/alerta/api" - ALERTA_API_KEY="INSERT_YOUR_API_KEY_HERE" - DEFAULT_RECIPIENT_ALERTA="Production" - troubleshooting: - problems: - list: [] diff --git a/health/notifications/awssns/Makefile.inc b/health/notifications/awssns/Makefile.inc deleted file mode 100644 index ee86f4bc..00000000 --- a/health/notifications/awssns/Makefile.inc +++ /dev/null @@ -1,12 +0,0 @@ -# SPDX-License-Identifier: GPL-3.0-or-later - -# THIS IS NOT A COMPLETE Makefile -# IT IS INCLUDED BY ITS PARENT'S Makefile.am -# IT IS REQUIRED TO REFERENCE ALL FILES RELATIVE TO THE PARENT - -# install these files -dist_noinst_DATA += \ - awssns/README.md \ - awssns/Makefile.inc \ - $(NULL) - diff --git a/health/notifications/awssns/README.md b/health/notifications/awssns/README.md deleted file mode 100644 index bcf52293..00000000 --- a/health/notifications/awssns/README.md +++ /dev/null @@ -1,180 +0,0 @@ -<!--startmeta -custom_edit_url: "https://github.com/netdata/netdata/edit/master/health/notifications/awssns/README.md" -meta_yaml: "https://github.com/netdata/netdata/edit/master/health/notifications/awssns/metadata.yaml" -sidebar_label: "AWS SNS" -learn_status: "Published" -learn_rel_path: "Alerting/Notifications/Agent Dispatched Notifications" -message: "DO NOT EDIT THIS FILE DIRECTLY, IT IS GENERATED BY THE NOTIFICATION'S metadata.yaml FILE" -endmeta--> - -# AWS SNS - - -<img src="https://netdata.cloud/img/aws.svg" width="150"/> - - -As part of its AWS suite, Amazon provides a notification broker service called 'Simple Notification Service' (SNS). Amazon SNS works similarly to Netdata's own notification system, allowing to dispatch a single notification to multiple subscribers of different types. Among other things, SNS supports sending notifications to: -- Email addresses -- Mobile Phones via SMS -- HTTP or HTTPS web hooks -- AWS Lambda functions -- AWS SQS queues -- Mobile applications via push notifications -You can send notifications through Amazon SNS using Netdata's Agent alert notification feature, which supports dozens of endpoints, user roles, and more. - - -<img src="https://img.shields.io/badge/maintained%20by-Netdata-%2300ab44" /> - -## Limitations - -- While Amazon SNS supports sending differently formatted messages for different delivery methods, Netdata does not currently support this functionality. -- For email notification support, we recommend using Netdata's email notifications, as it is has the following benefits: - - In most cases, it requires less configuration. - - Netdata's emails are nicely pre-formatted and support features like threading, which requires a lot of manual effort in SNS. - - It is less resource intensive and more cost-efficient than SNS. - - - -## Setup - -### Prerequisites - -#### - -- The [Amazon Web Services CLI tools](https://docs.aws.amazon.com/cli/latest/userguide/getting-started-install.html) (awscli). -- An actual home directory for the user you run Netdata as, instead of just using `/` as a home directory. The setup depends on the distribution, but `/var/lib/netdata` is the recommended directory. If you are using Netdata as a dedicated user, the permissions will already be correct. -- An Amazon SNS topic to send notifications to with one or more subscribers. The Getting Started section of the Amazon SNS documentation covers the basics of how to set this up. Make note of the Topic ARN when you create the topic. -- While not mandatory, it is highly recommended to create a dedicated IAM user on your account for Netdata to send notifications. This user needs to have programmatic access, and should only allow access to SNS. For an additional layer of security, you can create one for each system or group of systems. -- Terminal access to the Agent you wish to configure. - - - -### Configuration - -#### File - -The configuration file name for this integration is `health_alarm_notify.conf`. - - -You can edit the configuration file using the `edit-config` script from the -Netdata [config directory](https://github.com/netdata/netdata/blob/master/docs/configure/nodes.md#the-netdata-config-directory). - -```bash -cd /etc/netdata 2>/dev/null || cd /opt/netdata/etc/netdata -sudo ./edit-config health_alarm_notify.conf -``` -#### Options - -The following options can be defined for this notification - -<details><summary>Config Options</summary> - -| Name | Description | Default | Required | -|:----|:-----------|:-------|:--------:| -| aws path | The full path of the aws command. If empty, the system `$PATH` will be searched for it. If not found, Amazon SNS notifications will be silently disabled. | | yes | -| SEND_AWSNS | Set `SEND_AWSNS` to YES | YES | yes | -| AWSSNS_MESSAGE_FORMAT | Set `AWSSNS_MESSAGE_FORMAT` to to the string that you want the alert to be sent into. | ${status} on ${host} at ${date}: ${chart} ${value_string} | yes | -| DEFAULT_RECIPIENT_AWSSNS | Set `DEFAULT_RECIPIENT_AWSSNS` to the Topic ARN you noted down upon creating the Topic. | | yes | - -##### AWSSNS_MESSAGE_FORMAT - -The supported variables are: - -| Variable name | Description | -|:---------------------------:|:---------------------------------------------------------------------------------| -| `${alarm}` | Like "name = value units" | -| `${status_message}` | Like "needs attention", "recovered", "is critical" | -| `${severity}` | Like "Escalated to CRITICAL", "Recovered from WARNING" | -| `${raised_for}` | Like "(alarm was raised for 10 minutes)" | -| `${host}` | The host generated this event | -| `${url_host}` | Same as ${host} but URL encoded | -| `${unique_id}` | The unique id of this event | -| `${alarm_id}` | The unique id of the alarm that generated this event | -| `${event_id}` | The incremental id of the event, for this alarm id | -| `${when}` | The timestamp this event occurred | -| `${name}` | The name of the alarm, as given in netdata health.d entries | -| `${url_name}` | Same as ${name} but URL encoded | -| `${chart}` | The name of the chart (type.id) | -| `${url_chart}` | Same as ${chart} but URL encoded | -| `${status}` | The current status : REMOVED, UNINITIALIZED, UNDEFINED, CLEAR, WARNING, CRITICAL | -| `${old_status}` | The previous status: REMOVED, UNINITIALIZED, UNDEFINED, CLEAR, WARNING, CRITICAL | -| `${value}` | The current value of the alarm | -| `${old_value}` | The previous value of the alarm | -| `${src}` | The line number and file the alarm has been configured | -| `${duration}` | The duration in seconds of the previous alarm state | -| `${duration_txt}` | Same as ${duration} for humans | -| `${non_clear_duration}` | The total duration in seconds this is/was non-clear | -| `${non_clear_duration_txt}` | Same as ${non_clear_duration} for humans | -| `${units}` | The units of the value | -| `${info}` | A short description of the alarm | -| `${value_string}` | Friendly value (with units) | -| `${old_value_string}` | Friendly old value (with units) | -| `${image}` | The URL of an image to represent the status of the alarm | -| `${color}` | A color in AABBCC format for the alarm | -| `${goto_url}` | The URL the user can click to see the netdata dashboard | -| `${calc_expression}` | The expression evaluated to provide the value for the alarm | -| `${calc_param_values}` | The value of the variables in the evaluated expression | -| `${total_warnings}` | The total number of alarms in WARNING state on the host | -| `${total_critical}` | The total number of alarms in CRITICAL state on the host | - - -##### DEFAULT_RECIPIENT_AWSSNS - -All roles will default to this variable if left unconfigured. - -You can have different recipient Topics per **role**, by editing `DEFAULT_RECIPIENT_AWSSNS` with the Topic ARN you want, in the following entries at the bottom of the same file: - -```conf -role_recipients_awssns[sysadmin]="arn:aws:sns:us-east-2:123456789012:Systems" -role_recipients_awssns[domainadmin]="arn:aws:sns:us-east-2:123456789012:Domains" -role_recipients_awssns[dba]="arn:aws:sns:us-east-2:123456789012:Databases" -role_recipients_awssns[webmaster]="arn:aws:sns:us-east-2:123456789012:Development" -role_recipients_awssns[proxyadmin]="arn:aws:sns:us-east-2:123456789012:Proxy" -role_recipients_awssns[sitemgr]="arn:aws:sns:us-east-2:123456789012:Sites" -``` - - -</details> - -#### Examples - -##### Basic Configuration - -An example working configuration would be: - -```yaml -```conf -#------------------------------------------------------------------------------ -# Amazon SNS notifications - -SEND_AWSSNS="YES" -AWSSNS_MESSAGE_FORMAT="${status} on ${host} at ${date}: ${chart} ${value_string}" -DEFAULT_RECIPIENT_AWSSNS="arn:aws:sns:us-east-2:123456789012:MyTopic" -``` - -``` - - -## Troubleshooting - -### Test Notification - -You can run the following command by hand, to test alerts configuration: - -```bash -# become user netdata -sudo su -s /bin/bash netdata - -# enable debugging info on the console -export NETDATA_ALARM_NOTIFY_DEBUG=1 - -# send test alarms to sysadmin -/usr/libexec/netdata/plugins.d/alarm-notify.sh test - -# send test alarms to any role -/usr/libexec/netdata/plugins.d/alarm-notify.sh test "ROLE" -``` - -Note that this will test _all_ alert mechanisms for the selected role. - - diff --git a/health/notifications/awssns/metadata.yaml b/health/notifications/awssns/metadata.yaml deleted file mode 100644 index 93389bad..00000000 --- a/health/notifications/awssns/metadata.yaml +++ /dev/null @@ -1,135 +0,0 @@ -# yamllint disable rule:line-length ---- -- id: 'notify-awssns' - meta: - name: 'AWS SNS' - link: 'https://aws.amazon.com/sns/' - categories: - - notify.agent - icon_filename: 'aws.svg' - keywords: - - AWS SNS - overview: - notification_description: | - As part of its AWS suite, Amazon provides a notification broker service called 'Simple Notification Service' (SNS). Amazon SNS works similarly to Netdata's own notification system, allowing to dispatch a single notification to multiple subscribers of different types. Among other things, SNS supports sending notifications to: - - Email addresses - - Mobile Phones via SMS - - HTTP or HTTPS web hooks - - AWS Lambda functions - - AWS SQS queues - - Mobile applications via push notifications - You can send notifications through Amazon SNS using Netdata's Agent alert notification feature, which supports dozens of endpoints, user roles, and more. - notification_limitations: | - - While Amazon SNS supports sending differently formatted messages for different delivery methods, Netdata does not currently support this functionality. - - For email notification support, we recommend using Netdata's email notifications, as it is has the following benefits: - - In most cases, it requires less configuration. - - Netdata's emails are nicely pre-formatted and support features like threading, which requires a lot of manual effort in SNS. - - It is less resource intensive and more cost-efficient than SNS. - setup: - prerequisites: - list: - - title: '' - description: | - - The [Amazon Web Services CLI tools](https://docs.aws.amazon.com/cli/latest/userguide/getting-started-install.html) (awscli). - - An actual home directory for the user you run Netdata as, instead of just using `/` as a home directory. The setup depends on the distribution, but `/var/lib/netdata` is the recommended directory. If you are using Netdata as a dedicated user, the permissions will already be correct. - - An Amazon SNS topic to send notifications to with one or more subscribers. The Getting Started section of the Amazon SNS documentation covers the basics of how to set this up. Make note of the Topic ARN when you create the topic. - - While not mandatory, it is highly recommended to create a dedicated IAM user on your account for Netdata to send notifications. This user needs to have programmatic access, and should only allow access to SNS. For an additional layer of security, you can create one for each system or group of systems. - - Terminal access to the Agent you wish to configure. - configuration: - file: - name: 'health_alarm_notify.conf' - options: - description: 'The following options can be defined for this notification' - folding: - title: 'Config Options' - enabled: true - list: - - name: 'aws path' - default_value: '' - description: "The full path of the aws command. If empty, the system `$PATH` will be searched for it. If not found, Amazon SNS notifications will be silently disabled." - required: true - - name: 'SEND_AWSNS' - default_value: 'YES' - description: "Set `SEND_AWSNS` to YES" - required: true - - name: 'AWSSNS_MESSAGE_FORMAT' - default_value: '${status} on ${host} at ${date}: ${chart} ${value_string}' - description: "Set `AWSSNS_MESSAGE_FORMAT` to to the string that you want the alert to be sent into." - required: true - detailed_description: | - The supported variables are: - - | Variable name | Description | - |:---------------------------:|:---------------------------------------------------------------------------------| - | `${alarm}` | Like "name = value units" | - | `${status_message}` | Like "needs attention", "recovered", "is critical" | - | `${severity}` | Like "Escalated to CRITICAL", "Recovered from WARNING" | - | `${raised_for}` | Like "(alarm was raised for 10 minutes)" | - | `${host}` | The host generated this event | - | `${url_host}` | Same as ${host} but URL encoded | - | `${unique_id}` | The unique id of this event | - | `${alarm_id}` | The unique id of the alarm that generated this event | - | `${event_id}` | The incremental id of the event, for this alarm id | - | `${when}` | The timestamp this event occurred | - | `${name}` | The name of the alarm, as given in netdata health.d entries | - | `${url_name}` | Same as ${name} but URL encoded | - | `${chart}` | The name of the chart (type.id) | - | `${url_chart}` | Same as ${chart} but URL encoded | - | `${status}` | The current status : REMOVED, UNINITIALIZED, UNDEFINED, CLEAR, WARNING, CRITICAL | - | `${old_status}` | The previous status: REMOVED, UNINITIALIZED, UNDEFINED, CLEAR, WARNING, CRITICAL | - | `${value}` | The current value of the alarm | - | `${old_value}` | The previous value of the alarm | - | `${src}` | The line number and file the alarm has been configured | - | `${duration}` | The duration in seconds of the previous alarm state | - | `${duration_txt}` | Same as ${duration} for humans | - | `${non_clear_duration}` | The total duration in seconds this is/was non-clear | - | `${non_clear_duration_txt}` | Same as ${non_clear_duration} for humans | - | `${units}` | The units of the value | - | `${info}` | A short description of the alarm | - | `${value_string}` | Friendly value (with units) | - | `${old_value_string}` | Friendly old value (with units) | - | `${image}` | The URL of an image to represent the status of the alarm | - | `${color}` | A color in AABBCC format for the alarm | - | `${goto_url}` | The URL the user can click to see the netdata dashboard | - | `${calc_expression}` | The expression evaluated to provide the value for the alarm | - | `${calc_param_values}` | The value of the variables in the evaluated expression | - | `${total_warnings}` | The total number of alarms in WARNING state on the host | - | `${total_critical}` | The total number of alarms in CRITICAL state on the host | - - name: 'DEFAULT_RECIPIENT_AWSSNS' - default_value: '' - description: "Set `DEFAULT_RECIPIENT_AWSSNS` to the Topic ARN you noted down upon creating the Topic." - required: true - detailed_description: | - All roles will default to this variable if left unconfigured. - - You can have different recipient Topics per **role**, by editing `DEFAULT_RECIPIENT_AWSSNS` with the Topic ARN you want, in the following entries at the bottom of the same file: - - ```conf - role_recipients_awssns[sysadmin]="arn:aws:sns:us-east-2:123456789012:Systems" - role_recipients_awssns[domainadmin]="arn:aws:sns:us-east-2:123456789012:Domains" - role_recipients_awssns[dba]="arn:aws:sns:us-east-2:123456789012:Databases" - role_recipients_awssns[webmaster]="arn:aws:sns:us-east-2:123456789012:Development" - role_recipients_awssns[proxyadmin]="arn:aws:sns:us-east-2:123456789012:Proxy" - role_recipients_awssns[sitemgr]="arn:aws:sns:us-east-2:123456789012:Sites" - ``` - examples: - folding: - enabled: true - title: '' - list: - - name: 'Basic Configuration' - folding: - enabled: false - description: 'An example working configuration would be:' - config: | - ```conf - #------------------------------------------------------------------------------ - # Amazon SNS notifications - - SEND_AWSSNS="YES" - AWSSNS_MESSAGE_FORMAT="${status} on ${host} at ${date}: ${chart} ${value_string}" - DEFAULT_RECIPIENT_AWSSNS="arn:aws:sns:us-east-2:123456789012:MyTopic" - ``` - troubleshooting: - problems: - list: [] diff --git a/health/notifications/custom/Makefile.inc b/health/notifications/custom/Makefile.inc deleted file mode 100644 index c64ebda2..00000000 --- a/health/notifications/custom/Makefile.inc +++ /dev/null @@ -1,12 +0,0 @@ -# SPDX-License-Identifier: GPL-3.0-or-later - -# THIS IS NOT A COMPLETE Makefile -# IT IS INCLUDED BY ITS PARENT'S Makefile.am -# IT IS REQUIRED TO REFERENCE ALL FILES RELATIVE TO THE PARENT - -# install these files -dist_noinst_DATA += \ - custom/README.md \ - custom/Makefile.inc \ - $(NULL) - diff --git a/health/notifications/custom/README.md b/health/notifications/custom/README.md deleted file mode 100644 index a7cb04bd..00000000 --- a/health/notifications/custom/README.md +++ /dev/null @@ -1,211 +0,0 @@ -<!--startmeta -custom_edit_url: "https://github.com/netdata/netdata/edit/master/health/notifications/custom/README.md" -meta_yaml: "https://github.com/netdata/netdata/edit/master/health/notifications/custom/metadata.yaml" -sidebar_label: "Custom" -learn_status: "Published" -learn_rel_path: "Alerting/Notifications/Agent Dispatched Notifications" -message: "DO NOT EDIT THIS FILE DIRECTLY, IT IS GENERATED BY THE NOTIFICATION'S metadata.yaml FILE" -endmeta--> - -# Custom - - -<img src="https://netdata.cloud/img/custom.png" width="150"/> - - -Netdata Agent's alert notification feature allows you to send custom notifications to any endpoint you choose. - - - -<img src="https://img.shields.io/badge/maintained%20by-Netdata-%2300ab44" /> - -## Setup - -### Prerequisites - -#### - -- Access to the terminal where Netdata Agent is running - - - -### Configuration - -#### File - -The configuration file name for this integration is `health_alarm_notify.conf`. - - -You can edit the configuration file using the `edit-config` script from the -Netdata [config directory](https://github.com/netdata/netdata/blob/master/docs/configure/nodes.md#the-netdata-config-directory). - -```bash -cd /etc/netdata 2>/dev/null || cd /opt/netdata/etc/netdata -sudo ./edit-config health_alarm_notify.conf -``` -#### Options - -The following options can be defined for this notification - -<details><summary>Config Options</summary> - -| Name | Description | Default | Required | -|:----|:-----------|:-------|:--------:| -| SEND_CUSTOM | Set `SEND_CUSTOM` to YES | YES | yes | -| DEFAULT_RECIPIENT_CUSTOM | This value is dependent on how you handle the `${to}` variable inside the `custom_sender()` function. | | yes | -| custom_sender() | You can look at the other senders in `/usr/libexec/netdata/plugins.d/alarm-notify.sh` for examples of how to modify the function in this configuration file. | | no | - -##### DEFAULT_RECIPIENT_CUSTOM - -All roles will default to this variable if left unconfigured. You can edit `DEFAULT_RECIPIENT_CUSTOM` with the variable you want, in the following entries at the bottom of the same file: -``` -role_recipients_custom[sysadmin]="systems" -role_recipients_custom[domainadmin]="domains" -role_recipients_custom[dba]="databases systems" -role_recipients_custom[webmaster]="marketing development" -role_recipients_custom[proxyadmin]="proxy-admin" -role_recipients_custom[sitemgr]="sites" -``` - - -##### custom_sender() - -The following is a sample custom_sender() function in health_alarm_notify.conf, to send an SMS via an imaginary HTTPS endpoint to the SMS gateway: -``` -custom_sender() { - # example human readable SMS - local msg="${host} ${status_message}: ${alarm} ${raised_for}" - - # limit it to 160 characters and encode it for use in a URL - urlencode "${msg:0:160}" >/dev/null; msg="${REPLY}" - - # a space separated list of the recipients to send alarms to - to="${1}" - - for phone in ${to}; do - httpcode=$(docurl -X POST \ - --data-urlencode "From=XXX" \ - --data-urlencode "To=${phone}" \ - --data-urlencode "Body=${msg}" \ - -u "${accountsid}:${accounttoken}" \ - https://domain.website.com/) - - if [ "${httpcode}" = "200" ]; then - info "sent custom notification ${msg} to ${phone}" - sent=$((sent + 1)) - else - error "failed to send custom notification ${msg} to ${phone} with HTTP error code ${httpcode}." - fi - done -} -``` - -The supported variables that you can use for the function's `msg` variable are: - -| Variable name | Description | -|:---------------------------:|:---------------------------------------------------------------------------------| -| `${alarm}` | Like "name = value units" | -| `${status_message}` | Like "needs attention", "recovered", "is critical" | -| `${severity}` | Like "Escalated to CRITICAL", "Recovered from WARNING" | -| `${raised_for}` | Like "(alarm was raised for 10 minutes)" | -| `${host}` | The host generated this event | -| `${url_host}` | Same as ${host} but URL encoded | -| `${unique_id}` | The unique id of this event | -| `${alarm_id}` | The unique id of the alarm that generated this event | -| `${event_id}` | The incremental id of the event, for this alarm id | -| `${when}` | The timestamp this event occurred | -| `${name}` | The name of the alarm, as given in netdata health.d entries | -| `${url_name}` | Same as ${name} but URL encoded | -| `${chart}` | The name of the chart (type.id) | -| `${url_chart}` | Same as ${chart} but URL encoded | -| `${status}` | The current status : REMOVED, UNINITIALIZED, UNDEFINED, CLEAR, WARNING, CRITICAL | -| `${old_status}` | The previous status: REMOVED, UNINITIALIZED, UNDEFINED, CLEAR, WARNING, CRITICAL | -| `${value}` | The current value of the alarm | -| `${old_value}` | The previous value of the alarm | -| `${src}` | The line number and file the alarm has been configured | -| `${duration}` | The duration in seconds of the previous alarm state | -| `${duration_txt}` | Same as ${duration} for humans | -| `${non_clear_duration}` | The total duration in seconds this is/was non-clear | -| `${non_clear_duration_txt}` | Same as ${non_clear_duration} for humans | -| `${units}` | The units of the value | -| `${info}` | A short description of the alarm | -| `${value_string}` | Friendly value (with units) | -| `${old_value_string}` | Friendly old value (with units) | -| `${image}` | The URL of an image to represent the status of the alarm | -| `${color}` | A color in AABBCC format for the alarm | -| `${goto_url}` | The URL the user can click to see the netdata dashboard | -| `${calc_expression}` | The expression evaluated to provide the value for the alarm | -| `${calc_param_values}` | The value of the variables in the evaluated expression | -| `${total_warnings}` | The total number of alarms in WARNING state on the host | -| `${total_critical}` | The total number of alarms in CRITICAL state on the host | - - -</details> - -#### Examples - -##### Basic Configuration - - - -```yaml -#------------------------------------------------------------------------------ -# custom notifications - -SEND_CUSTOM="YES" -DEFAULT_RECIPIENT_CUSTOM="" - -# The custom_sender() is a custom function to do whatever you need to do -custom_sender() { - # example human readable SMS - local msg="${host} ${status_message}: ${alarm} ${raised_for}" - - # limit it to 160 characters and encode it for use in a URL - urlencode "${msg:0:160}" >/dev/null; msg="${REPLY}" - - # a space separated list of the recipients to send alarms to - to="${1}" - - for phone in ${to}; do - httpcode=$(docurl -X POST \ - --data-urlencode "From=XXX" \ - --data-urlencode "To=${phone}" \ - --data-urlencode "Body=${msg}" \ - -u "${accountsid}:${accounttoken}" \ - https://domain.website.com/) - - if [ "${httpcode}" = "200" ]; then - info "sent custom notification ${msg} to ${phone}" - sent=$((sent + 1)) - else - error "failed to send custom notification ${msg} to ${phone} with HTTP error code ${httpcode}." - fi - done -} - -``` - - -## Troubleshooting - -### Test Notification - -You can run the following command by hand, to test alerts configuration: - -```bash -# become user netdata -sudo su -s /bin/bash netdata - -# enable debugging info on the console -export NETDATA_ALARM_NOTIFY_DEBUG=1 - -# send test alarms to sysadmin -/usr/libexec/netdata/plugins.d/alarm-notify.sh test - -# send test alarms to any role -/usr/libexec/netdata/plugins.d/alarm-notify.sh test "ROLE" -``` - -Note that this will test _all_ alert mechanisms for the selected role. - - diff --git a/health/notifications/custom/metadata.yaml b/health/notifications/custom/metadata.yaml deleted file mode 100644 index 557539cf..00000000 --- a/health/notifications/custom/metadata.yaml +++ /dev/null @@ -1,167 +0,0 @@ -# yamllint disable rule:line-length ---- -- id: 'notify-custom' - meta: - name: 'Custom' - link: '' - categories: - - notify.agent - icon_filename: 'custom.png' - keywords: - - custom - overview: - notification_description: | - Netdata Agent's alert notification feature allows you to send custom notifications to any endpoint you choose. - notification_limitations: '' - setup: - prerequisites: - list: - - title: '' - description: | - - Access to the terminal where Netdata Agent is running - configuration: - file: - name: 'health_alarm_notify.conf' - options: - description: 'The following options can be defined for this notification' - folding: - title: 'Config Options' - enabled: true - list: - - name: 'SEND_CUSTOM' - default_value: 'YES' - description: "Set `SEND_CUSTOM` to YES" - required: true - - name: 'DEFAULT_RECIPIENT_CUSTOM' - default_value: '' - description: "This value is dependent on how you handle the `${to}` variable inside the `custom_sender()` function." - required: true - detailed_description: | - All roles will default to this variable if left unconfigured. You can edit `DEFAULT_RECIPIENT_CUSTOM` with the variable you want, in the following entries at the bottom of the same file: - ``` - role_recipients_custom[sysadmin]="systems" - role_recipients_custom[domainadmin]="domains" - role_recipients_custom[dba]="databases systems" - role_recipients_custom[webmaster]="marketing development" - role_recipients_custom[proxyadmin]="proxy-admin" - role_recipients_custom[sitemgr]="sites" - ``` - - name: 'custom_sender()' - default_value: '' - description: "You can look at the other senders in `/usr/libexec/netdata/plugins.d/alarm-notify.sh` for examples of how to modify the function in this configuration file." - required: false - detailed_description: | - The following is a sample custom_sender() function in health_alarm_notify.conf, to send an SMS via an imaginary HTTPS endpoint to the SMS gateway: - ``` - custom_sender() { - # example human readable SMS - local msg="${host} ${status_message}: ${alarm} ${raised_for}" - - # limit it to 160 characters and encode it for use in a URL - urlencode "${msg:0:160}" >/dev/null; msg="${REPLY}" - - # a space separated list of the recipients to send alarms to - to="${1}" - - for phone in ${to}; do - httpcode=$(docurl -X POST \ - --data-urlencode "From=XXX" \ - --data-urlencode "To=${phone}" \ - --data-urlencode "Body=${msg}" \ - -u "${accountsid}:${accounttoken}" \ - https://domain.website.com/) - - if [ "${httpcode}" = "200" ]; then - info "sent custom notification ${msg} to ${phone}" - sent=$((sent + 1)) - else - error "failed to send custom notification ${msg} to ${phone} with HTTP error code ${httpcode}." - fi - done - } - ``` - - The supported variables that you can use for the function's `msg` variable are: - - | Variable name | Description | - |:---------------------------:|:---------------------------------------------------------------------------------| - | `${alarm}` | Like "name = value units" | - | `${status_message}` | Like "needs attention", "recovered", "is critical" | - | `${severity}` | Like "Escalated to CRITICAL", "Recovered from WARNING" | - | `${raised_for}` | Like "(alarm was raised for 10 minutes)" | - | `${host}` | The host generated this event | - | `${url_host}` | Same as ${host} but URL encoded | - | `${unique_id}` | The unique id of this event | - | `${alarm_id}` | The unique id of the alarm that generated this event | - | `${event_id}` | The incremental id of the event, for this alarm id | - | `${when}` | The timestamp this event occurred | - | `${name}` | The name of the alarm, as given in netdata health.d entries | - | `${url_name}` | Same as ${name} but URL encoded | - | `${chart}` | The name of the chart (type.id) | - | `${url_chart}` | Same as ${chart} but URL encoded | - | `${status}` | The current status : REMOVED, UNINITIALIZED, UNDEFINED, CLEAR, WARNING, CRITICAL | - | `${old_status}` | The previous status: REMOVED, UNINITIALIZED, UNDEFINED, CLEAR, WARNING, CRITICAL | - | `${value}` | The current value of the alarm | - | `${old_value}` | The previous value of the alarm | - | `${src}` | The line number and file the alarm has been configured | - | `${duration}` | The duration in seconds of the previous alarm state | - | `${duration_txt}` | Same as ${duration} for humans | - | `${non_clear_duration}` | The total duration in seconds this is/was non-clear | - | `${non_clear_duration_txt}` | Same as ${non_clear_duration} for humans | - | `${units}` | The units of the value | - | `${info}` | A short description of the alarm | - | `${value_string}` | Friendly value (with units) | - | `${old_value_string}` | Friendly old value (with units) | - | `${image}` | The URL of an image to represent the status of the alarm | - | `${color}` | A color in AABBCC format for the alarm | - | `${goto_url}` | The URL the user can click to see the netdata dashboard | - | `${calc_expression}` | The expression evaluated to provide the value for the alarm | - | `${calc_param_values}` | The value of the variables in the evaluated expression | - | `${total_warnings}` | The total number of alarms in WARNING state on the host | - | `${total_critical}` | The total number of alarms in CRITICAL state on the host | - examples: - folding: - enabled: true - title: '' - list: - - name: 'Basic Configuration' - folding: - enabled: false - description: '' - config: | - #------------------------------------------------------------------------------ - # custom notifications - - SEND_CUSTOM="YES" - DEFAULT_RECIPIENT_CUSTOM="" - - # The custom_sender() is a custom function to do whatever you need to do - custom_sender() { - # example human readable SMS - local msg="${host} ${status_message}: ${alarm} ${raised_for}" - - # limit it to 160 characters and encode it for use in a URL - urlencode "${msg:0:160}" >/dev/null; msg="${REPLY}" - - # a space separated list of the recipients to send alarms to - to="${1}" - - for phone in ${to}; do - httpcode=$(docurl -X POST \ - --data-urlencode "From=XXX" \ - --data-urlencode "To=${phone}" \ - --data-urlencode "Body=${msg}" \ - -u "${accountsid}:${accounttoken}" \ - https://domain.website.com/) - - if [ "${httpcode}" = "200" ]; then - info "sent custom notification ${msg} to ${phone}" - sent=$((sent + 1)) - else - error "failed to send custom notification ${msg} to ${phone} with HTTP error code ${httpcode}." - fi - done - } - troubleshooting: - problems: - list: [] diff --git a/health/notifications/discord/Makefile.inc b/health/notifications/discord/Makefile.inc deleted file mode 100644 index 78de7231..00000000 --- a/health/notifications/discord/Makefile.inc +++ /dev/null @@ -1,12 +0,0 @@ -# SPDX-License-Identifier: GPL-3.0-or-later - -# THIS IS NOT A COMPLETE Makefile -# IT IS INCLUDED BY ITS PARENT'S Makefile.am -# IT IS REQUIRED TO REFERENCE ALL FILES RELATIVE TO THE PARENT - -# install these files -dist_noinst_DATA += \ - discord/README.md \ - discord/Makefile.inc \ - $(NULL) - diff --git a/health/notifications/discord/README.md b/health/notifications/discord/README.md deleted file mode 100644 index 8b473a7e..00000000 --- a/health/notifications/discord/README.md +++ /dev/null @@ -1,117 +0,0 @@ -<!--startmeta -custom_edit_url: "https://github.com/netdata/netdata/edit/master/health/notifications/discord/README.md" -meta_yaml: "https://github.com/netdata/netdata/edit/master/health/notifications/discord/metadata.yaml" -sidebar_label: "Discord" -learn_status: "Published" -learn_rel_path: "Alerting/Notifications/Agent Dispatched Notifications" -message: "DO NOT EDIT THIS FILE DIRECTLY, IT IS GENERATED BY THE NOTIFICATION'S metadata.yaml FILE" -endmeta--> - -# Discord - - -<img src="https://netdata.cloud/img/discord.png" width="150"/> - - -Send notifications to Discord using Netdata's Agent alert notification feature, which supports dozens of endpoints, user roles, and more. - - - -<img src="https://img.shields.io/badge/maintained%20by-Netdata-%2300ab44" /> - -## Setup - -### Prerequisites - -#### - -- The incoming webhook URL as given by Discord. Create a webhook by following the official [Discord documentation](https://support.discord.com/hc/en-us/articles/228383668-Intro-to-Webhooks). You can use the same on all your Netdata servers (or you can have multiple if you like - your decision). -- One or more Discord channels to post the messages to -- Access to the terminal where Netdata Agent is running - - - -### Configuration - -#### File - -The configuration file name for this integration is `health_alarm_notify.conf`. - - -You can edit the configuration file using the `edit-config` script from the -Netdata [config directory](https://github.com/netdata/netdata/blob/master/docs/configure/nodes.md#the-netdata-config-directory). - -```bash -cd /etc/netdata 2>/dev/null || cd /opt/netdata/etc/netdata -sudo ./edit-config health_alarm_notify.conf -``` -#### Options - -The following options can be defined for this notification - -<details><summary>Config Options</summary> - -| Name | Description | Default | Required | -|:----|:-----------|:-------|:--------:| -| SEND_DISCORD | Set `SEND_DISCORD` to YES | YES | yes | -| DISCORD_WEBHOOK_URL | set `DISCORD_WEBHOOK_URL` to your webhook URL. | | yes | -| DEFAULT_RECIPIENT_DISCORD | Set `DEFAULT_RECIPIENT_DISCORD` to the channel you want the alert notifications to be sent to. You can define multiple channels like this: `alerts` `systems`. | | yes | - -##### DEFAULT_RECIPIENT_DISCORD - -All roles will default to this variable if left unconfigured. -You can then have different channels per role, by editing `DEFAULT_RECIPIENT_DISCORD` with the channel you want, in the following entries at the bottom of the same file: -```conf -role_recipients_discord[sysadmin]="systems" -role_recipients_discord[domainadmin]="domains" -role_recipients_discord[dba]="databases systems" -role_recipients_discord[webmaster]="marketing development" -role_recipients_discord[proxyadmin]="proxy-admin" -role_recipients_discord[sitemgr]="sites" -``` - -The values you provide should already exist as Discord channels in your server. - - -</details> - -#### Examples - -##### Basic Configuration - - - -```yaml -#------------------------------------------------------------------------------ -# discord (discordapp.com) global notification options - -SEND_DISCORD="YES" -DISCORD_WEBHOOK_URL="https://discord.com/api/webhooks/XXXXXXXXXXXXX/XXXXXXXXXXXXXXXXXXXXXXXXXXXXXX" -DEFAULT_RECIPIENT_DISCORD="alerts" - -``` - - -## Troubleshooting - -### Test Notification - -You can run the following command by hand, to test alerts configuration: - -```bash -# become user netdata -sudo su -s /bin/bash netdata - -# enable debugging info on the console -export NETDATA_ALARM_NOTIFY_DEBUG=1 - -# send test alarms to sysadmin -/usr/libexec/netdata/plugins.d/alarm-notify.sh test - -# send test alarms to any role -/usr/libexec/netdata/plugins.d/alarm-notify.sh test "ROLE" -``` - -Note that this will test _all_ alert mechanisms for the selected role. - - diff --git a/health/notifications/discord/metadata.yaml b/health/notifications/discord/metadata.yaml deleted file mode 100644 index a46a8ec9..00000000 --- a/health/notifications/discord/metadata.yaml +++ /dev/null @@ -1,76 +0,0 @@ -# yamllint disable rule:line-length ---- -- id: 'notify-discord' - meta: - name: 'Discord' - link: 'https://discord.com/' - categories: - - notify.agent - icon_filename: 'discord.png' - keywords: - - Discord - overview: - notification_description: | - Send notifications to Discord using Netdata's Agent alert notification feature, which supports dozens of endpoints, user roles, and more. - notification_limitations: '' - setup: - prerequisites: - list: - - title: '' - description: | - - The incoming webhook URL as given by Discord. Create a webhook by following the official [Discord documentation](https://support.discord.com/hc/en-us/articles/228383668-Intro-to-Webhooks). You can use the same on all your Netdata servers (or you can have multiple if you like - your decision). - - One or more Discord channels to post the messages to - - Access to the terminal where Netdata Agent is running - configuration: - file: - name: 'health_alarm_notify.conf' - options: - description: 'The following options can be defined for this notification' - folding: - title: 'Config Options' - enabled: true - list: - - name: 'SEND_DISCORD' - default_value: 'YES' - description: "Set `SEND_DISCORD` to YES" - required: true - - name: 'DISCORD_WEBHOOK_URL' - default_value: '' - description: "set `DISCORD_WEBHOOK_URL` to your webhook URL." - required: true - - name: 'DEFAULT_RECIPIENT_DISCORD' - default_value: '' - description: "Set `DEFAULT_RECIPIENT_DISCORD` to the channel you want the alert notifications to be sent to. You can define multiple channels like this: `alerts` `systems`. " - required: true - detailed_description: | - All roles will default to this variable if left unconfigured. - You can then have different channels per role, by editing `DEFAULT_RECIPIENT_DISCORD` with the channel you want, in the following entries at the bottom of the same file: - ```conf - role_recipients_discord[sysadmin]="systems" - role_recipients_discord[domainadmin]="domains" - role_recipients_discord[dba]="databases systems" - role_recipients_discord[webmaster]="marketing development" - role_recipients_discord[proxyadmin]="proxy-admin" - role_recipients_discord[sitemgr]="sites" - ``` - - The values you provide should already exist as Discord channels in your server. - examples: - folding: - enabled: true - title: '' - list: - - name: 'Basic Configuration' - folding: - enabled: false - description: '' - config: | - #------------------------------------------------------------------------------ - # discord (discordapp.com) global notification options - - SEND_DISCORD="YES" - DISCORD_WEBHOOK_URL="https://discord.com/api/webhooks/XXXXXXXXXXXXX/XXXXXXXXXXXXXXXXXXXXXXXXXXXXXX" - DEFAULT_RECIPIENT_DISCORD="alerts" - troubleshooting: - problems: - list: [] diff --git a/health/notifications/dynatrace/Makefile.inc b/health/notifications/dynatrace/Makefile.inc deleted file mode 100644 index a2ae623f..00000000 --- a/health/notifications/dynatrace/Makefile.inc +++ /dev/null @@ -1,12 +0,0 @@ -# SPDX-License-Identifier: GPL-3.0-or-later - -# THIS IS NOT A COMPLETE Makefile -# IT IS INCLUDED BY ITS PARENT'S Makefile.am -# IT IS REQUIRED TO REFERENCE ALL FILES RELATIVE TO THE PARENT - -# install these files -dist_noinst_DATA += \ - dynatrace/README.md \ - dynatrace/Makefile.inc \ - $(NULL) - diff --git a/health/notifications/dynatrace/README.md b/health/notifications/dynatrace/README.md deleted file mode 100644 index 6ee86369..00000000 --- a/health/notifications/dynatrace/README.md +++ /dev/null @@ -1,124 +0,0 @@ -<!--startmeta -custom_edit_url: "https://github.com/netdata/netdata/edit/master/health/notifications/dynatrace/README.md" -meta_yaml: "https://github.com/netdata/netdata/edit/master/health/notifications/dynatrace/metadata.yaml" -sidebar_label: "Dynatrace" -learn_status: "Published" -learn_rel_path: "Alerting/Notifications/Agent Dispatched Notifications" -message: "DO NOT EDIT THIS FILE DIRECTLY, IT IS GENERATED BY THE NOTIFICATION'S metadata.yaml FILE" -endmeta--> - -# Dynatrace - - -<img src="https://netdata.cloud/img/dynatrace.svg" width="150"/> - - -Dynatrace allows you to receive notifications using their Events REST API. See the [Dynatrace documentation](https://www.dynatrace.com/support/help/dynatrace-api/environment-api/events-v2/post-event) about POSTing an event in the Events API for more details. -You can send notifications to Dynatrace using Netdata's Agent alert notification feature, which supports dozens of endpoints, user roles, and more. - - - -<img src="https://img.shields.io/badge/maintained%20by-Netdata-%2300ab44" /> - -## Setup - -### Prerequisites - -#### - -- A Dynatrace Server. You can use the same on all your Netdata servers but make sure the server is network visible from your Netdata hosts. The Dynatrace server should be with protocol prefixed (http:// or https://), for example: https://monitor.example.com. -- An API Token. Generate a secure access API token that enables access to your Dynatrace monitoring data via the REST-based API. See [Dynatrace API - Authentication](https://www.dynatrace.com/support/help/extend-dynatrace/dynatrace-api/basics/dynatrace-api-authentication/) for more details. -- An API Space. This is the URL part of the page you have access in order to generate the API Token. For example, the URL for a generated API token might look like: https://monitor.illumineit.com/e/2a93fe0e-4cd5-469a-9d0d-1a064235cfce/#settings/integration/apikeys;gf=all In that case, the Space is 2a93fe0e-4cd5-469a-9d0d-1a064235cfce. -- A Server Tag. To generate one on your Dynatrace Server, go to Settings --> Tags --> Manually applied tags and create the Tag. The Netdata alarm is sent as a Dynatrace Event to be correlated with all those hosts tagged with this Tag you have created. -- Terminal access to the Agent you wish to configure - - - -### Configuration - -#### File - -The configuration file name for this integration is `health_alarm_notify.conf`. - - -You can edit the configuration file using the `edit-config` script from the -Netdata [config directory](https://github.com/netdata/netdata/blob/master/docs/configure/nodes.md#the-netdata-config-directory). - -```bash -cd /etc/netdata 2>/dev/null || cd /opt/netdata/etc/netdata -sudo ./edit-config health_alarm_notify.conf -``` -#### Options - -The following options can be defined for this notification - -<details><summary>Config Options</summary> - -| Name | Description | Default | Required | -|:----|:-----------|:-------|:--------:| -| SEND_DYNATRACE | Set `SEND_DYNATRACE` to YES | YES | yes | -| DYNATRACE_SERVER | Set `DYNATRACE_SERVER` to the Dynatrace server with the protocol prefix, for example `https://monitor.example.com`. | | yes | -| DYNATRACE_TOKEN | Set `DYNATRACE_TOKEN` to your Dynatrace API authentication token | | yes | -| DYNATRACE_SPACE | Set `DYNATRACE_SPACE` to the API Space, it is the URL part of the page you have access in order to generate the API Token. | | yes | -| DYNATRACE_TAG_VALUE | Set `DYNATRACE_TAG_VALUE` to your Dynatrace Server Tag. | | yes | -| DYNATRACE_ANNOTATION_TYPE | `DYNATRACE_ANNOTATION_TYPE` can be left to its default value Netdata Alarm, but you can change it to better fit your needs. | Netdata Alarm | no | -| DYNATRACE_EVENT | Set `DYNATRACE_EVENT` to the Dynatrace eventType you want. | Netdata Alarm | no | - -##### DYNATRACE_SPACE - -For example, the URL for a generated API token might look like: https://monitor.illumineit.com/e/2a93fe0e-4cd5-469a-9d0d-1a064235cfce/#settings/integration/apikeys;gf=all In that case, the Space is 2a93fe0e-4cd5-469a-9d0d-1a064235cfce. - - -##### DYNATRACE_EVENT - -`AVAILABILITY_EVENT`, `CUSTOM_ALERT`, `CUSTOM_ANNOTATION`, `CUSTOM_CONFIGURATION`, `CUSTOM_DEPLOYMENT`, `CUSTOM_INFO`, `ERROR_EVENT`, -`MARKED_FOR_TERMINATION`, `PERFORMANCE_EVENT`, `RESOURCE_CONTENTION_EVENT`. -You can read more [here](https://www.dynatrace.com/support/help/dynatrace-api/environment-api/events-v2/post-event#request-body-objects). - - -</details> - -#### Examples - -##### Basic Configuration - - - -```yaml -#------------------------------------------------------------------------------ -# Dynatrace global notification options - -SEND_DYNATRACE="YES" -DYNATRACE_SERVER="https://monitor.example.com" -DYNATRACE_TOKEN="XXXXXXX" -DYNATRACE_SPACE="2a93fe0e-4cd5-469a-9d0d-1a064235cfce" -DYNATRACE_TAG_VALUE="SERVERTAG" -DYNATRACE_ANNOTATION_TYPE="Netdata Alert" -DYNATRACE_EVENT="AVAILABILITY_EVENT" - -``` - - -## Troubleshooting - -### Test Notification - -You can run the following command by hand, to test alerts configuration: - -```bash -# become user netdata -sudo su -s /bin/bash netdata - -# enable debugging info on the console -export NETDATA_ALARM_NOTIFY_DEBUG=1 - -# send test alarms to sysadmin -/usr/libexec/netdata/plugins.d/alarm-notify.sh test - -# send test alarms to any role -/usr/libexec/netdata/plugins.d/alarm-notify.sh test "ROLE" -``` - -Note that this will test _all_ alert mechanisms for the selected role. - - diff --git a/health/notifications/dynatrace/metadata.yaml b/health/notifications/dynatrace/metadata.yaml deleted file mode 100644 index a88c766f..00000000 --- a/health/notifications/dynatrace/metadata.yaml +++ /dev/null @@ -1,92 +0,0 @@ -# yamllint disable rule:line-length ---- -- id: 'notify-dynatrace' - meta: - name: 'Dynatrace' - link: 'https://dynatrace.com' - categories: - - notify.agent - icon_filename: 'dynatrace.svg' - keywords: - - Dynatrace - overview: - notification_description: | - Dynatrace allows you to receive notifications using their Events REST API. See the [Dynatrace documentation](https://www.dynatrace.com/support/help/dynatrace-api/environment-api/events-v2/post-event) about POSTing an event in the Events API for more details. - You can send notifications to Dynatrace using Netdata's Agent alert notification feature, which supports dozens of endpoints, user roles, and more. - notification_limitations: '' - setup: - prerequisites: - list: - - title: '' - description: | - - A Dynatrace Server. You can use the same on all your Netdata servers but make sure the server is network visible from your Netdata hosts. The Dynatrace server should be with protocol prefixed (http:// or https://), for example: https://monitor.example.com. - - An API Token. Generate a secure access API token that enables access to your Dynatrace monitoring data via the REST-based API. See [Dynatrace API - Authentication](https://www.dynatrace.com/support/help/extend-dynatrace/dynatrace-api/basics/dynatrace-api-authentication/) for more details. - - An API Space. This is the URL part of the page you have access in order to generate the API Token. For example, the URL for a generated API token might look like: https://monitor.illumineit.com/e/2a93fe0e-4cd5-469a-9d0d-1a064235cfce/#settings/integration/apikeys;gf=all In that case, the Space is 2a93fe0e-4cd5-469a-9d0d-1a064235cfce. - - A Server Tag. To generate one on your Dynatrace Server, go to Settings --> Tags --> Manually applied tags and create the Tag. The Netdata alarm is sent as a Dynatrace Event to be correlated with all those hosts tagged with this Tag you have created. - - Terminal access to the Agent you wish to configure - configuration: - file: - name: 'health_alarm_notify.conf' - options: - description: 'The following options can be defined for this notification' - folding: - title: 'Config Options' - enabled: true - list: - - name: 'SEND_DYNATRACE' - default_value: 'YES' - description: "Set `SEND_DYNATRACE` to YES" - required: true - - name: 'DYNATRACE_SERVER' - default_value: '' - description: "Set `DYNATRACE_SERVER` to the Dynatrace server with the protocol prefix, for example `https://monitor.example.com`." - required: true - - name: 'DYNATRACE_TOKEN' - default_value: '' - description: "Set `DYNATRACE_TOKEN` to your Dynatrace API authentication token" - required: true - - name: 'DYNATRACE_SPACE' - default_value: '' - description: "Set `DYNATRACE_SPACE` to the API Space, it is the URL part of the page you have access in order to generate the API Token." - required: true - detailed_description: | - For example, the URL for a generated API token might look like: https://monitor.illumineit.com/e/2a93fe0e-4cd5-469a-9d0d-1a064235cfce/#settings/integration/apikeys;gf=all In that case, the Space is 2a93fe0e-4cd5-469a-9d0d-1a064235cfce. - - name: 'DYNATRACE_TAG_VALUE' - default_value: '' - description: "Set `DYNATRACE_TAG_VALUE` to your Dynatrace Server Tag." - required: true - - name: 'DYNATRACE_ANNOTATION_TYPE' - default_value: 'Netdata Alarm' - description: "`DYNATRACE_ANNOTATION_TYPE` can be left to its default value Netdata Alarm, but you can change it to better fit your needs." - required: false - - name: 'DYNATRACE_EVENT' - default_value: 'Netdata Alarm' - description: "Set `DYNATRACE_EVENT` to the Dynatrace eventType you want." - required: false - detailed_description: | - `AVAILABILITY_EVENT`, `CUSTOM_ALERT`, `CUSTOM_ANNOTATION`, `CUSTOM_CONFIGURATION`, `CUSTOM_DEPLOYMENT`, `CUSTOM_INFO`, `ERROR_EVENT`, - `MARKED_FOR_TERMINATION`, `PERFORMANCE_EVENT`, `RESOURCE_CONTENTION_EVENT`. - You can read more [here](https://www.dynatrace.com/support/help/dynatrace-api/environment-api/events-v2/post-event#request-body-objects). - examples: - folding: - enabled: true - title: '' - list: - - name: 'Basic Configuration' - folding: - enabled: false - description: '' - config: | - #------------------------------------------------------------------------------ - # Dynatrace global notification options - - SEND_DYNATRACE="YES" - DYNATRACE_SERVER="https://monitor.example.com" - DYNATRACE_TOKEN="XXXXXXX" - DYNATRACE_SPACE="2a93fe0e-4cd5-469a-9d0d-1a064235cfce" - DYNATRACE_TAG_VALUE="SERVERTAG" - DYNATRACE_ANNOTATION_TYPE="Netdata Alert" - DYNATRACE_EVENT="AVAILABILITY_EVENT" - troubleshooting: - problems: - list: [] diff --git a/health/notifications/email/Makefile.inc b/health/notifications/email/Makefile.inc deleted file mode 100644 index 95dc7cf2..00000000 --- a/health/notifications/email/Makefile.inc +++ /dev/null @@ -1,12 +0,0 @@ -# SPDX-License-Identifier: GPL-3.0-or-later - -# THIS IS NOT A COMPLETE Makefile -# IT IS INCLUDED BY ITS PARENT'S Makefile.am -# IT IS REQUIRED TO REFERENCE ALL FILES RELATIVE TO THE PARENT - -# install these files -dist_noinst_DATA += \ - email/README.md \ - email/Makefile.inc \ - $(NULL) - diff --git a/health/notifications/email/README.md b/health/notifications/email/README.md deleted file mode 100644 index 3470ba44..00000000 --- a/health/notifications/email/README.md +++ /dev/null @@ -1,114 +0,0 @@ -<!--startmeta -custom_edit_url: "https://github.com/netdata/netdata/edit/master/health/notifications/email/README.md" -meta_yaml: "https://github.com/netdata/netdata/edit/master/health/notifications/email/metadata.yaml" -sidebar_label: "Email" -learn_status: "Published" -learn_rel_path: "Alerting/Notifications/Agent Dispatched Notifications" -message: "DO NOT EDIT THIS FILE DIRECTLY, IT IS GENERATED BY THE NOTIFICATION'S metadata.yaml FILE" -endmeta--> - -# Email - - -<img src="https://netdata.cloud/img/email.png" width="150"/> - - -Send notifications via Email using Netdata's Agent alert notification feature, which supports dozens of endpoints, user roles, and more. - - - -<img src="https://img.shields.io/badge/maintained%20by-Netdata-%2300ab44" /> - -## Setup - -### Prerequisites - -#### - -- A working sendmail command is required for email alerts to work. Almost all MTAs provide a sendmail interface. Netdata sends all emails as user netdata, so make sure your sendmail works for local users. -- Access to the terminal where Netdata Agent is running - - - -### Configuration - -#### File - -The configuration file name for this integration is `health_alarm_notify.conf`. - - -You can edit the configuration file using the `edit-config` script from the -Netdata [config directory](https://github.com/netdata/netdata/blob/master/docs/configure/nodes.md#the-netdata-config-directory). - -```bash -cd /etc/netdata 2>/dev/null || cd /opt/netdata/etc/netdata -sudo ./edit-config health_alarm_notify.conf -``` -#### Options - -The following options can be defined for this notification - -<details><summary>Config Options</summary> - -| Name | Description | Default | Required | -|:----|:-----------|:-------|:--------:| -| EMAIL_SENDER | You can change `EMAIL_SENDER` to the email address sending the notifications. | netdata | no | -| SEND_EMAIL | Set `SEND_EMAIL` to YES | YES | yes | -| DEFAULT_RECIPIENT_EMAIL | Set `DEFAULT_RECIPIENT_EMAIL` to the email address you want the email to be sent by default. You can define multiple email addresses like this: `alarms@example.com` `systems@example.com`. | root | yes | - -##### DEFAULT_RECIPIENT_EMAIL - -All roles will default to this variable if left unconfigured. -The `DEFAULT_RECIPIENT_CUSTOM` can be edited in the following entries at the bottom of the same file: -```conf -role_recipients_email[sysadmin]="systems@example.com" -role_recipients_email[domainadmin]="domains@example.com" -role_recipients_email[dba]="databases@example.com systems@example.com" -role_recipients_email[webmaster]="marketing@example.com development@example.com" -role_recipients_email[proxyadmin]="proxy-admin@example.com" -role_recipients_email[sitemgr]="sites@example.com" -``` - - -</details> - -#### Examples - -##### Basic Configuration - - - -```yaml -#------------------------------------------------------------------------------ -# email global notification options - -EMAIL_SENDER="example@domain.com" -SEND_EMAIL="YES" -DEFAULT_RECIPIENT_EMAIL="recipient@example.com" - -``` - - -## Troubleshooting - -### Test Notification - -You can run the following command by hand, to test alerts configuration: - -```bash -# become user netdata -sudo su -s /bin/bash netdata - -# enable debugging info on the console -export NETDATA_ALARM_NOTIFY_DEBUG=1 - -# send test alarms to sysadmin -/usr/libexec/netdata/plugins.d/alarm-notify.sh test - -# send test alarms to any role -/usr/libexec/netdata/plugins.d/alarm-notify.sh test "ROLE" -``` - -Note that this will test _all_ alert mechanisms for the selected role. - - diff --git a/health/notifications/email/metadata.yaml b/health/notifications/email/metadata.yaml deleted file mode 100644 index f0d4a62a..00000000 --- a/health/notifications/email/metadata.yaml +++ /dev/null @@ -1,73 +0,0 @@ -# yamllint disable rule:line-length ---- -- id: 'notify-email' - meta: - name: 'Email' - link: '' - categories: - - notify.agent - icon_filename: 'email.png' - keywords: - - email - overview: - notification_description: | - Send notifications via Email using Netdata's Agent alert notification feature, which supports dozens of endpoints, user roles, and more. - notification_limitations: '' - setup: - prerequisites: - list: - - title: '' - description: | - - A working sendmail command is required for email alerts to work. Almost all MTAs provide a sendmail interface. Netdata sends all emails as user netdata, so make sure your sendmail works for local users. - - Access to the terminal where Netdata Agent is running - configuration: - file: - name: 'health_alarm_notify.conf' - options: - description: 'The following options can be defined for this notification' - folding: - title: 'Config Options' - enabled: true - list: - - name: 'EMAIL_SENDER' - default_value: 'netdata' - description: "You can change `EMAIL_SENDER` to the email address sending the notifications." - required: false - - name: 'SEND_EMAIL' - default_value: 'YES' - description: "Set `SEND_EMAIL` to YES" - required: true - - name: 'DEFAULT_RECIPIENT_EMAIL' - default_value: 'root' - description: "Set `DEFAULT_RECIPIENT_EMAIL` to the email address you want the email to be sent by default. You can define multiple email addresses like this: `alarms@example.com` `systems@example.com`." - required: true - detailed_description: | - All roles will default to this variable if left unconfigured. - The `DEFAULT_RECIPIENT_CUSTOM` can be edited in the following entries at the bottom of the same file: - ```conf - role_recipients_email[sysadmin]="systems@example.com" - role_recipients_email[domainadmin]="domains@example.com" - role_recipients_email[dba]="databases@example.com systems@example.com" - role_recipients_email[webmaster]="marketing@example.com development@example.com" - role_recipients_email[proxyadmin]="proxy-admin@example.com" - role_recipients_email[sitemgr]="sites@example.com" - ``` - examples: - folding: - enabled: true - title: '' - list: - - name: 'Basic Configuration' - folding: - enabled: false - description: '' - config: | - #------------------------------------------------------------------------------ - # email global notification options - - EMAIL_SENDER="example@domain.com" - SEND_EMAIL="YES" - DEFAULT_RECIPIENT_EMAIL="recipient@example.com" - troubleshooting: - problems: - list: [] diff --git a/health/notifications/flock/Makefile.inc b/health/notifications/flock/Makefile.inc deleted file mode 100644 index 5bde1619..00000000 --- a/health/notifications/flock/Makefile.inc +++ /dev/null @@ -1,12 +0,0 @@ -# SPDX-License-Identifier: GPL-3.0-or-later - -# THIS IS NOT A COMPLETE Makefile -# IT IS INCLUDED BY ITS PARENT'S Makefile.am -# IT IS REQUIRED TO REFERENCE ALL FILES RELATIVE TO THE PARENT - -# install these files -dist_noinst_DATA += \ - flock/README.md \ - flock/Makefile.inc \ - $(NULL) - diff --git a/health/notifications/flock/README.md b/health/notifications/flock/README.md deleted file mode 100644 index ab846203..00000000 --- a/health/notifications/flock/README.md +++ /dev/null @@ -1,113 +0,0 @@ -<!--startmeta -custom_edit_url: "https://github.com/netdata/netdata/edit/master/health/notifications/flock/README.md" -meta_yaml: "https://github.com/netdata/netdata/edit/master/health/notifications/flock/metadata.yaml" -sidebar_label: "Flock" -learn_status: "Published" -learn_rel_path: "Alerting/Notifications/Agent Dispatched Notifications" -message: "DO NOT EDIT THIS FILE DIRECTLY, IT IS GENERATED BY THE NOTIFICATION'S metadata.yaml FILE" -endmeta--> - -# Flock - - -<img src="https://netdata.cloud/img/flock.png" width="150"/> - - -Send notifications to Flock using Netdata's Agent alert notification feature, which supports dozens of endpoints, user roles, and more. - - - -<img src="https://img.shields.io/badge/maintained%20by-Netdata-%2300ab44" /> - -## Setup - -### Prerequisites - -#### - -- The incoming webhook URL as given by flock.com. You can use the same on all your Netdata servers (or you can have multiple if you like). Read more about flock webhooks and how to get one [here](https://admin.flock.com/webhooks). -- Access to the terminal where Netdata Agent is running - - - -### Configuration - -#### File - -The configuration file name for this integration is `health_alarm_notify.conf`. - - -You can edit the configuration file using the `edit-config` script from the -Netdata [config directory](https://github.com/netdata/netdata/blob/master/docs/configure/nodes.md#the-netdata-config-directory). - -```bash -cd /etc/netdata 2>/dev/null || cd /opt/netdata/etc/netdata -sudo ./edit-config health_alarm_notify.conf -``` -#### Options - -The following options can be defined for this notification - -<details><summary>Config Options</summary> - -| Name | Description | Default | Required | -|:----|:-----------|:-------|:--------:| -| SEND_FLOCK | Set `SEND_FLOCK` to YES | YES | yes | -| FLOCK_WEBHOOK_URL | set `FLOCK_WEBHOOK_URL` to your webhook URL. | | yes | -| DEFAULT_RECIPIENT_FLOCK | Set `DEFAULT_RECIPIENT_FLOCK` to the Flock channel you want the alert notifications to be sent to. All roles will default to this variable if left unconfigured. | | yes | - -##### DEFAULT_RECIPIENT_FLOCK - -You can have different channels per role, by editing DEFAULT_RECIPIENT_FLOCK with the channel you want, in the following entries at the bottom of the same file: -```conf -role_recipients_flock[sysadmin]="systems" -role_recipients_flock[domainadmin]="domains" -role_recipients_flock[dba]="databases systems" -role_recipients_flock[webmaster]="marketing development" -role_recipients_flock[proxyadmin]="proxy-admin" -role_recipients_flock[sitemgr]="sites" -``` - - -</details> - -#### Examples - -##### Basic Configuration - - - -```yaml -#------------------------------------------------------------------------------ -# flock (flock.com) global notification options - -SEND_FLOCK="YES" -FLOCK_WEBHOOK_URL="https://api.flock.com/hooks/sendMessage/XXXXXXXXXXXXXXXXXXXXXXXXXXXXXXX" -DEFAULT_RECIPIENT_FLOCK="alarms" - -``` - - -## Troubleshooting - -### Test Notification - -You can run the following command by hand, to test alerts configuration: - -```bash -# become user netdata -sudo su -s /bin/bash netdata - -# enable debugging info on the console -export NETDATA_ALARM_NOTIFY_DEBUG=1 - -# send test alarms to sysadmin -/usr/libexec/netdata/plugins.d/alarm-notify.sh test - -# send test alarms to any role -/usr/libexec/netdata/plugins.d/alarm-notify.sh test "ROLE" -``` - -Note that this will test _all_ alert mechanisms for the selected role. - - diff --git a/health/notifications/flock/metadata.yaml b/health/notifications/flock/metadata.yaml deleted file mode 100644 index 62e7f499..00000000 --- a/health/notifications/flock/metadata.yaml +++ /dev/null @@ -1,72 +0,0 @@ -# yamllint disable rule:line-length ---- -- id: 'notify-flock' - meta: - name: 'Flock' - link: 'https://support.flock.com/' - categories: - - notify.agent - icon_filename: 'flock.png' - keywords: - - Flock - overview: - notification_description: | - Send notifications to Flock using Netdata's Agent alert notification feature, which supports dozens of endpoints, user roles, and more. - notification_limitations: '' - setup: - prerequisites: - list: - - title: '' - description: | - - The incoming webhook URL as given by flock.com. You can use the same on all your Netdata servers (or you can have multiple if you like). Read more about flock webhooks and how to get one [here](https://admin.flock.com/webhooks). - - Access to the terminal where Netdata Agent is running - configuration: - file: - name: 'health_alarm_notify.conf' - options: - description: 'The following options can be defined for this notification' - folding: - title: 'Config Options' - enabled: true - list: - - name: 'SEND_FLOCK' - default_value: 'YES' - description: "Set `SEND_FLOCK` to YES" - required: true - - name: 'FLOCK_WEBHOOK_URL' - default_value: '' - description: "set `FLOCK_WEBHOOK_URL` to your webhook URL." - required: true - - name: 'DEFAULT_RECIPIENT_FLOCK' - default_value: '' - description: "Set `DEFAULT_RECIPIENT_FLOCK` to the Flock channel you want the alert notifications to be sent to. All roles will default to this variable if left unconfigured." - required: true - detailed_description: | - You can have different channels per role, by editing DEFAULT_RECIPIENT_FLOCK with the channel you want, in the following entries at the bottom of the same file: - ```conf - role_recipients_flock[sysadmin]="systems" - role_recipients_flock[domainadmin]="domains" - role_recipients_flock[dba]="databases systems" - role_recipients_flock[webmaster]="marketing development" - role_recipients_flock[proxyadmin]="proxy-admin" - role_recipients_flock[sitemgr]="sites" - ``` - examples: - folding: - enabled: true - title: '' - list: - - name: 'Basic Configuration' - folding: - enabled: false - description: '' - config: | - #------------------------------------------------------------------------------ - # flock (flock.com) global notification options - - SEND_FLOCK="YES" - FLOCK_WEBHOOK_URL="https://api.flock.com/hooks/sendMessage/XXXXXXXXXXXXXXXXXXXXXXXXXXXXXXX" - DEFAULT_RECIPIENT_FLOCK="alarms" - troubleshooting: - problems: - list: [] diff --git a/health/notifications/gotify/Makefile.inc b/health/notifications/gotify/Makefile.inc deleted file mode 100644 index 78255912..00000000 --- a/health/notifications/gotify/Makefile.inc +++ /dev/null @@ -1,11 +0,0 @@ -# SPDX-License-Identifier: GPL-3.0-or-later - -# THIS IS NOT A COMPLETE Makefile -# IT IS INCLUDED BY ITS PARENT'S Makefile.am -# IT IS REQUIRED TO REFERENCE ALL FILES RELATIVE TO THE PARENT - -# install these files -dist_noinst_DATA += \ - gotify/README.md \ - gotify/Makefile.inc \ - $(NULL) diff --git a/health/notifications/gotify/README.md b/health/notifications/gotify/README.md deleted file mode 100644 index 404de4d8..00000000 --- a/health/notifications/gotify/README.md +++ /dev/null @@ -1,98 +0,0 @@ -<!--startmeta -custom_edit_url: "https://github.com/netdata/netdata/edit/master/health/notifications/gotify/README.md" -meta_yaml: "https://github.com/netdata/netdata/edit/master/health/notifications/gotify/metadata.yaml" -sidebar_label: "Gotify" -learn_status: "Published" -learn_rel_path: "Alerting/Notifications/Agent Dispatched Notifications" -message: "DO NOT EDIT THIS FILE DIRECTLY, IT IS GENERATED BY THE NOTIFICATION'S metadata.yaml FILE" -endmeta--> - -# Gotify - - -<img src="https://netdata.cloud/img/gotify.png" width="150"/> - - -[Gotify](https://gotify.net/) is a self-hosted push notification service created for sending and receiving messages in real time. -You can send alerts to your Gotify instance using Netdata's Agent alert notification feature, which supports dozens of endpoints, user roles, and more. - - - -<img src="https://img.shields.io/badge/maintained%20by-Netdata-%2300ab44" /> - -## Setup - -### Prerequisites - -#### - -- An application token. You can generate a new token in the Gotify Web UI. -- Access to the terminal where Netdata Agent is running - - - -### Configuration - -#### File - -The configuration file name for this integration is `health_alarm_notify.conf`. - - -You can edit the configuration file using the `edit-config` script from the -Netdata [config directory](https://github.com/netdata/netdata/blob/master/docs/configure/nodes.md#the-netdata-config-directory). - -```bash -cd /etc/netdata 2>/dev/null || cd /opt/netdata/etc/netdata -sudo ./edit-config health_alarm_notify.conf -``` -#### Options - -The following options can be defined for this notification - -<details><summary>Config Options</summary> - -| Name | Description | Default | Required | -|:----|:-----------|:-------|:--------:| -| SEND_GOTIFY | Set `SEND_GOTIFY` to YES | YES | yes | -| GOTIFY_APP_TOKEN | set `GOTIFY_APP_TOKEN` to the app token you generated. | | yes | -| GOTIFY_APP_URL | Set `GOTIFY_APP_URL` to point to your Gotify instance, for example `https://push.example.domain/` | | yes | - -</details> - -#### Examples - -##### Basic Configuration - - - -```yaml -SEND_GOTIFY="YES" -GOTIFY_APP_TOKEN="XXXXXXXXXXXXXXX" -GOTIFY_APP_URL="https://push.example.domain/" - -``` - - -## Troubleshooting - -### Test Notification - -You can run the following command by hand, to test alerts configuration: - -```bash -# become user netdata -sudo su -s /bin/bash netdata - -# enable debugging info on the console -export NETDATA_ALARM_NOTIFY_DEBUG=1 - -# send test alarms to sysadmin -/usr/libexec/netdata/plugins.d/alarm-notify.sh test - -# send test alarms to any role -/usr/libexec/netdata/plugins.d/alarm-notify.sh test "ROLE" -``` - -Note that this will test _all_ alert mechanisms for the selected role. - - diff --git a/health/notifications/gotify/metadata.yaml b/health/notifications/gotify/metadata.yaml deleted file mode 100644 index 4552de1c..00000000 --- a/health/notifications/gotify/metadata.yaml +++ /dev/null @@ -1,60 +0,0 @@ -# yamllint disable rule:line-length ---- -- id: 'notify-gotify' - meta: - name: 'Gotify' - link: 'https://gotify.net/' - categories: - - notify.agent - icon_filename: 'gotify.png' - keywords: - - gotify - overview: - notification_description: | - [Gotify](https://gotify.net/) is a self-hosted push notification service created for sending and receiving messages in real time. - You can send alerts to your Gotify instance using Netdata's Agent alert notification feature, which supports dozens of endpoints, user roles, and more. - notification_limitations: '' - setup: - prerequisites: - list: - - title: '' - description: | - - An application token. You can generate a new token in the Gotify Web UI. - - Access to the terminal where Netdata Agent is running - configuration: - file: - name: 'health_alarm_notify.conf' - options: - description: 'The following options can be defined for this notification' - folding: - title: 'Config Options' - enabled: true - list: - - name: 'SEND_GOTIFY' - default_value: 'YES' - description: "Set `SEND_GOTIFY` to YES" - required: true - - name: 'GOTIFY_APP_TOKEN' - default_value: '' - description: "set `GOTIFY_APP_TOKEN` to the app token you generated." - required: true - - name: 'GOTIFY_APP_URL' - default_value: '' - description: "Set `GOTIFY_APP_URL` to point to your Gotify instance, for example `https://push.example.domain/`" - required: true - examples: - folding: - enabled: true - title: '' - list: - - name: 'Basic Configuration' - folding: - enabled: false - description: '' - config: | - SEND_GOTIFY="YES" - GOTIFY_APP_TOKEN="XXXXXXXXXXXXXXX" - GOTIFY_APP_URL="https://push.example.domain/" - troubleshooting: - problems: - list: [] diff --git a/health/notifications/health_alarm_notify.conf b/health/notifications/health_alarm_notify.conf deleted file mode 100755 index f3b67c9d..00000000 --- a/health/notifications/health_alarm_notify.conf +++ /dev/null @@ -1,1271 +0,0 @@ -# Configuration for alarm notifications -# -# This configuration is used by: alarm-notify.sh -# changes take effect immediately (the next alarm will use them). -# -# alarm-notify.sh can send: -# - e-mails (using the sendmail command), -# - push notifications to your mobile phone (pushover.net), -# - messages to your slack team (slack.com), -# - messages to your alerta server (alerta.io), -# - messages to your flock team (flock.com), -# - messages to your discord guild (discord.com), -# - messages to your telegram chat / group chat (telegram.org) -# - sms messages to your cell phone or any sms enabled device (twilio.com) -# - sms messages to your cell phone or any sms enabled device (messagebird.com) -# - sms messages to your cell phone or any sms enabled device (smstools3) -# - notifications to users on pagerduty.com -# - push notifications to iOS devices (via prowlapp.com) -# - notifications to Amazon SNS topics (aws.amazon.com) -# - messages to your irc channel on your selected network -# - messages to a local or remote syslog daemon -# - message to Microsoft Teams (through webhook) -# - message to Rocket.Chat (through webhook) -# - push notifications to your mobile phone or desktop (ntfy.sh) -# -# The 'to' line given at netdata alarms defines a *role*, so that many -# people can be notified for each role. -# -# This file is a BASH script itself. -# -# -#------------------------------------------------------------------------------ -# proxy configuration -# -# If you need to send curl based notifications (pushover, pushbullet, slack, alerta, -# flock, discord, telegram) via a proxy, set these to your proxy address: -#export http_proxy="http://10.0.0.1:3128/" -#export https_proxy="http://10.0.0.1:3128/" - - -#------------------------------------------------------------------------------ -# notifications images -# -# Images in notifications need to be downloaded from an Internet facing site. -# To allow notification providers fetch the icons/images, by default we set -# the URL of the global public netdata registry. -# If you have an Internet facing netdata (or you have copied the images/ folder -# of netdata to your web server), set its URL here, to fetch the notification -# images from it. -#images_base_url="http://my.public.netdata.server:19999" - - -#------------------------------------------------------------------------------ -# date handling -# -# You can configure netdata alerts to send dates in any format you want. -# This uses standard `date` command format strings. See `man date` for -# more info on what you can put in here. Note that this has to start with a '+', otherwise it won't work. -# -# For ISO 8601 dates, use '+%FT%T%z' -# For RFC 5322 dates, use '+%a, %d %b %Y %H:%M:%S %z' -# For RFC 3339 dates, use '+%F %T%:z' -# For RFC 1123 dates, use '+%a, %d %b %Y %H:%M:%S %Z' -# For RFC 1036 dates, use '+%A, %d-%b-%y %H:%M:%S %Z' -# For a reasonably local date and time (in that order), use '+%x %X' -# For the old default behavior (compatible with ANSI C's asctime() function), leave this empty. -date_format='' - - -#------------------------------------------------------------------------------ -# hostname handling -# -# By default, Netdata will use the simple hostname for the system (the -# hostname with everything after the first `.` removed) when displaying -# the hostname in alert notifications. If you prefer, you can uncomment -# the line below to have Netdata instead use the host's fully qualified -# domain name. -# -# This does not report correct FQDN's for child systems for which this -# system is a parent. -# -# Additionally, if the system host name is overridden in /etc/netdata.conf -# with the `hostname` option, that name will be used unconditionally -# instead of this. -#use_fqdn='YES' - - -#------------------------------------------------------------------------------ -# external commands - -# The full path to the sendmail command. -# If empty, the system $PATH will be searched for it. -# If not found, email notifications will be disabled (silently). -sendmail="" - -# The full path of the curl command. -# If empty, the system $PATH will be searched for it. -# If not found, most notifications will be silently disabled. -curl="" - -# The full path of the nc command. -# If empty, the system $PATH will be searched for it. -# If not found, irc notifications will be silently disabled. -nc="" - -# The full path of the logger command. -# If empty, the system $PATH will be searched for it. -# If not found, syslog notifications will be silently disabled. -logger="" - -# The full path of the aws command. -# If empty, the system $PATH will be searched for it. -# If not found, Amazon SNS notifications will be silently disabled. -aws="" - -# The full path of the sendsms command (smstools3). -# If empty, the system $PATH will be searched for it. -# If not found, SMS notifications will be silently disabled. -sendsms="" - -#------------------------------------------------------------------------------ -# extra options for external commands -# -# In some cases, you may need to change what options get passed to an -# external command. Such cases are covered here. - -# Extra options to pass to curl. In most cases, you shouldn't need to add anything -# to this. If you're having issues with HTTPS connections, you might try adding -# '--insecure' here, but be warned that it will make it much easier for -# third-parties to block notification delivery, and may allow disclosure -# of potentially sensitive information. -#curl_options="--insecure" - -# Extra options to pass to logger. You shouldn't have to specify anything -# here in most cases. -#logger_options="" - -#------------------------------------------------------------------------------ -# extra options - -# By default don't do anything if this is CLEAR, but it was not WARNING or CRITICAL. -# You can send it always if your system makes deduplication for alarms. -#clear_alarm_always='YES' - -# -#------------------------------------------------------------------------------ -# NOTE ABOUT RECIPIENTS -# -# When you define recipients (all types): -# -# - emails addresses -# - pushover user tokens -# - telegram chat ids -# - slack channels -# - alerta environment -# - flock rooms -# - discord channels -# - hipchat rooms -# - sms phone numbers -# - pagerduty.com (pd) services -# - irc channels -# -# You can append modifiers to limit the notifications to be sent: -# |critical - Send critical notifications and following status changes until -# the alarm is cleared. -# |nowarn - Do not send warning notifications. -# |noclear - Do not send clear notifications. -# -# In these examples, the first recipient receives all the alarms -# while the second one receives only notifications for alarms that -# have at some point become critical. The second user may still receive -# warning and clear notifications, but only for the event that previously -# caused a critical alarm. -# -# email : "user1@example.com user2@example.com|critical" -# pushover : "2987343...9437837 8756278...2362736|critical" -# telegram : "111827421 112746832|critical" -# slack : "alarms disasters|critical" -# alerta : "alarms disasters|critical" -# flock : "alarms disasters|critical" -# discord : "alarms disasters|critical" -# twilio : "+15555555555 +17777777777|critical" -# messagebird: "+15555555555 +17777777777|critical" -# kavenegar : "09155555555 09177777777|critical" -# pd : "<pd_service_key_1> <pd_service_key_2>|critical" -# irc : "<irc_channel_1> <irc_channel_2>|critical" -# -# You can append multiple modifiers. In this example, recipient receives -# notifications for critical alarms and following status changes except clear -# notifications. -# email : "user1@example.com|critical|noclear" -# -# If a recipient is set to empty string, the default recipient of the given -# notification method (email, pushover, telegram, slack, alerta, etc) will be used. -# To disable a notification, use the recipient called: disabled -# This works for all notification methods (including the default recipients). - - -#------------------------------------------------------------------------------ -# email global notification options - -# multiple recipients can be given like this: -# "admin1@example.com admin2@example.com ..." - -# the email address sending email notifications -# the default is the system user netdata runs as (usually: netdata) -# The following formats are supported: -# EMAIL_SENDER="user@domain" -# EMAIL_SENDER="User Name <user@domain>" -# EMAIL_SENDER="'User Name' <user@domain>" -# EMAIL_SENDER="\"User Name\" <user@domain>" -EMAIL_SENDER="" - -# enable/disable sending emails, set this YES, or NO, AUTO to enable/disable based on sendmail availability -SEND_EMAIL="AUTO" - -# if a role recipient is not configured, an email will be send to: -DEFAULT_RECIPIENT_EMAIL="root" -# to receive only critical alarms, set it to "root|critical" - -# Optionally specify the encoding to list in the Content-Type header. -# This doesn't change what encoding the e-mail is sent with, just what -# the headers say it was encoded as. -# This shouldn't need to be changed as it will almost always be -# autodetected from the environment. -#EMAIL_CHARSET="UTF-8" - -# You can also have netdata add headers to the message that will -# cause most e-mail clients to treat all notifications for a given -# chart+alarm+host combination as a single thread. This can help -# simplify tracking of alarms, as it provides an easy way for scripts -# to correlate messages and also will cause most clients to group all the -# messages together. This is enabled by default, uncomment the line -# below if you want to disable it. -#EMAIL_THREADING="NO" - -# By default, netdata sends HTML and Plain Text emails, some clients -# do not parse HTML emails such as command line clients. -# To make emails readable in these clients, you can configure netdata -# to not send HTML but Plain Text only emails. -#EMAIL_PLAINTEXT_ONLY="YES" - -#------------------------------------------------------------------------------ -# Dynatrace global notification options -#------------------------------------------------------------------------------ -# enable/disable sending Dynatrace notifications -SEND_DYNATRACE="YES" - -# The Dynatrace server with protocol prefix (http:// or https://), example https://monitor.illumineit.com -# Required -DYNATRACE_SERVER="" - -# Generate a Dynatrace API authentication token -# Read https://www.dynatrace.com/support/help/extend-dynatrace/dynatrace-api/basics/dynatrace-api-authentication/ -# On Dynatrace server goto Settings --> Integration --> Dynatrace API --> Generate token -# Required -DYNATRACE_TOKEN="" - -# Beware: Space is taken from dynatrace URL from browser when you create the TOKEN -# Required -DYNATRACE_SPACE="" - -# Generate a Server Tag. On the Dynatrace Server go to Settings --> Tags --> Manually applied tags create the Tag -# The Netdata alarm will be sent as a Dynatrace Event to be correlated with all those hosts tagged with this Tag -# you created. -# Required -DYNATRACE_TAG_VALUE="" - -# Change this to what you want -DYNATRACE_ANNOTATION_TYPE="Netdata Alarm" - -# This can be CUSTOM_INFO, CUSTOM_ANNOTATION, CUSTOM_CONFIGURATION, CUSTOM_DEPLOYMENT -# Applying default value -# Required -DYNATRACE_EVENT="CUSTOM_INFO" - - -DEFAULT_RECIPIENT_DYNATRACE="" - -#------------------------------------------------------------------------------ -# gotify global notification options -SEND_GOTIFY="YES" - -# App token and url -GOTIFY_APP_TOKEN="" -GOTIFY_APP_URL="" - -DEFAULT_RECIPIENT_GOTIFY="" - -#------------------------------------------------------------------------------ -# opsgenie global notification options -SEND_OPSGENIE="YES" - -# Api key -OPSGENIE_API_KEY="" -OPSGENIE_API_URL="" - -DEFAULT_RECIPIENT_OPSGENIE="" - -#------------------------------------------------------------------------------ -# pushover (pushover.net) global notification options - -# multiple recipients can be given like this: -# "USERTOKEN1 USERTOKEN2 ..." - -# enable/disable sending pushover notifications -SEND_PUSHOVER="YES" - -# Login to pushover.net to get your pushover app token. -# You need only one for all your netdata servers (or you can have one for -# each of your netdata - your call). -# Without an app token, netdata cannot send pushover notifications. -PUSHOVER_APP_TOKEN="" - -# if a role's recipients are not configured, a notification will be send to -# this pushover user token (empty = do not send a notification for unconfigured -# roles): -DEFAULT_RECIPIENT_PUSHOVER="" - - -#------------------------------------------------------------------------------ -# pushbullet (pushbullet.com) push notification options - -# multiple recipients can be given like this: -# "user1@email.com user2@mail.com" - -# enable/disable sending pushbullet notifications -SEND_PUSHBULLET="YES" - -# Signup and Login to pushbullet.com -# To get your Access Token, go to https://www.pushbullet.com/#settings/account -# Create a new access token and paste it below. -# Then just set the recipients' emails. -# Please note that the if the email in the DEFAULT_RECIPIENT_PUSHBULLET does -# not have a pushbullet account, the pushbullet service will send an email -# to that address instead. - -# Without an access token, netdata cannot send pushbullet notifications. -PUSHBULLET_ACCESS_TOKEN="" -DEFAULT_RECIPIENT_PUSHBULLET="" - -# Device iden of the sending device. Optional. -PUSHBULLET_SOURCE_DEVICE="" - - -#------------------------------------------------------------------------------ -# Twilio (twilio.com) SMS options - -# multiple recipients can be given like this: -# "+15555555555 +17777777777" - -# enable/disable sending twilio SMS -SEND_TWILIO="YES" - -# Signup for free trial and select a SMS capable Twilio Number -# To get your Account SID and Token, go to https://www.twilio.com/console -# Place your sid, token and number below. -# Then just set the recipients' phone numbers. -# The trial account is only allowed to use the number specified when set up. - -# Without an account sid and token, netdata cannot send Twilio text messages. -TWILIO_ACCOUNT_SID="" -TWILIO_ACCOUNT_TOKEN="" -TWILIO_NUMBER="" -DEFAULT_RECIPIENT_TWILIO="" - - -#------------------------------------------------------------------------------ -# Messagebird (messagebird.com) SMS options - -# multiple recipients can be given like this: -# "+15555555555 +17777777777" - -# enable/disable sending messagebird SMS -SEND_MESSAGEBIRD="YES" - -# to get an access key, create a free account at https://www.messagebird.com -# verify and activate the account (no CC info needed) -# login to your account and enter your phonenumber to get some free credits -# to get the API key, click on 'API' in the sidebar, then 'API Access (REST)' -# click 'Add access key' and fill in data (you want a live key to send SMS) - -# Without an access key, netdata cannot send Messagebird text messages. -MESSAGEBIRD_ACCESS_KEY="" -MESSAGEBIRD_NUMBER="" -DEFAULT_RECIPIENT_MESSAGEBIRD="" - - -#------------------------------------------------------------------------------ -# Kavenegar (Kavenegar.com) SMS options - -# multiple recipients can be given like this: -# "09155555555 09177777777" - -# enable/disable sending kavenegar SMS -SEND_KAVENEGAR="YES" - -# to get an access key, after selecting and purchasing your desired service -# at http://kavenegar.com/pricing.html -# login to your account, go to your dashboard and my account are -# https://panel.kavenegar.com/Client/setting/account from API Key -# copy your api key. You can generate new API Key too. -# You can find and select kevenegar sender number from this place. - -# Without an API key, netdata cannot send KAVENEGAR text messages. -KAVENEGAR_API_KEY="" -KAVENEGAR_SENDER="" -DEFAULT_RECIPIENT_KAVENEGAR="" - - -#------------------------------------------------------------------------------ -# telegram (telegram.org) global notification options - -# multiple recipients can be given like this: -# "CHAT_ID_1 CHAT_ID_2 ..." - -# enable/disable sending telegram messages -SEND_TELEGRAM="YES" - -# Contact the bot @BotFather to create a new bot and receive a bot token. -# Without it, netdata cannot send telegram messages. -TELEGRAM_BOT_TOKEN="" - -# If an API limit error is returned on sending a message, Netdata will retry this number of times before giving up. -# Setting the number to 0 makes Netdata do no retries (which is the default). -# See https://core.telegram.org/bots/faq#my-bot-is-hitting-limits-how-do-i-avoid-this -TELEGRAM_RETRIES_ON_LIMIT="0" - -# To get your chat ID send the command /getid to telegram bot @myidbot -# (https://t.me/myidbot). Each user also needs to open a conversation with the -# bot that will be sending notifications. -# If a role's recipients are not configured, a message will be sent to -# this chat id (empty = do not send a notification for unconfigured roles): -DEFAULT_RECIPIENT_TELEGRAM="" - - -#------------------------------------------------------------------------------ -# slack (slack.com) global notification options - -# multiple recipients can be given like this: -# "RECIPIENT1 RECIPIENT2 ..." - -# enable/disable sending slack notifications -SEND_SLACK="YES" - -# Login to your slack.com workspace and create an incoming webhook, using the "Incoming Webhooks" App: https://slack.com/apps/A0F7XDUAZ-incoming-webhooks -# Do not use the instructions in https://api.slack.com/incoming-webhooks#enable_webhooks, as those webhooks work only for a single channel. -# You need only one for all your netdata servers (or you can have one for each of your netdata). -# Without the app and a webhook, netdata cannot send slack notifications. -SLACK_WEBHOOK_URL="" - -# if a role's recipients are not configured, a notification will be send to: -# - A slack channel (syntax: '#channel' or 'channel') -# - A slack user (syntax: '@user') -# - The channel or user defined in slack for the webhook (syntax: '#') -# empty = do not send a notification for unconfigured roles -DEFAULT_RECIPIENT_SLACK="" - -#------------------------------------------------------------------------------ -# Microsoft Teams (office.com) global notification options -# More details are available here regarding the payload syntax options: -# https://docs.microsoft.com/en-us/outlook/actionable-messages/message-card-reference -# Online designer : https://adaptivecards.io/designer/ -# multiple recipients can be given like this: -# "CHANNEL1 CHANNEL2 ..." - -# enable/disable sending teams notifications -SEND_MSTEAMS="YES" - -# In Microsoft Teams the channel name is encoded in the URI after -# .../IncomingWebhook/... -# You have to replace the encoded channel name by the placeholder `CHANNEL` -# in `MSTEAMS_WEBHOOK_URL`. The placeholder `CHANNEL` will be replaced by the -# actual encoded channel name before sending the notification. -MSTEAMS_WEBHOOK_URL="" - -# if a role's recipients are not configured, a notification will be send to -# this Teams channel (empty = do not send a notification for unconfigured -# roles): -# Put the different encoded channel names here like : "CHANNEL1 CHANNEL2 ..." -# AT LEAST ONE CHANNEL IS MANDATORY -DEFAULT_RECIPIENT_MSTEAMS="" - -# Define the default color scheme for alert to MS Teams - icon and color -# Icons - go to https://emojipedia.org/bomb/ -MSTEAMS_ICON_DEFAULT="♡" -MSTEAMS_ICON_CLEAR="💚" -MSTEAMS_ICON_WARNING="⚠️" -MSTEAMS_ICON_CRITICAL="🔥" - -# Colors -MSTEAMS_COLOR_DEFAULT="0076D7" -MSTEAMS_COLOR_CLEAR="65A677" -MSTEAMS_COLOR_WARNING="FFA500" -MSTEAMS_COLOR_CRITICAL="D93F3C" - - -#------------------------------------------------------------------------------ -# rocketchat (rocket.chat) global notification options - -# multiple recipients can be given like this: -# "CHANNEL1 CHANNEL2 ..." - -# enable/disable sending rocketchat notifications -SEND_ROCKETCHAT="YES" - -# Login to rocket.chat and create an incoming webhook. You need only one for all -# your netdata servers (or you can have one for each of your netdata). -# Without it, netdata cannot send rocketchat notifications. -ROCKETCHAT_WEBHOOK_URL="" - -# if a role's recipients are not configured, a notification will be send to -# this rocketchat channel (empty = do not send a notification for unconfigured -# roles): -DEFAULT_RECIPIENT_ROCKETCHAT="" - - -#------------------------------------------------------------------------------ -# alerta (alerta.io) global notification options - -# multiple recipients (Environments) can be given like this: -# "Production Development ..." - -# enable/disable sending alerta notifications -SEND_ALERTA="YES" - -# here set your alerta server API url -# this is the API url you defined when installed Alerta server, -# it is the same for all users. Do not include last slash. -# ALERTA_WEBHOOK_URL="https://<server>/alerta/api" -ALERTA_WEBHOOK_URL="" - -# Login with an administrative user to you Alerta server and create an API KEY -# with write permissions. -ALERTA_API_KEY="" - -# you can define environments in /etc/alertad.conf option ALLOWED_ENVIRONMENTS -# standard environments are Production and Development -# if a role's recipients are not configured, a notification will be send to -# this Environment (empty = do not send a notification for unconfigured roles): -DEFAULT_RECIPIENT_ALERTA="" - - -#------------------------------------------------------------------------------ -# flock (flock.com) global notification options - -# enable/disable sending flock notifications -SEND_FLOCK="YES" - -# Login to flock.com and create an incoming webhook. You need only one for all -# your netdata servers (or you can have one for each of your netdata). -# Without it, netdata cannot send flock notifications. -FLOCK_WEBHOOK_URL="" - -# if a role recipient is not configured, no notification will be sent -DEFAULT_RECIPIENT_FLOCK="" - - -#------------------------------------------------------------------------------ -# discord (discord.com) global notification options - -# multiple recipients can be given like this: -# "CHANNEL1 CHANNEL2 ..." - -# enable/disable sending discord notifications -SEND_DISCORD="YES" - -# Create a webhook by following the official documentation - -# https://support.discord.com/hc/en-us/articles/228383668-Intro-to-Webhooks -DISCORD_WEBHOOK_URL="" - -# if a role's recipients are not configured, a notification will be send to -# this discord channel (empty = do not send a notification for unconfigured -# roles): -DEFAULT_RECIPIENT_DISCORD="" - - -#------------------------------------------------------------------------------ -# hipchat global notification options - -# multiple recipients can be given like this: -# "ROOM1 ROOM2 ..." - -# enable/disable sending hipchat notifications -SEND_HIPCHAT="YES" - -# define hipchat server -HIPCHAT_SERVER="api.hipchat.com" - -# api.hipchat.com authorization token -# Without this, netdata cannot send hipchat notifications. -HIPCHAT_AUTH_TOKEN="" - -# if a role's recipients are not configured, a notification will be send to -# this hipchat room (empty = do not send a notification for unconfigured -# roles): -DEFAULT_RECIPIENT_HIPCHAT="" - - -#------------------------------------------------------------------------------ -# kafka notification options - -# enable/disable sending kafka notifications -SEND_KAFKA="YES" - -# The URL to POST kafka alarm data to. It should be the full URL. -KAFKA_URL="" - -# The IP to be used in the kafka message as the sender. -KAFKA_SENDER_IP="" - - -#------------------------------------------------------------------------------ -# pagerduty.com notification options -# -# pagerduty.com notifications require a "Generic API" (Events v1) -# pagerduty service. -# https://support.pagerduty.com/docs/services-and-integrations - -# multiple recipients can be given like this: -# "<pd_service_key_1> <pd_service_key_2> ..." - -# enable/disable sending pagerduty notifications -SEND_PD="YES" - -# if a role's recipients are not configured, a notification will be sent to -# the "General API" pagerduty.com service that uses this service key. -# (empty = do not send a notification for unconfigured roles): -DEFAULT_RECIPIENT_PD="" - -# Which PD API are we going to use? For version 2 or newer, it is necessary to do a request for Pagerduty -# before to set the version(https://developer.pagerduty.com/docs/events-api-v2/overview/). -USE_PD_VERSION="1" - -#------------------------------------------------------------------------------ -# fleep notification options -# -# To send fleep.io notifications, you will need a webhook for the -# conversation you want to send to. - -# Fleep recipients are specified as the last part of the webhook URL. -# So, for a webhook URL of: https://fleep.io/hook/IJONmBuuSlWlkb_ttqyXJg, the -# recipient name would be: 'IJONmBuuSlWlkb_ttqyXJg'. - -# enable/disable sending fleep notifications -SEND_FLEEP="YES" - -# if a role's recipients are not configured, a notification will not be sent. -# (empty = do not send a notification for unconfigured roles): -DEFAULT_RECIPIENT_FLEEP="" - -# The user name to label the messages with. If this is unset, -# the hostname of the system the notification is for will be used. -FLEEP_SENDER="" - - -#------------------------------------------------------------------------------ -# irc notification options -# -# irc notifications require only the nc utility to be installed. - -# multiple recipients can be given like this: -# "<irc_channel_1> <irc_channel_2> ..." - -# enable/disable sending irc notifications -SEND_IRC="YES" - -# if a role's recipients are not configured, a notification will not be sent. -# (empty = do not send a notification for unconfigured roles): -DEFAULT_RECIPIENT_IRC="" - -# The irc network to which the recipients belong. It must be the full network. -# e.g. "irc.freenode.net" -IRC_NETWORK="" - -# The irc port to which a connection will occur. -# e.g. 6667 (the default one), 6697 (a TLS/SSL one) -IRC_PORT=6667 - -# The irc nickname which is required to send the notification. It must not be -# an already registered name as the connection's MODE is defined as a 'guest'. -IRC_NICKNAME="" - -# The irc realname which is required in order to make the connection and is an -# extra identifier. -IRC_REALNAME="" - - -#------------------------------------------------------------------------------ -# syslog notifications -# -# syslog notifications only need you to have a working logger command, which -# should be the case on pretty much any Linux system. - -# enable/disable sending syslog notifications -# NOTE: make sure you have everything else configured the way you want -# it _before_ turning this on. -SEND_SYSLOG="NO" - -# A note on log levels and facilities: -# -# The traditional UNIX syslog mechanism has the concept of both log -# levels and facilities. A log level indicates the relative severity of -# the message, while a facility specifies a generic source for the message -# (for example, the `mail` facility is where sendmail and postfix log -# their messages). All major syslog daemons have the ability to filter -# messages based on both log level and facility, and can often also make -# routing decisions for messages based on both factors. -# -# On Linux, the eight log levels in decreasing order of severity are: -# emerg, alert, crit, err, warning, notice, info, debug -# -# By default, warnings will be logged at the warning level, critical -# alerts at the crit level, and clear notifications at the invo level. -# -# And the 19 facilities you can log to are: -# auth, authpriv, cron, daemon, ftp, lpr, mail, news, syslog, user, -# uucp, local0, local1, local2, local3, local4, local5, local6, and local7 -# -# By default, netdata alerts will be logged to the local6 facility. -# -# Depending on your distribution, this means that either all your -# netdata alerts will by default end up in the main system log (usually -# /var/log/messages), or they won't be logged to a file at all. -# Neither of these are likely to be what you actually want, but any -# configuration to change that needs to happen in the syslog daemon -# configuration, not here. - -# This controls which facility is used by default for logging. Defaults -# to local6. -SYSLOG_FACILITY='' - -# If a role's recipients are not configured, use the following. -# (empty = do not send a notification for unconfigured roles) -# -# The recipient format for syslog uses the following format: -# [[facility.level][@host[:port]]/]prefix -# -# `prefix` gets appended to the front of all log messages generated for -# that recipient. The prefix is mandatory. -# 'host' and 'port' can be used to specify a remote syslog server to -# send messages to. Leave these out if you want messages to be delivered -# locally. 'host' can be either a hostname or an IP address. -# IPv6 addresses must have square around them. -# 'facility' and 'level' are used to override the default logging facility -# set above and the log level. If one is specified, both must be present. -# -# For example, to send messages with a 'netdata' prefix to a syslog -# daemon listening on port 514 on 'loghost' using the daemon facility and -# notice log level: -# DEFAULT_RECIPIENT_SYSLOG='daemon.notice@loghost:514/netdata' -# -DEFAULT_RECIPIENT_SYSLOG="netdata" - -#------------------------------------------------------------------------------ -# iOS Push Notifications - -# enable/disable sending iOS push notifications -SEND_PROWL="YES" - -# If a role's recipients are not configured, use the following, -# (empty = do not send a notification for unconfigured roles) -# -# Recipients for iOS push notifications are Prowl API keys. -# -# A recipient may also consist of multiple Prowl API keys separated by -# commas, in which case notifications will be simultaneously sent for all -# of those API keys. -DEFAULT_RECIPIENT_PROWL="" - -#------------------------------------------------------------------------------ -# Amazon SNS notifications -# -# This method requires potentially complex manual configuration. See the -# netdata wiki for information on what is needed. - -# enable/disable sending Amazon SNS notifications -SEND_AWSSNS="YES" - -# Specify a template for the Amazon SNS notifications. This supports -# the same set of variables that are usable in the `custom_sender()` -# function in the custom notification configuration below. -# -AWSSNS_MESSAGE_FORMAT="${status} on ${host} at ${date}: ${chart} ${value_string}" - -# If a role's recipients are not configured, use the following. -# (empty = do not send a notification for unconfigured roles) -# -# Recipients for AWS SNS notifications are specified as topic ARN's. -# -DEFAULT_RECIPIENT_AWSSNS="" - -#------------------------------------------------------------------------------ -# SMS Server Tools 3 (smstools3) global notification options - -# enable/disable sending SMS Server Tools 3 SMS notifications -SEND_SMS="YES" - -# if a role's recipients are not configured, a notification will be sent to -# this SMS channel (empty = do not send a notification for unconfigured -# roles). Multiple recipients can be given like this: "PHONE1 PHONE2 ..." - -DEFAULT_RECIPIENT_SMS="" - -# Matrix notifications -# - -# enable/disable Matrix notifications -SEND_MATRIX="YES" - -# The url of the Matrix homeserver -# e.g https://matrix.org:8448 -MATRIX_HOMESERVER= - -# An access token from a valid Matrix account. Tokens usually don't expire, -# can be controlled from a Matrix client. -# See https://matrix.org/docs/guides/client-server.html -MATRIX_ACCESSTOKEN= - -# Specify the default rooms to receive the notification if no rooms are provided -# in a role's recipients. -# The format is !roomid:homeservername -DEFAULT_RECIPIENT_MATRIX="" - -#------------------------------------------------------------------------------ -# ntfy.sh global notification options - -# enable/disable sending ntfy notifications -SEND_NTFY="YES" - -# optional NTFY username -NTFY_USERNAME="" - -# optional NTFY password -NTFY_PASSWORD="" - -# optional NTFY access token -NTFY_ACCESS_TOKEN="" - -# if a role's recipients are not configured, a notification will be sent to -# this ntfy server / topic combination (empty = do not send a notification for -# unconfigured roles). -# Multiple recipients can be given like this: "https://SERVER1/TOPIC1 https://SERVER2/TOPIC2 ..." -DEFAULT_RECIPIENT_NTFY="" - -#------------------------------------------------------------------------------ -# custom notifications -# - -# enable/disable sending custom notifications -SEND_CUSTOM="YES" - -# if a role's recipients are not configured, use the following. -# (empty = do not send a notification for unconfigured roles) -DEFAULT_RECIPIENT_CUSTOM="" - -# The custom_sender() is a custom function to do whatever you need to do -custom_sender() { - # variables you can use: - # ${host} the host generated this event - # ${url_host} same as ${host} but URL encoded - # ${unique_id} the unique id of this event - # ${alarm_id} the unique id of the alarm that generated this event - # ${event_id} the incremental id of the event, for this alarm id - # ${when} the timestamp this event occurred - # ${name} the name of the alarm, as given in netdata health.d entries - # ${url_name} same as ${name} but URL encoded - # ${chart} the name of the chart (type.id) - # ${url_chart} same as ${chart} but URL encoded - # ${status} the current status : REMOVED, UNINITIALIZED, UNDEFINED, CLEAR, WARNING, CRITICAL - # ${old_status} the previous status: REMOVED, UNINITIALIZED, UNDEFINED, CLEAR, WARNING, CRITICAL - # ${value} the current value of the alarm - # ${old_value} the previous value of the alarm - # ${src} the line number and file the alarm has been configured - # ${duration} the duration in seconds of the previous alarm state - # ${duration_txt} same as ${duration} for humans - # ${non_clear_duration} the total duration in seconds this is/was non-clear - # ${non_clear_duration_txt} same as ${non_clear_duration} for humans - # ${units} the units of the value - # ${info} a short description of the alarm - # ${value_string} friendly value (with units) - # ${old_value_string} friendly old value (with units) - # ${image} the URL of an image to represent the status of the alarm - # ${color} a color in #AABBCC format for the alarm - # ${goto_url} the URL the user can click to see the netdata dashboard - # ${calc_expression} the expression evaluated to provide the value for the alarm - # ${calc_param_values} the value of the variables in the evaluated expression - # ${total_warnings} the total number of alarms in WARNING state on the host - # ${total_critical} the total number of alarms in CRITICAL state on the host - - # these are more human friendly: - # ${alarm} like "name = value units" - # ${status_message} like "needs attention", "recovered", "is critical" - # ${severity} like "Escalated to CRITICAL", "Recovered from WARNING" - # ${raised_for} like "(alarm was raised for 10 minutes)" - - # example human readable SMS - local msg="${host} ${status_message}: ${alarm} ${raised_for}" - - # limit it to 160 characters and encode it for use in a URL - urlencode "${msg:0:160}" >/dev/null; msg="${REPLY}" - - # a space separated list of the recipients to send alarms to - to="${1}" - - # Sample send SMS to an imaginary SMS gateway accessible via HTTPS - #for phone in ${to}; do - # httpcode=$(docurl -X POST \ - # --data-urlencode "From=XXX" \ - # --data-urlencode "To=${phone}" \ - # --data-urlencode "Body=${msg}" \ - # -u "${accountsid}:${accounttoken}" \ - # https://domain.website.com/) - # - # if [ "${httpcode}" = "200" ]; then - # info "sent custom notification ${msg} to ${phone}" - # sent=$((sent + 1)) - # else - # error "failed to send custom notification ${msg} to ${phone} with HTTP error code ${httpcode}." - # fi - #done - - info "not sending custom notification to ${to}, for ${status} of '${host}.${chart}.${name}' - custom_sender() is not configured." -} - - -############################################################################### -# RECIPIENTS PER ROLE - -# ----------------------------------------------------------------------------- -# generic system alarms -# CPU, disks, network interfaces, entropy, etc - -# role_recipients_email[sysadmin]="${DEFAULT_RECIPIENT_EMAIL}" - -# role_recipients_pushover[sysadmin]="${DEFAULT_RECIPIENT_PUSHOVER}" - -# role_recipients_pushbullet[sysadmin]="${DEFAULT_RECIPIENT_PUSHBULLET}" - -# role_recipients_telegram[sysadmin]="${DEFAULT_RECIPIENT_TELEGRAM}" - -# role_recipients_slack[sysadmin]="${DEFAULT_RECIPIENT_SLACK}" - -# role_recipients_alerta[sysadmin]="${DEFAULT_RECIPIENT_ALERTA}" - -# role_recipients_flock[sysadmin]="${DEFAULT_RECIPIENT_FLOCK}" - -# role_recipients_discord[sysadmin]="${DEFAULT_RECIPIENT_DISCORD}" - -# role_recipients_hipchat[sysadmin]="${DEFAULT_RECIPIENT_HIPCHAT}" - -# role_recipients_twilio[sysadmin]="${DEFAULT_RECIPIENT_TWILIO}" - -# role_recipients_messagebird[sysadmin]="${DEFAULT_RECIPIENT_MESSAGEBIRD}" - -# role_recipients_kavenegar[sysadmin]="${DEFAULT_RECIPIENT_KAVENEGAR}" - -# role_recipients_pd[sysadmin]="${DEFAULT_RECIPIENT_PD}" - -# role_recipients_fleep[sysadmin]="${DEFAULT_RECIPIENT_FLEEP}" - -# role_recipients_irc[sysadmin]="${DEFAULT_RECIPIENT_IRC}" - -# role_recipients_syslog[sysadmin]="${DEFAULT_RECIPIENT_SYSLOG}" - -# role_recipients_prowl[sysadmin]="${DEFAULT_RECIPIENT_PROWL}" - -# role_recipients_awssns[sysadmin]="${DEFAULT_RECIPIENT_AWSSNS}" - -# role_recipients_custom[sysadmin]="${DEFAULT_RECIPIENT_CUSTOM}" - -# role_recipients_msteams[sysadmin]="${DEFAULT_RECIPIENT_MSTEAMS}" - -# role_recipients_rocketchat[sysadmin]="${DEFAULT_RECIPIENT_ROCKETCHAT}" - -# role_recipients_dynatrace[sysadmin]="${DEFAULT_RECIPIENT_DYNATRACE}" - -# role_recipients_opsgenie[sysadmin]="${DEFAULT_RECIPIENT_OPSGENIE}" - -# role_recipients_matrix[sysadmin]="${DEFAULT_RECIPIENT_MATRIX}" - -# role_recipients_gotify[sysadmin]="${DEFAULT_RECIPIENT_GOTIFY}" - -# role_recipients_ntfy[sysadmin]="${DEFAULT_RECIPIENT_NTFY}" - -# ----------------------------------------------------------------------------- -# DNS related alarms - -# role_recipients_email[domainadmin]="${DEFAULT_RECIPIENT_EMAIL}" - -# role_recipients_pushover[domainadmin]="${DEFAULT_RECIPIENT_PUSHOVER}" - -# role_recipients_pushbullet[domainadmin]="${DEFAULT_RECIPIENT_PUSHBULLET}" - -# role_recipients_telegram[domainadmin]="${DEFAULT_RECIPIENT_TELEGRAM}" - -# role_recipients_slack[domainadmin]="${DEFAULT_RECIPIENT_SLACK}" - -# role_recipients_alerta[domainadmin]="${DEFAULT_RECIPIENT_ALERTA}" - -# role_recipients_flock[domainadmin]="${DEFAULT_RECIPIENT_FLOCK}" - -# role_recipients_discord[domainadmin]="${DEFAULT_RECIPIENT_DISCORD}" - -# role_recipients_hipchat[domainadmin]="${DEFAULT_RECIPIENT_HIPCHAT}" - -# role_recipients_twilio[domainadmin]="${DEFAULT_RECIPIENT_TWILIO}" - -# role_recipients_messagebird[domainadmin]="${DEFAULT_RECIPIENT_MESSAGEBIRD}" - -# role_recipients_kavenegar[domainadmin]="${DEFAULT_RECIPIENT_KAVENEGAR}" - -# role_recipients_pd[domainadmin]="${DEFAULT_RECIPIENT_PD}" - -# role_recipients_fleep[domainadmin]="${DEFAULT_RECIPIENT_FLEEP}" - -# role_recipients_irc[domainadmin]="${DEFAULT_RECIPIENT_IRC}" - -# role_recipients_syslog[domainadmin]="${DEFAULT_RECIPIENT_SYSLOG}" - -# role_recipients_prowl[domainadmin]="${DEFAULT_RECIPIENT_PROWL}" - -# role_recipients_awssns[domainadmin]="${DEFAULT_RECIPIENT_AWSSNS}" - -# role_recipients_custom[domainadmin]="${DEFAULT_RECIPIENT_CUSTOM}" - -# role_recipients_msteams[domainadmin]="${DEFAULT_RECIPIENT_MSTEAMS}" - -# role_recipients_rocketchat[domainadmin]="${DEFAULT_RECIPIENT_ROCKETCHAT}" - -# role_recipients_sms[domainadmin]="${DEFAULT_RECIPIENT_SMS}" - -# role_recipients_dynatrace[domainadmin]="${DEFAULT_RECIPIENT_DYNATRACE}" - -# role_recipients_opsgenie[domainadmin]="${DEFAULT_RECIPIENT_OPSGENIE}" - -# role_recipients_matrix[domainadmin]="${DEFAULT_RECIPIENT_MATRIX}" - -# role_recipients_gotify[domainadmin]="${DEFAULT_RECIPIENT_GOTIFY}" - -# role_recipients_ntfy[domainadmin]="${DEFAULT_RECIPIENT_NTFY}" - -# ----------------------------------------------------------------------------- -# database servers alarms -# mysql, redis, memcached, postgres, etc - -# role_recipients_email[dba]="${DEFAULT_RECIPIENT_EMAIL}" - -# role_recipients_pushover[dba]="${DEFAULT_RECIPIENT_PUSHOVER}" - -# role_recipients_pushbullet[dba]="${DEFAULT_RECIPIENT_PUSHBULLET}" - -# role_recipients_telegram[dba]="${DEFAULT_RECIPIENT_TELEGRAM}" - -# role_recipients_slack[dba]="${DEFAULT_RECIPIENT_SLACK}" - -# role_recipients_alerta[dba]="${DEFAULT_RECIPIENT_ALERTA}" - -# role_recipients_flock[dba]="${DEFAULT_RECIPIENT_FLOCK}" - -# role_recipients_discord[dba]="${DEFAULT_RECIPIENT_DISCORD}" - -# role_recipients_hipchat[dba]="${DEFAULT_RECIPIENT_HIPCHAT}" - -# role_recipients_twilio[dba]="${DEFAULT_RECIPIENT_TWILIO}" - -# role_recipients_messagebird[dba]="${DEFAULT_RECIPIENT_MESSAGEBIRD}" - -# role_recipients_kavenegar[dba]="${DEFAULT_RECIPIENT_KAVENEGAR}" - -# role_recipients_pd[dba]="${DEFAULT_RECIPIENT_PD}" - -# role_recipients_fleep[dba]="${DEFAULT_RECIPIENT_FLEEP}" - -# role_recipients_irc[dba]="${DEFAULT_RECIPIENT_IRC}" - -# role_recipients_syslog[dba]="${DEFAULT_RECIPIENT_SYSLOG}" - -# role_recipients_prowl[dba]="${DEFAULT_RECIPIENT_PROWL}" - -# role_recipients_awssns[dba]="${DEFAULT_RECIPIENT_AWSSNS}" - -# role_recipients_custom[dba]="${DEFAULT_RECIPIENT_CUSTOM}" - -# role_recipients_msteams[dba]="${DEFAULT_RECIPIENT_MSTEAMS}" - -# role_recipients_rocketchat[dba]="${DEFAULT_RECIPIENT_ROCKETCHAT}" - -# role_recipients_sms[dba]="${DEFAULT_RECIPIENT_SMS}" - -# role_recipients_dynatrace[dba]="${DEFAULT_RECIPIENT_DYNATRACE}" - -# role_recipients_opsgenie[dba]="${DEFAULT_RECIPIENT_OPSGENIE}" - -# role_recipients_matrix[dba]="${DEFAULT_RECIPIENT_MATRIX}" - -# role_recipients_gotify[dba]="${DEFAULT_RECIPIENT_GOTIFY}" - -# role_recipients_ntfy[dba]="${DEFAULT_RECIPIENT_NTFY}" - -# ----------------------------------------------------------------------------- -# web servers alarms -# apache, nginx, lighttpd, etc - -# role_recipients_email[webmaster]="${DEFAULT_RECIPIENT_EMAIL}" - -# role_recipients_pushover[webmaster]="${DEFAULT_RECIPIENT_PUSHOVER}" - -# role_recipients_pushbullet[webmaster]="${DEFAULT_RECIPIENT_PUSHBULLET}" - -# role_recipients_telegram[webmaster]="${DEFAULT_RECIPIENT_TELEGRAM}" - -# role_recipients_slack[webmaster]="${DEFAULT_RECIPIENT_SLACK}" - -# role_recipients_alerta[webmaster]="${DEFAULT_RECIPIENT_ALERTA}" - -# role_recipients_flock[webmaster]="${DEFAULT_RECIPIENT_FLOCK}" - -# role_recipients_discord[webmaster]="${DEFAULT_RECIPIENT_DISCORD}" - -# role_recipients_hipchat[webmaster]="${DEFAULT_RECIPIENT_HIPCHAT}" - -# role_recipients_twilio[webmaster]="${DEFAULT_RECIPIENT_TWILIO}" - -# role_recipients_messagebird[webmaster]="${DEFAULT_RECIPIENT_MESSAGEBIRD}" - -# role_recipients_kavenegar[webmaster]="${DEFAULT_RECIPIENT_KAVENEGAR}" - -# role_recipients_pd[webmaster]="${DEFAULT_RECIPIENT_PD}" - -# role_recipients_fleep[webmaster]="${DEFAULT_RECIPIENT_FLEEP}" - -# role_recipients_irc[webmaster]="${DEFAULT_RECIPIENT_IRC}" - -# role_recipients_syslog[webmaster]="${DEFAULT_RECIPIENT_SYSLOG}" - -# role_recipients_prowl[webmaster]="${DEFAULT_RECIPIENT_PROWL}" - -# role_recipients_awssns[webmaster]="${DEFAULT_RECIPIENT_AWSSNS}" - -# role_recipients_custom[webmaster]="${DEFAULT_RECIPIENT_CUSTOM}" - -# role_recipients_msteams[webmaster]="${DEFAULT_RECIPIENT_MSTEAMS}" - -# role_recipients_rocketchat[webmaster]="${DEFAULT_RECIPIENT_ROCKETCHAT}" - -# role_recipients_sms[webmaster]="${DEFAULT_RECIPIENT_SMS}" - -# role_recipients_dynatrace[webmaster]="${DEFAULT_RECIPIENT_DYNATRACE}" - -# role_recipients_opsgenie[webmaster]="${DEFAULT_RECIPIENT_OPSGENIE}" - -# role_recipients_matrix[webmaster]="${DEFAULT_RECIPIENT_MATRIX}" - -# role_recipients_gotify[webmaster]="${DEFAULT_RECIPIENT_GOTIFY}" - -# role_recipients_ntfy[webmaster]="${DEFAULT_RECIPIENT_NTFY}" - -# ----------------------------------------------------------------------------- -# proxy servers alarms -# squid, etc - -# role_recipients_email[proxyadmin]="${DEFAULT_RECIPIENT_EMAIL}" - -# role_recipients_pushover[proxyadmin]="${DEFAULT_RECIPIENT_PUSHOVER}" - -# role_recipients_pushbullet[proxyadmin]="${DEFAULT_RECIPIENT_PUSHBULLET}" - -# role_recipients_telegram[proxyadmin]="${DEFAULT_RECIPIENT_TELEGRAM}" - -# role_recipients_slack[proxyadmin]="${DEFAULT_RECIPIENT_SLACK}" - -# role_recipients_alerta[proxyadmin]="${DEFAULT_RECIPIENT_ALERTA}" - -# role_recipients_flock[proxyadmin]="${DEFAULT_RECIPIENT_FLOCK}" - -# role_recipients_discord[proxyadmin]="${DEFAULT_RECIPIENT_DISCORD}" - -# role_recipients_hipchat[proxyadmin]="${DEFAULT_RECIPIENT_HIPCHAT}" - -# role_recipients_twilio[proxyadmin]="${DEFAULT_RECIPIENT_TWILIO}" - -# role_recipients_messagebird[proxyadmin]="${DEFAULT_RECIPIENT_MESSAGEBIRD}" - -# role_recipients_kavenegar[proxyadmin]="${DEFAULT_RECIPIENT_KAVENEGAR}" - -# role_recipients_pd[proxyadmin]="${DEFAULT_RECIPIENT_PD}" - -# role_recipients_fleep[proxyadmin]="${DEFAULT_RECIPIENT_FLEEP}" - -# role_recipients_irc[proxyadmin]="${DEFAULT_RECIPIENT_IRC}" - -# role_recipients_syslog[proxyadmin]="${DEFAULT_RECIPIENT_SYSLOG}" - -# role_recipients_prowl[proxyadmin]="${DEFAULT_RECIPIENT_PROWL}" - -# role_recipients_awssns[proxyadmin]="${DEFAULT_RECIPIENT_AWSSNS}" - -# role_recipients_custom[proxyadmin]="${DEFAULT_RECIPIENT_CUSTOM}" - -# role_recipients_msteams[proxyadmin]="${DEFAULT_RECIPIENT_MSTEAMS}" - -# role_recipients_rocketchat[proxyadmin]="${DEFAULT_RECIPIENT_ROCKETCHAT}" - -# role_recipients_sms[proxyadmin]="${DEFAULT_RECIPIENT_SMS}" - -# role_recipients_dynatrace[proxyadmin]="${DEFAULT_RECIPIENT_DYNATRACE}" - -# role_recipients_opsgenie[proxyadmin]="${DEFAULT_RECIPIENT_OPSGENIE}" - -# role_recipients_matrix[proxyadmin]="${DEFAULT_RECIPIENT_MATRIX}" - -# role_recipients_gotify[proxyadmin]="${DEFAULT_RECIPIENT_GOTIFY}" - -# role_recipients_ntfy[proxyadmin]="${DEFAULT_RECIPIENT_NTFY}" - -# ----------------------------------------------------------------------------- -# peripheral devices -# UPS, photovoltaics, etc - -# role_recipients_email[sitemgr]="${DEFAULT_RECIPIENT_EMAIL}" - -# role_recipients_pushover[sitemgr]="${DEFAULT_RECIPIENT_PUSHOVER}" - -# role_recipients_pushbullet[sitemgr]="${DEFAULT_RECIPIENT_PUSHBULLET}" - -# role_recipients_telegram[sitemgr]="${DEFAULT_RECIPIENT_TELEGRAM}" - -# role_recipients_slack[sitemgr]="${DEFAULT_RECIPIENT_SLACK}" - -# role_recipients_alerta[sitemgr]="${DEFAULT_RECIPIENT_ALERTA}" - -# role_recipients_flock[sitemgr]="${DEFAULT_RECIPIENT_FLOCK}" - -# role_recipients_discord[sitemgr]="${DEFAULT_RECIPIENT_DISCORD}" - -# role_recipients_hipchat[sitemgr]="${DEFAULT_RECIPIENT_HIPCHAT}" - -# role_recipients_twilio[sitemgr]="${DEFAULT_RECIPIENT_TWILIO}" - -# role_recipients_messagebird[sitemgr]="${DEFAULT_RECIPIENT_MESSAGEBIRD}" - -# role_recipients_kavenegar[sitemgr]="${DEFAULT_RECIPIENT_KAVENEGAR}" - -# role_recipients_pd[sitemgr]="${DEFAULT_RECIPIENT_PD}" - -# role_recipients_fleep[sitemgr]="${DEFAULT_RECIPIENT_FLEEP}" - -# role_recipients_syslog[sitemgr]="${DEFAULT_RECIPIENT_SYSLOG}" - -# role_recipients_prowl[sitemgr]="${DEFAULT_RECIPIENT_PROWL}" - -# role_recipients_awssns[sitemgr]="${DEFAULT_RECIPIENT_AWSSNS}" - -# role_recipients_custom[sitemgr]="${DEFAULT_RECIPIENT_CUSTOM}" - -# role_recipients_msteams[sitemgr]="${DEFAULT_RECIPIENT_MSTEAMS}" - -# role_recipients_rocketchat[sitemgr]="${DEFAULT_RECIPIENT_ROCKETCHAT}" - -# role_recipients_sms[sitemgr]="${DEFAULT_RECIPIENT_SMS}" - -# role_recipients_dynatrace[sitemgr]="${DEFAULT_RECIPIENT_DYNATRACE}" - -# role_recipients_opsgenie[sitemgr]="${DEFAULT_RECIPIENT_OPSGENIE}" - -# role_recipients_matrix[sitemgr]="${DEFAULT_RECIPIENT_MATRIX}" - -# role_recipients_gotify[sitemgr]="${DEFAULT_RECIPIENT_GOTIFY}" - -# role_recipients_ntfy[sitemgr]="${DEFAULT_RECIPIENT_NTFY}" diff --git a/health/notifications/health_email_recipients.conf b/health/notifications/health_email_recipients.conf deleted file mode 100644 index f56c6c64..00000000 --- a/health/notifications/health_email_recipients.conf +++ /dev/null @@ -1,2 +0,0 @@ -# OBSOLETE FILE -# REPLACED WITH health_alarm_notify.conf diff --git a/health/notifications/irc/Makefile.inc b/health/notifications/irc/Makefile.inc deleted file mode 100644 index 1a68f657..00000000 --- a/health/notifications/irc/Makefile.inc +++ /dev/null @@ -1,12 +0,0 @@ -# SPDX-License-Identifier: GPL-3.0-or-later - -# THIS IS NOT A COMPLETE Makefile -# IT IS INCLUDED BY ITS PARENT'S Makefile.am -# IT IS REQUIRED TO REFERENCE ALL FILES RELATIVE TO THE PARENT - -# install these files -dist_noinst_DATA += \ - irc/README.md \ - irc/Makefile.inc \ - $(NULL) - diff --git a/health/notifications/irc/README.md b/health/notifications/irc/README.md deleted file mode 100644 index 60faa7b2..00000000 --- a/health/notifications/irc/README.md +++ /dev/null @@ -1,132 +0,0 @@ -<!--startmeta -custom_edit_url: "https://github.com/netdata/netdata/edit/master/health/notifications/irc/README.md" -meta_yaml: "https://github.com/netdata/netdata/edit/master/health/notifications/irc/metadata.yaml" -sidebar_label: "IRC" -learn_status: "Published" -learn_rel_path: "Alerting/Notifications/Agent Dispatched Notifications" -message: "DO NOT EDIT THIS FILE DIRECTLY, IT IS GENERATED BY THE NOTIFICATION'S metadata.yaml FILE" -endmeta--> - -# IRC - - -<img src="https://netdata.cloud/img/irc.png" width="150"/> - - -Send notifications to IRC using Netdata's Agent alert notification feature, which supports dozens of endpoints, user roles, and more. - - - -<img src="https://img.shields.io/badge/maintained%20by-Netdata-%2300ab44" /> - -## Setup - -### Prerequisites - -#### - -- The `nc` utility. You can set the path to it, or Netdata will search for it in your system `$PATH`. -- Access to the terminal where Netdata Agent is running - - - -### Configuration - -#### File - -The configuration file name for this integration is `health_alarm_notify.conf`. - - -You can edit the configuration file using the `edit-config` script from the -Netdata [config directory](https://github.com/netdata/netdata/blob/master/docs/configure/nodes.md#the-netdata-config-directory). - -```bash -cd /etc/netdata 2>/dev/null || cd /opt/netdata/etc/netdata -sudo ./edit-config health_alarm_notify.conf -``` -#### Options - -The following options can be defined for this notification - -<details><summary>Config Options</summary> - -| Name | Description | Default | Required | -|:----|:-----------|:-------|:--------:| -| nc path | Set the path for nc, otherwise Netdata will search for it in your system $PATH | | yes | -| SEND_IRC | Set `SEND_IRC` YES. | YES | yes | -| IRC_NETWORK | Set `IRC_NETWORK` to the IRC network which your preferred channels belong to. | | yes | -| IRC_PORT | Set `IRC_PORT` to the IRC port to which a connection will occur. | | no | -| IRC_NICKNAME | Set `IRC_NICKNAME` to the IRC nickname which is required to send the notification. It must not be an already registered name as the connection's MODE is defined as a guest. | | yes | -| IRC_REALNAME | Set `IRC_REALNAME` to the IRC realname which is required in order to make the connection. | | yes | -| DEFAULT_RECIPIENT_IRC | You can have different channels per role, by editing `DEFAULT_RECIPIENT_IRC` with the channel you want | | yes | - -##### nc path - -```sh -#------------------------------------------------------------------------------ -# external commands -# -# The full path of the nc command. -# If empty, the system $PATH will be searched for it. -# If not found, irc notifications will be silently disabled. -nc="/usr/bin/nc" -``` - - -##### DEFAULT_RECIPIENT_IRC - -The `DEFAULT_RECIPIENT_IRC` can be edited in the following entries at the bottom of the same file: -```conf -role_recipients_irc[sysadmin]="#systems" -role_recipients_irc[domainadmin]="#domains" -role_recipients_irc[dba]="#databases #systems" -role_recipients_irc[webmaster]="#marketing #development" -role_recipients_irc[proxyadmin]="#proxy-admin" -role_recipients_irc[sitemgr]="#sites" -``` - - -</details> - -#### Examples - -##### Basic Configuration - - - -```yaml -#------------------------------------------------------------------------------ -# irc notification options -# -SEND_IRC="YES" -DEFAULT_RECIPIENT_IRC="#system-alarms" -IRC_NETWORK="irc.freenode.net" -IRC_NICKNAME="netdata-alarm-user" -IRC_REALNAME="netdata-user" - -``` - - -## Troubleshooting - -### Test Notification - -You can run the following command by hand, to test alerts configuration: - -```bash -# become user netdata -sudo su -s /bin/bash netdata - -# enable debugging info on the console -export NETDATA_ALARM_NOTIFY_DEBUG=1 - -# send test alarms to sysadmin -/usr/libexec/netdata/plugins.d/alarm-notify.sh test - -# send test alarms to any role -/usr/libexec/netdata/plugins.d/alarm-notify.sh test "ROLE" -``` - -Note that this will test _all_ alert mechanisms for the selected role. - - diff --git a/health/notifications/irc/metadata.yaml b/health/notifications/irc/metadata.yaml deleted file mode 100644 index aa2593f9..00000000 --- a/health/notifications/irc/metadata.yaml +++ /dev/null @@ -1,100 +0,0 @@ -# yamllint disable rule:line-length ---- -- id: 'notify-irc' - meta: - name: 'IRC' - link: '' - categories: - - notify.agent - icon_filename: 'irc.png' - keywords: - - IRC - overview: - notification_description: | - Send notifications to IRC using Netdata's Agent alert notification feature, which supports dozens of endpoints, user roles, and more. - notification_limitations: '' - setup: - prerequisites: - list: - - title: '' - description: | - - The `nc` utility. You can set the path to it, or Netdata will search for it in your system `$PATH`. - - Access to the terminal where Netdata Agent is running - configuration: - file: - name: 'health_alarm_notify.conf' - options: - description: 'The following options can be defined for this notification' - folding: - title: 'Config Options' - enabled: true - list: - - name: 'nc path' - default_value: '' - description: "Set the path for nc, otherwise Netdata will search for it in your system $PATH" - required: true - detailed_description: | - ```sh - #------------------------------------------------------------------------------ - # external commands - # - # The full path of the nc command. - # If empty, the system $PATH will be searched for it. - # If not found, irc notifications will be silently disabled. - nc="/usr/bin/nc" - ``` - - name: 'SEND_IRC' - default_value: 'YES' - description: "Set `SEND_IRC` YES." - required: true - - name: 'IRC_NETWORK' - default_value: '' - description: "Set `IRC_NETWORK` to the IRC network which your preferred channels belong to." - required: true - - name: 'IRC_PORT ' - default_value: '' - description: "Set `IRC_PORT` to the IRC port to which a connection will occur." - required: false - - name: 'IRC_NICKNAME' - default_value: '' - description: "Set `IRC_NICKNAME` to the IRC nickname which is required to send the notification. It must not be an already registered name as the connection's MODE is defined as a guest." - required: true - - name: 'IRC_REALNAME' - default_value: '' - description: "Set `IRC_REALNAME` to the IRC realname which is required in order to make the connection." - required: true - - name: 'DEFAULT_RECIPIENT_IRC' - default_value: '' - description: "You can have different channels per role, by editing `DEFAULT_RECIPIENT_IRC` with the channel you want" - required: true - detailed_description: | - The `DEFAULT_RECIPIENT_IRC` can be edited in the following entries at the bottom of the same file: - ```conf - role_recipients_irc[sysadmin]="#systems" - role_recipients_irc[domainadmin]="#domains" - role_recipients_irc[dba]="#databases #systems" - role_recipients_irc[webmaster]="#marketing #development" - role_recipients_irc[proxyadmin]="#proxy-admin" - role_recipients_irc[sitemgr]="#sites" - ``` - examples: - folding: - enabled: true - title: '' - list: - - name: 'Basic Configuration' - folding: - enabled: false - description: '' - config: | - #------------------------------------------------------------------------------ - # irc notification options - # - SEND_IRC="YES" - DEFAULT_RECIPIENT_IRC="#system-alarms" - IRC_NETWORK="irc.freenode.net" - IRC_NICKNAME="netdata-alarm-user" - IRC_REALNAME="netdata-user" - troubleshooting: - problems: - list: [] diff --git a/health/notifications/kavenegar/Makefile.inc b/health/notifications/kavenegar/Makefile.inc deleted file mode 100644 index b98e7941..00000000 --- a/health/notifications/kavenegar/Makefile.inc +++ /dev/null @@ -1,12 +0,0 @@ -# SPDX-License-Identifier: GPL-3.0-or-later - -# THIS IS NOT A COMPLETE Makefile -# IT IS INCLUDED BY ITS PARENT'S Makefile.am -# IT IS REQUIRED TO REFERENCE ALL FILES RELATIVE TO THE PARENT - -# install these files -dist_noinst_DATA += \ - kavenegar/README.md \ - kavenegar/Makefile.inc \ - $(NULL) - diff --git a/health/notifications/kavenegar/README.md b/health/notifications/kavenegar/README.md deleted file mode 100644 index 7e7cc7f6..00000000 --- a/health/notifications/kavenegar/README.md +++ /dev/null @@ -1,120 +0,0 @@ -<!--startmeta -custom_edit_url: "https://github.com/netdata/netdata/edit/master/health/notifications/kavenegar/README.md" -meta_yaml: "https://github.com/netdata/netdata/edit/master/health/notifications/kavenegar/metadata.yaml" -sidebar_label: "Kavenegar" -learn_status: "Published" -learn_rel_path: "Alerting/Notifications/Agent Dispatched Notifications" -message: "DO NOT EDIT THIS FILE DIRECTLY, IT IS GENERATED BY THE NOTIFICATION'S metadata.yaml FILE" -endmeta--> - -# Kavenegar - - -<img src="https://netdata.cloud/img/kavenegar.png" width="150"/> - - -[Kavenegar](https://kavenegar.com/) as service for software developers, based in Iran, provides send and receive SMS, calling voice by using its APIs. -You can send notifications to Kavenegar using Netdata's Agent alert notification feature, which supports dozens of endpoints, user roles, and more. - - - -<img src="https://img.shields.io/badge/maintained%20by-Netdata-%2300ab44" /> - -## Setup - -### Prerequisites - -#### - -- The APIKEY and Sender from http://panel.kavenegar.com/client/setting/account -- Access to the terminal where Netdata Agent is running - - - -### Configuration - -#### File - -The configuration file name for this integration is `health_alarm_notify.conf`. - - -You can edit the configuration file using the `edit-config` script from the -Netdata [config directory](https://github.com/netdata/netdata/blob/master/docs/configure/nodes.md#the-netdata-config-directory). - -```bash -cd /etc/netdata 2>/dev/null || cd /opt/netdata/etc/netdata -sudo ./edit-config health_alarm_notify.conf -``` -#### Options - -The following options can be defined for this notification - -<details><summary>Config Options</summary> - -| Name | Description | Default | Required | -|:----|:-----------|:-------|:--------:| -| SEND_KAVENEGAR | Set `SEND_KAVENEGAR` to YES | YES | yes | -| KAVENEGAR_API_KEY | Set `KAVENEGAR_API_KEY` to your API key. | | yes | -| KAVENEGAR_SENDER | Set `KAVENEGAR_SENDER` to the value of your Sender. | | yes | -| DEFAULT_RECIPIENT_KAVENEGAR | Set `DEFAULT_RECIPIENT_KAVENEGAR` to the SMS recipient you want the alert notifications to be sent to. You can define multiple recipients like this: 09155555555 09177777777. | | yes | - -##### DEFAULT_RECIPIENT_KAVENEGAR - -All roles will default to this variable if lest unconfigured. - -You can then have different SMS recipients per role, by editing `DEFAULT_RECIPIENT_KAVENEGAR` with the SMS recipients you want, in the following entries at the bottom of the same file: -```conf -role_recipients_kavenegar[sysadmin]="09100000000" -role_recipients_kavenegar[domainadmin]="09111111111" -role_recipients_kavenegar[dba]="0922222222" -role_recipients_kavenegar[webmaster]="0933333333" -role_recipients_kavenegar[proxyadmin]="0944444444" -role_recipients_kavenegar[sitemgr]="0955555555" -``` - -The values you provide should be defined as environments in `/etc/alertad.conf` with `ALLOWED_ENVIRONMENTS` option. - - -</details> - -#### Examples - -##### Basic Configuration - - - -```yaml -#------------------------------------------------------------------------------ -# Kavenegar (Kavenegar.com) SMS options - -SEND_KAVENEGAR="YES" -KAVENEGAR_API_KEY="XXXXXXXXXXXX" -KAVENEGAR_SENDER="YYYYYYYY" -DEFAULT_RECIPIENT_KAVENEGAR="0912345678" - -``` - - -## Troubleshooting - -### Test Notification - -You can run the following command by hand, to test alerts configuration: - -```bash -# become user netdata -sudo su -s /bin/bash netdata - -# enable debugging info on the console -export NETDATA_ALARM_NOTIFY_DEBUG=1 - -# send test alarms to sysadmin -/usr/libexec/netdata/plugins.d/alarm-notify.sh test - -# send test alarms to any role -/usr/libexec/netdata/plugins.d/alarm-notify.sh test "ROLE" -``` - -Note that this will test _all_ alert mechanisms for the selected role. - - diff --git a/health/notifications/kavenegar/metadata.yaml b/health/notifications/kavenegar/metadata.yaml deleted file mode 100644 index 559dbac0..00000000 --- a/health/notifications/kavenegar/metadata.yaml +++ /dev/null @@ -1,82 +0,0 @@ -# yamllint disable rule:line-length ---- -- id: 'notify-kavenegar' - meta: - name: 'Kavenegar' - link: 'https://kavenegar.com/' - categories: - - notify.agent - icon_filename: 'kavenegar.png' - keywords: - - Kavenegar - overview: - notification_description: | - [Kavenegar](https://kavenegar.com/) as service for software developers, based in Iran, provides send and receive SMS, calling voice by using its APIs. - You can send notifications to Kavenegar using Netdata's Agent alert notification feature, which supports dozens of endpoints, user roles, and more. - notification_limitations: '' - setup: - prerequisites: - list: - - title: '' - description: | - - The APIKEY and Sender from http://panel.kavenegar.com/client/setting/account - - Access to the terminal where Netdata Agent is running - configuration: - file: - name: 'health_alarm_notify.conf' - options: - description: 'The following options can be defined for this notification' - folding: - title: 'Config Options' - enabled: true - list: - - name: 'SEND_KAVENEGAR' - default_value: 'YES' - description: "Set `SEND_KAVENEGAR` to YES" - required: true - - name: 'KAVENEGAR_API_KEY' - default_value: '' - description: "Set `KAVENEGAR_API_KEY` to your API key." - required: true - - name: 'KAVENEGAR_SENDER' - default_value: '' - description: "Set `KAVENEGAR_SENDER` to the value of your Sender." - required: true - - name: 'DEFAULT_RECIPIENT_KAVENEGAR' - default_value: '' - description: "Set `DEFAULT_RECIPIENT_KAVENEGAR` to the SMS recipient you want the alert notifications to be sent to. You can define multiple recipients like this: 09155555555 09177777777." - required: true - detailed_description: | - All roles will default to this variable if lest unconfigured. - - You can then have different SMS recipients per role, by editing `DEFAULT_RECIPIENT_KAVENEGAR` with the SMS recipients you want, in the following entries at the bottom of the same file: - ```conf - role_recipients_kavenegar[sysadmin]="09100000000" - role_recipients_kavenegar[domainadmin]="09111111111" - role_recipients_kavenegar[dba]="0922222222" - role_recipients_kavenegar[webmaster]="0933333333" - role_recipients_kavenegar[proxyadmin]="0944444444" - role_recipients_kavenegar[sitemgr]="0955555555" - ``` - - The values you provide should be defined as environments in `/etc/alertad.conf` with `ALLOWED_ENVIRONMENTS` option. - examples: - folding: - enabled: true - title: '' - list: - - name: 'Basic Configuration' - folding: - enabled: false - description: '' - config: | - #------------------------------------------------------------------------------ - # Kavenegar (Kavenegar.com) SMS options - - SEND_KAVENEGAR="YES" - KAVENEGAR_API_KEY="XXXXXXXXXXXX" - KAVENEGAR_SENDER="YYYYYYYY" - DEFAULT_RECIPIENT_KAVENEGAR="0912345678" - troubleshooting: - problems: - list: [] diff --git a/health/notifications/matrix/Makefile.inc b/health/notifications/matrix/Makefile.inc deleted file mode 100644 index 9937d80c..00000000 --- a/health/notifications/matrix/Makefile.inc +++ /dev/null @@ -1,12 +0,0 @@ -# SPDX-License-Identifier: GPL-3.0-or-later - -# THIS IS NOT A COMPLETE Makefile -# IT IS INCLUDED BY ITS PARENT'S Makefile.am -# IT IS REQUIRED TO REFERENCE ALL FILES RELATIVE TO THE PARENT - -# install these files -dist_noinst_DATA += \ - matrix/README.md \ - matrix/Makefile.inc \ - $(NULL) - diff --git a/health/notifications/matrix/README.md b/health/notifications/matrix/README.md deleted file mode 100644 index 81ff3303..00000000 --- a/health/notifications/matrix/README.md +++ /dev/null @@ -1,132 +0,0 @@ -<!--startmeta -custom_edit_url: "https://github.com/netdata/netdata/edit/master/health/notifications/matrix/README.md" -meta_yaml: "https://github.com/netdata/netdata/edit/master/health/notifications/matrix/metadata.yaml" -sidebar_label: "Matrix" -learn_status: "Published" -learn_rel_path: "Alerting/Notifications/Agent Dispatched Notifications" -message: "DO NOT EDIT THIS FILE DIRECTLY, IT IS GENERATED BY THE NOTIFICATION'S metadata.yaml FILE" -endmeta--> - -# Matrix - - -<img src="https://netdata.cloud/img/matrix.svg" width="150"/> - - -Send notifications to Matrix network rooms using Netdata's Agent alert notification feature, which supports dozens of endpoints, user roles, and more. - - - -<img src="https://img.shields.io/badge/maintained%20by-Netdata-%2300ab44" /> - -## Setup - -### Prerequisites - -#### - -- The url of the homeserver (`https://homeserver:port`). -- Credentials for connecting to the homeserver, in the form of a valid access token for your account (or for a dedicated notification account). These tokens usually don't expire. -- The room ids that you want to sent the notification to. -- Access to the terminal where Netdata Agent is running - - - -### Configuration - -#### File - -The configuration file name for this integration is `health_alarm_notify.conf`. - - -You can edit the configuration file using the `edit-config` script from the -Netdata [config directory](https://github.com/netdata/netdata/blob/master/docs/configure/nodes.md#the-netdata-config-directory). - -```bash -cd /etc/netdata 2>/dev/null || cd /opt/netdata/etc/netdata -sudo ./edit-config health_alarm_notify.conf -``` -#### Options - -The following options can be defined for this notification - -<details><summary>Config Options</summary> - -| Name | Description | Default | Required | -|:----|:-----------|:-------|:--------:| -| SEND_MATRIX | Set `SEND_MATRIX` to YES | YES | yes | -| MATRIX_HOMESERVER | set `MATRIX_HOMESERVER` to the URL of the Matrix homeserver. | | yes | -| MATRIX_ACCESSTOKEN | Set `MATRIX_ACCESSTOKEN` to the access token from your Matrix account. | | yes | -| DEFAULT_RECIPIENT_MATRIX | Set `DEFAULT_RECIPIENT_MATRIX` to the rooms you want the alert notifications to be sent to. The format is `!roomid:homeservername`. | | yes | - -##### MATRIX_ACCESSTOKEN - -To obtain the access token, you can use the following curl command: -``` -curl -XPOST -d '{"type":"m.login.password", "user":"example", "password":"wordpass"}' "https://homeserver:8448/_matrix/client/r0/login" -``` - - -##### DEFAULT_RECIPIENT_MATRIX - -The room ids are unique identifiers and can be obtained from the room settings in a Matrix client (e.g. Riot). - -You can define multiple rooms like this: `!roomid1:homeservername` `!roomid2:homeservername`. - -All roles will default to this variable if left unconfigured. - -You can have different rooms per role, by editing `DEFAULT_RECIPIENT_MATRIX` with the `!roomid:homeservername` you want, in the following entries at the bottom of the same file: - -```conf -role_recipients_matrix[sysadmin]="!roomid1:homeservername" -role_recipients_matrix[domainadmin]="!roomid2:homeservername" -role_recipients_matrix[dba]="!roomid3:homeservername" -role_recipients_matrix[webmaster]="!roomid4:homeservername" -role_recipients_matrix[proxyadmin]="!roomid5:homeservername" -role_recipients_matrix[sitemgr]="!roomid6:homeservername" -``` - - -</details> - -#### Examples - -##### Basic Configuration - - - -```yaml -#------------------------------------------------------------------------------ -# Matrix notifications - -SEND_MATRIX="YES" -MATRIX_HOMESERVER="https://matrix.org:8448" -MATRIX_ACCESSTOKEN="XXXXXXXXXXXXXXXXXXXXXXXXXXXXXXXXXXXXXXXXXXXXXXXXXX" -DEFAULT_RECIPIENT_MATRIX="!XXXXXXXXXXXX:matrix.org" - -``` - - -## Troubleshooting - -### Test Notification - -You can run the following command by hand, to test alerts configuration: - -```bash -# become user netdata -sudo su -s /bin/bash netdata - -# enable debugging info on the console -export NETDATA_ALARM_NOTIFY_DEBUG=1 - -# send test alarms to sysadmin -/usr/libexec/netdata/plugins.d/alarm-notify.sh test - -# send test alarms to any role -/usr/libexec/netdata/plugins.d/alarm-notify.sh test "ROLE" -``` - -Note that this will test _all_ alert mechanisms for the selected role. - - diff --git a/health/notifications/matrix/metadata.yaml b/health/notifications/matrix/metadata.yaml deleted file mode 100644 index 17135aa3..00000000 --- a/health/notifications/matrix/metadata.yaml +++ /dev/null @@ -1,91 +0,0 @@ -# yamllint disable rule:line-length ---- -- id: 'notify-matrix' - meta: - name: 'Matrix' - link: 'https://spec.matrix.org/unstable/push-gateway-api/' - categories: - - notify.agent - icon_filename: 'matrix.svg' - keywords: - - Matrix - overview: - notification_description: | - Send notifications to Matrix network rooms using Netdata's Agent alert notification feature, which supports dozens of endpoints, user roles, and more. - notification_limitations: '' - setup: - prerequisites: - list: - - title: '' - description: | - - The url of the homeserver (`https://homeserver:port`). - - Credentials for connecting to the homeserver, in the form of a valid access token for your account (or for a dedicated notification account). These tokens usually don't expire. - - The room ids that you want to sent the notification to. - - Access to the terminal where Netdata Agent is running - configuration: - file: - name: 'health_alarm_notify.conf' - options: - description: 'The following options can be defined for this notification' - folding: - title: 'Config Options' - enabled: true - list: - - name: 'SEND_MATRIX' - default_value: 'YES' - description: "Set `SEND_MATRIX` to YES" - required: true - - name: 'MATRIX_HOMESERVER' - default_value: '' - description: "set `MATRIX_HOMESERVER` to the URL of the Matrix homeserver." - required: true - - name: 'MATRIX_ACCESSTOKEN' - default_value: '' - description: "Set `MATRIX_ACCESSTOKEN` to the access token from your Matrix account." - required: true - detailed_description: | - To obtain the access token, you can use the following curl command: - ``` - curl -XPOST -d '{"type":"m.login.password", "user":"example", "password":"wordpass"}' "https://homeserver:8448/_matrix/client/r0/login" - ``` - - name: 'DEFAULT_RECIPIENT_MATRIX' - default_value: '' - description: "Set `DEFAULT_RECIPIENT_MATRIX` to the rooms you want the alert notifications to be sent to. The format is `!roomid:homeservername`." - required: true - detailed_description: | - The room ids are unique identifiers and can be obtained from the room settings in a Matrix client (e.g. Riot). - - You can define multiple rooms like this: `!roomid1:homeservername` `!roomid2:homeservername`. - - All roles will default to this variable if left unconfigured. - - You can have different rooms per role, by editing `DEFAULT_RECIPIENT_MATRIX` with the `!roomid:homeservername` you want, in the following entries at the bottom of the same file: - - ```conf - role_recipients_matrix[sysadmin]="!roomid1:homeservername" - role_recipients_matrix[domainadmin]="!roomid2:homeservername" - role_recipients_matrix[dba]="!roomid3:homeservername" - role_recipients_matrix[webmaster]="!roomid4:homeservername" - role_recipients_matrix[proxyadmin]="!roomid5:homeservername" - role_recipients_matrix[sitemgr]="!roomid6:homeservername" - ``` - examples: - folding: - enabled: true - title: '' - list: - - name: 'Basic Configuration' - folding: - enabled: false - description: '' - config: | - #------------------------------------------------------------------------------ - # Matrix notifications - - SEND_MATRIX="YES" - MATRIX_HOMESERVER="https://matrix.org:8448" - MATRIX_ACCESSTOKEN="XXXXXXXXXXXXXXXXXXXXXXXXXXXXXXXXXXXXXXXXXXXXXXXXXX" - DEFAULT_RECIPIENT_MATRIX="!XXXXXXXXXXXX:matrix.org" - troubleshooting: - problems: - list: [] diff --git a/health/notifications/messagebird/Makefile.inc b/health/notifications/messagebird/Makefile.inc deleted file mode 100644 index f8d23322..00000000 --- a/health/notifications/messagebird/Makefile.inc +++ /dev/null @@ -1,12 +0,0 @@ -# SPDX-License-Identifier: GPL-3.0-or-later - -# THIS IS NOT A COMPLETE Makefile -# IT IS INCLUDED BY ITS PARENT'S Makefile.am -# IT IS REQUIRED TO REFERENCE ALL FILES RELATIVE TO THE PARENT - -# install these files -dist_noinst_DATA += \ - messagebird/README.md \ - messagebird/Makefile.inc \ - $(NULL) - diff --git a/health/notifications/messagebird/README.md b/health/notifications/messagebird/README.md deleted file mode 100644 index 2be84159..00000000 --- a/health/notifications/messagebird/README.md +++ /dev/null @@ -1,117 +0,0 @@ -<!--startmeta -custom_edit_url: "https://github.com/netdata/netdata/edit/master/health/notifications/messagebird/README.md" -meta_yaml: "https://github.com/netdata/netdata/edit/master/health/notifications/messagebird/metadata.yaml" -sidebar_label: "MessageBird" -learn_status: "Published" -learn_rel_path: "Alerting/Notifications/Agent Dispatched Notifications" -message: "DO NOT EDIT THIS FILE DIRECTLY, IT IS GENERATED BY THE NOTIFICATION'S metadata.yaml FILE" -endmeta--> - -# MessageBird - - -<img src="https://netdata.cloud/img/messagebird.svg" width="150"/> - - -Send notifications to MessageBird using Netdata's Agent alert notification feature, which supports dozens of endpoints, user roles, and more. - - - -<img src="https://img.shields.io/badge/maintained%20by-Netdata-%2300ab44" /> - -## Setup - -### Prerequisites - -#### - -- An access key under 'API ACCESS (REST)' (you will want a live key), you can read more [here](https://developers.messagebird.com/quickstarts/sms/test-credits-api-keys/). -- Access to the terminal where Netdata Agent is running - - - -### Configuration - -#### File - -The configuration file name for this integration is `health_alarm_notify.conf`. - - -You can edit the configuration file using the `edit-config` script from the -Netdata [config directory](https://github.com/netdata/netdata/blob/master/docs/configure/nodes.md#the-netdata-config-directory). - -```bash -cd /etc/netdata 2>/dev/null || cd /opt/netdata/etc/netdata -sudo ./edit-config health_alarm_notify.conf -``` -#### Options - -The following options can be defined for this notification - -<details><summary>Config Options</summary> - -| Name | Description | Default | Required | -|:----|:-----------|:-------|:--------:| -| SEND_MESSAGEBIRD | Set `SEND_MESSAGEBIRD` to YES | YES | yes | -| MESSAGEBIRD_ACCESS_KEY | Set `MESSAGEBIRD_ACCESS_KEY` to your API key. | | yes | -| MESSAGEBIRD_NUMBER | Set `MESSAGEBIRD_NUMBER` to the MessageBird number you want to use for the alert. | | yes | -| DEFAULT_RECIPIENT_MESSAGEBIRD | Set `DEFAULT_RECIPIENT_MESSAGEBIRD` to the number you want the alert notification to be sent as an SMS. You can define multiple recipients like this: +15555555555 +17777777777. | | yes | - -##### DEFAULT_RECIPIENT_MESSAGEBIRD - -All roles will default to this variable if left unconfigured. - -You can then have different recipients per role, by editing `DEFAULT_RECIPIENT_MESSAGEBIRD` with the number you want, in the following entries at the bottom of the same file: -```conf -role_recipients_messagebird[sysadmin]="+15555555555" -role_recipients_messagebird[domainadmin]="+15555555556" -role_recipients_messagebird[dba]="+15555555557" -role_recipients_messagebird[webmaster]="+15555555558" -role_recipients_messagebird[proxyadmin]="+15555555559" -role_recipients_messagebird[sitemgr]="+15555555550" -``` - - -</details> - -#### Examples - -##### Basic Configuration - - - -```yaml -#------------------------------------------------------------------------------ -# Messagebird (messagebird.com) SMS options - -SEND_MESSAGEBIRD="YES" -MESSAGEBIRD_ACCESS_KEY="XXXXXXXX" -MESSAGEBIRD_NUMBER="XXXXXXX" -DEFAULT_RECIPIENT_MESSAGEBIRD="+15555555555" - -``` - - -## Troubleshooting - -### Test Notification - -You can run the following command by hand, to test alerts configuration: - -```bash -# become user netdata -sudo su -s /bin/bash netdata - -# enable debugging info on the console -export NETDATA_ALARM_NOTIFY_DEBUG=1 - -# send test alarms to sysadmin -/usr/libexec/netdata/plugins.d/alarm-notify.sh test - -# send test alarms to any role -/usr/libexec/netdata/plugins.d/alarm-notify.sh test "ROLE" -``` - -Note that this will test _all_ alert mechanisms for the selected role. - - diff --git a/health/notifications/messagebird/metadata.yaml b/health/notifications/messagebird/metadata.yaml deleted file mode 100644 index a97cdc71..00000000 --- a/health/notifications/messagebird/metadata.yaml +++ /dev/null @@ -1,79 +0,0 @@ -# yamllint disable rule:line-length ---- -- id: 'notify-messagebird' - meta: - name: 'MessageBird' - link: 'https://messagebird.com/' - categories: - - notify.agent - icon_filename: 'messagebird.svg' - keywords: - - MessageBird - overview: - notification_description: | - Send notifications to MessageBird using Netdata's Agent alert notification feature, which supports dozens of endpoints, user roles, and more. - notification_limitations: '' - setup: - prerequisites: - list: - - title: '' - description: | - - An access key under 'API ACCESS (REST)' (you will want a live key), you can read more [here](https://developers.messagebird.com/quickstarts/sms/test-credits-api-keys/). - - Access to the terminal where Netdata Agent is running - configuration: - file: - name: 'health_alarm_notify.conf' - options: - description: 'The following options can be defined for this notification' - folding: - title: 'Config Options' - enabled: true - list: - - name: 'SEND_MESSAGEBIRD' - default_value: 'YES' - description: "Set `SEND_MESSAGEBIRD` to YES" - required: true - - name: 'MESSAGEBIRD_ACCESS_KEY' - default_value: '' - description: "Set `MESSAGEBIRD_ACCESS_KEY` to your API key." - required: true - - name: 'MESSAGEBIRD_NUMBER' - default_value: '' - description: "Set `MESSAGEBIRD_NUMBER` to the MessageBird number you want to use for the alert." - required: true - - name: 'DEFAULT_RECIPIENT_MESSAGEBIRD' - default_value: '' - description: "Set `DEFAULT_RECIPIENT_MESSAGEBIRD` to the number you want the alert notification to be sent as an SMS. You can define multiple recipients like this: +15555555555 +17777777777." - required: true - detailed_description: | - All roles will default to this variable if left unconfigured. - - You can then have different recipients per role, by editing `DEFAULT_RECIPIENT_MESSAGEBIRD` with the number you want, in the following entries at the bottom of the same file: - ```conf - role_recipients_messagebird[sysadmin]="+15555555555" - role_recipients_messagebird[domainadmin]="+15555555556" - role_recipients_messagebird[dba]="+15555555557" - role_recipients_messagebird[webmaster]="+15555555558" - role_recipients_messagebird[proxyadmin]="+15555555559" - role_recipients_messagebird[sitemgr]="+15555555550" - ``` - examples: - folding: - enabled: true - title: '' - list: - - name: 'Basic Configuration' - folding: - enabled: false - description: '' - config: | - #------------------------------------------------------------------------------ - # Messagebird (messagebird.com) SMS options - - SEND_MESSAGEBIRD="YES" - MESSAGEBIRD_ACCESS_KEY="XXXXXXXX" - MESSAGEBIRD_NUMBER="XXXXXXX" - DEFAULT_RECIPIENT_MESSAGEBIRD="+15555555555" - troubleshooting: - problems: - list: [] diff --git a/health/notifications/msteams/Makefile.inc b/health/notifications/msteams/Makefile.inc deleted file mode 100644 index f4c6995b..00000000 --- a/health/notifications/msteams/Makefile.inc +++ /dev/null @@ -1,12 +0,0 @@ -# SPDX-License-Identifier: GPL-3.0-or-later - -# THIS IS NOT A COMPLETE Makefile -# IT IS INCLUDED BY ITS PARENT'S Makefile.am -# IT IS REQUIRED TO REFERENCE ALL FILES RELATIVE TO THE PARENT - -# install these files -dist_noinst_DATA += \ - msteams/README.md \ - msteams/Makefile.inc \ - $(NULL) - diff --git a/health/notifications/msteams/README.md b/health/notifications/msteams/README.md deleted file mode 100644 index cfda959a..00000000 --- a/health/notifications/msteams/README.md +++ /dev/null @@ -1,118 +0,0 @@ -<!--startmeta -custom_edit_url: "https://github.com/netdata/netdata/edit/master/health/notifications/msteams/README.md" -meta_yaml: "https://github.com/netdata/netdata/edit/master/health/notifications/msteams/metadata.yaml" -sidebar_label: "Microsoft Teams" -learn_status: "Published" -learn_rel_path: "Alerting/Notifications/Agent Dispatched Notifications" -message: "DO NOT EDIT THIS FILE DIRECTLY, IT IS GENERATED BY THE NOTIFICATION'S metadata.yaml FILE" -endmeta--> - -# Microsoft Teams - - -<img src="https://netdata.cloud/img/msteams.svg" width="150"/> - - -You can send Netdata alerts to Microsoft Teams using Netdata's Agent alert notification feature, which supports dozens of endpoints, user roles, and more. - - - -<img src="https://img.shields.io/badge/maintained%20by-Netdata-%2300ab44" /> - -## Setup - -### Prerequisites - -#### - -- The incoming webhook URL as given by Microsoft Teams. You can use the same on all your Netdata servers (or you can have multiple if you like). -- One or more channels to post the messages to -- Access to the terminal where Netdata Agent is running - - - -### Configuration - -#### File - -The configuration file name for this integration is `health_alarm_notify.conf`. - - -You can edit the configuration file using the `edit-config` script from the -Netdata [config directory](https://github.com/netdata/netdata/blob/master/docs/configure/nodes.md#the-netdata-config-directory). - -```bash -cd /etc/netdata 2>/dev/null || cd /opt/netdata/etc/netdata -sudo ./edit-config health_alarm_notify.conf -``` -#### Options - -The following options can be defined for this notification - -<details><summary>Config Options</summary> - -| Name | Description | Default | Required | -|:----|:-----------|:-------|:--------:| -| SEND_MSTEAMS | Set `SEND_MSTEAMS` to YES | YES | yes | -| MSTEAMS_WEBHOOK_URL | set `MSTEAMS_WEBHOOK_URL` to the incoming webhook URL as given by Microsoft Teams. | | yes | -| DEFAULT_RECIPIENT_MSTEAMS | Set `DEFAULT_RECIPIENT_MSTEAMS` to the encoded Microsoft Teams channel name you want the alert notifications to be sent to. | | yes | - -##### DEFAULT_RECIPIENT_MSTEAMS - -In Microsoft Teams the channel name is encoded in the URI after `/IncomingWebhook/`. You can define multiple channels like this: `CHANNEL1` `CHANNEL2`. - -All roles will default to this variable if left unconfigured. - -You can have different channels per role, by editing `DEFAULT_RECIPIENT_MSTEAMS` with the channel you want, in the following entries at the bottom of the same file: -```conf -role_recipients_msteams[sysadmin]="CHANNEL1" -role_recipients_msteams[domainadmin]="CHANNEL2" -role_recipients_msteams[dba]="databases CHANNEL3" -role_recipients_msteams[webmaster]="CHANNEL4" -role_recipients_msteams[proxyadmin]="CHANNEL5" -role_recipients_msteams[sitemgr]="CHANNEL6" -``` - - -</details> - -#### Examples - -##### Basic Configuration - - - -```yaml -#------------------------------------------------------------------------------ -# Microsoft Teams (office.com) global notification options - -SEND_MSTEAMS="YES" -MSTEAMS_WEBHOOK_URL="https://outlook.office.com/webhook/XXXXXXXX-XXXX-XXXX-XXXX-XXXXXXXXXXXX@XXXXXXXX-XXXX-XXXX-XXXX-XXXXXXXXXXXX/IncomingWebhook/CHANNEL/XXXXXXXX-XXXX-XXXX-XXXX-XXXXXXXXXXXX" -DEFAULT_RECIPIENT_MSTEAMS="XXXXXXXXXXXXXXXXXXXXXXXXXXXXXXXX" - -``` - - -## Troubleshooting - -### Test Notification - -You can run the following command by hand, to test alerts configuration: - -```bash -# become user netdata -sudo su -s /bin/bash netdata - -# enable debugging info on the console -export NETDATA_ALARM_NOTIFY_DEBUG=1 - -# send test alarms to sysadmin -/usr/libexec/netdata/plugins.d/alarm-notify.sh test - -# send test alarms to any role -/usr/libexec/netdata/plugins.d/alarm-notify.sh test "ROLE" -``` - -Note that this will test _all_ alert mechanisms for the selected role. - - diff --git a/health/notifications/msteams/metadata.yaml b/health/notifications/msteams/metadata.yaml deleted file mode 100644 index 72de507a..00000000 --- a/health/notifications/msteams/metadata.yaml +++ /dev/null @@ -1,79 +0,0 @@ -# yamllint disable rule:line-length ---- -- id: 'notify-teams' - meta: - name: 'Microsoft Teams' - link: 'https://www.microsoft.com/en-us/microsoft-teams/log-in' - categories: - - notify.agent - icon_filename: 'msteams.svg' - keywords: - - Microsoft - - Teams - - MS teams - overview: - notification_description: | - You can send Netdata alerts to Microsoft Teams using Netdata's Agent alert notification feature, which supports dozens of endpoints, user roles, and more. - notification_limitations: '' - setup: - prerequisites: - list: - - title: '' - description: | - - The incoming webhook URL as given by Microsoft Teams. You can use the same on all your Netdata servers (or you can have multiple if you like). - - One or more channels to post the messages to - - Access to the terminal where Netdata Agent is running - configuration: - file: - name: 'health_alarm_notify.conf' - options: - description: 'The following options can be defined for this notification' - folding: - title: 'Config Options' - enabled: true - list: - - name: 'SEND_MSTEAMS' - default_value: 'YES' - description: "Set `SEND_MSTEAMS` to YES" - required: true - - name: 'MSTEAMS_WEBHOOK_URL' - default_value: '' - description: "set `MSTEAMS_WEBHOOK_URL` to the incoming webhook URL as given by Microsoft Teams." - required: true - - name: 'DEFAULT_RECIPIENT_MSTEAMS' - default_value: '' - description: "Set `DEFAULT_RECIPIENT_MSTEAMS` to the encoded Microsoft Teams channel name you want the alert notifications to be sent to." - required: true - detailed_description: | - In Microsoft Teams the channel name is encoded in the URI after `/IncomingWebhook/`. You can define multiple channels like this: `CHANNEL1` `CHANNEL2`. - - All roles will default to this variable if left unconfigured. - - You can have different channels per role, by editing `DEFAULT_RECIPIENT_MSTEAMS` with the channel you want, in the following entries at the bottom of the same file: - ```conf - role_recipients_msteams[sysadmin]="CHANNEL1" - role_recipients_msteams[domainadmin]="CHANNEL2" - role_recipients_msteams[dba]="databases CHANNEL3" - role_recipients_msteams[webmaster]="CHANNEL4" - role_recipients_msteams[proxyadmin]="CHANNEL5" - role_recipients_msteams[sitemgr]="CHANNEL6" - ``` - examples: - folding: - enabled: true - title: '' - list: - - name: 'Basic Configuration' - folding: - enabled: false - description: '' - config: | - #------------------------------------------------------------------------------ - # Microsoft Teams (office.com) global notification options - - SEND_MSTEAMS="YES" - MSTEAMS_WEBHOOK_URL="https://outlook.office.com/webhook/XXXXXXXX-XXXX-XXXX-XXXX-XXXXXXXXXXXX@XXXXXXXX-XXXX-XXXX-XXXX-XXXXXXXXXXXX/IncomingWebhook/CHANNEL/XXXXXXXX-XXXX-XXXX-XXXX-XXXXXXXXXXXX" - DEFAULT_RECIPIENT_MSTEAMS="XXXXXXXXXXXXXXXXXXXXXXXXXXXXXXXX" - troubleshooting: - problems: - list: [] diff --git a/health/notifications/ntfy/Makefile.inc b/health/notifications/ntfy/Makefile.inc deleted file mode 100644 index b2045192..00000000 --- a/health/notifications/ntfy/Makefile.inc +++ /dev/null @@ -1,12 +0,0 @@ -# SPDX-License-Identifier: GPL-3.0-or-later - -# THIS IS NOT A COMPLETE Makefile -# IT IS INCLUDED BY ITS PARENT'S Makefile.am -# IT IS REQUIRED TO REFERENCE ALL FILES RELATIVE TO THE PARENT - -# install these files -dist_noinst_DATA += \ - ntfy/README.md \ - ntfy/Makefile.inc \ - $(NULL) - diff --git a/health/notifications/ntfy/README.md b/health/notifications/ntfy/README.md deleted file mode 100644 index 924c2a29..00000000 --- a/health/notifications/ntfy/README.md +++ /dev/null @@ -1,135 +0,0 @@ -<!--startmeta -custom_edit_url: "https://github.com/netdata/netdata/edit/master/health/notifications/ntfy/README.md" -meta_yaml: "https://github.com/netdata/netdata/edit/master/health/notifications/ntfy/metadata.yaml" -sidebar_label: "ntfy" -learn_status: "Published" -learn_rel_path: "Alerting/Notifications/Agent Dispatched Notifications" -message: "DO NOT EDIT THIS FILE DIRECTLY, IT IS GENERATED BY THE NOTIFICATION'S metadata.yaml FILE" -endmeta--> - -# ntfy - - -<img src="https://netdata.cloud/img/ntfy.svg" width="150"/> - - -[ntfy](https://ntfy.sh/) (pronounce: notify) is a simple HTTP-based [pub-sub](https://en.wikipedia.org/wiki/Publish%E2%80%93subscribe_pattern) notification service. It allows you to send notifications to your phone or desktop via scripts from any computer, entirely without signup, cost or setup. It's also [open source](https://github.com/binwiederhier/ntfy) if you want to run your own server. -You can send alerts to an ntfy server using Netdata's Agent alert notification feature, which supports dozens of endpoints, user roles, and more. - - - -<img src="https://img.shields.io/badge/maintained%20by-Netdata-%2300ab44" /> - -## Setup - -### Prerequisites - -#### - -- (Optional) A [self-hosted ntfy server](https://docs.ntfy.sh/faq/#can-i-self-host-it), in case you don't want to use https://ntfy.sh -- A new [topic](https://ntfy.sh/#subscribe) for the notifications to be published to -- Access to the terminal where Netdata Agent is running - - - -### Configuration - -#### File - -The configuration file name for this integration is `health_alarm_notify.conf`. - - -You can edit the configuration file using the `edit-config` script from the -Netdata [config directory](https://github.com/netdata/netdata/blob/master/docs/configure/nodes.md#the-netdata-config-directory). - -```bash -cd /etc/netdata 2>/dev/null || cd /opt/netdata/etc/netdata -sudo ./edit-config health_alarm_notify.conf -``` -#### Options - -The following options can be defined for this notification - -<details><summary>Config Options</summary> - -| Name | Description | Default | Required | -|:----|:-----------|:-------|:--------:| -| SEND_NTFY | Set `SEND_NTFY` to YES | YES | yes | -| DEFAULT_RECIPIENT_NTFY | URL formed by the server-topic combination you want the alert notifications to be sent to. Unless hosting your own server, the server should always be set to https://ntfy.sh. | | yes | -| NTFY_USERNAME | The username for netdata to use to authenticate with an ntfy server. | | no | -| NTFY_PASSWORD | The password for netdata to use to authenticate with an ntfy server. | | no | -| NTFY_ACCESS_TOKEN | The access token for netdata to use to authenticate with an ntfy server. | | no | - -##### DEFAULT_RECIPIENT_NTFY - -You can define multiple recipient URLs like this: `https://SERVER1/TOPIC1` `https://SERVER2/TOPIC2` - -All roles will default to this variable if left unconfigured. - -You can then have different servers and/or topics per role, by editing DEFAULT_RECIPIENT_NTFY with the server-topic combination you want, in the following entries at the bottom of the same file: -```conf -role_recipients_ntfy[sysadmin]="https://SERVER1/TOPIC1" -role_recipients_ntfy[domainadmin]="https://SERVER2/TOPIC2" -role_recipients_ntfy[dba]="https://SERVER3/TOPIC3" -role_recipients_ntfy[webmaster]="https://SERVER4/TOPIC4" -role_recipients_ntfy[proxyadmin]="https://SERVER5/TOPIC5" -role_recipients_ntfy[sitemgr]="https://SERVER6/TOPIC6" -``` - - -##### NTFY_USERNAME - -Only useful on self-hosted ntfy instances. See [users and roles](https://docs.ntfy.sh/config/#users-and-roles) for details. -Ensure that your user has proper read/write access to the provided topic in `DEFAULT_RECIPIENT_NTFY` - - -##### NTFY_PASSWORD - -Only useful on self-hosted ntfy instances. See [users and roles](https://docs.ntfy.sh/config/#users-and-roles) for details. -Ensure that your user has proper read/write access to the provided topic in `DEFAULT_RECIPIENT_NTFY` - - -##### NTFY_ACCESS_TOKEN - -This can be used in place of `NTFY_USERNAME` and `NTFY_PASSWORD` to authenticate with a self-hosted ntfy instance. See [access tokens](https://docs.ntfy.sh/config/?h=access+to#access-tokens) for details. -Ensure that the token user has proper read/write access to the provided topic in `DEFAULT_RECIPIENT_NTFY` - - -</details> - -#### Examples - -##### Basic Configuration - - - -```yaml -SEND_NTFY="YES" -DEFAULT_RECIPIENT_NTFY="https://ntfy.sh/netdata-X7seHg7d3Tw9zGOk https://ntfy.sh/netdata-oIPm4IK1IlUtlA30" - -``` - - -## Troubleshooting - -### Test Notification - -You can run the following command by hand, to test alerts configuration: - -```bash -# become user netdata -sudo su -s /bin/bash netdata - -# enable debugging info on the console -export NETDATA_ALARM_NOTIFY_DEBUG=1 - -# send test alarms to sysadmin -/usr/libexec/netdata/plugins.d/alarm-notify.sh test - -# send test alarms to any role -/usr/libexec/netdata/plugins.d/alarm-notify.sh test "ROLE" -``` - -Note that this will test _all_ alert mechanisms for the selected role. - - diff --git a/health/notifications/ntfy/metadata.yaml b/health/notifications/ntfy/metadata.yaml deleted file mode 100644 index 0d6c0bea..00000000 --- a/health/notifications/ntfy/metadata.yaml +++ /dev/null @@ -1,91 +0,0 @@ -# yamllint disable rule:line-length ---- -- id: 'notify-ntfy' - meta: - name: 'ntfy' - link: 'https://ntfy.sh/' - categories: - - notify.agent - icon_filename: 'ntfy.svg' - keywords: - - ntfy - overview: - notification_description: | - [ntfy](https://ntfy.sh/) (pronounce: notify) is a simple HTTP-based [pub-sub](https://en.wikipedia.org/wiki/Publish%E2%80%93subscribe_pattern) notification service. It allows you to send notifications to your phone or desktop via scripts from any computer, entirely without signup, cost or setup. It's also [open source](https://github.com/binwiederhier/ntfy) if you want to run your own server. - You can send alerts to an ntfy server using Netdata's Agent alert notification feature, which supports dozens of endpoints, user roles, and more. - notification_limitations: '' - setup: - prerequisites: - list: - - title: '' - description: | - - (Optional) A [self-hosted ntfy server](https://docs.ntfy.sh/faq/#can-i-self-host-it), in case you don't want to use https://ntfy.sh - - A new [topic](https://ntfy.sh/#subscribe) for the notifications to be published to - - Access to the terminal where Netdata Agent is running - configuration: - file: - name: 'health_alarm_notify.conf' - options: - description: 'The following options can be defined for this notification' - folding: - title: 'Config Options' - enabled: true - list: - - name: 'SEND_NTFY' - default_value: 'YES' - description: "Set `SEND_NTFY` to YES" - required: true - - name: 'DEFAULT_RECIPIENT_NTFY' - default_value: '' - description: "URL formed by the server-topic combination you want the alert notifications to be sent to. Unless hosting your own server, the server should always be set to https://ntfy.sh." - required: true - detailed_description: | - You can define multiple recipient URLs like this: `https://SERVER1/TOPIC1` `https://SERVER2/TOPIC2` - - All roles will default to this variable if left unconfigured. - - You can then have different servers and/or topics per role, by editing DEFAULT_RECIPIENT_NTFY with the server-topic combination you want, in the following entries at the bottom of the same file: - ```conf - role_recipients_ntfy[sysadmin]="https://SERVER1/TOPIC1" - role_recipients_ntfy[domainadmin]="https://SERVER2/TOPIC2" - role_recipients_ntfy[dba]="https://SERVER3/TOPIC3" - role_recipients_ntfy[webmaster]="https://SERVER4/TOPIC4" - role_recipients_ntfy[proxyadmin]="https://SERVER5/TOPIC5" - role_recipients_ntfy[sitemgr]="https://SERVER6/TOPIC6" - ``` - - name: 'NTFY_USERNAME' - default_value: '' - description: "The username for netdata to use to authenticate with an ntfy server." - required: false - detailed_description: | - Only useful on self-hosted ntfy instances. See [users and roles](https://docs.ntfy.sh/config/#users-and-roles) for details. - Ensure that your user has proper read/write access to the provided topic in `DEFAULT_RECIPIENT_NTFY` - - name: 'NTFY_PASSWORD' - default_value: '' - description: "The password for netdata to use to authenticate with an ntfy server." - required: false - detailed_description: | - Only useful on self-hosted ntfy instances. See [users and roles](https://docs.ntfy.sh/config/#users-and-roles) for details. - Ensure that your user has proper read/write access to the provided topic in `DEFAULT_RECIPIENT_NTFY` - - name: 'NTFY_ACCESS_TOKEN' - default_value: '' - description: "The access token for netdata to use to authenticate with an ntfy server." - required: false - detailed_description: | - This can be used in place of `NTFY_USERNAME` and `NTFY_PASSWORD` to authenticate with a self-hosted ntfy instance. See [access tokens](https://docs.ntfy.sh/config/?h=access+to#access-tokens) for details. - Ensure that the token user has proper read/write access to the provided topic in `DEFAULT_RECIPIENT_NTFY` - examples: - folding: - enabled: true - title: '' - list: - - name: 'Basic Configuration' - folding: - enabled: false - description: '' - config: | - SEND_NTFY="YES" - DEFAULT_RECIPIENT_NTFY="https://ntfy.sh/netdata-X7seHg7d3Tw9zGOk https://ntfy.sh/netdata-oIPm4IK1IlUtlA30" - troubleshooting: - problems: - list: [] diff --git a/health/notifications/opsgenie/Makefile.inc b/health/notifications/opsgenie/Makefile.inc deleted file mode 100644 index c85bb7c3..00000000 --- a/health/notifications/opsgenie/Makefile.inc +++ /dev/null @@ -1,12 +0,0 @@ -# SPDX-License-Identifier: GPL-3.0-or-later - -# THIS IS NOT A COMPLETE Makefile -# IT IS INCLUDED BY ITS PARENT'S Makefile.am -# IT IS REQUIRED TO REFERENCE ALL FILES RELATIVE TO THE PARENT - -# install these files -dist_noinst_DATA += \ - opsgenie/README.md \ - opsgenie/Makefile.inc \ - $(NULL) - diff --git a/health/notifications/opsgenie/README.md b/health/notifications/opsgenie/README.md deleted file mode 100644 index 1b61597e..00000000 --- a/health/notifications/opsgenie/README.md +++ /dev/null @@ -1,98 +0,0 @@ -<!--startmeta -custom_edit_url: "https://github.com/netdata/netdata/edit/master/health/notifications/opsgenie/README.md" -meta_yaml: "https://github.com/netdata/netdata/edit/master/health/notifications/opsgenie/metadata.yaml" -sidebar_label: "OpsGenie" -learn_status: "Published" -learn_rel_path: "Alerting/Notifications/Agent Dispatched Notifications" -message: "DO NOT EDIT THIS FILE DIRECTLY, IT IS GENERATED BY THE NOTIFICATION'S metadata.yaml FILE" -endmeta--> - -# OpsGenie - - -<img src="https://netdata.cloud/img/opsgenie.png" width="150"/> - - -Opsgenie is an alerting and incident response tool. It is designed to group and filter alarms, build custom routing rules for on-call teams, and correlate deployments and commits to incidents. -You can send notifications to Opsgenie using Netdata's Agent alert notification feature, which supports dozens of endpoints, user roles, and more. - - - -<img src="https://img.shields.io/badge/maintained%20by-Netdata-%2300ab44" /> - -## Setup - -### Prerequisites - -#### - -- An Opsgenie integration. You can create an [integration](https://docs.opsgenie.com/docs/api-integration) in the [Opsgenie](https://www.atlassian.com/software/opsgenie) dashboard. -- Access to the terminal where Netdata Agent is running - - - -### Configuration - -#### File - -The configuration file name for this integration is `health_alarm_notify.conf`. - - -You can edit the configuration file using the `edit-config` script from the -Netdata [config directory](https://github.com/netdata/netdata/blob/master/docs/configure/nodes.md#the-netdata-config-directory). - -```bash -cd /etc/netdata 2>/dev/null || cd /opt/netdata/etc/netdata -sudo ./edit-config health_alarm_notify.conf -``` -#### Options - -The following options can be defined for this notification - -<details><summary>Config Options</summary> - -| Name | Description | Default | Required | -|:----|:-----------|:-------|:--------:| -| SEND_OPSGENIE | Set `SEND_OPSGENIE` to YES | YES | yes | -| OPSGENIE_API_KEY | Set `OPSGENIE_API_KEY` to your API key. | | yes | -| OPSGENIE_API_URL | Set `OPSGENIE_API_URL` to the corresponding URL if required, for example there are region-specific API URLs such as `https://eu.api.opsgenie.com`. | https://api.opsgenie.com | no | - -</details> - -#### Examples - -##### Basic Configuration - - - -```yaml -SEND_OPSGENIE="YES" -OPSGENIE_API_KEY="11111111-2222-3333-4444-555555555555" -OPSGENIE_API_URL="" - -``` - - -## Troubleshooting - -### Test Notification - -You can run the following command by hand, to test alerts configuration: - -```bash -# become user netdata -sudo su -s /bin/bash netdata - -# enable debugging info on the console -export NETDATA_ALARM_NOTIFY_DEBUG=1 - -# send test alarms to sysadmin -/usr/libexec/netdata/plugins.d/alarm-notify.sh test - -# send test alarms to any role -/usr/libexec/netdata/plugins.d/alarm-notify.sh test "ROLE" -``` - -Note that this will test _all_ alert mechanisms for the selected role. - - diff --git a/health/notifications/opsgenie/metadata.yaml b/health/notifications/opsgenie/metadata.yaml deleted file mode 100644 index 78bd8c2b..00000000 --- a/health/notifications/opsgenie/metadata.yaml +++ /dev/null @@ -1,60 +0,0 @@ -# yamllint disable rule:line-length ---- -- id: 'notify-opsgenie' - meta: - name: 'OpsGenie' - link: 'https://www.atlassian.com/software/opsgenie' - categories: - - notify.agent - icon_filename: 'opsgenie.png' - keywords: - - OpsGenie - overview: - notification_description: | - Opsgenie is an alerting and incident response tool. It is designed to group and filter alarms, build custom routing rules for on-call teams, and correlate deployments and commits to incidents. - You can send notifications to Opsgenie using Netdata's Agent alert notification feature, which supports dozens of endpoints, user roles, and more. - notification_limitations: '' - setup: - prerequisites: - list: - - title: '' - description: | - - An Opsgenie integration. You can create an [integration](https://docs.opsgenie.com/docs/api-integration) in the [Opsgenie](https://www.atlassian.com/software/opsgenie) dashboard. - - Access to the terminal where Netdata Agent is running - configuration: - file: - name: 'health_alarm_notify.conf' - options: - description: 'The following options can be defined for this notification' - folding: - title: 'Config Options' - enabled: true - list: - - name: 'SEND_OPSGENIE' - default_value: 'YES' - description: "Set `SEND_OPSGENIE` to YES" - required: true - - name: 'OPSGENIE_API_KEY' - default_value: '' - description: "Set `OPSGENIE_API_KEY` to your API key." - required: true - - name: 'OPSGENIE_API_URL' - default_value: 'https://api.opsgenie.com' - description: "Set `OPSGENIE_API_URL` to the corresponding URL if required, for example there are region-specific API URLs such as `https://eu.api.opsgenie.com`." - required: false - examples: - folding: - enabled: true - title: '' - list: - - name: 'Basic Configuration' - folding: - enabled: false - description: '' - config: | - SEND_OPSGENIE="YES" - OPSGENIE_API_KEY="11111111-2222-3333-4444-555555555555" - OPSGENIE_API_URL="" - troubleshooting: - problems: - list: [] diff --git a/health/notifications/pagerduty/Makefile.inc b/health/notifications/pagerduty/Makefile.inc deleted file mode 100644 index ee9b0919..00000000 --- a/health/notifications/pagerduty/Makefile.inc +++ /dev/null @@ -1,12 +0,0 @@ -# SPDX-License-Identifier: GPL-3.0-or-later - -# THIS IS NOT A COMPLETE Makefile -# IT IS INCLUDED BY ITS PARENT'S Makefile.am -# IT IS REQUIRED TO REFERENCE ALL FILES RELATIVE TO THE PARENT - -# install these files -dist_noinst_DATA += \ - pagerduty/README.md \ - pagerduty/Makefile.inc \ - $(NULL) - diff --git a/health/notifications/pagerduty/README.md b/health/notifications/pagerduty/README.md deleted file mode 100644 index 2771061f..00000000 --- a/health/notifications/pagerduty/README.md +++ /dev/null @@ -1,117 +0,0 @@ -<!--startmeta -custom_edit_url: "https://github.com/netdata/netdata/edit/master/health/notifications/pagerduty/README.md" -meta_yaml: "https://github.com/netdata/netdata/edit/master/health/notifications/pagerduty/metadata.yaml" -sidebar_label: "PagerDuty" -learn_status: "Published" -learn_rel_path: "Alerting/Notifications/Agent Dispatched Notifications" -message: "DO NOT EDIT THIS FILE DIRECTLY, IT IS GENERATED BY THE NOTIFICATION'S metadata.yaml FILE" -endmeta--> - -# PagerDuty - - -<img src="https://netdata.cloud/img/pagerduty.png" width="150"/> - - -PagerDuty is an enterprise incident resolution service that integrates with ITOps and DevOps monitoring stacks to improve operational reliability and agility. From enriching and aggregating events to correlating them into incidents, PagerDuty streamlines the incident management process by reducing alert noise and resolution times. -You can send notifications to PagerDuty using Netdata's Agent alert notification feature, which supports dozens of endpoints, user roles, and more. - - - -<img src="https://img.shields.io/badge/maintained%20by-Netdata-%2300ab44" /> - -## Setup - -### Prerequisites - -#### - -- An installation of the [PagerDuty](https://www.pagerduty.com/docs/guides/agent-install-guide/) agent on the node running the Netdata Agent -- A PagerDuty Generic API service using either the `Events API v2` or `Events API v1` -- [Add a new service](https://support.pagerduty.com/docs/services-and-integrations#section-configuring-services-and-integrations) to PagerDuty. Click Use our API directly and select either `Events API v2` or `Events API v1`. Once you finish creating the service, click on the Integrations tab to find your Integration Key. -- Access to the terminal where Netdata Agent is running - - - -### Configuration - -#### File - -The configuration file name for this integration is `health_alarm_notify.conf`. - - -You can edit the configuration file using the `edit-config` script from the -Netdata [config directory](https://github.com/netdata/netdata/blob/master/docs/configure/nodes.md#the-netdata-config-directory). - -```bash -cd /etc/netdata 2>/dev/null || cd /opt/netdata/etc/netdata -sudo ./edit-config health_alarm_notify.conf -``` -#### Options - -The following options can be defined for this notification - -<details><summary>Config Options</summary> - -| Name | Description | Default | Required | -|:----|:-----------|:-------|:--------:| -| SEND_PD | Set `SEND_PD` to YES | YES | yes | -| DEFAULT_RECIPIENT_PD | Set `DEFAULT_RECIPIENT_PD` to the PagerDuty service key you want the alert notifications to be sent to. You can define multiple service keys like this: `pd_service_key_1` `pd_service_key_2`. | | yes | - -##### DEFAULT_RECIPIENT_PD - -All roles will default to this variable if left unconfigured. - -The `DEFAULT_RECIPIENT_PD` can be edited in the following entries at the bottom of the same file: -```conf -role_recipients_pd[sysadmin]="xxxxxxxxxxxxxxxxxxxxxxxxxxxxxxxa" -role_recipients_pd[domainadmin]="xxxxxxxxxxxxxxxxxxxxxxxxxxxxxxxb" -role_recipients_pd[dba]="xxxxxxxxxxxxxxxxxxxxxxxxxxxxxxxc" -role_recipients_pd[webmaster]="xxxxxxxxxxxxxxxxxxxxxxxxxxxxxxxd" -role_recipients_pd[proxyadmin]="xxxxxxxxxxxxxxxxxxxxxxxxxxxxxxxe" -role_recipients_pd[sitemgr]="xxxxxxxxxxxxxxxxxxxxxxxxxxxxxxxf" -``` - - -</details> - -#### Examples - -##### Basic Configuration - - - -```yaml -#------------------------------------------------------------------------------ -# pagerduty.com notification options - -SEND_PD="YES" -DEFAULT_RECIPIENT_PD="xxxxxxxxxxxxxxxxxxxxxxxxxxxxxxxx" -USE_PD_VERSION="2" - -``` - - -## Troubleshooting - -### Test Notification - -You can run the following command by hand, to test alerts configuration: - -```bash -# become user netdata -sudo su -s /bin/bash netdata - -# enable debugging info on the console -export NETDATA_ALARM_NOTIFY_DEBUG=1 - -# send test alarms to sysadmin -/usr/libexec/netdata/plugins.d/alarm-notify.sh test - -# send test alarms to any role -/usr/libexec/netdata/plugins.d/alarm-notify.sh test "ROLE" -``` - -Note that this will test _all_ alert mechanisms for the selected role. - - diff --git a/health/notifications/pagerduty/metadata.yaml b/health/notifications/pagerduty/metadata.yaml deleted file mode 100644 index 6fc1d640..00000000 --- a/health/notifications/pagerduty/metadata.yaml +++ /dev/null @@ -1,73 +0,0 @@ -# yamllint disable rule:line-length ---- -- id: 'notify-pagerduty' - meta: - name: 'PagerDuty' - link: 'https://www.pagerduty.com/' - categories: - - notify.agent - icon_filename: 'pagerduty.png' - keywords: - - PagerDuty - overview: - notification_description: | - PagerDuty is an enterprise incident resolution service that integrates with ITOps and DevOps monitoring stacks to improve operational reliability and agility. From enriching and aggregating events to correlating them into incidents, PagerDuty streamlines the incident management process by reducing alert noise and resolution times. - You can send notifications to PagerDuty using Netdata's Agent alert notification feature, which supports dozens of endpoints, user roles, and more. - notification_limitations: '' - setup: - prerequisites: - list: - - title: '' - description: | - - An installation of the [PagerDuty](https://www.pagerduty.com/docs/guides/agent-install-guide/) agent on the node running the Netdata Agent - - A PagerDuty Generic API service using either the `Events API v2` or `Events API v1` - - [Add a new service](https://support.pagerduty.com/docs/services-and-integrations#section-configuring-services-and-integrations) to PagerDuty. Click Use our API directly and select either `Events API v2` or `Events API v1`. Once you finish creating the service, click on the Integrations tab to find your Integration Key. - - Access to the terminal where Netdata Agent is running - configuration: - file: - name: 'health_alarm_notify.conf' - options: - description: 'The following options can be defined for this notification' - folding: - title: 'Config Options' - enabled: true - list: - - name: 'SEND_PD' - default_value: 'YES' - description: "Set `SEND_PD` to YES" - required: true - - name: 'DEFAULT_RECIPIENT_PD' - default_value: '' - description: "Set `DEFAULT_RECIPIENT_PD` to the PagerDuty service key you want the alert notifications to be sent to. You can define multiple service keys like this: `pd_service_key_1` `pd_service_key_2`." - required: true - detailed_description: | - All roles will default to this variable if left unconfigured. - - The `DEFAULT_RECIPIENT_PD` can be edited in the following entries at the bottom of the same file: - ```conf - role_recipients_pd[sysadmin]="xxxxxxxxxxxxxxxxxxxxxxxxxxxxxxxa" - role_recipients_pd[domainadmin]="xxxxxxxxxxxxxxxxxxxxxxxxxxxxxxxb" - role_recipients_pd[dba]="xxxxxxxxxxxxxxxxxxxxxxxxxxxxxxxc" - role_recipients_pd[webmaster]="xxxxxxxxxxxxxxxxxxxxxxxxxxxxxxxd" - role_recipients_pd[proxyadmin]="xxxxxxxxxxxxxxxxxxxxxxxxxxxxxxxe" - role_recipients_pd[sitemgr]="xxxxxxxxxxxxxxxxxxxxxxxxxxxxxxxf" - ``` - examples: - folding: - enabled: true - title: '' - list: - - name: 'Basic Configuration' - folding: - enabled: false - description: '' - config: | - #------------------------------------------------------------------------------ - # pagerduty.com notification options - - SEND_PD="YES" - DEFAULT_RECIPIENT_PD="xxxxxxxxxxxxxxxxxxxxxxxxxxxxxxxx" - USE_PD_VERSION="2" - troubleshooting: - problems: - list: [] diff --git a/health/notifications/prowl/Makefile.inc b/health/notifications/prowl/Makefile.inc deleted file mode 100644 index 64a1deb6..00000000 --- a/health/notifications/prowl/Makefile.inc +++ /dev/null @@ -1,12 +0,0 @@ -# SPDX-License-Identifier: GPL-3.0-or-later - -# THIS IS NOT A COMPLETE Makefile -# IT IS INCLUDED BY ITS PARENT'S Makefile.am -# IT IS REQUIRED TO REFERENCE ALL FILES RELATIVE TO THE PARENT - -# install these files -dist_noinst_DATA += \ - prowl/README.md \ - prowl/Makefile.inc \ - $(NULL) - diff --git a/health/notifications/prowl/README.md b/health/notifications/prowl/README.md deleted file mode 100644 index dcd9bbb5..00000000 --- a/health/notifications/prowl/README.md +++ /dev/null @@ -1,119 +0,0 @@ -<!--startmeta -custom_edit_url: "https://github.com/netdata/netdata/edit/master/health/notifications/prowl/README.md" -meta_yaml: "https://github.com/netdata/netdata/edit/master/health/notifications/prowl/metadata.yaml" -sidebar_label: "Prowl" -learn_status: "Published" -learn_rel_path: "Alerting/Notifications/Agent Dispatched Notifications" -message: "DO NOT EDIT THIS FILE DIRECTLY, IT IS GENERATED BY THE NOTIFICATION'S metadata.yaml FILE" -endmeta--> - -# Prowl - - -<img src="https://netdata.cloud/img/prowl.png" width="150"/> - - -Send notifications to Prowl using Netdata's Agent alert notification feature, which supports dozens of endpoints, user roles, and more. - - -<img src="https://img.shields.io/badge/maintained%20by-Netdata-%2300ab44" /> - -## Limitations - -- Because of how Netdata integrates with Prowl, there is a hard limit of at most 1000 notifications per hour (starting from the first notification sent). Any alerts beyond the first thousand in an hour will be dropped. -- Warning messages will be sent with the 'High' priority, critical messages will be sent with the 'Emergency' priority, and all other messages will be sent with the normal priority. Opening the notification's associated URL will take you to the Netdata dashboard of the system that issued the alert, directly to the chart that it triggered on. - - - -## Setup - -### Prerequisites - -#### - -- A Prowl API key, which can be requested through the Prowl website after registering -- Access to the terminal where Netdata Agent is running - - - -### Configuration - -#### File - -The configuration file name for this integration is `health_alarm_notify.conf`. - - -You can edit the configuration file using the `edit-config` script from the -Netdata [config directory](https://github.com/netdata/netdata/blob/master/docs/configure/nodes.md#the-netdata-config-directory). - -```bash -cd /etc/netdata 2>/dev/null || cd /opt/netdata/etc/netdata -sudo ./edit-config health_alarm_notify.conf -``` -#### Options - -The following options can be defined for this notification - -<details><summary>Config Options</summary> - -| Name | Description | Default | Required | -|:----|:-----------|:-------|:--------:| -| SEND_PROWL | Set `SEND_PROWL` to YES | YES | yes | -| DEFAULT_RECIPIENT_PROWL | Set `DEFAULT_RECIPIENT_PROWL` to the Prowl API key you want the alert notifications to be sent to. You can define multiple API keys like this: `APIKEY1`, `APIKEY2`. | | yes | - -##### DEFAULT_RECIPIENT_PROWL - -All roles will default to this variable if left unconfigured. - -The `DEFAULT_RECIPIENT_PROWL` can be edited in the following entries at the bottom of the same file: -```conf -role_recipients_prowl[sysadmin]="AAAAAAAA" -role_recipients_prowl[domainadmin]="BBBBBBBBB" -role_recipients_prowl[dba]="CCCCCCCCC" -role_recipients_prowl[webmaster]="DDDDDDDDDD" -role_recipients_prowl[proxyadmin]="EEEEEEEEEE" -role_recipients_prowl[sitemgr]="FFFFFFFFFF" -``` - - -</details> - -#### Examples - -##### Basic Configuration - - - -```yaml -#------------------------------------------------------------------------------ -# iOS Push Notifications - -SEND_PROWL="YES" -DEFAULT_RECIPIENT_PROWL="XXXXXXXXXX" - -``` - - -## Troubleshooting - -### Test Notification - -You can run the following command by hand, to test alerts configuration: - -```bash -# become user netdata -sudo su -s /bin/bash netdata - -# enable debugging info on the console -export NETDATA_ALARM_NOTIFY_DEBUG=1 - -# send test alarms to sysadmin -/usr/libexec/netdata/plugins.d/alarm-notify.sh test - -# send test alarms to any role -/usr/libexec/netdata/plugins.d/alarm-notify.sh test "ROLE" -``` - -Note that this will test _all_ alert mechanisms for the selected role. - - diff --git a/health/notifications/prowl/metadata.yaml b/health/notifications/prowl/metadata.yaml deleted file mode 100644 index b3f0e0a1..00000000 --- a/health/notifications/prowl/metadata.yaml +++ /dev/null @@ -1,71 +0,0 @@ -# yamllint disable rule:line-length ---- -- id: 'notify-prowl' - meta: - name: 'Prowl' - link: 'https://www.prowlapp.com/' - categories: - - notify.agent - icon_filename: 'prowl.png' - keywords: - - Prowl - overview: - notification_description: | - Send notifications to Prowl using Netdata's Agent alert notification feature, which supports dozens of endpoints, user roles, and more. - notification_limitations: | - - Because of how Netdata integrates with Prowl, there is a hard limit of at most 1000 notifications per hour (starting from the first notification sent). Any alerts beyond the first thousand in an hour will be dropped. - - Warning messages will be sent with the 'High' priority, critical messages will be sent with the 'Emergency' priority, and all other messages will be sent with the normal priority. Opening the notification's associated URL will take you to the Netdata dashboard of the system that issued the alert, directly to the chart that it triggered on. - setup: - prerequisites: - list: - - title: '' - description: | - - A Prowl API key, which can be requested through the Prowl website after registering - - Access to the terminal where Netdata Agent is running - configuration: - file: - name: 'health_alarm_notify.conf' - options: - description: 'The following options can be defined for this notification' - folding: - title: 'Config Options' - enabled: true - list: - - name: 'SEND_PROWL' - default_value: 'YES' - description: "Set `SEND_PROWL` to YES" - required: true - - name: 'DEFAULT_RECIPIENT_PROWL' - default_value: '' - description: "Set `DEFAULT_RECIPIENT_PROWL` to the Prowl API key you want the alert notifications to be sent to. You can define multiple API keys like this: `APIKEY1`, `APIKEY2`." - required: true - detailed_description: | - All roles will default to this variable if left unconfigured. - - The `DEFAULT_RECIPIENT_PROWL` can be edited in the following entries at the bottom of the same file: - ```conf - role_recipients_prowl[sysadmin]="AAAAAAAA" - role_recipients_prowl[domainadmin]="BBBBBBBBB" - role_recipients_prowl[dba]="CCCCCCCCC" - role_recipients_prowl[webmaster]="DDDDDDDDDD" - role_recipients_prowl[proxyadmin]="EEEEEEEEEE" - role_recipients_prowl[sitemgr]="FFFFFFFFFF" - ``` - examples: - folding: - enabled: true - title: '' - list: - - name: 'Basic Configuration' - folding: - enabled: false - description: '' - config: | - #------------------------------------------------------------------------------ - # iOS Push Notifications - - SEND_PROWL="YES" - DEFAULT_RECIPIENT_PROWL="XXXXXXXXXX" - troubleshooting: - problems: - list: [] diff --git a/health/notifications/pushbullet/Makefile.inc b/health/notifications/pushbullet/Makefile.inc deleted file mode 100644 index d3a9459e..00000000 --- a/health/notifications/pushbullet/Makefile.inc +++ /dev/null @@ -1,12 +0,0 @@ -# SPDX-License-Identifier: GPL-3.0-or-later - -# THIS IS NOT A COMPLETE Makefile -# IT IS INCLUDED BY ITS PARENT'S Makefile.am -# IT IS REQUIRED TO REFERENCE ALL FILES RELATIVE TO THE PARENT - -# install these files -dist_noinst_DATA += \ - pushbullet/README.md \ - pushbullet/Makefile.inc \ - $(NULL) - diff --git a/health/notifications/pushbullet/README.md b/health/notifications/pushbullet/README.md deleted file mode 100644 index 74832571..00000000 --- a/health/notifications/pushbullet/README.md +++ /dev/null @@ -1,117 +0,0 @@ -<!--startmeta -custom_edit_url: "https://github.com/netdata/netdata/edit/master/health/notifications/pushbullet/README.md" -meta_yaml: "https://github.com/netdata/netdata/edit/master/health/notifications/pushbullet/metadata.yaml" -sidebar_label: "Pushbullet" -learn_status: "Published" -learn_rel_path: "Alerting/Notifications/Agent Dispatched Notifications" -message: "DO NOT EDIT THIS FILE DIRECTLY, IT IS GENERATED BY THE NOTIFICATION'S metadata.yaml FILE" -endmeta--> - -# Pushbullet - - -<img src="https://netdata.cloud/img/pushbullet.png" width="150"/> - - -Send notifications to Pushbullet using Netdata's Agent alert notification feature, which supports dozens of endpoints, user roles, and more. - - - -<img src="https://img.shields.io/badge/maintained%20by-Netdata-%2300ab44" /> - -## Setup - -### Prerequisites - -#### - -- A Pushbullet access token that can be created in your [account settings](https://www.pushbullet.com/#settings/account). -- Access to the terminal where Netdata Agent is running - - - -### Configuration - -#### File - -The configuration file name for this integration is `health_alarm_notify.conf`. - - -You can edit the configuration file using the `edit-config` script from the -Netdata [config directory](https://github.com/netdata/netdata/blob/master/docs/configure/nodes.md#the-netdata-config-directory). - -```bash -cd /etc/netdata 2>/dev/null || cd /opt/netdata/etc/netdata -sudo ./edit-config health_alarm_notify.conf -``` -#### Options - -The following options can be defined for this notification - -<details><summary>Config Options</summary> - -| Name | Description | Default | Required | -|:----|:-----------|:-------|:--------:| -| Send_PUSHBULLET | Set `Send_PUSHBULLET` to YES | YES | yes | -| PUSHBULLET_ACCESS_TOKEN | set `PUSHBULLET_ACCESS_TOKEN` to the access token you generated. | | yes | -| DEFAULT_RECIPIENT_PUSHBULLET | Set `DEFAULT_RECIPIENT_PUSHBULLET` to the email (e.g. `example@domain.com`) or the channel tag (e.g. `#channel`) you want the alert notifications to be sent to. | | yes | - -##### DEFAULT_RECIPIENT_PUSHBULLET - -You can define multiple entries like this: user1@email.com user2@email.com. - -All roles will default to this variable if left unconfigured. - -The `DEFAULT_RECIPIENT_PUSHBULLET` can be edited in the following entries at the bottom of the same file: -```conf -role_recipients_pushbullet[sysadmin]="user1@email.com" -role_recipients_pushbullet[domainadmin]="user2@mail.com" -role_recipients_pushbullet[dba]="#channel1" -role_recipients_pushbullet[webmaster]="#channel2" -role_recipients_pushbullet[proxyadmin]="user3@mail.com" -role_recipients_pushbullet[sitemgr]="user4@mail.com" -``` - - -</details> - -#### Examples - -##### Basic Configuration - - - -```yaml -#------------------------------------------------------------------------------ -# pushbullet (pushbullet.com) push notification options - -SEND_PUSHBULLET="YES" -PUSHBULLET_ACCESS_TOKEN="XXXXXXXXX" -DEFAULT_RECIPIENT_PUSHBULLET="admin1@example.com admin3@somemail.com #examplechanneltag #anotherchanneltag" - -``` - - -## Troubleshooting - -### Test Notification - -You can run the following command by hand, to test alerts configuration: - -```bash -# become user netdata -sudo su -s /bin/bash netdata - -# enable debugging info on the console -export NETDATA_ALARM_NOTIFY_DEBUG=1 - -# send test alarms to sysadmin -/usr/libexec/netdata/plugins.d/alarm-notify.sh test - -# send test alarms to any role -/usr/libexec/netdata/plugins.d/alarm-notify.sh test "ROLE" -``` - -Note that this will test _all_ alert mechanisms for the selected role. - - diff --git a/health/notifications/pushbullet/metadata.yaml b/health/notifications/pushbullet/metadata.yaml deleted file mode 100644 index 430033cc..00000000 --- a/health/notifications/pushbullet/metadata.yaml +++ /dev/null @@ -1,76 +0,0 @@ -# yamllint disable rule:line-length ---- -- id: 'notify-pushbullet' - meta: - name: 'Pushbullet' - link: 'https://www.pushbullet.com/' - categories: - - notify.agent - icon_filename: 'pushbullet.png' - keywords: - - Pushbullet - overview: - notification_description: | - Send notifications to Pushbullet using Netdata's Agent alert notification feature, which supports dozens of endpoints, user roles, and more. - notification_limitations: '' - setup: - prerequisites: - list: - - title: '' - description: | - - A Pushbullet access token that can be created in your [account settings](https://www.pushbullet.com/#settings/account). - - Access to the terminal where Netdata Agent is running - configuration: - file: - name: 'health_alarm_notify.conf' - options: - description: 'The following options can be defined for this notification' - folding: - title: 'Config Options' - enabled: true - list: - - name: 'Send_PUSHBULLET' - default_value: 'YES' - description: "Set `Send_PUSHBULLET` to YES" - required: true - - name: 'PUSHBULLET_ACCESS_TOKEN' - default_value: '' - description: "set `PUSHBULLET_ACCESS_TOKEN` to the access token you generated." - required: true - - name: 'DEFAULT_RECIPIENT_PUSHBULLET' - default_value: '' - description: "Set `DEFAULT_RECIPIENT_PUSHBULLET` to the email (e.g. `example@domain.com`) or the channel tag (e.g. `#channel`) you want the alert notifications to be sent to." - required: true - detailed_description: | - You can define multiple entries like this: user1@email.com user2@email.com. - - All roles will default to this variable if left unconfigured. - - The `DEFAULT_RECIPIENT_PUSHBULLET` can be edited in the following entries at the bottom of the same file: - ```conf - role_recipients_pushbullet[sysadmin]="user1@email.com" - role_recipients_pushbullet[domainadmin]="user2@mail.com" - role_recipients_pushbullet[dba]="#channel1" - role_recipients_pushbullet[webmaster]="#channel2" - role_recipients_pushbullet[proxyadmin]="user3@mail.com" - role_recipients_pushbullet[sitemgr]="user4@mail.com" - ``` - examples: - folding: - enabled: true - title: '' - list: - - name: 'Basic Configuration' - folding: - enabled: false - description: '' - config: | - #------------------------------------------------------------------------------ - # pushbullet (pushbullet.com) push notification options - - SEND_PUSHBULLET="YES" - PUSHBULLET_ACCESS_TOKEN="XXXXXXXXX" - DEFAULT_RECIPIENT_PUSHBULLET="admin1@example.com admin3@somemail.com #examplechanneltag #anotherchanneltag" - troubleshooting: - problems: - list: [] diff --git a/health/notifications/pushover/Makefile.inc b/health/notifications/pushover/Makefile.inc deleted file mode 100644 index 9b703a14..00000000 --- a/health/notifications/pushover/Makefile.inc +++ /dev/null @@ -1,12 +0,0 @@ -# SPDX-License-Identifier: GPL-3.0-or-later - -# THIS IS NOT A COMPLETE Makefile -# IT IS INCLUDED BY ITS PARENT'S Makefile.am -# IT IS REQUIRED TO REFERENCE ALL FILES RELATIVE TO THE PARENT - -# install these files -dist_noinst_DATA += \ - pushover/README.md \ - pushover/Makefile.inc \ - $(NULL) - diff --git a/health/notifications/pushover/README.md b/health/notifications/pushover/README.md deleted file mode 100644 index c8727ed4..00000000 --- a/health/notifications/pushover/README.md +++ /dev/null @@ -1,119 +0,0 @@ -<!--startmeta -custom_edit_url: "https://github.com/netdata/netdata/edit/master/health/notifications/pushover/README.md" -meta_yaml: "https://github.com/netdata/netdata/edit/master/health/notifications/pushover/metadata.yaml" -sidebar_label: "PushOver" -learn_status: "Published" -learn_rel_path: "Alerting/Notifications/Agent Dispatched Notifications" -message: "DO NOT EDIT THIS FILE DIRECTLY, IT IS GENERATED BY THE NOTIFICATION'S metadata.yaml FILE" -endmeta--> - -# PushOver - - -<img src="https://netdata.cloud/img/pushover.png" width="150"/> - - -Send notification to Pushover using Netdata's Agent alert notification feature, which supports dozens of endpoints, user roles, and more. -- Netdata will send warning messages with priority 0 and critical messages with priority 1. -- Pushover allows you to select do-not-disturb hours. The way this is configured, critical notifications will ring and vibrate your phone, even during the do-not-disturb-hours. -- All other notifications will be delivered silently. - - - -<img src="https://img.shields.io/badge/maintained%20by-Netdata-%2300ab44" /> - -## Setup - -### Prerequisites - -#### - -- An Application token. You can use the same on all your Netdata servers. -- A User token for each user you are going to send notifications to. This is the actual recipient of the notification. -- Access to the terminal where Netdata Agent is running - - - -### Configuration - -#### File - -The configuration file name for this integration is `health_alarm_notify.conf`. - - -You can edit the configuration file using the `edit-config` script from the -Netdata [config directory](https://github.com/netdata/netdata/blob/master/docs/configure/nodes.md#the-netdata-config-directory). - -```bash -cd /etc/netdata 2>/dev/null || cd /opt/netdata/etc/netdata -sudo ./edit-config health_alarm_notify.conf -``` -#### Options - -The following options can be defined for this notification - -<details><summary>Config Options</summary> - -| Name | Description | Default | Required | -|:----|:-----------|:-------|:--------:| -| SEND_PUSHOVER | Set `SEND_PUSHOVER` to YES | YES | yes | -| PUSHOVER_WEBHOOK_URL | set `PUSHOVER_WEBHOOK_URL` to your Pushover Application token. | | yes | -| DEFAULT_RECIPIENT_PUSHOVER | Set `DEFAULT_RECIPIENT_PUSHOVER` the Pushover User token you want the alert notifications to be sent to. You can define multiple User tokens like this: `USERTOKEN1` `USERTOKEN2`. | | yes | - -##### DEFAULT_RECIPIENT_PUSHOVER - -All roles will default to this variable if left unconfigured. - -The `DEFAULT_RECIPIENT_PUSHOVER` can be edited in the following entries at the bottom of the same file: -```conf -role_recipients_pushover[sysadmin]="USERTOKEN1" -role_recipients_pushover[domainadmin]="USERTOKEN2" -role_recipients_pushover[dba]="USERTOKEN3 USERTOKEN4" -role_recipients_pushover[webmaster]="USERTOKEN5" -role_recipients_pushover[proxyadmin]="USERTOKEN6" -role_recipients_pushover[sitemgr]="USERTOKEN7" -``` - - -</details> - -#### Examples - -##### Basic Configuration - - - -```yaml -#------------------------------------------------------------------------------ -# pushover (pushover.net) global notification options - -SEND_PUSHOVER="YES" -PUSHOVER_APP_TOKEN="XXXXXXXXX" -DEFAULT_RECIPIENT_PUSHOVER="USERTOKEN" - -``` - - -## Troubleshooting - -### Test Notification - -You can run the following command by hand, to test alerts configuration: - -```bash -# become user netdata -sudo su -s /bin/bash netdata - -# enable debugging info on the console -export NETDATA_ALARM_NOTIFY_DEBUG=1 - -# send test alarms to sysadmin -/usr/libexec/netdata/plugins.d/alarm-notify.sh test - -# send test alarms to any role -/usr/libexec/netdata/plugins.d/alarm-notify.sh test "ROLE" -``` - -Note that this will test _all_ alert mechanisms for the selected role. - - diff --git a/health/notifications/pushover/metadata.yaml b/health/notifications/pushover/metadata.yaml deleted file mode 100644 index 9af729ea..00000000 --- a/health/notifications/pushover/metadata.yaml +++ /dev/null @@ -1,78 +0,0 @@ -# yamllint disable rule:line-length ---- -- id: 'notify-pushover' - meta: - name: 'PushOver' - link: 'https://pushover.net/' - categories: - - notify.agent - icon_filename: 'pushover.png' - keywords: - - PushOver - overview: - notification_description: | - Send notification to Pushover using Netdata's Agent alert notification feature, which supports dozens of endpoints, user roles, and more. - - Netdata will send warning messages with priority 0 and critical messages with priority 1. - - Pushover allows you to select do-not-disturb hours. The way this is configured, critical notifications will ring and vibrate your phone, even during the do-not-disturb-hours. - - All other notifications will be delivered silently. - notification_limitations: '' - setup: - prerequisites: - list: - - title: '' - description: | - - An Application token. You can use the same on all your Netdata servers. - - A User token for each user you are going to send notifications to. This is the actual recipient of the notification. - - Access to the terminal where Netdata Agent is running - configuration: - file: - name: 'health_alarm_notify.conf' - options: - description: 'The following options can be defined for this notification' - folding: - title: 'Config Options' - enabled: true - list: - - name: 'SEND_PUSHOVER' - default_value: 'YES' - description: "Set `SEND_PUSHOVER` to YES" - required: true - - name: 'PUSHOVER_WEBHOOK_URL' - default_value: '' - description: "set `PUSHOVER_WEBHOOK_URL` to your Pushover Application token." - required: true - - name: 'DEFAULT_RECIPIENT_PUSHOVER' - default_value: '' - description: "Set `DEFAULT_RECIPIENT_PUSHOVER` the Pushover User token you want the alert notifications to be sent to. You can define multiple User tokens like this: `USERTOKEN1` `USERTOKEN2`." - required: true - detailed_description: | - All roles will default to this variable if left unconfigured. - - The `DEFAULT_RECIPIENT_PUSHOVER` can be edited in the following entries at the bottom of the same file: - ```conf - role_recipients_pushover[sysadmin]="USERTOKEN1" - role_recipients_pushover[domainadmin]="USERTOKEN2" - role_recipients_pushover[dba]="USERTOKEN3 USERTOKEN4" - role_recipients_pushover[webmaster]="USERTOKEN5" - role_recipients_pushover[proxyadmin]="USERTOKEN6" - role_recipients_pushover[sitemgr]="USERTOKEN7" - ``` - examples: - folding: - enabled: true - title: '' - list: - - name: 'Basic Configuration' - folding: - enabled: false - description: '' - config: | - #------------------------------------------------------------------------------ - # pushover (pushover.net) global notification options - - SEND_PUSHOVER="YES" - PUSHOVER_APP_TOKEN="XXXXXXXXX" - DEFAULT_RECIPIENT_PUSHOVER="USERTOKEN" - troubleshooting: - problems: - list: [] diff --git a/health/notifications/rocketchat/Makefile.inc b/health/notifications/rocketchat/Makefile.inc deleted file mode 100644 index 58f210b6..00000000 --- a/health/notifications/rocketchat/Makefile.inc +++ /dev/null @@ -1,12 +0,0 @@ -# SPDX-License-Identifier: GPL-3.0-or-later - -# THIS IS NOT A COMPLETE Makefile -# IT IS INCLUDED BY ITS PARENT'S Makefile.am -# IT IS REQUIRED TO REFERENCE ALL FILES RELATIVE TO THE PARENT - -# install these files -dist_noinst_DATA += \ - rocketchat/README.md \ - rocketchat/Makefile.inc \ - $(NULL) - diff --git a/health/notifications/rocketchat/README.md b/health/notifications/rocketchat/README.md deleted file mode 100644 index 59c35124..00000000 --- a/health/notifications/rocketchat/README.md +++ /dev/null @@ -1,116 +0,0 @@ -<!--startmeta -custom_edit_url: "https://github.com/netdata/netdata/edit/master/health/notifications/rocketchat/README.md" -meta_yaml: "https://github.com/netdata/netdata/edit/master/health/notifications/rocketchat/metadata.yaml" -sidebar_label: "RocketChat" -learn_status: "Published" -learn_rel_path: "Alerting/Notifications/Agent Dispatched Notifications" -message: "DO NOT EDIT THIS FILE DIRECTLY, IT IS GENERATED BY THE NOTIFICATION'S metadata.yaml FILE" -endmeta--> - -# RocketChat - - -<img src="https://netdata.cloud/img/rocketchat.png" width="150"/> - - -Send notifications to Rocket.Chat using Netdata's Agent alert notification feature, which supports dozens of endpoints, user roles, and more. - - - -<img src="https://img.shields.io/badge/maintained%20by-Netdata-%2300ab44" /> - -## Setup - -### Prerequisites - -#### - -- The incoming webhook URL as given by RocketChat. You can use the same on all your Netdata servers (or you can have multiple if you like - your decision). -- One or more channels to post the messages to -- Access to the terminal where Netdata Agent is running - - - -### Configuration - -#### File - -The configuration file name for this integration is `health_alarm_notify.conf`. - - -You can edit the configuration file using the `edit-config` script from the -Netdata [config directory](https://github.com/netdata/netdata/blob/master/docs/configure/nodes.md#the-netdata-config-directory). - -```bash -cd /etc/netdata 2>/dev/null || cd /opt/netdata/etc/netdata -sudo ./edit-config health_alarm_notify.conf -``` -#### Options - -The following options can be defined for this notification - -<details><summary>Config Options</summary> - -| Name | Description | Default | Required | -|:----|:-----------|:-------|:--------:| -| SEND_ROCKETCHAT | Set `SEND_ROCKETCHAT` to `YES` | YES | yes | -| ROCKETCHAT_WEBHOOK_URL | set `ROCKETCHAT_WEBHOOK_URL` to your webhook URL. | | yes | -| DEFAULT_RECIPIENT_ROCKETCHAT | Set `DEFAULT_RECIPIENT_ROCKETCHAT` to the channel you want the alert notifications to be sent to. You can define multiple channels like this: `alerts` `systems`. | | yes | - -##### DEFAULT_RECIPIENT_ROCKETCHAT - -All roles will default to this variable if left unconfigured. - -The `DEFAULT_RECIPIENT_ROCKETCHAT` can be edited in the following entries at the bottom of the same file: -```conf -role_recipients_rocketchat[sysadmin]="systems" -role_recipients_rocketchat[domainadmin]="domains" -role_recipients_rocketchat[dba]="databases systems" -role_recipients_rocketchat[webmaster]="marketing development" -role_recipients_rocketchat[proxyadmin]="proxy_admin" -role_recipients_rocketchat[sitemgr]="sites" -``` - - -</details> - -#### Examples - -##### Basic Configuration - - - -```yaml -#------------------------------------------------------------------------------ -# rocketchat (rocket.chat) global notification options - -SEND_ROCKETCHAT="YES" -ROCKETCHAT_WEBHOOK_URL="<your_incoming_webhook_url>" -DEFAULT_RECIPIENT_ROCKETCHAT="monitoring_alarms" - -``` - - -## Troubleshooting - -### Test Notification - -You can run the following command by hand, to test alerts configuration: - -```bash -# become user netdata -sudo su -s /bin/bash netdata - -# enable debugging info on the console -export NETDATA_ALARM_NOTIFY_DEBUG=1 - -# send test alarms to sysadmin -/usr/libexec/netdata/plugins.d/alarm-notify.sh test - -# send test alarms to any role -/usr/libexec/netdata/plugins.d/alarm-notify.sh test "ROLE" -``` - -Note that this will test _all_ alert mechanisms for the selected role. - - diff --git a/health/notifications/rocketchat/metadata.yaml b/health/notifications/rocketchat/metadata.yaml deleted file mode 100644 index f644b93e..00000000 --- a/health/notifications/rocketchat/metadata.yaml +++ /dev/null @@ -1,75 +0,0 @@ -# yamllint disable rule:line-length ---- -- id: 'notify-rocketchat' - meta: - name: 'RocketChat' - link: 'https://rocket.chat/' - categories: - - notify.agent - icon_filename: 'rocketchat.png' - keywords: - - RocketChat - overview: - notification_description: | - Send notifications to Rocket.Chat using Netdata's Agent alert notification feature, which supports dozens of endpoints, user roles, and more. - notification_limitations: '' - setup: - prerequisites: - list: - - title: '' - description: | - - The incoming webhook URL as given by RocketChat. You can use the same on all your Netdata servers (or you can have multiple if you like - your decision). - - One or more channels to post the messages to - - Access to the terminal where Netdata Agent is running - configuration: - file: - name: 'health_alarm_notify.conf' - options: - description: 'The following options can be defined for this notification' - folding: - title: 'Config Options' - enabled: true - list: - - name: 'SEND_ROCKETCHAT' - default_value: 'YES' - description: "Set `SEND_ROCKETCHAT` to `YES`" - required: true - - name: 'ROCKETCHAT_WEBHOOK_URL' - default_value: '' - description: "set `ROCKETCHAT_WEBHOOK_URL` to your webhook URL." - required: true - - name: 'DEFAULT_RECIPIENT_ROCKETCHAT' - default_value: '' - description: "Set `DEFAULT_RECIPIENT_ROCKETCHAT` to the channel you want the alert notifications to be sent to. You can define multiple channels like this: `alerts` `systems`." - required: true - detailed_description: | - All roles will default to this variable if left unconfigured. - - The `DEFAULT_RECIPIENT_ROCKETCHAT` can be edited in the following entries at the bottom of the same file: - ```conf - role_recipients_rocketchat[sysadmin]="systems" - role_recipients_rocketchat[domainadmin]="domains" - role_recipients_rocketchat[dba]="databases systems" - role_recipients_rocketchat[webmaster]="marketing development" - role_recipients_rocketchat[proxyadmin]="proxy_admin" - role_recipients_rocketchat[sitemgr]="sites" - ``` - examples: - folding: - enabled: true - title: '' - list: - - name: 'Basic Configuration' - folding: - enabled: false - description: '' - config: | - #------------------------------------------------------------------------------ - # rocketchat (rocket.chat) global notification options - - SEND_ROCKETCHAT="YES" - ROCKETCHAT_WEBHOOK_URL="<your_incoming_webhook_url>" - DEFAULT_RECIPIENT_ROCKETCHAT="monitoring_alarms" - troubleshooting: - problems: - list: [] diff --git a/health/notifications/sample-metadata.yaml b/health/notifications/sample-metadata.yaml deleted file mode 100644 index 41a287ae..00000000 --- a/health/notifications/sample-metadata.yaml +++ /dev/null @@ -1,39 +0,0 @@ -id: '' -meta: - name: '' - link: '' - categories: [] - icon_filename: '' -keywords: [] -overview: - exporter_description: '' - exporter_limitations: '' -setup: - prerequisites: - list: - - title: '' - description: '' - configuration: - file: - name: '' - description: '' - options: - description: '' - folding: - title: '' - enabled: true - list: - - name: '' - default_value: '' - description: '' - required: false - examples: - folding: - enabled: true - title: '' - list: - - name: '' - folding: - enabled: false - description: '' - config: '' diff --git a/health/notifications/slack/Makefile.inc b/health/notifications/slack/Makefile.inc deleted file mode 100644 index 043bfaf0..00000000 --- a/health/notifications/slack/Makefile.inc +++ /dev/null @@ -1,12 +0,0 @@ -# SPDX-License-Identifier: GPL-3.0-or-later - -# THIS IS NOT A COMPLETE Makefile -# IT IS INCLUDED BY ITS PARENT'S Makefile.am -# IT IS REQUIRED TO REFERENCE ALL FILES RELATIVE TO THE PARENT - -# install these files -dist_noinst_DATA += \ - slack/README.md \ - slack/Makefile.inc \ - $(NULL) - diff --git a/health/notifications/slack/README.md b/health/notifications/slack/README.md deleted file mode 100644 index dfe87f99..00000000 --- a/health/notifications/slack/README.md +++ /dev/null @@ -1,101 +0,0 @@ -<!--startmeta -custom_edit_url: "https://github.com/netdata/netdata/edit/master/health/notifications/slack/README.md" -meta_yaml: "https://github.com/netdata/netdata/edit/master/health/notifications/slack/metadata.yaml" -sidebar_label: "Slack" -learn_status: "Published" -learn_rel_path: "Alerting/Notifications/Agent Dispatched Notifications" -message: "DO NOT EDIT THIS FILE DIRECTLY, IT IS GENERATED BY THE NOTIFICATION'S metadata.yaml FILE" -endmeta--> - -# Slack - - -<img src="https://netdata.cloud/img/slack.png" width="150"/> - - -Send notifications to a Slack workspace using Netdata's Agent alert notification feature, which supports dozens of endpoints, user roles, and more. - - - -<img src="https://img.shields.io/badge/maintained%20by-Netdata-%2300ab44" /> - -## Setup - -### Prerequisites - -#### - -- Slack app along with an incoming webhook, read Slack's guide on the topic [here](https://api.slack.com/messaging/webhooks). -- One or more channels to post the messages to -- Access to the terminal where Netdata Agent is running - - - -### Configuration - -#### File - -The configuration file name for this integration is `health_alarm_notify.conf`. - - -You can edit the configuration file using the `edit-config` script from the -Netdata [config directory](https://github.com/netdata/netdata/blob/master/docs/configure/nodes.md#the-netdata-config-directory). - -```bash -cd /etc/netdata 2>/dev/null || cd /opt/netdata/etc/netdata -sudo ./edit-config health_alarm_notify.conf -``` -#### Options - -The following options can be defined for this notification - -<details><summary>Config Options</summary> - -| Name | Description | Default | Required | -|:----|:-----------|:-------|:--------:| -| SEND_SLACK | Set `SEND_SLACK` to YES | YES | yes | -| SLACK_WEBHOOK_URL | set `SLACK_WEBHOOK_URL` to your Slack app's webhook URL. | | yes | -| DEFAULT_RECIPIENT_SLACK | Set `DEFAULT_RECIPIENT_SLACK` to the Slack channel your Slack app is set to send messages to. The syntax for channels is `#channel` or `channel`. | | yes | - -</details> - -#### Examples - -##### Basic Configuration - - - -```yaml -#------------------------------------------------------------------------------ -# slack (slack.com) global notification options - -SEND_SLACK="YES" -SLACK_WEBHOOK_URL="https://hooks.slack.com/services/XXXXXXXX/XXXXXXXX/XXXXXXXXXXXXXXXXXXXXXXXXXXXXXXX" -DEFAULT_RECIPIENT_SLACK="#alarms" - -``` - - -## Troubleshooting - -### Test Notification - -You can run the following command by hand, to test alerts configuration: - -```bash -# become user netdata -sudo su -s /bin/bash netdata - -# enable debugging info on the console -export NETDATA_ALARM_NOTIFY_DEBUG=1 - -# send test alarms to sysadmin -/usr/libexec/netdata/plugins.d/alarm-notify.sh test - -# send test alarms to any role -/usr/libexec/netdata/plugins.d/alarm-notify.sh test "ROLE" -``` - -Note that this will test _all_ alert mechanisms for the selected role. - - diff --git a/health/notifications/slack/metadata.yaml b/health/notifications/slack/metadata.yaml deleted file mode 100644 index 226c7ca3..00000000 --- a/health/notifications/slack/metadata.yaml +++ /dev/null @@ -1,63 +0,0 @@ -# yamllint disable rule:line-length ---- -- id: 'notify-slack' - meta: - name: 'Slack' - link: 'https://slack.com/' - categories: - - notify.agent - icon_filename: 'slack.png' - keywords: - - Slack - overview: - notification_description: | - Send notifications to a Slack workspace using Netdata's Agent alert notification feature, which supports dozens of endpoints, user roles, and more. - notification_limitations: '' - setup: - prerequisites: - list: - - title: '' - description: | - - Slack app along with an incoming webhook, read Slack's guide on the topic [here](https://api.slack.com/messaging/webhooks). - - One or more channels to post the messages to - - Access to the terminal where Netdata Agent is running - configuration: - file: - name: 'health_alarm_notify.conf' - options: - description: 'The following options can be defined for this notification' - folding: - title: 'Config Options' - enabled: true - list: - - name: 'SEND_SLACK' - default_value: 'YES' - description: "Set `SEND_SLACK` to YES" - required: true - - name: 'SLACK_WEBHOOK_URL' - default_value: '' - description: "set `SLACK_WEBHOOK_URL` to your Slack app's webhook URL." - required: true - - name: 'DEFAULT_RECIPIENT_SLACK' - default_value: '' - description: "Set `DEFAULT_RECIPIENT_SLACK` to the Slack channel your Slack app is set to send messages to. The syntax for channels is `#channel` or `channel`." - required: true - examples: - folding: - enabled: true - title: '' - list: - - name: 'Basic Configuration' - folding: - enabled: false - description: '' - config: | - #------------------------------------------------------------------------------ - # slack (slack.com) global notification options - - SEND_SLACK="YES" - SLACK_WEBHOOK_URL="https://hooks.slack.com/services/XXXXXXXX/XXXXXXXX/XXXXXXXXXXXXXXXXXXXXXXXXXXXXXXX" - DEFAULT_RECIPIENT_SLACK="#alarms" - troubleshooting: - problems: - list: [] diff --git a/health/notifications/smstools3/Makefile.inc b/health/notifications/smstools3/Makefile.inc deleted file mode 100644 index 4764b9eb..00000000 --- a/health/notifications/smstools3/Makefile.inc +++ /dev/null @@ -1,12 +0,0 @@ -# SPDX-License-Identifier: GPL-3.0-or-later - -# THIS IS NOT A COMPLETE Makefile -# IT IS INCLUDED BY ITS PARENT'S Makefile.am -# IT IS REQUIRED TO REFERENCE ALL FILES RELATIVE TO THE PARENT - -# install these files -dist_noinst_DATA += \ - smstools3/README.md \ - smstools3/Makefile.inc \ - $(NULL) - diff --git a/health/notifications/smstools3/README.md b/health/notifications/smstools3/README.md deleted file mode 100644 index 3f08cc0f..00000000 --- a/health/notifications/smstools3/README.md +++ /dev/null @@ -1,126 +0,0 @@ -<!--startmeta -custom_edit_url: "https://github.com/netdata/netdata/edit/master/health/notifications/smstools3/README.md" -meta_yaml: "https://github.com/netdata/netdata/edit/master/health/notifications/smstools3/metadata.yaml" -sidebar_label: "SMS" -learn_status: "Published" -learn_rel_path: "Alerting/Notifications/Agent Dispatched Notifications" -message: "DO NOT EDIT THIS FILE DIRECTLY, IT IS GENERATED BY THE NOTIFICATION'S metadata.yaml FILE" -endmeta--> - -# SMS - - -<img src="https://netdata.cloud/img/sms.svg" width="150"/> - - -Send notifications to `smstools3` using Netdata's Agent alert notification feature, which supports dozens of endpoints, user roles, and more. -The SMS Server Tools 3 is a SMS Gateway software which can send and receive short messages through GSM modems and mobile phones. - - - -<img src="https://img.shields.io/badge/maintained%20by-Netdata-%2300ab44" /> - -## Setup - -### Prerequisites - -#### - -- [Install](http://smstools3.kekekasvi.com/index.php?p=compiling) and [configure](http://smstools3.kekekasvi.com/index.php?p=configure) `smsd` -- To ensure that the user `netdata` can execute `sendsms`. Any user executing `sendsms` needs to: - - Have write permissions to /tmp and /var/spool/sms/outgoing - - Be a member of group smsd - - To ensure that the steps above are successful, just su netdata and execute sendsms phone message. -- Access to the terminal where Netdata Agent is running - - - -### Configuration - -#### File - -The configuration file name for this integration is `health_alarm_notify.conf`. - - -You can edit the configuration file using the `edit-config` script from the -Netdata [config directory](https://github.com/netdata/netdata/blob/master/docs/configure/nodes.md#the-netdata-config-directory). - -```bash -cd /etc/netdata 2>/dev/null || cd /opt/netdata/etc/netdata -sudo ./edit-config health_alarm_notify.conf -``` -#### Options - -The following options can be defined for this notification - -<details><summary>Config Options</summary> - -| Name | Description | Default | Required | -|:----|:-----------|:-------|:--------:| -| sendsms | Set the path for `sendsms`, otherwise Netdata will search for it in your system `$PATH:` | YES | yes | -| SEND_SMS | Set `SEND_SMS` to `YES`. | | yes | -| DEFAULT_RECIPIENT_SMS | Set DEFAULT_RECIPIENT_SMS to the phone number you want the alert notifications to be sent to. You can define multiple phone numbers like this: PHONE1 PHONE2. | | yes | - -##### sendsms - -# The full path of the sendsms command (smstools3). -# If empty, the system $PATH will be searched for it. -# If not found, SMS notifications will be silently disabled. -sendsms="/usr/bin/sendsms" - - -##### DEFAULT_RECIPIENT_SMS - -All roles will default to this variable if left unconfigured. - -You can then have different phone numbers per role, by editing `DEFAULT_RECIPIENT_SMS` with the phone number you want, in the following entries at the bottom of the same file: -```conf -role_recipients_sms[sysadmin]="PHONE1" -role_recipients_sms[domainadmin]="PHONE2" -role_recipients_sms[dba]="PHONE3" -role_recipients_sms[webmaster]="PHONE4" -role_recipients_sms[proxyadmin]="PHONE5" -role_recipients_sms[sitemgr]="PHONE6" -``` - - -</details> - -#### Examples - -##### Basic Configuration - - - -```yaml -#------------------------------------------------------------------------------ -# SMS Server Tools 3 (smstools3) global notification options -SEND_SMS="YES" -DEFAULT_RECIPIENT_SMS="1234567890" - -``` - - -## Troubleshooting - -### Test Notification - -You can run the following command by hand, to test alerts configuration: - -```bash -# become user netdata -sudo su -s /bin/bash netdata - -# enable debugging info on the console -export NETDATA_ALARM_NOTIFY_DEBUG=1 - -# send test alarms to sysadmin -/usr/libexec/netdata/plugins.d/alarm-notify.sh test - -# send test alarms to any role -/usr/libexec/netdata/plugins.d/alarm-notify.sh test "ROLE" -``` - -Note that this will test _all_ alert mechanisms for the selected role. - - diff --git a/health/notifications/smstools3/metadata.yaml b/health/notifications/smstools3/metadata.yaml deleted file mode 100644 index 3a29183a..00000000 --- a/health/notifications/smstools3/metadata.yaml +++ /dev/null @@ -1,84 +0,0 @@ -# yamllint disable rule:line-length ---- -- id: 'notify-sms' - meta: - name: 'SMS' - link: 'http://smstools3.kekekasvi.com/' - categories: - - notify.agent - icon_filename: 'sms.svg' - keywords: - - SMS tools 3 - - SMS - - Messaging - overview: - notification_description: | - Send notifications to `smstools3` using Netdata's Agent alert notification feature, which supports dozens of endpoints, user roles, and more. - The SMS Server Tools 3 is a SMS Gateway software which can send and receive short messages through GSM modems and mobile phones. - notification_limitations: '' - setup: - prerequisites: - list: - - title: '' - description: | - - [Install](http://smstools3.kekekasvi.com/index.php?p=compiling) and [configure](http://smstools3.kekekasvi.com/index.php?p=configure) `smsd` - - To ensure that the user `netdata` can execute `sendsms`. Any user executing `sendsms` needs to: - - Have write permissions to /tmp and /var/spool/sms/outgoing - - Be a member of group smsd - - To ensure that the steps above are successful, just su netdata and execute sendsms phone message. - - Access to the terminal where Netdata Agent is running - configuration: - file: - name: 'health_alarm_notify.conf' - options: - description: 'The following options can be defined for this notification' - folding: - title: 'Config Options' - enabled: true - list: - - name: 'sendsms' - default_value: 'YES' - description: "Set the path for `sendsms`, otherwise Netdata will search for it in your system `$PATH:`" - required: true - detailed_description: | - # The full path of the sendsms command (smstools3). - # If empty, the system $PATH will be searched for it. - # If not found, SMS notifications will be silently disabled. - sendsms="/usr/bin/sendsms" - - name: 'SEND_SMS' - default_value: '' - description: "Set `SEND_SMS` to `YES`." - required: true - - name: 'DEFAULT_RECIPIENT_SMS' - default_value: '' - description: "Set DEFAULT_RECIPIENT_SMS to the phone number you want the alert notifications to be sent to. You can define multiple phone numbers like this: PHONE1 PHONE2." - required: true - detailed_description: | - All roles will default to this variable if left unconfigured. - - You can then have different phone numbers per role, by editing `DEFAULT_RECIPIENT_SMS` with the phone number you want, in the following entries at the bottom of the same file: - ```conf - role_recipients_sms[sysadmin]="PHONE1" - role_recipients_sms[domainadmin]="PHONE2" - role_recipients_sms[dba]="PHONE3" - role_recipients_sms[webmaster]="PHONE4" - role_recipients_sms[proxyadmin]="PHONE5" - role_recipients_sms[sitemgr]="PHONE6" - ``` - examples: - folding: - enabled: true - title: '' - list: - - name: 'Basic Configuration' - folding: - enabled: false - description: '' - config: | - #------------------------------------------------------------------------------ - # SMS Server Tools 3 (smstools3) global notification options - SEND_SMS="YES" - DEFAULT_RECIPIENT_SMS="1234567890" - troubleshooting: - problems: - list: [] diff --git a/health/notifications/syslog/Makefile.inc b/health/notifications/syslog/Makefile.inc deleted file mode 100644 index 94a8acc3..00000000 --- a/health/notifications/syslog/Makefile.inc +++ /dev/null @@ -1,12 +0,0 @@ -# SPDX-License-Identifier: GPL-3.0-or-later - -# THIS IS NOT A COMPLETE Makefile -# IT IS INCLUDED BY ITS PARENT'S Makefile.am -# IT IS REQUIRED TO REFERENCE ALL FILES RELATIVE TO THE PARENT - -# install these files -dist_noinst_DATA += \ - syslog/README.md \ - syslog/Makefile.inc \ - $(NULL) - diff --git a/health/notifications/syslog/README.md b/health/notifications/syslog/README.md deleted file mode 100644 index e51838be..00000000 --- a/health/notifications/syslog/README.md +++ /dev/null @@ -1,132 +0,0 @@ -<!--startmeta -custom_edit_url: "https://github.com/netdata/netdata/edit/master/health/notifications/syslog/README.md" -meta_yaml: "https://github.com/netdata/netdata/edit/master/health/notifications/syslog/metadata.yaml" -sidebar_label: "syslog" -learn_status: "Published" -learn_rel_path: "Alerting/Notifications/Agent Dispatched Notifications" -message: "DO NOT EDIT THIS FILE DIRECTLY, IT IS GENERATED BY THE NOTIFICATION'S metadata.yaml FILE" -endmeta--> - -# syslog - - -<img src="https://netdata.cloud/img/syslog.png" width="150"/> - - -Send notifications to Syslog using Netdata's Agent alert notification feature, which supports dozens of endpoints, user roles, and more. - - - -<img src="https://img.shields.io/badge/maintained%20by-Netdata-%2300ab44" /> - -## Setup - -### Prerequisites - -#### - -- A working `logger` command for this to work. This is the case on pretty much every Linux system in existence, and most BSD systems. -- Access to the terminal where Netdata Agent is running - - - -### Configuration - -#### File - -The configuration file name for this integration is `health_alarm_notify.conf`. - - -You can edit the configuration file using the `edit-config` script from the -Netdata [config directory](https://github.com/netdata/netdata/blob/master/docs/configure/nodes.md#the-netdata-config-directory). - -```bash -cd /etc/netdata 2>/dev/null || cd /opt/netdata/etc/netdata -sudo ./edit-config health_alarm_notify.conf -``` -#### Options - -The following options can be defined for this notification - -<details><summary>Config Options</summary> - -| Name | Description | Default | Required | -|:----|:-----------|:-------|:--------:| -| SYSLOG_FACILITY | Set `SYSLOG_FACILITY` to the facility used for logging, by default this value is set to `local6`. | | yes | -| DEFAULT_RECIPIENT_SYSLOG | Set `DEFAULT_RECIPIENT_SYSLOG` to the recipient you want the alert notifications to be sent to. | | yes | -| SEND_SYSLOG | Set SEND_SYSLOG to YES, make sure you have everything else configured before turning this on. | | yes | - -##### DEFAULT_RECIPIENT_SYSLOG - -Targets are defined as follows: - -``` -[[facility.level][@host[:port]]/]prefix -``` - -prefix defines what the log messages are prefixed with. By default, all lines are prefixed with 'netdata'. - -The facility and level are the standard syslog facility and level options, for more info on them see your local logger and syslog documentation. By default, Netdata will log to the local6 facility, with a log level dependent on the type of message (crit for CRITICAL, warning for WARNING, and info for everything else). - -You can configure sending directly to remote log servers by specifying a host (and optionally a port). However, this has a somewhat high overhead, so it is much preferred to use your local syslog daemon to handle the forwarding of messages to remote systems (pretty much all of them allow at least simple forwarding, and most of the really popular ones support complex queueing and routing of messages to remote log servers). - -You can define multiple recipients like this: daemon.notice@loghost:514/netdata daemon.notice@loghost2:514/netdata. -All roles will default to this variable if left unconfigured. - - -##### SEND_SYSLOG - -You can then have different recipients per role, by editing DEFAULT_RECIPIENT_SYSLOG with the recipient you want, in the following entries at the bottom of the same file: - -```conf -role_recipients_syslog[sysadmin]="daemon.notice@loghost1:514/netdata" -role_recipients_syslog[domainadmin]="daemon.notice@loghost2:514/netdata" -role_recipients_syslog[dba]="daemon.notice@loghost3:514/netdata" -role_recipients_syslog[webmaster]="daemon.notice@loghost4:514/netdata" -role_recipients_syslog[proxyadmin]="daemon.notice@loghost5:514/netdata" -role_recipients_syslog[sitemgr]="daemon.notice@loghost6:514/netdata" -``` - - -</details> - -#### Examples - -##### Basic Configuration - - - -```yaml -#------------------------------------------------------------------------------ -# syslog notifications - -SEND_SYSLOG="YES" -SYSLOG_FACILITY='local6' -DEFAULT_RECIPIENT_SYSLOG="daemon.notice@loghost6:514/netdata" - -``` - - -## Troubleshooting - -### Test Notification - -You can run the following command by hand, to test alerts configuration: - -```bash -# become user netdata -sudo su -s /bin/bash netdata - -# enable debugging info on the console -export NETDATA_ALARM_NOTIFY_DEBUG=1 - -# send test alarms to sysadmin -/usr/libexec/netdata/plugins.d/alarm-notify.sh test - -# send test alarms to any role -/usr/libexec/netdata/plugins.d/alarm-notify.sh test "ROLE" -``` - -Note that this will test _all_ alert mechanisms for the selected role. - - diff --git a/health/notifications/syslog/metadata.yaml b/health/notifications/syslog/metadata.yaml deleted file mode 100644 index c5f241e7..00000000 --- a/health/notifications/syslog/metadata.yaml +++ /dev/null @@ -1,88 +0,0 @@ -# yamllint disable rule:line-length ---- -- id: 'notify-syslog' - meta: - name: 'syslog' - link: '' - categories: - - notify.agent - icon_filename: 'syslog.png' - keywords: - - syslog - overview: - notification_description: | - Send notifications to Syslog using Netdata's Agent alert notification feature, which supports dozens of endpoints, user roles, and more. - notification_limitations: '' - setup: - prerequisites: - list: - - title: '' - description: | - - A working `logger` command for this to work. This is the case on pretty much every Linux system in existence, and most BSD systems. - - Access to the terminal where Netdata Agent is running - configuration: - file: - name: 'health_alarm_notify.conf' - options: - description: 'The following options can be defined for this notification' - folding: - title: 'Config Options' - enabled: true - list: - - name: 'SYSLOG_FACILITY' - default_value: '' - description: "Set `SYSLOG_FACILITY` to the facility used for logging, by default this value is set to `local6`." - required: true - - name: 'DEFAULT_RECIPIENT_SYSLOG' - default_value: '' - description: "Set `DEFAULT_RECIPIENT_SYSLOG` to the recipient you want the alert notifications to be sent to." - required: true - detailed_description: | - Targets are defined as follows: - - ``` - [[facility.level][@host[:port]]/]prefix - ``` - - prefix defines what the log messages are prefixed with. By default, all lines are prefixed with 'netdata'. - - The facility and level are the standard syslog facility and level options, for more info on them see your local logger and syslog documentation. By default, Netdata will log to the local6 facility, with a log level dependent on the type of message (crit for CRITICAL, warning for WARNING, and info for everything else). - - You can configure sending directly to remote log servers by specifying a host (and optionally a port). However, this has a somewhat high overhead, so it is much preferred to use your local syslog daemon to handle the forwarding of messages to remote systems (pretty much all of them allow at least simple forwarding, and most of the really popular ones support complex queueing and routing of messages to remote log servers). - - You can define multiple recipients like this: daemon.notice@loghost:514/netdata daemon.notice@loghost2:514/netdata. - All roles will default to this variable if left unconfigured. - - name: 'SEND_SYSLOG ' - default_value: '' - description: "Set SEND_SYSLOG to YES, make sure you have everything else configured before turning this on." - required: true - detailed_description: | - You can then have different recipients per role, by editing DEFAULT_RECIPIENT_SYSLOG with the recipient you want, in the following entries at the bottom of the same file: - - ```conf - role_recipients_syslog[sysadmin]="daemon.notice@loghost1:514/netdata" - role_recipients_syslog[domainadmin]="daemon.notice@loghost2:514/netdata" - role_recipients_syslog[dba]="daemon.notice@loghost3:514/netdata" - role_recipients_syslog[webmaster]="daemon.notice@loghost4:514/netdata" - role_recipients_syslog[proxyadmin]="daemon.notice@loghost5:514/netdata" - role_recipients_syslog[sitemgr]="daemon.notice@loghost6:514/netdata" - ``` - examples: - folding: - enabled: true - title: '' - list: - - name: 'Basic Configuration' - folding: - enabled: false - description: '' - config: | - #------------------------------------------------------------------------------ - # syslog notifications - - SEND_SYSLOG="YES" - SYSLOG_FACILITY='local6' - DEFAULT_RECIPIENT_SYSLOG="daemon.notice@loghost6:514/netdata" - troubleshooting: - problems: - list: [] diff --git a/health/notifications/telegram/Makefile.inc b/health/notifications/telegram/Makefile.inc deleted file mode 100644 index ffca0718..00000000 --- a/health/notifications/telegram/Makefile.inc +++ /dev/null @@ -1,12 +0,0 @@ -# SPDX-License-Identifier: GPL-3.0-or-later - -# THIS IS NOT A COMPLETE Makefile -# IT IS INCLUDED BY ITS PARENT'S Makefile.am -# IT IS REQUIRED TO REFERENCE ALL FILES RELATIVE TO THE PARENT - -# install these files -dist_noinst_DATA += \ - telegram/README.md \ - telegram/Makefile.inc \ - $(NULL) - diff --git a/health/notifications/telegram/README.md b/health/notifications/telegram/README.md deleted file mode 100644 index 315bd9b1..00000000 --- a/health/notifications/telegram/README.md +++ /dev/null @@ -1,118 +0,0 @@ -<!--startmeta -custom_edit_url: "https://github.com/netdata/netdata/edit/master/health/notifications/telegram/README.md" -meta_yaml: "https://github.com/netdata/netdata/edit/master/health/notifications/telegram/metadata.yaml" -sidebar_label: "Telegram" -learn_status: "Published" -learn_rel_path: "Alerting/Notifications/Agent Dispatched Notifications" -message: "DO NOT EDIT THIS FILE DIRECTLY, IT IS GENERATED BY THE NOTIFICATION'S metadata.yaml FILE" -endmeta--> - -# Telegram - - -<img src="https://netdata.cloud/img/telegram.svg" width="150"/> - - -Send notifications to Telegram using Netdata's Agent alert notification feature, which supports dozens of endpoints, user roles, and more. - - - -<img src="https://img.shields.io/badge/maintained%20by-Netdata-%2300ab44" /> - -## Setup - -### Prerequisites - -#### - -- A bot token. To get one, contact the [@BotFather](https://t.me/BotFather) bot and send the command `/newbot` and follow the instructions. Start a conversation with your bot or invite it into a group where you want it to send messages. -- The chat ID for every chat you want to send messages to. Contact the [@myidbot](https://t.me/myidbot) bot and send the `/getid` command to get your personal chat ID or invite it into a group and use the `/getgroupid` command to get the group chat ID. Group IDs start with a hyphen, supergroup IDs start with `-100`. -- Alternatively, you can get the chat ID directly from the bot API. Send your bot a command in the chat you want to use, then check `https://api.telegram.org/bot{YourBotToken}/getUpdates`, eg. `https://api.telegram.org/bot111122223:7OpFlFFRzRBbrUUmIjj5HF9Ox2pYJZy5/getUpdates` -- Terminal access to the Agent you wish to configure - - - -### Configuration - -#### File - -The configuration file name for this integration is `health_alarm_notify.conf`. - - -You can edit the configuration file using the `edit-config` script from the -Netdata [config directory](https://github.com/netdata/netdata/blob/master/docs/configure/nodes.md#the-netdata-config-directory). - -```bash -cd /etc/netdata 2>/dev/null || cd /opt/netdata/etc/netdata -sudo ./edit-config health_alarm_notify.conf -``` -#### Options - -The following options can be defined for this notification - -<details><summary>Config Options</summary> - -| Name | Description | Default | Required | -|:----|:-----------|:-------|:--------:| -| SEND_TELEGRAM | Set `SEND_TELEGRAM` to YES | YES | yes | -| TELEGRAM_BOT_TOKEN | set `TELEGRAM_BOT_TOKEN` to your bot token. | | yes | -| DEFAULT_RECIPIENT_TELEGRAM | Set `DEFAULT_RECIPIENT_TELEGRAM` to the chat ID you want the alert notifications to be sent to. You can define multiple chat IDs like this: 49999333322 -1009999222255. | | yes | - -##### DEFAULT_RECIPIENT_TELEGRAM - -All roles will default to this variable if left unconfigured. - -The `DEFAULT_RECIPIENT_CUSTOM` can be edited in the following entries at the bottom of the same file: - -```conf -role_recipients_telegram[sysadmin]="49999333324" -role_recipients_telegram[domainadmin]="49999333389" -role_recipients_telegram[dba]="-1009999222255" -role_recipients_telegram[webmaster]="-1009999222255 49999333389" -role_recipients_telegram[proxyadmin]="49999333344" -role_recipients_telegram[sitemgr]="49999333876" -``` - - -</details> - -#### Examples - -##### Basic Configuration - - - -```yaml -#------------------------------------------------------------------------------ -# telegram (telegram.org) global notification options - -SEND_TELEGRAM="YES" -TELEGRAM_BOT_TOKEN="111122223:7OpFlFFRzRBbrUUmIjj5HF9Ox2pYJZy5" -DEFAULT_RECIPIENT_TELEGRAM="-100233335555" - -``` - - -## Troubleshooting - -### Test Notification - -You can run the following command by hand, to test alerts configuration: - -```bash -# become user netdata -sudo su -s /bin/bash netdata - -# enable debugging info on the console -export NETDATA_ALARM_NOTIFY_DEBUG=1 - -# send test alarms to sysadmin -/usr/libexec/netdata/plugins.d/alarm-notify.sh test - -# send test alarms to any role -/usr/libexec/netdata/plugins.d/alarm-notify.sh test "ROLE" -``` - -Note that this will test _all_ alert mechanisms for the selected role. - - diff --git a/health/notifications/telegram/metadata.yaml b/health/notifications/telegram/metadata.yaml deleted file mode 100644 index 23fce2a8..00000000 --- a/health/notifications/telegram/metadata.yaml +++ /dev/null @@ -1,77 +0,0 @@ -# yamllint disable rule:line-length ---- -- id: 'notify-telegram' - meta: - name: 'Telegram' - link: 'https://telegram.org/' - categories: - - notify.agent - icon_filename: 'telegram.svg' - keywords: - - Telegram - overview: - notification_description: | - Send notifications to Telegram using Netdata's Agent alert notification feature, which supports dozens of endpoints, user roles, and more. - notification_limitations: '' - setup: - prerequisites: - list: - - title: '' - description: | - - A bot token. To get one, contact the [@BotFather](https://t.me/BotFather) bot and send the command `/newbot` and follow the instructions. Start a conversation with your bot or invite it into a group where you want it to send messages. - - The chat ID for every chat you want to send messages to. Contact the [@myidbot](https://t.me/myidbot) bot and send the `/getid` command to get your personal chat ID or invite it into a group and use the `/getgroupid` command to get the group chat ID. Group IDs start with a hyphen, supergroup IDs start with `-100`. - - Alternatively, you can get the chat ID directly from the bot API. Send your bot a command in the chat you want to use, then check `https://api.telegram.org/bot{YourBotToken}/getUpdates`, eg. `https://api.telegram.org/bot111122223:7OpFlFFRzRBbrUUmIjj5HF9Ox2pYJZy5/getUpdates` - - Terminal access to the Agent you wish to configure - configuration: - file: - name: 'health_alarm_notify.conf' - options: - description: 'The following options can be defined for this notification' - folding: - title: 'Config Options' - enabled: true - list: - - name: 'SEND_TELEGRAM' - default_value: 'YES' - description: "Set `SEND_TELEGRAM` to YES" - required: true - - name: 'TELEGRAM_BOT_TOKEN' - default_value: '' - description: "set `TELEGRAM_BOT_TOKEN` to your bot token." - required: true - - name: 'DEFAULT_RECIPIENT_TELEGRAM' - default_value: '' - description: "Set `DEFAULT_RECIPIENT_TELEGRAM` to the chat ID you want the alert notifications to be sent to. You can define multiple chat IDs like this: 49999333322 -1009999222255." - required: true - detailed_description: | - All roles will default to this variable if left unconfigured. - - The `DEFAULT_RECIPIENT_CUSTOM` can be edited in the following entries at the bottom of the same file: - - ```conf - role_recipients_telegram[sysadmin]="49999333324" - role_recipients_telegram[domainadmin]="49999333389" - role_recipients_telegram[dba]="-1009999222255" - role_recipients_telegram[webmaster]="-1009999222255 49999333389" - role_recipients_telegram[proxyadmin]="49999333344" - role_recipients_telegram[sitemgr]="49999333876" - ``` - examples: - folding: - enabled: true - title: '' - list: - - name: 'Basic Configuration' - folding: - enabled: false - description: '' - config: | - #------------------------------------------------------------------------------ - # telegram (telegram.org) global notification options - - SEND_TELEGRAM="YES" - TELEGRAM_BOT_TOKEN="111122223:7OpFlFFRzRBbrUUmIjj5HF9Ox2pYJZy5" - DEFAULT_RECIPIENT_TELEGRAM="-100233335555" - troubleshooting: - problems: - list: [] diff --git a/health/notifications/twilio/Makefile.inc b/health/notifications/twilio/Makefile.inc deleted file mode 100644 index 0f2d8d8a..00000000 --- a/health/notifications/twilio/Makefile.inc +++ /dev/null @@ -1,12 +0,0 @@ -# SPDX-License-Identifier: GPL-3.0-or-later - -# THIS IS NOT A COMPLETE Makefile -# IT IS INCLUDED BY ITS PARENT'S Makefile.am -# IT IS REQUIRED TO REFERENCE ALL FILES RELATIVE TO THE PARENT - -# install these files -dist_noinst_DATA += \ - twilio/README.md \ - twilio/Makefile.inc \ - $(NULL) - diff --git a/health/notifications/twilio/README.md b/health/notifications/twilio/README.md deleted file mode 100644 index c125a967..00000000 --- a/health/notifications/twilio/README.md +++ /dev/null @@ -1,118 +0,0 @@ -<!--startmeta -custom_edit_url: "https://github.com/netdata/netdata/edit/master/health/notifications/twilio/README.md" -meta_yaml: "https://github.com/netdata/netdata/edit/master/health/notifications/twilio/metadata.yaml" -sidebar_label: "Twilio" -learn_status: "Published" -learn_rel_path: "Alerting/Notifications/Agent Dispatched Notifications" -message: "DO NOT EDIT THIS FILE DIRECTLY, IT IS GENERATED BY THE NOTIFICATION'S metadata.yaml FILE" -endmeta--> - -# Twilio - - -<img src="https://netdata.cloud/img/twilio.png" width="150"/> - - -Send notifications to Twilio using Netdata's Agent alert notification feature, which supports dozens of endpoints, user roles, and more. - - - -<img src="https://img.shields.io/badge/maintained%20by-Netdata-%2300ab44" /> - -## Setup - -### Prerequisites - -#### - -- Get your SID, and Token from https://www.twilio.com/console -- Terminal access to the Agent you wish to configure - - - -### Configuration - -#### File - -The configuration file name for this integration is `health_alarm_notify.conf`. - - -You can edit the configuration file using the `edit-config` script from the -Netdata [config directory](https://github.com/netdata/netdata/blob/master/docs/configure/nodes.md#the-netdata-config-directory). - -```bash -cd /etc/netdata 2>/dev/null || cd /opt/netdata/etc/netdata -sudo ./edit-config health_alarm_notify.conf -``` -#### Options - -The following options can be defined for this notification - -<details><summary>Config Options</summary> - -| Name | Description | Default | Required | -|:----|:-----------|:-------|:--------:| -| SEND_TWILIO | Set `SEND_TWILIO` to YES | YES | yes | -| TWILIO_ACCOUNT_SID | set `TWILIO_ACCOUNT_SID` to your account SID. | | yes | -| TWILIO_ACCOUNT_TOKEN | Set `TWILIO_ACCOUNT_TOKEN` to your account token. | | yes | -| TWILIO_NUMBER | Set `TWILIO_NUMBER` to your account's number. | | yes | -| DEFAULT_RECIPIENT_TWILIO | Set DEFAULT_RECIPIENT_TWILIO to the number you want the alert notifications to be sent to. You can define multiple numbers like this: +15555555555 +17777777777. | | yes | - -##### DEFAULT_RECIPIENT_TWILIO - -You can then have different recipients per role, by editing DEFAULT_RECIPIENT_TWILIO with the recipient's number you want, in the following entries at the bottom of the same file: - -```conf -role_recipients_twilio[sysadmin]="+15555555555" -role_recipients_twilio[domainadmin]="+15555555556" -role_recipients_twilio[dba]="+15555555557" -role_recipients_twilio[webmaster]="+15555555558" -role_recipients_twilio[proxyadmin]="+15555555559" -role_recipients_twilio[sitemgr]="+15555555550" -``` - - -</details> - -#### Examples - -##### Basic Configuration - - - -```yaml -#------------------------------------------------------------------------------ -# Twilio (twilio.com) SMS options - -SEND_TWILIO="YES" -TWILIO_ACCOUNT_SID="xxxxxxxxx" -TWILIO_ACCOUNT_TOKEN="xxxxxxxxxx" -TWILIO_NUMBER="xxxxxxxxxxx" -DEFAULT_RECIPIENT_TWILIO="+15555555555" - -``` - - -## Troubleshooting - -### Test Notification - -You can run the following command by hand, to test alerts configuration: - -```bash -# become user netdata -sudo su -s /bin/bash netdata - -# enable debugging info on the console -export NETDATA_ALARM_NOTIFY_DEBUG=1 - -# send test alarms to sysadmin -/usr/libexec/netdata/plugins.d/alarm-notify.sh test - -# send test alarms to any role -/usr/libexec/netdata/plugins.d/alarm-notify.sh test "ROLE" -``` - -Note that this will test _all_ alert mechanisms for the selected role. - - diff --git a/health/notifications/twilio/metadata.yaml b/health/notifications/twilio/metadata.yaml deleted file mode 100644 index 35fc3f04..00000000 --- a/health/notifications/twilio/metadata.yaml +++ /dev/null @@ -1,83 +0,0 @@ -# yamllint disable rule:line-length ---- -- id: 'notify-twilio' - meta: - name: 'Twilio' - link: 'https://www.twilio.com/' - categories: - - notify.agent - icon_filename: 'twilio.png' - keywords: - - Twilio - overview: - notification_description: | - Send notifications to Twilio using Netdata's Agent alert notification feature, which supports dozens of endpoints, user roles, and more. - notification_limitations: '' - setup: - prerequisites: - list: - - title: '' - description: | - - Get your SID, and Token from https://www.twilio.com/console - - Terminal access to the Agent you wish to configure - configuration: - file: - name: 'health_alarm_notify.conf' - options: - description: 'The following options can be defined for this notification' - folding: - title: 'Config Options' - enabled: true - list: - - name: 'SEND_TWILIO' - default_value: 'YES' - description: "Set `SEND_TWILIO` to YES" - required: true - - name: 'TWILIO_ACCOUNT_SID' - default_value: '' - description: "set `TWILIO_ACCOUNT_SID` to your account SID." - required: true - - name: 'TWILIO_ACCOUNT_TOKEN ' - default_value: '' - description: "Set `TWILIO_ACCOUNT_TOKEN` to your account token." - required: true - - name: 'TWILIO_NUMBER' - default_value: '' - description: "Set `TWILIO_NUMBER` to your account's number." - required: true - - name: 'DEFAULT_RECIPIENT_TWILIO' - default_value: '' - description: "Set DEFAULT_RECIPIENT_TWILIO to the number you want the alert notifications to be sent to. You can define multiple numbers like this: +15555555555 +17777777777." - required: true - detailed_description: | - You can then have different recipients per role, by editing DEFAULT_RECIPIENT_TWILIO with the recipient's number you want, in the following entries at the bottom of the same file: - - ```conf - role_recipients_twilio[sysadmin]="+15555555555" - role_recipients_twilio[domainadmin]="+15555555556" - role_recipients_twilio[dba]="+15555555557" - role_recipients_twilio[webmaster]="+15555555558" - role_recipients_twilio[proxyadmin]="+15555555559" - role_recipients_twilio[sitemgr]="+15555555550" - ``` - examples: - folding: - enabled: true - title: '' - list: - - name: 'Basic Configuration' - folding: - enabled: false - description: '' - config: | - #------------------------------------------------------------------------------ - # Twilio (twilio.com) SMS options - - SEND_TWILIO="YES" - TWILIO_ACCOUNT_SID="xxxxxxxxx" - TWILIO_ACCOUNT_TOKEN="xxxxxxxxxx" - TWILIO_NUMBER="xxxxxxxxxxx" - DEFAULT_RECIPIENT_TWILIO="+15555555555" - troubleshooting: - problems: - list: [] diff --git a/health/notifications/web/Makefile.inc b/health/notifications/web/Makefile.inc deleted file mode 100644 index b564d83d..00000000 --- a/health/notifications/web/Makefile.inc +++ /dev/null @@ -1,12 +0,0 @@ -# SPDX-License-Identifier: GPL-3.0-or-later - -# THIS IS NOT A COMPLETE Makefile -# IT IS INCLUDED BY ITS PARENT'S Makefile.am -# IT IS REQUIRED TO REFERENCE ALL FILES RELATIVE TO THE PARENT - -# install these files -dist_noinst_DATA += \ - web/README.md \ - web/Makefile.inc \ - $(NULL) - diff --git a/health/notifications/web/README.md b/health/notifications/web/README.md deleted file mode 100644 index 36ca2668..00000000 --- a/health/notifications/web/README.md +++ /dev/null @@ -1,18 +0,0 @@ -<!-- -title: "Browser pop up agent alert notifications" -sidebar_label: "Browser pop ups" -custom_edit_url: "https://github.com/netdata/netdata/edit/master/health/notifications/web/README.md" -learn_status: "Published" -learn_topic_type: "Tasks" -learn_rel_path: "Integrations/Notify/Agent alert notifications" -learn_autogeneration_metadata: "{'part_of_cloud': False, 'part_of_agent': True}" ---> - -# Browser pop up agent alert notifications - -The Netdata dashboard shows HTML notifications, when it is open. - -Such web notifications look like this: - - - |