
diff options
Diffstat (limited to 'docs/dashboard/interact-charts.mdx')
| -rw-r--r-- | docs/dashboard/interact-charts.mdx | 57 |
1 files changed, 57 insertions, 0 deletions
diff --git a/docs/dashboard/interact-charts.mdx b/docs/dashboard/interact-charts.mdx index 5633bd080..fe0f05e3f 100644 --- a/docs/dashboard/interact-charts.mdx +++ b/docs/dashboard/interact-charts.mdx @@ -117,6 +117,63 @@ the resolution to `resolution 1 sec` to see the exact values. Many of the above interactions can also be triggered using the icons on the bottom-right corner of every chart. They are, respectively, `Pan Left`, `Reset`, `Pan Right`, `Zoom In`, and `Zoom Out`. +## Chart label filtering + +The chart label filtering feature supports grouping by and filtering each chart based on labels (key/value pairs) applicable to the context and provides fine-grain capability on slicing the data and metrics. + +All metrics collected get "tagged" with labels and values, thus providing a powerful way of slicing and visualizing all metrics related to the infrastructure. + +The chart label filtering is currently enabled on: + +- All charts on the **Overview** tab +- Custom dashboards + + + + +The top panel on each chart displays the various filters and grouping options selected on the specific chart. These filters are specific for each chart and need to be manually configured on each chart. + +Additionally, the charts can be saved to a custom dashboard, new or existing, with the selected filters from the overview screen. + + + +## Custom labels for Collectors + +In addition to the default labels associated with a collector and metrics context (you can identify them by seeing which ones have an underscore as a prefix), there is now a new feature enabled to create custom labels. These custom labels may be needed to group your jobs or instances into various categories. + +These custom labels can be configured within your go.d plugins by simply associating a label key/value pair, as in the following eaxmple. + +```conf +jobs: + - name: example_1 + someOption: someValue + labels: + label1: value1 + label2: value2 + - name: example_2 + someOption: someValue + labels: + label3: value3 + label4: value4 +``` + +For instance, you may be running multiple Postgres database instances within an infrastructure. Some of these may be associated with testing environments, some with staging and some with production environments. You can now associate each Postgres job / instance with a custom label. The “group by” and filtering options will then allow you to associate individual jobs by specific labels. + +```conf +jobs: + - name: local + dsn: 'postgres://postgres:postgres@127.0.0.1:5432/postgres' + collect_databases_matching: '*' + labels: + instance_type: production + ``` +  + 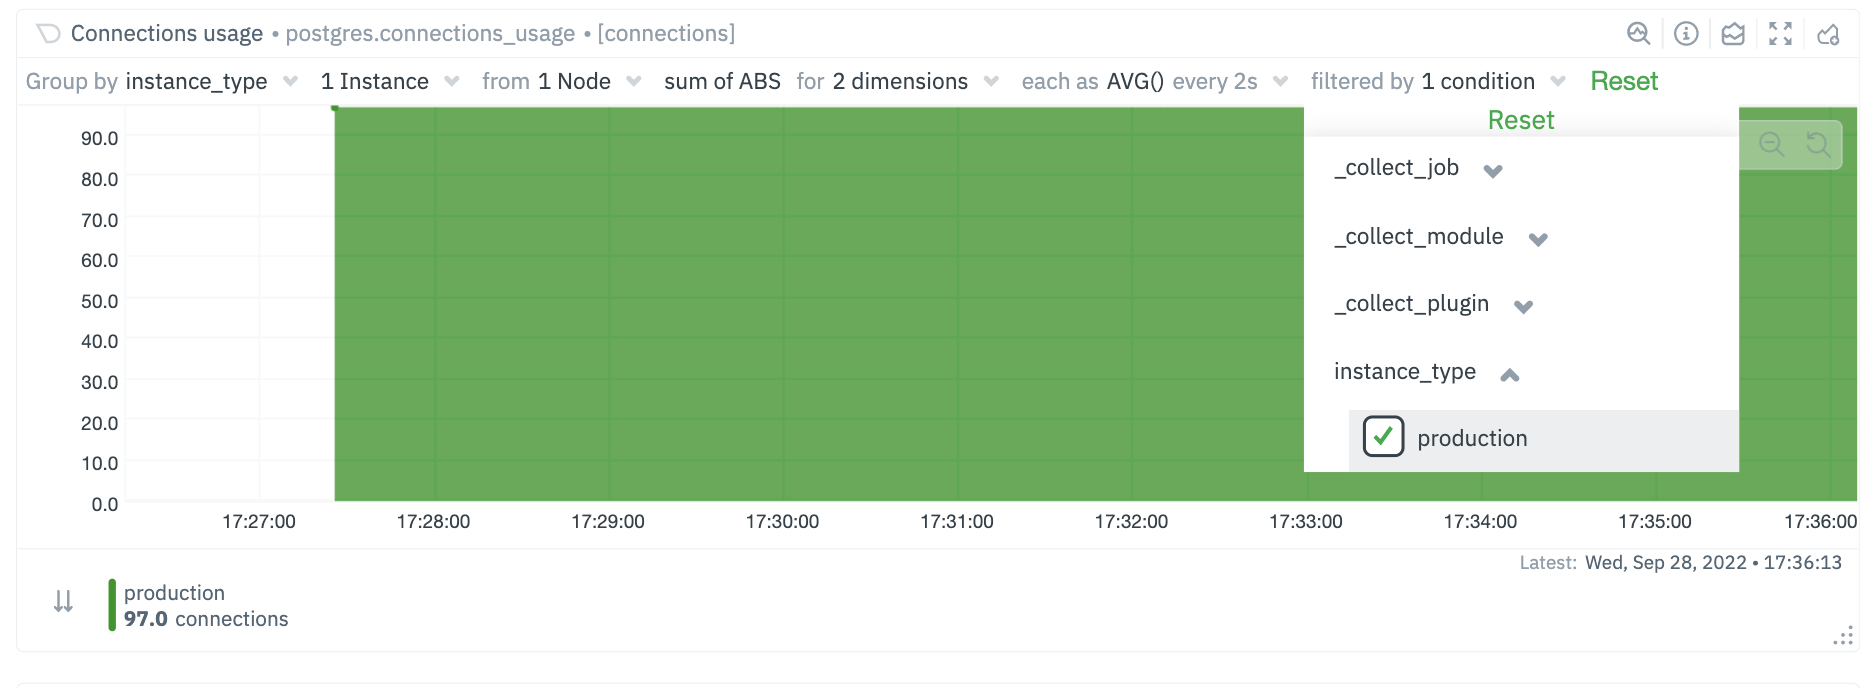 + +### Future Work + +We already have [configurable host labels](https://learn.netdata.cloud/guides/using-host-labels) as well, which currently can’t be used to filter or group your metrics. We intend to provide the same capabilities described here with host labels, among other capabilities on other areas of the app as well + ## What's next? We recommend you read up on the differences between [chart dimensions, contexts, and |