
diff options
Diffstat (limited to 'docs/guides/step-by-step/step-05.md')
| -rw-r--r-- | docs/guides/step-by-step/step-05.md | 349 |
1 files changed, 0 insertions, 349 deletions
diff --git a/docs/guides/step-by-step/step-05.md b/docs/guides/step-by-step/step-05.md deleted file mode 100644 index 3ef498d4..00000000 --- a/docs/guides/step-by-step/step-05.md +++ /dev/null @@ -1,349 +0,0 @@ -<!-- -title: "Step 5. Health monitoring alarms and notifications" -custom_edit_url: https://github.com/netdata/netdata/edit/master/docs/guides/step-by-step/step-05.md ---> - -# Step 5. Health monitoring alarms and notifications - -In the fifth step of the Netdata guide, we're introducing you to one of our core features: **health monitoring**. - -To accurately monitor the health of your systems and applications, you need to know _immediately_ when there's something -strange going on. Netdata's alarm and notification systems are essential to keeping you informed. - -Netdata comes with hundreds of pre-configured alarms that don't require configuration. They were designed by our -community of system administrators to cover the most important parts of production systems, so, in many cases, you won't -need to edit them. - -Luckily, Netdata's alarm and notification system are incredibly adaptable to your infrastructure's unique needs. - -## What you'll learn in this step - -We'll talk about Netdata's default configuration, and then you'll learn how to do the following: - -- [Tune Netdata's pre-configured alarms](#tune-netdatas-pre-configured-alarms) -- [Write your first health entity](#write-your-first-health-entity) -- [Enable Netdata's notification systems](#enable-netdatas-notification-systems) - -## Tune Netdata's pre-configured alarms - -First, let's tune an alarm that came pre-configured with your Netdata installation. - -The first chart you see on any Netdata dashboard is the `system.cpu` chart, which shows the system's CPU utilization -across all cores. To figure out which file you need to edit to tune this alarm, click the **Alarms** button at the top -of the dashboard, click on the **All** tab, and find the **system - cpu** alarm entity. - -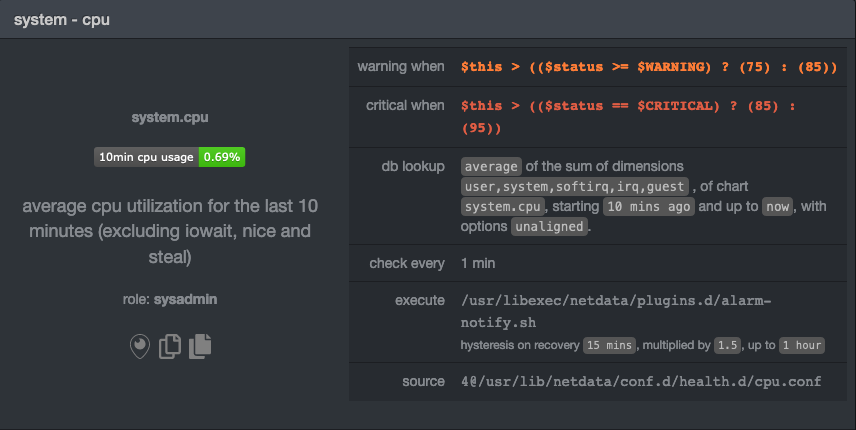 - -Look at the `source` row in the table. This means the `system.cpu` chart sources its health alarms from -`4@/usr/lib/netdata/conf.d/health.d/cpu.conf`. To tune these alarms, you'll need to edit the alarm file at -`health.d/cpu.conf`. Go to your [Netdata config directory](step-04.md#find-your-netdataconf-file) and use the -`edit-config` script. - -```bash -sudo ./edit-config health.d/cpu.conf -``` - -The first **health entity** in that file looks like this: - -```yaml -template: 10min_cpu_usage - on: system.cpu - os: linux - hosts: * - lookup: average -10m unaligned of user,system,softirq,irq,guest - units: % - every: 1m - warn: $this > (($status >= $WARNING) ? (75) : (85)) - crit: $this > (($status == $CRITICAL) ? (85) : (95)) - delay: down 15m multiplier 1.5 max 1h - info: average cpu utilization for the last 10 minutes (excluding iowait, nice and steal) - to: sysadmin -``` - -Let's say you want to tune this alarm to trigger warning and critical alarms at a lower CPU utilization. You can change -the `warn` and `crit` lines to the values of your choosing. For example: - -```yaml - warn: $this > (($status >= $WARNING) ? (60) : (75)) - crit: $this > (($status == $CRITICAL) ? (75) : (85)) -``` - -You _can_ restart Netdata with `sudo systemctl restart netdata`, to enable your tune, but you can also reload _only_ the -health monitoring component using one of the available [methods](https://github.com/netdata/netdata/blob/master/health/QUICKSTART.md#reload-health-configuration). - -You can also tune any other aspect of the default alarms. To better understand how each line in a health entity works, -read our [health documentation](https://github.com/netdata/netdata/blob/master/health/README.md). - -### Silence an individual alarm - -Many Netdata users don't need all the default alarms enabled. Instead of disabling any given alarm, or even _all_ -alarms, you can silence individual alarms by changing one line in a given health entity. Let's look at that -`health/cpu.conf` file again. - -```yaml -template: 10min_cpu_usage - on: system.cpu - os: linux - hosts: * - lookup: average -10m unaligned of user,system,softirq,irq,guest - units: % - every: 1m - warn: $this > (($status >= $WARNING) ? (75) : (85)) - crit: $this > (($status == $CRITICAL) ? (85) : (95)) - delay: down 15m multiplier 1.5 max 1h - info: average cpu utilization for the last 10 minutes (excluding iowait, nice and steal) - to: sysadmin -``` - -To silence this alarm, change `sysadmin` to `silent`. - -```yaml - to: silent -``` - -Use `netdatacli reload-health` to reload your health configuration. You can add `to: silent` to any alarm you'd rather not -bother you with notifications. - -## Write your first health entity - -The best way to understand how health entities work is building your own and experimenting with the options. To start, -let's build a health entity that triggers an alarm when system RAM usage goes above 80%. - -We will first create a new file inside of the `health.d/` directory. We'll name our file -`example.conf` for now. - -```bash -./edit-config health.d/example.conf -``` - -The first line in a health entity will be `alarm:`. This is how you name your entity. You can give it any name you -choose, but the only symbols allowed are `.` and `_`. Let's call the alarm `ram_usage`. - -```yaml - alarm: ram_usage -``` - -> You'll see some funky indentation in the lines coming up. Don't worry about it too much! Indentation is not important -> to how Netdata processes entities, and it will make sense when you're done. - -Next, you need to specify which chart this entity listens via the `on:` line. You're declaring that you want this alarm -to check metrics on the `system.ram` chart. - -```yaml - on: system.ram -``` - -Now comes the `lookup`. This line specifies what metrics the alarm is looking for, what duration of time it's looking -at, and how to process the metrics into a more usable format. - -```yaml -lookup: average -1m percentage of used -``` - -Let's take a moment to break this line down. - -- `average`: Calculate the average of all the metrics collected. -- `-1m`: Use metrics from 1 minute ago until now to calculate that average. -- `percentage`: Clarify that you want to calculate a percentage of RAM usage. -- `of used`: Specify which dimension (`used`) on the `system.ram` chart you want to monitor with this entity. - -In other words, you're taking 1 minute's worth of metrics from the `used` dimension on the `system.ram` chart, -calculating their average, and returning it as a percentage. - -You can move on to the `units` line, which lets Netdata know that we're working with a percentage and not an absolute -unit. - -```yaml - units: % -``` - -Next, the `every` line tells Netdata how often to perform the calculation you specified in the `lookup` line. For -certain alarms, you might want to use a shorter duration, which you can specify using values like `10s`. - -```yaml - every: 1m -``` - -We'll put the next two lines—`warn` and `crit`—together. In these lines, you declare at which percentage you want to -trigger a warning or critical alarm. Notice the variable `$this`, which is the value calculated by the `lookup` line. -These lines will trigger a warning if that average RAM usage goes above 80%, and a critical alert if it's above 90%. - -```yaml - warn: $this > 80 - crit: $this > 90 -``` - -> ❗ Most default Netdata alarms come with more complicated `warn` and `crit` lines. You may have noticed the line `warn: -> $this > (($status >= $WARNING) ? (75) : (85))` in one of the health entity examples above, which is an example of -> using the [conditional operator for hysteresis](https://github.com/netdata/netdata/blob/master/health/REFERENCE.md#special-use-of-the-conditional-operator). -> Hysteresis is used to keep Netdata from triggering a ton of alerts if the metric being tracked quickly goes above and -> then falls below the threshold. For this very simple example, we'll skip hysteresis, but recommend implementing it in -> your future health entities. - -Finish off with the `info` line, which creates a description of the alarm that will then appear in any -[notification](#enable-netdatas-notification-systems) you set up. This line is optional, but it has value—think of it as -documentation for a health entity! - -```yaml - info: The percentage of RAM being used by the system. -``` - -Here's what the entity looks like in full. Now you can see why we indented the lines, too. - -```yaml - alarm: ram_usage - on: system.ram -lookup: average -1m percentage of used - units: % - every: 1m - warn: $this > 80 - crit: $this > 90 - info: The percentage of RAM being used by the system. -``` - -What about what it looks like on the Netdata dashboard? - -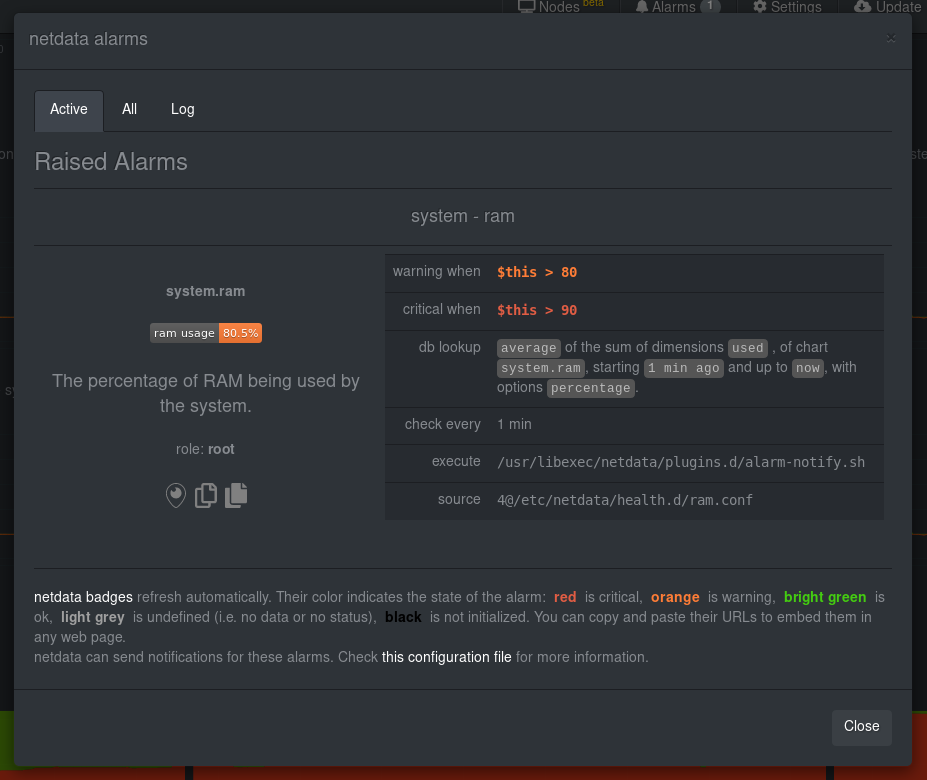 - -If you'd like to try this alarm on your system, you can install a small program called -[stress](http://manpages.ubuntu.com/manpages/disco/en/man1/stress.1.html) to create a synthetic load. Use the command -below, and change the `8G` value to a number that's appropriate for the amount of RAM on your system. - -```bash -stress -m 1 --vm-bytes 8G --vm-keep -``` - -Netdata is capable of understanding much more complicated entities. To better understand how they work, read the [health -documentation](https://github.com/netdata/netdata/blob/master/health/README.md), look at some [examples](https://github.com/netdata/netdata/blob/master/health/REFERENCE.md#example-alarms), and open the files -containing the default entities on your system. - -## Enable Netdata's notification systems - -Health alarms, while great on their own, are pretty useless without some way of you knowing they've been triggered. -That's why Netdata comes with a notification system that supports more than a dozen services, such as email, Slack, -Discord, PagerDuty, Twilio, Amazon SNS, and much more. - -To see all the supported systems, visit our [notifications documentation](https://github.com/netdata/netdata/blob/master/health/notifications/README.md). - -We'll cover email and Slack notifications here, but with this knowledge you should be able to enable any other type of -notifications instead of or in addition to these. - -### Email notifications - -To use email notifications, you need `sendmail` or an equivalent installed on your system. Linux systems use `sendmail` -or similar programs to, unsurprisingly, send emails to any inbox. - -> Learn more about `sendmail` via its [documentation](http://www.postfix.org/sendmail.1.html). - -Edit the `health_alarm_notify.conf` file, which resides in your Netdata directory. - -```bash -sudo ./edit-config health_alarm_notify.conf -``` - -Look for the following lines: - -```conf -# if a role recipient is not configured, an email will be send to: -DEFAULT_RECIPIENT_EMAIL="root" -# to receive only critical alarms, set it to "root|critical" -``` - -Change the value of `DEFAULT_RECIPIENT_EMAIL` to the email address at which you'd like to receive notifications. - -```conf -# if a role recipient is not configured, an email will be sent to: -DEFAULT_RECIPIENT_EMAIL="me@example.com" -# to receive only critical alarms, set it to "root|critical" -``` - -Test email notifications system by first becoming the Netdata user and then asking Netdata to send a test alarm: - -```bash -sudo su -s /bin/bash netdata -/usr/libexec/netdata/plugins.d/alarm-notify.sh test -``` - -You should see output similar to this: - -```bash -# SENDING TEST WARNING ALARM TO ROLE: sysadmin -2019-10-17 18:23:38: alarm-notify.sh: INFO: sent email notification for: hostname test.chart.test_alarm is WARNING to 'me@example.com' -# OK - -# SENDING TEST CRITICAL ALARM TO ROLE: sysadmin -2019-10-17 18:23:38: alarm-notify.sh: INFO: sent email notification for: hostname test.chart.test_alarm is CRITICAL to 'me@example.com' -# OK - -# SENDING TEST CLEAR ALARM TO ROLE: sysadmin -2019-10-17 18:23:39: alarm-notify.sh: INFO: sent email notification for: hostname test.chart.test_alarm is CLEAR to 'me@example.com' -# OK -``` - -... and you should get three separate emails, one for each test alarm, in your inbox! (Be sure to check your spam -folder.) - -## Enable Slack notifications - -If you're one of the many who spend their workday getting pinged with GIFs by your colleagues, why not add Netdata -notifications to the mix? It's a great way to immediately see, collaborate around, and respond to anomalies in your -infrastructure. - -To get Slack notifications working, you first need to add an [incoming -webhook](https://slack.com/apps/A0F7XDUAZ-incoming-webhooks) to the channel of your choice. Click the green **Add to -Slack** button, choose the channel, and click the **Add Incoming WebHooks Integration** button. - -On the following page, you'll receive a **Webhook URL**. That's what you'll need to configure Netdata, so keep it handy. - -Time to dive back into your `health_alarm_notify.conf` file: - -```bash -sudo ./edit-config health_alarm_notify.conf -``` - -Look for the `SLACK_WEBHOOK_URL=" "` line and add the incoming webhook URL you got from Slack: - -```conf -SLACK_WEBHOOK_URL="https://hooks.slack.com/services/XXXXXXXXX/XXXXXXXXX/XXXXXXXXXXXX" -``` - -A few lines down, edit the `DEFAULT_RECIPIENT_SLACK` line to contain a single hash `#` character. This instructs Netdata -to send a notification to the channel you configured with the incoming webhook. - -```conf -DEFAULT_RECIPIENT_SLACK="#" -``` - -Time to test the notifications again! - -```bash -sudo su -s /bin/bash netdata -/usr/libexec/netdata/plugins.d/alarm-notify.sh test -``` - -You should receive three notifications in your Slack channel. - -Congratulations! You're set up with two awesome ways to get notified about any change in the health of your systems or -applications. - -To further configure your email or Slack notification setup, or to enable other notification systems, check out the -following documentation: - -- [Email notifications](https://github.com/netdata/netdata/blob/master/health/notifications/email/README.md) -- [Slack notifications](https://github.com/netdata/netdata/blob/master/health/notifications/slack/README.md) -- [Netdata's notification system](https://github.com/netdata/netdata/blob/master/health/notifications/README.md) - -## What's next? - -In this step, you learned the fundamentals of Netdata's health monitoring tools: alarms and notifications. You should be -able to tune default alarms, silence them, and understand some of the basics of writing health entities. And, if you so -chose, you'll now have both email and Slack notifications enabled. - -You're coming along quick! - -Next up, we're going to cover how Netdata collects its metrics, and how you can get Netdata to collect real-time metrics -from hundreds of services with almost no configuration on your part. Onward! - -[Next: Collect metrics from more services and apps →](step-06.md) - - |