
diff options
Diffstat (limited to 'docs/guides/step-by-step/step-08.md')
| -rw-r--r-- | docs/guides/step-by-step/step-08.md | 395 |
1 files changed, 0 insertions, 395 deletions
diff --git a/docs/guides/step-by-step/step-08.md b/docs/guides/step-by-step/step-08.md deleted file mode 100644 index 7a8d417f..00000000 --- a/docs/guides/step-by-step/step-08.md +++ /dev/null @@ -1,395 +0,0 @@ -<!-- -title: "Step 8. Build your first custom dashboard" -custom_edit_url: https://github.com/netdata/netdata/edit/master/docs/guides/step-by-step/step-08.md ---> - -# Step 8. Build your first custom dashboard - -In previous steps of the guide, you have learned how several sections of the Netdata dashboard worked. - -This step will show you how to set up a custom dashboard to fit your unique needs. If nothing else, Netdata is really, -really flexible. 🤸 - -## What you'll learn in this step - -In this step of the Netdata guide, you'll learn: - -- [Why you might want a custom dashboard](#why-should-i-create-a-custom-dashboard) -- [How to create and prepare your `custom-dashboard.html` file](#create-and-prepare-your-custom-dashboardhtml-file) -- [Where to add `dashboard.js` to your custom dashboard file](#add-dashboardjs-to-your-custom-dashboard-file) -- [How to add basic styling](#add-some-basic-styling) -- [How to add charts of different types, shapes, and sizes](#creating-your-dashboards-charts) - -Let's get on with it! - -## Why should I create a custom dashboard? - -Because it's cool! - -But there are way more reasons than that, most of which will prove more valuable to you. - -You could use custom dashboards to aggregate real-time data from multiple Netdata agents in one place. Or, you could put -all the charts with metrics collected from your custom application via `statsd` and perform application performance -monitoring from a single dashboard. You could even use a custom dashboard and a standalone web server to create an -enriched public status page for your service, and give your users something fun to look at while they're waiting for the -503 errors to clear up! - -Netdata's custom dashboarding capability is meant to be as flexible as your ideas. We hope you can take these -fundamental ideas and turn them into something amazing. - -## Create and prepare your `custom-dashboard.html` file - -By default, Netdata stores its web server files at `/usr/share/netdata/web`. As with finding the location of your -`netdata.conf` file, you can double-check this location by loading up `http://HOST:19999/netdata.conf` in your browser -and finding the value of the `web files directory` option. - -To create your custom dashboard, create a file at `/usr/share/netdata/web/custom-dashboard.html` and copy in the -following: - -```html -<!DOCTYPE html> -<html lang="en"> -<head> - <title>My custom dashboard</title> - - <meta http-equiv="Content-Type" content="text/html; charset=utf-8" /> - <meta charset="utf-8"> - <meta http-equiv="X-UA-Compatible" content="IE=edge,chrome=1"> - <meta name="viewport" content="width=device-width, initial-scale=1"> - <meta name="apple-mobile-web-app-capable" content="yes"> - <meta name="apple-mobile-web-app-status-bar-style" content="black-translucent"> - - <!-- Add dashboard.js here! --> - -</head> -<body> - - <main class="container"> - - <h1>My custom dashboard</h1> - - <!-- Add charts here! --> - - </main> - -</body> -</html> -``` - -Try visiting `http://HOST:19999/custom-dashboard.html` in your browser. - -If you get a blank page with this text: `Access to file is not permitted: /usr/share/netdata/web/custom-dashboard.html`. -You can fix this error by changing the dashboard file's permissions to make it owned by the `netdata` user. - -```bash -sudo chown netdata:netdata /usr/share/netdata/web/custom-dashboard.html -``` - -Reload your browser, and you should see a blank page with the title: **Your custom dashboard**! - -## Add `dashboard.js` to your custom dashboard file - -You need to include the `dashboard.js` file of a Netdata agent to add Netdata charts. Add the following to the `<head>` -of your custom dashboard page and change `HOST` according to your setup. - -```html - <!-- Add dashboard.js here! --> - <script type="text/javascript" src="http://HOST:19999/dashboard.js"></script> -``` - -When you add `dashboard.js` to any web page, it loads several JavaScript and CSS files to create and style charts. It -also scans the page for elements that define charts, builds them, and refreshes with new metrics. - -> If you enabled SSL on your Netdata dashboard already, you'll need to use `https://` to grab the `dashboard.js` file. - -## Add some basic styling - -While not necessary, let's add some basic styling to make our dashboard look a little nicer. We're putting some -basic CSS into a `<style>` tag inside of the page's `<head>` element. - -```html - <!-- Add dashboard.js here! --> - <script type="text/javascript" src="http://HOST:19999/dashboard.js"></script> - - <style> - .wrap { - max-width: 1280px; - margin: 0 auto; - } - - h1 { - margin-bottom: 30px; - text-align: center; - } - - .charts { - display: flex; - flex-flow: row wrap; - justify-content: space-around; - } - </style> - -</head> -``` - -## Creating your dashboard's charts - -Time to create a chart! - -You need to create a `<div>` for each new chart. Each `<div>` element accepts a few `data-` attributes, some of which -are required and some of which are optional. - -Let's cover a few important ones. And while we do it, we'll create a custom dashboard that shows a few CPU-related -charts on a single page. - -### The chart unique ID (required) - -You need to specify the unique ID of a chart to show it on your custom dashboard. If you forgot how to find the unique -ID, head back over to [step 2](https://github.com/netdata/netdata/blob/master/docs/guides/step-by-step/step-02.md#understand-charts-dimensions-families-and-contexts) -for a re-introduction. - -You can then put this unique ID into a `<div>` element with the `data-netdata` attribute. Put this in the `<body>` of -your custom dashboard file beneath the helpful comment. - -```html -<body> - - <main class="wrap"> - - <h1>My custom dashboard</h1> - - <div class="charts"> - - <!-- Add charts here! --> - <div data-netdata="system.cpu"></div> - - </div> - - </main> - -</body> -``` - -Reload the page, and you should see a real-time `system.cpu` chart! - -... and a whole lot of white space. Let's fix that by adding a few more charts. - -```html - <!-- Add charts here! --> - <div data-netdata="system.cpu"></div> - <div data-netdata="apps.cpu"></div> - <div data-netdata="groups.cpu"></div> - <div data-netdata="users.cpu"></div> -``` - -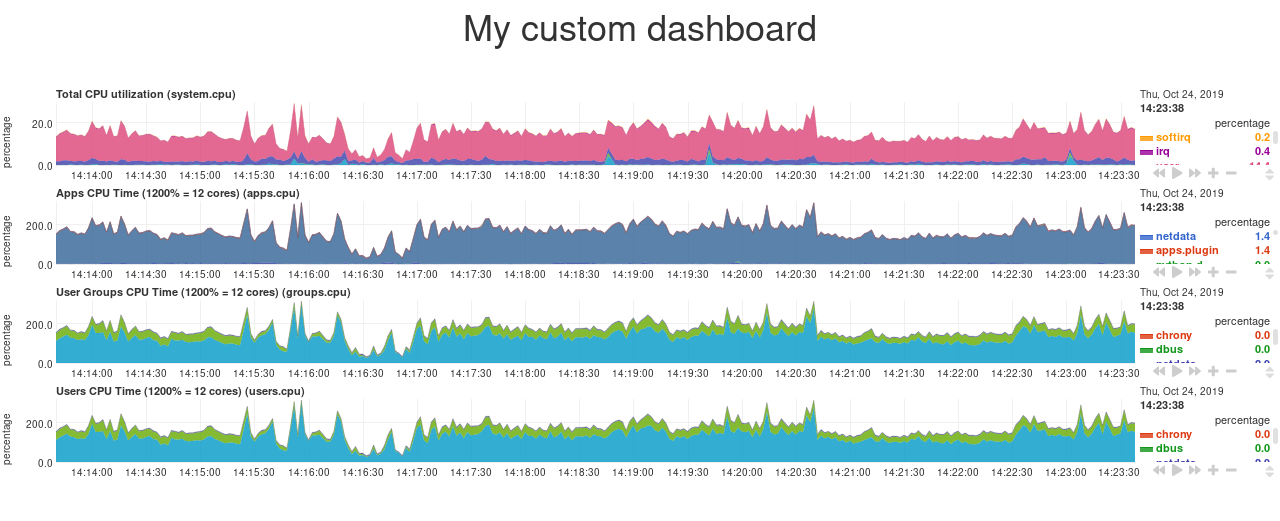 - -### Set chart duration - -By default, these charts visualize 10 minutes of Netdata metrics. Let's get a little more granular on this dashboard. To -do so, add a new `data-after=""` attribute to each chart. - -`data-after` takes a _relative_ number of seconds from _now_. So, by putting `-300` as the value, you're asking the -custom dashboard to display the _last 5 minutes_ (`5m * 60s = 300s`) of data. - -```html - <!-- Add charts here! --> - <div data-netdata="system.cpu" - data-after="-300"> - </div> - <div data-netdata="apps.cpu" - data-after="-300"> - </div> - <div data-netdata="groups.cpu" - data-after="-300"> - </div> - <div data-netdata="users.cpu" - data-after="-300"> - </div> -``` - -### Set chart size - -You can set the size of any chart using the `data-height=""` and `data-width=""` attributes. These attributes can be -anything CSS accepts for width and height (e.g. percentages, pixels, em/rem, calc, and so on). - -Let's make the charts a little taller and allow them to fit side-by-side for a more compact view. Add -`data-height="200px"` and `data-width="50%"` to each chart. - -```html - <div data-netdata="system.cpu" - data-after="-300" - data-height="250px" - data-width="50%"></div> - <div data-netdata="apps.cpu" - data-after="-300" - data-height="250px" - data-width="50%"></div> - <div data-netdata="groups.cpu" - data-after="-300" - data-height="250px" - data-width="50%"></div> - <div data-netdata="users.cpu" - data-after="-300" - data-height="250px" - data-width="50%"></div> -``` - -Now we're getting somewhere! - -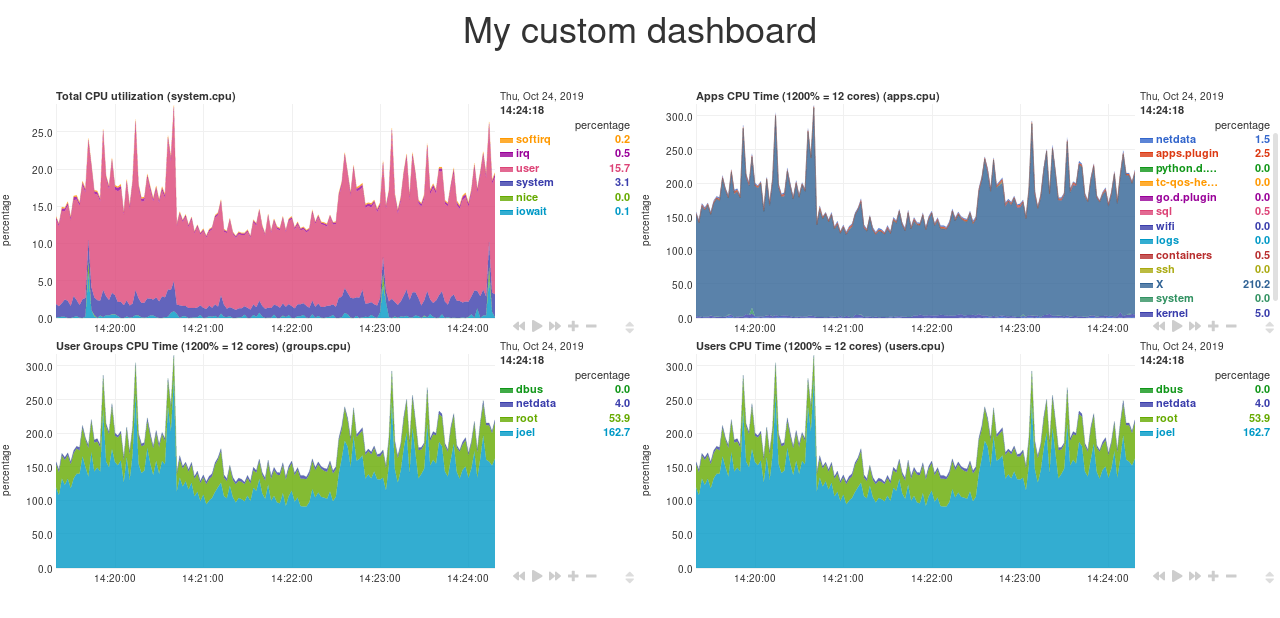 - -## Final touches - -While we already have a perfectly workable dashboard, let's add some final touches to make it a little more pleasant on -the eyes. - -First, add some extra CSS to create some vertical whitespace between the top and bottom row of charts. - -```html - <style> - ... - - .charts > div { - margin-bottom: 6rem; - } - </style> -``` - -To create horizontal whitespace, change the value of `data-width="50%"` to `data-width="calc(50% - 2rem)"`. - -```html - <div data-netdata="system.cpu" - data-after="-300" - data-height="250px" - data-width="calc(50% - 2rem)"></div> - <div data-netdata="apps.cpu" - data-after="-300" - data-height="250px" - data-width="calc(50% - 2rem)"></div> - <div data-netdata="groups.cpu" - data-after="-300" - data-height="250px" - data-width="calc(50% - 2rem)"></div> - <div data-netdata="users.cpu" - data-after="-300" - data-height="250px" - data-width="calc(50% - 2rem)"></div> -``` - -Told you the `data-width` and `data-height` attributes can take any CSS values! - -Prefer a dark theme? Add this to your `<head>` _above_ where you added `dashboard.js`: - -```html - <script> - var netdataTheme = 'slate'; - </script> - - <!-- Add dashboard.js here! --> - <script type="text/javascript" src="https://HOST/dashboard.js"></script> -``` - -Refresh the dashboard to give your eyes a break from all that blue light! - -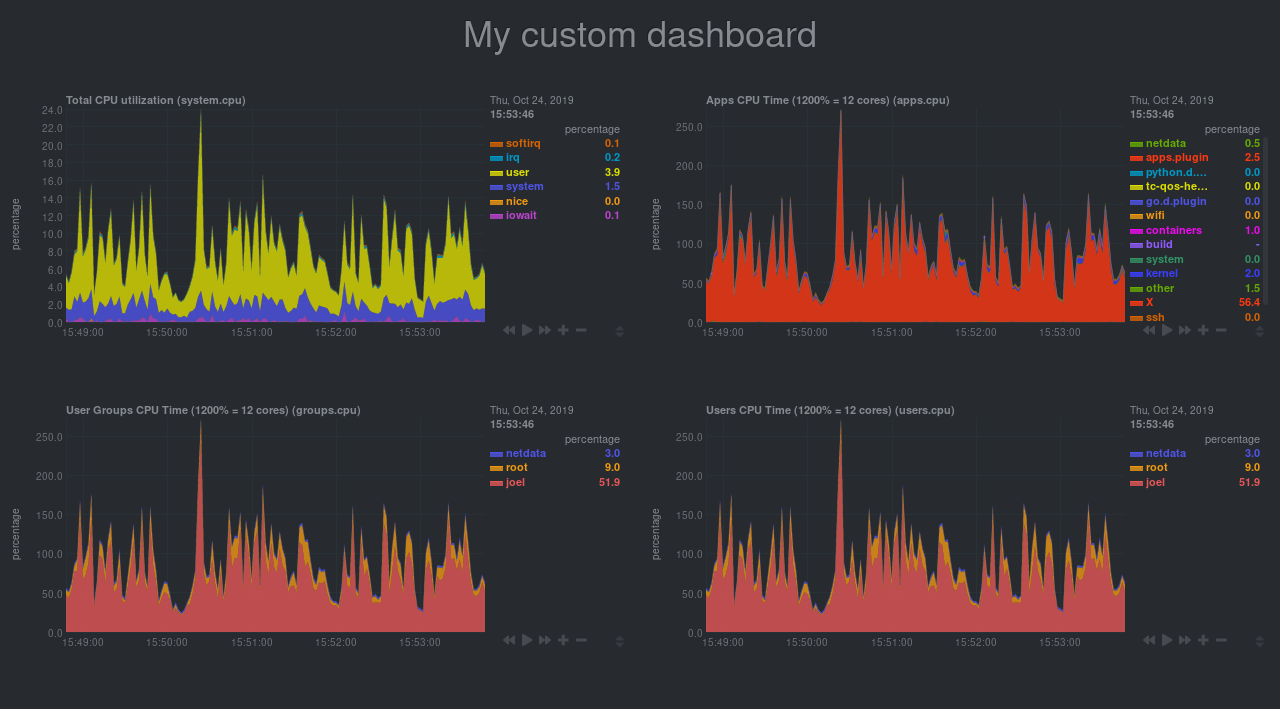 - -## The final `custom-dashboard.html` - -In case you got lost along the way, here's the final version of the `custom-dashboard.html` file: - -```html -<!DOCTYPE html> -<html lang="en"> -<head> - <title>My custom dashboard</title> - - <meta http-equiv="Content-Type" content="text/html; charset=utf-8" /> - <meta charset="utf-8"> - <meta http-equiv="X-UA-Compatible" content="IE=edge,chrome=1"> - <meta name="viewport" content="width=device-width, initial-scale=1"> - <meta name="apple-mobile-web-app-capable" content="yes"> - <meta name="apple-mobile-web-app-status-bar-style" content="black-translucent"> - - <script> - var netdataTheme = 'slate'; - </script> - - <!-- Add dashboard.js here! --> - <script type="text/javascript" src="http://localhost:19999/dashboard.js"></script> - - <style> - .wrap { - max-width: 1280px; - margin: 0 auto; - } - - h1 { - margin-bottom: 30px; - text-align: center; - } - - .charts { - display: flex; - flex-flow: row wrap; - justify-content: space-around; - } - - .charts > div { - margin-bottom: 6rem; - position: relative; - } - </style> - -</head> -<body> - - <main class="wrap"> - - <h1>My custom dashboard</h1> - - <div class="charts"> - - <!-- Add charts here! --> - <div data-netdata="system.cpu" - data-after="-300" - data-height="250px" - data-width="calc(50% - 2rem)"></div> - <div data-netdata="apps.cpu" - data-after="-300" - data-height="250px" - data-width="calc(50% - 2rem)"></div> - <div data-netdata="groups.cpu" - data-after="-300" - data-height="250px" - data-width="calc(50% - 2rem)"></div> - <div data-netdata="users.cpu" - data-after="-300" - data-height="250px" - data-width="calc(50% - 2rem)"></div> - - </div> - - </main> - -</body> -</html> -``` - -## What's next? - -In this guide, you learned the fundamentals of building a custom Netdata dashboard. You should now be able to add more -charts to your `custom-dashboard.html`, change the charts that are already there, and size them according to your needs. - -Of course, the custom dashboarding features covered here are just the beginning. Be sure to read up on our [custom -dashboard documentation](https://github.com/netdata/netdata/blob/master/web/gui/custom/README.md) for details on how you can use other chart libraries, pull metrics -from multiple Netdata agents, and choose which dimensions a given chart shows. - -Next, you'll learn how to store long-term historical metrics in Netdata! - -[Next: Long-term metrics storage →](https://github.com/netdata/netdata/blob/master/docs/guides/step-by-step/step-09.md) - - |