
diff options
Diffstat (limited to 'docs/monitor/view-active-alarms.md')
| -rw-r--r-- | docs/monitor/view-active-alarms.md | 77 |
1 files changed, 34 insertions, 43 deletions
diff --git a/docs/monitor/view-active-alarms.md b/docs/monitor/view-active-alarms.md index 07c22fe1..cc6a2d3a 100644 --- a/docs/monitor/view-active-alarms.md +++ b/docs/monitor/view-active-alarms.md @@ -1,45 +1,46 @@ -<!-- -title: "View active health alarms" -description: "View active alarms and their rich data to discover and resolve anomalies and performance issues across your infrastructure." -custom_edit_url: "https://github.com/netdata/netdata/edit/master/docs/monitor/view-active-alarms.md" -sidebar_label: "View active health alarms" -learn_status: "Published" -learn_topic_type: "Concepts" -learn_rel_path: "Operations/Alerts" ---> +# View active alerts -# View active health alarms +Netdata comes with hundreds of pre-configured health alerts designed to notify you when an anomaly or performance issue affects your node or its applications. -Every Netdata Agent comes with hundreds of pre-installed health alarms designed to notify you when an anomaly or -performance issue affects your node or the applications it runs. +From the Alerts tab you can see all the active alerts in your War Room. You will be presented with a table having information about each alert that is in warning and critical state. +You can always sort the table by a certain column by clicking on the name of that column, and use the gear icon on the top right to control which columns are visible at any given time. -## Netdata Cloud +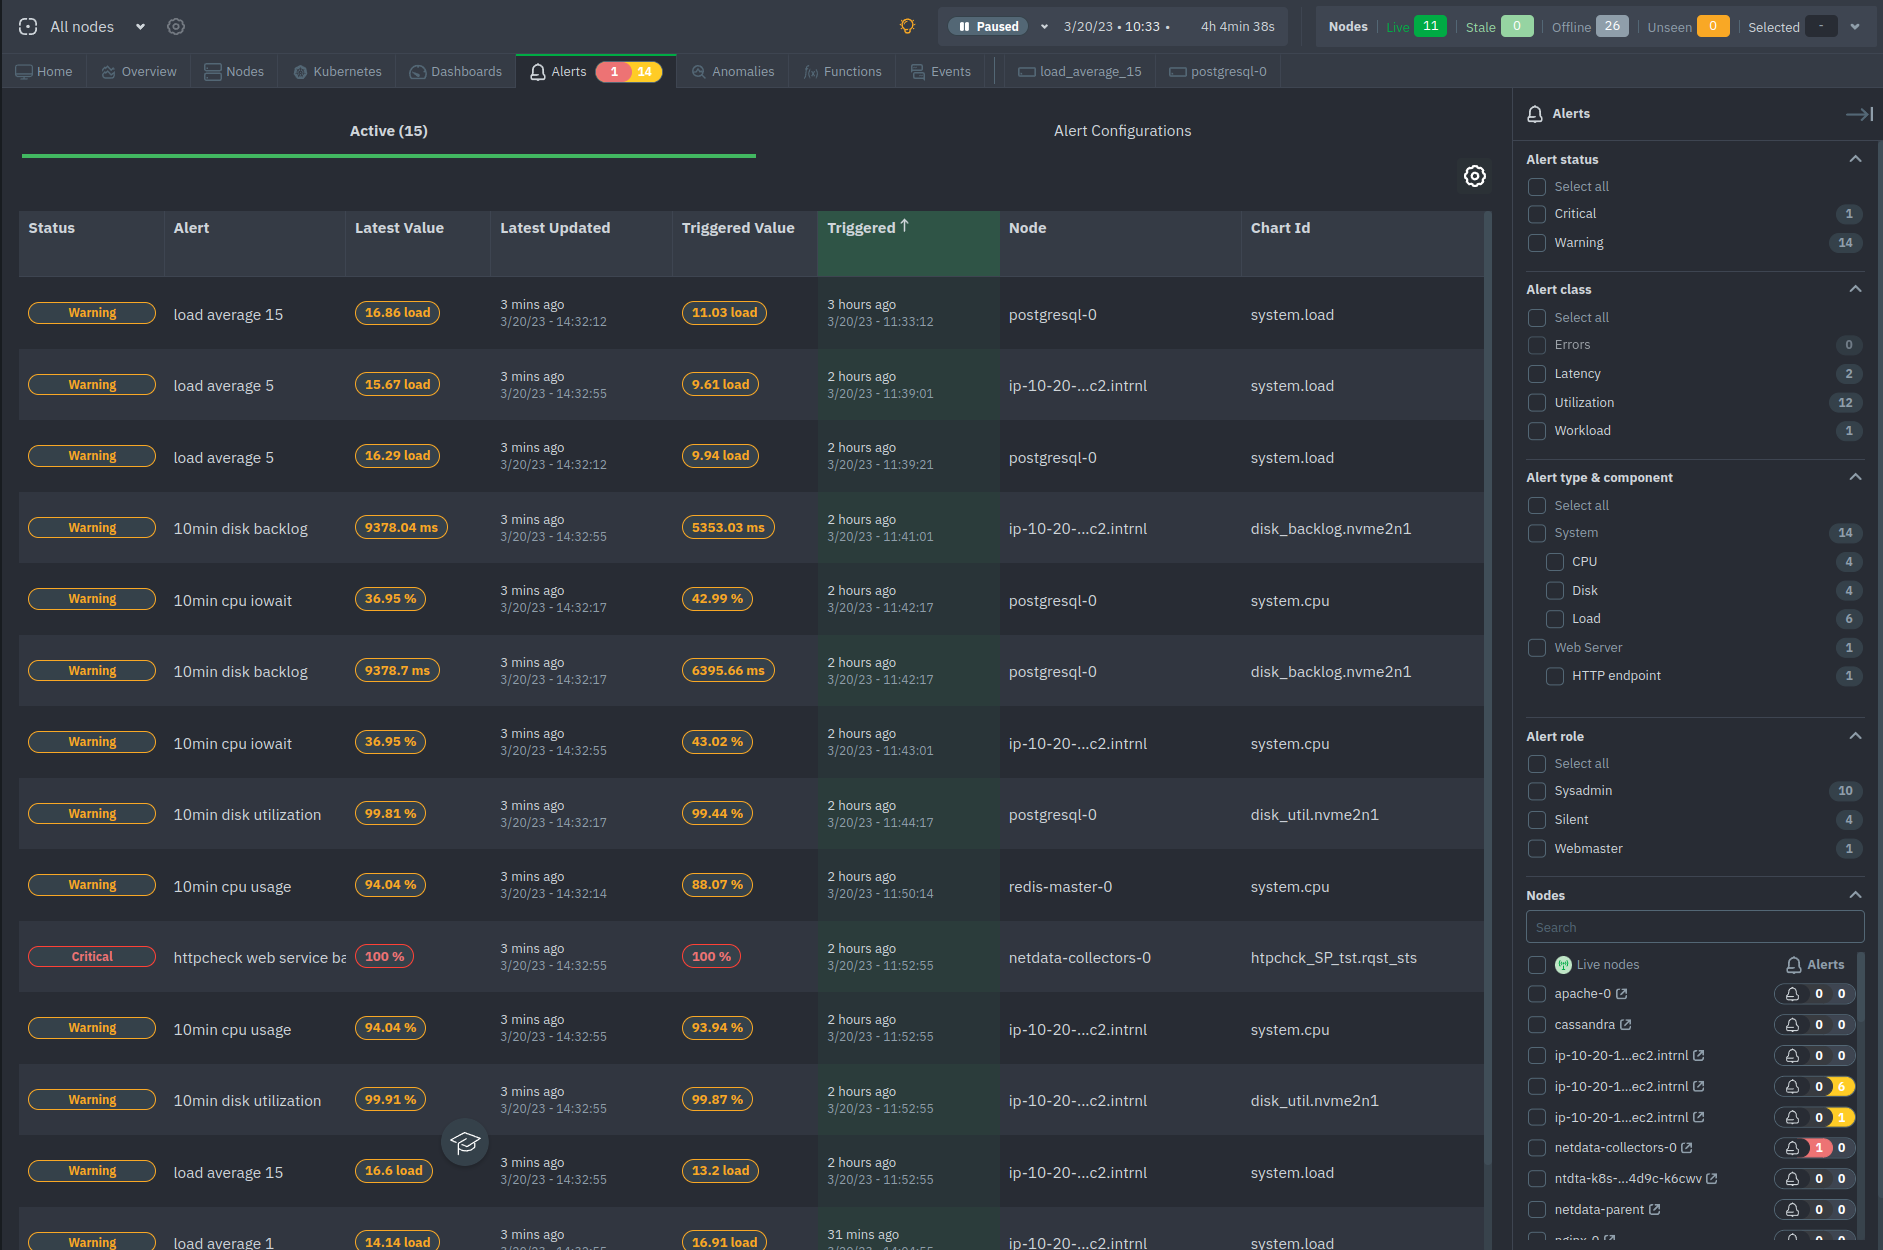 -A War Room's [alarms indicator](https://learn.netdata.cloud/docs/cloud/war-rooms#indicators) displays the number of -active `critical` (red) and `warning` (yellow) alerts for the nodes in this War Room. Click on either the critical or -warning badges to open a pre-filtered modal displaying only those types of [active -alarms](https://github.com/netdata/netdata/blob/master/docs/cloud/alerts-notifications/view-active-alerts.mdx). +## Filter alerts -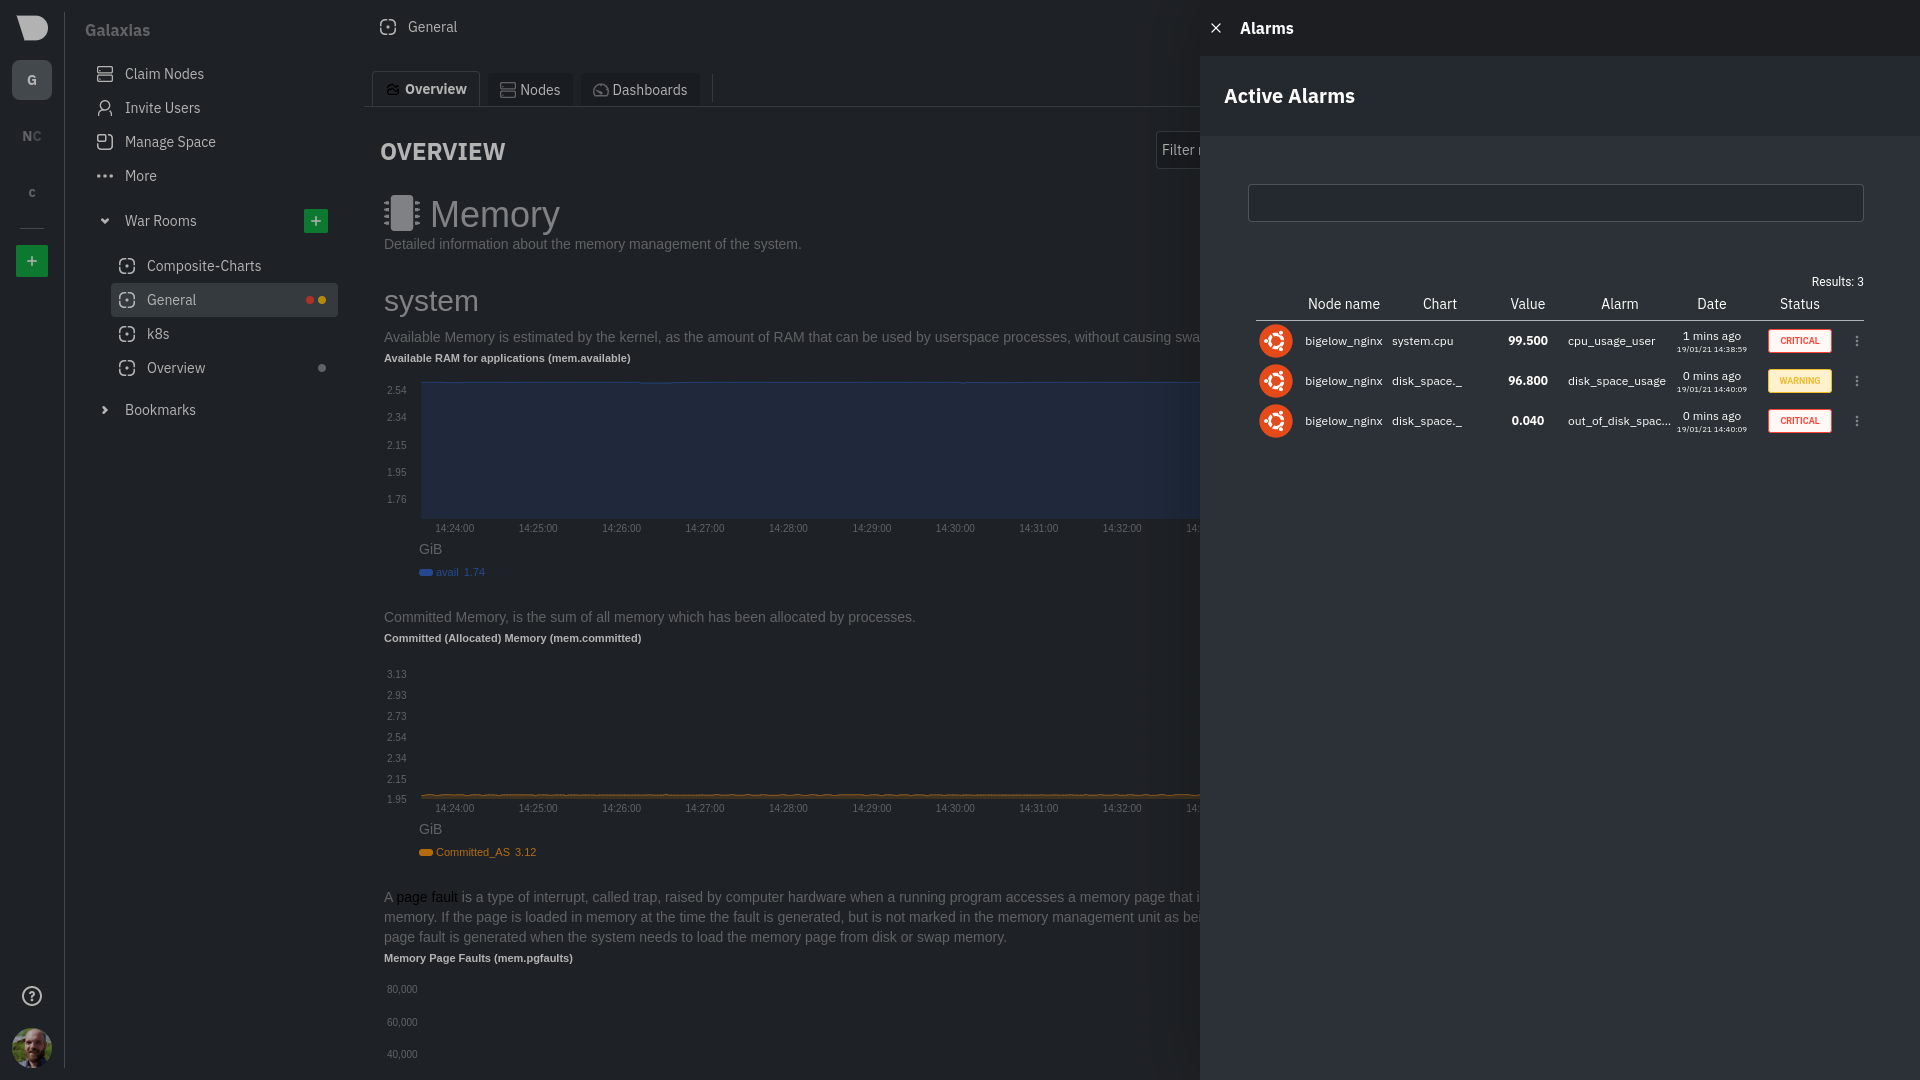 +From this tab, you can also filter alerts with the right hand bar. More specifically you can filter: -The Alarms panel lists all active alarms for nodes within that War Room, and tells you which chart triggered the alarm, -what that chart's current value is, the alarm that triggered it, and when the alarm status first began. +- Alert status + - Filter based on the status of the alerts (e.g. Warning, Critical) +- Alert class + - Filter based on the class of the alert (e.g. Latency, Utilization, Workload etc.) +- Alert type & component + - Filter based on the alert's type (e.g. System, Web Server) and component (e.g. CPU, Disk, Load) +- Alert role + - Filter by the role that the alert is set to notify (e.g. Sysadmin, Webmaster etc.) +- Nodes + - Filter the alerts based on the nodes that are online, next to each node's name you can see how many alerts the node has, "critical" colored in red and "warning" colored in yellow -Use the input field in the Alarms panel to filter active alarms. You can sort by the node's name, alarm, status, chart -that triggered the alarm, or the operating system. Read more about the [filtering -syntax](https://learn.netdata.cloud/docs/cloud/war-rooms#node-filter) to build valuable filters for your infrastructure. +## View alert details -Click on the 3-dot icon (`⋮`) to view active alarm information or navigate directly to the offending chart in that -node's Cloud dashboard with the **Go to chart** button. +By clicking on the name of an entry of the table you can access that alert's details page, providing you with: -The active alarm information gives you details about the alarm that's been triggered. You can see the alarm's -configuration, how it calculates warning or critical alarms, and which configuration file you could edit on that node if -you want to tweak or disable the alarm to better suit your needs. +- Latest and Triggered time values +- The alert's description +- A link to the Community forum's alert page +- The chart at the time frame that the alert was triggered +- The alert's information: Node name, chart ID, type, component and class +- Configuration section +- Instance values - Node Instances -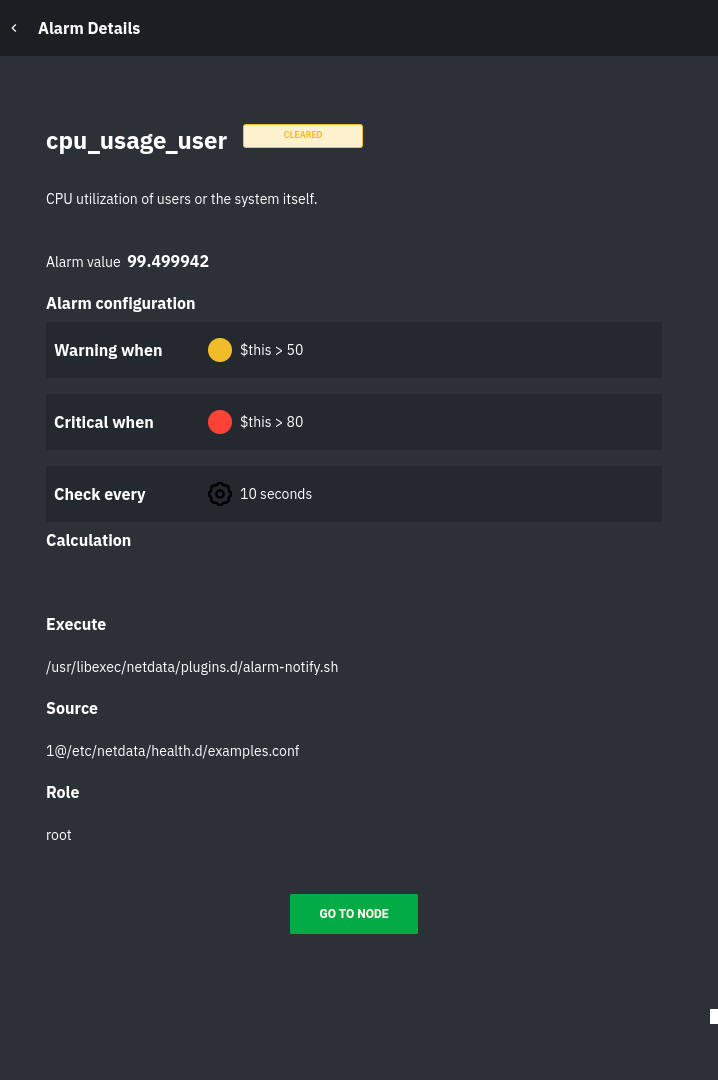 +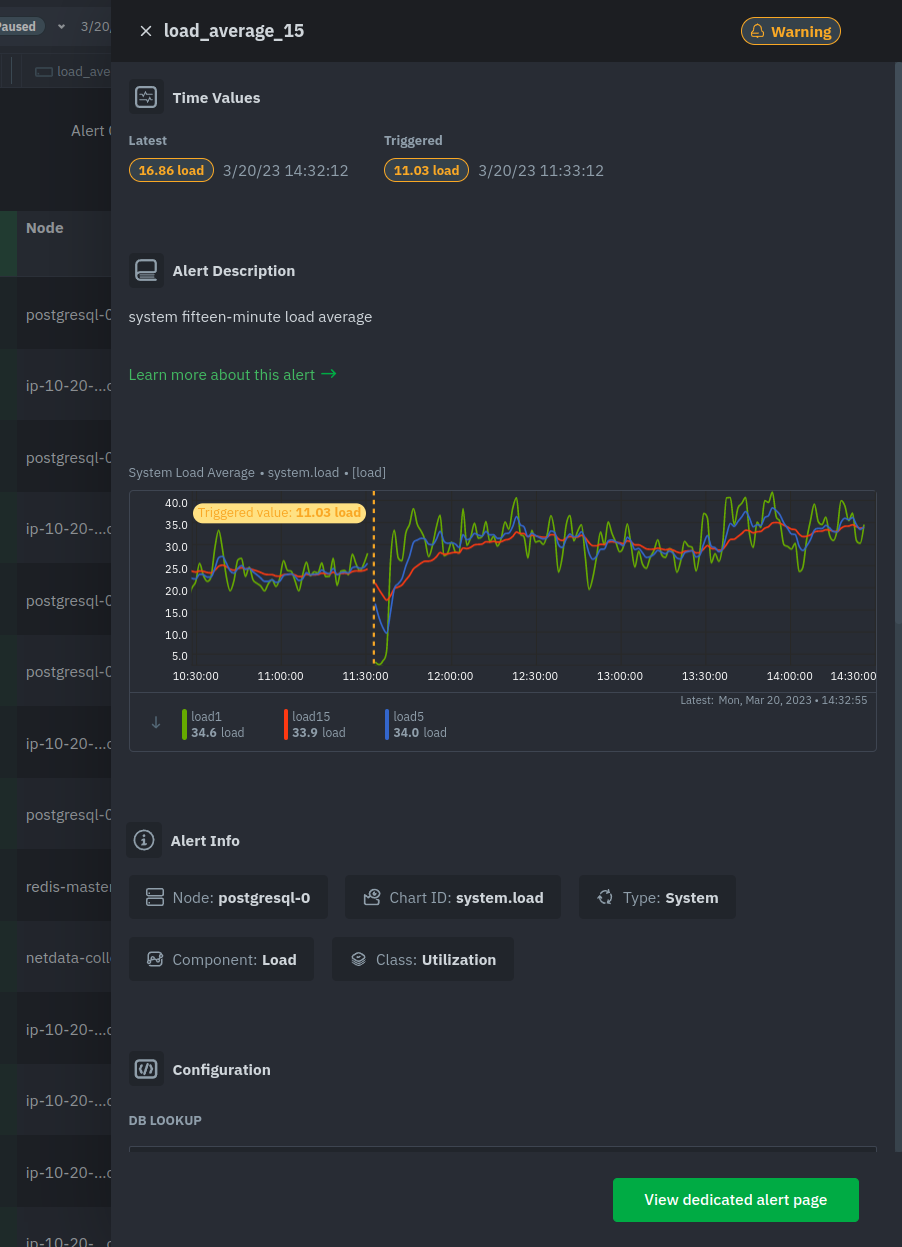 +At the bottom of the panel you can click the green button "View dedicated alert page" to open a [dynamic tab](https://github.com/netdata/netdata/blob/master/docs/quickstart/infrastructure.md#dynamic-tabs) containing all the info for this alert in a tab format, where you can also run correlations and go to the node's chart that raised the particular alert. + +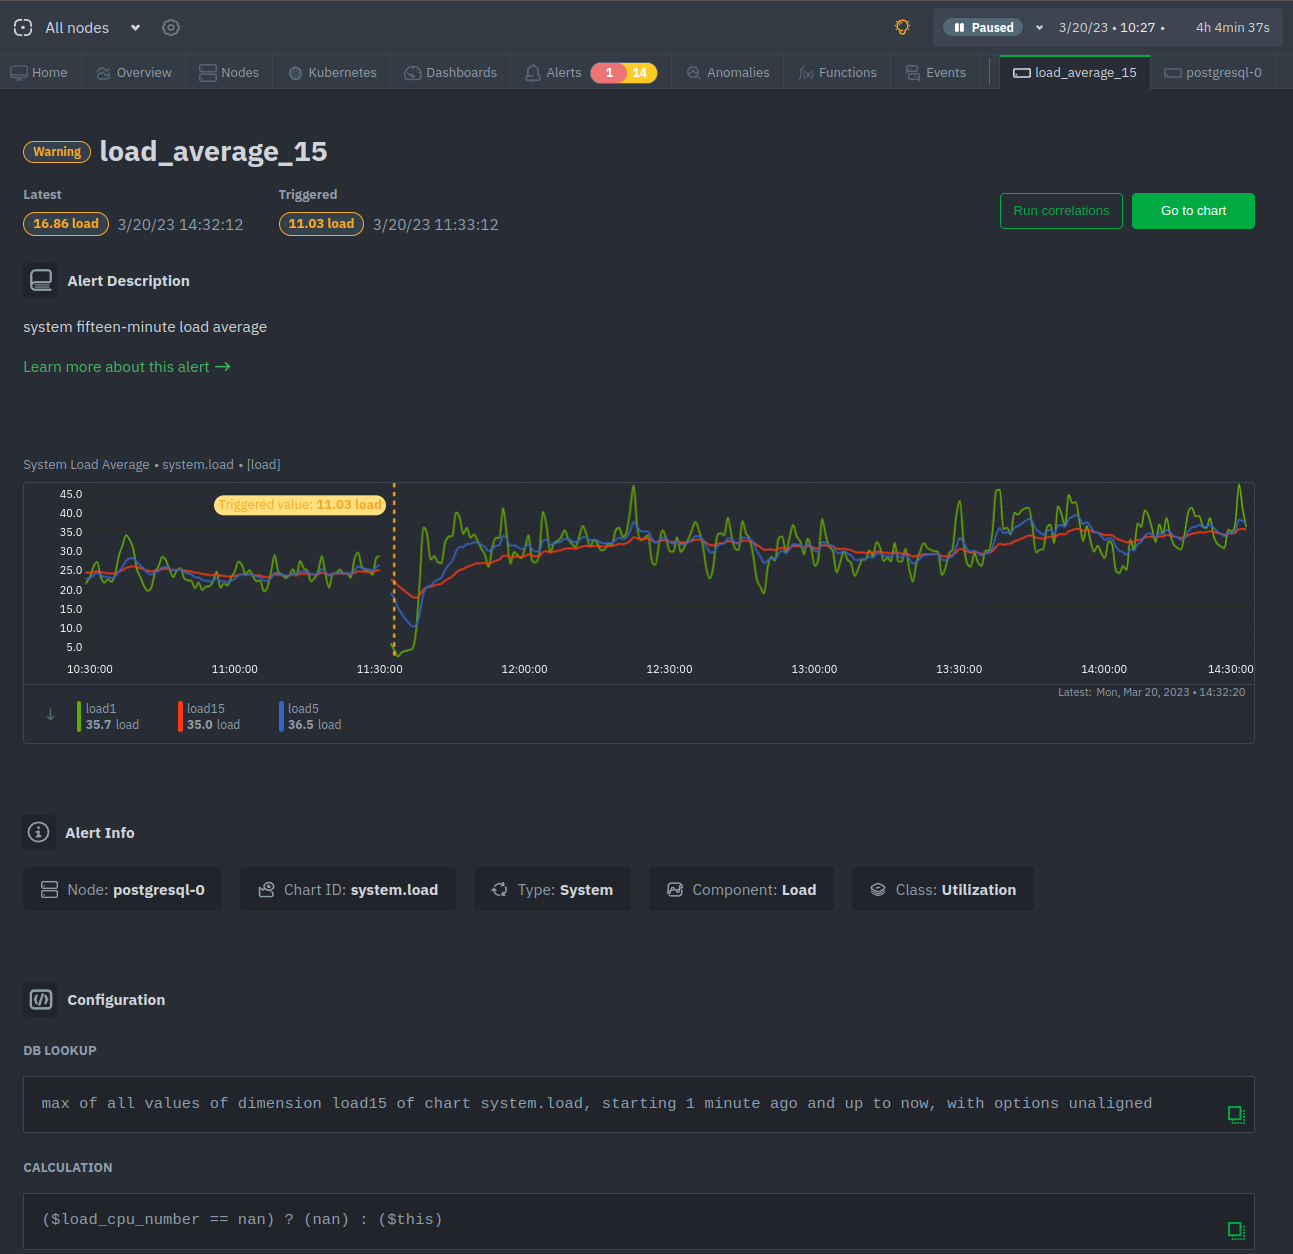 + +<!-- ## Local Netdata Agent dashboard Find the alarms icon . - -## What's next? - -With the information that appears on Netdata Cloud and the local dashboard about active alarms, you can [configure -alarms](https://github.com/netdata/netdata/blob/master/docs/monitor/configure-alarms.md) to match your infrastructure's needs or your team's goals. - -If you're happy with the pre-configured alarms, skip ahead to [enable -notifications](https://github.com/netdata/netdata/blob/master/docs/monitor/enable-notifications.md) to use Netdata Cloud's centralized alarm notifications and/or -per-node notifications to endpoints like Slack, PagerDuty, Twilio, and more. - - +use as a reference to [configure alarms](https://github.com/netdata/netdata/blob/master/health/REFERENCE.md). + --> |