
diff options
Diffstat (limited to 'docs/monitor')
| -rw-r--r-- | docs/monitor/configure-alarms.md | 152 | ||||
| -rw-r--r-- | docs/monitor/enable-notifications.md | 92 | ||||
| -rw-r--r-- | docs/monitor/view-active-alarms.md | 77 |
3 files changed, 50 insertions, 271 deletions
diff --git a/docs/monitor/configure-alarms.md b/docs/monitor/configure-alarms.md deleted file mode 100644 index 4b5b8134e..000000000 --- a/docs/monitor/configure-alarms.md +++ /dev/null @@ -1,152 +0,0 @@ -<!-- -title: "Configure health alarms" -description: "Netdata's health monitoring watchdog is incredibly adaptable to your infrastructure's unique needs, with configurable health alarms." -custom_edit_url: "https://github.com/netdata/netdata/edit/master/docs/monitor/configure-alarms.md" -sidebar_label: "Configure health alarms" -learn_status: "Published" -learn_topic_type: "Tasks" -learn_rel_path: "Setup" ---> - -# Configure health alarms - -Netdata's health watchdog is highly configurable, with support for dynamic thresholds, hysteresis, alarm templates, and -more. You can tweak any of the existing alarms based on your infrastructure's topology or specific monitoring needs, or -create new entities. - -You can use health alarms in conjunction with any of Netdata's [collectors](https://github.com/netdata/netdata/blob/master/docs/collect/how-collectors-work.md) (see -the [supported collector list](https://github.com/netdata/netdata/blob/master/collectors/COLLECTORS.md)) to monitor the health of your systems, containers, and -applications in real time. - -While you can see active alarms both on the local dashboard and Netdata Cloud, all health alarms are configured _per -node_ via individual Netdata Agents. If you want to deploy a new alarm across your -[infrastructure](https://github.com/netdata/netdata/blob/master/docs/quickstart/infrastructure.md), you must configure each node with the same health configuration -files. - -## Edit health configuration files - -All of Netdata's [health configuration files](https://github.com/netdata/netdata/blob/master/health/REFERENCE.md#health-configuration-files) are in Netdata's config -directory, inside the `health.d/` directory. Navigate to your [Netdata config directory](https://github.com/netdata/netdata/blob/master/docs/configure/nodes.md) and -use `edit-config` to make changes to any of these files. - -For example, to edit the `cpu.conf` health configuration file, run: - -```bash -sudo ./edit-config health.d/cpu.conf -``` - -Each health configuration file contains one or more health _entities_, which always begin with `alarm:` or `template:`. -For example, here is the first health entity in `health.d/cpu.conf`: - -```yaml -template: 10min_cpu_usage - on: system.cpu - os: linux - hosts: * - lookup: average -10m unaligned of user,system,softirq,irq,guest - units: % - every: 1m - warn: $this > (($status >= $WARNING) ? (75) : (85)) - crit: $this > (($status == $CRITICAL) ? (85) : (95)) - delay: down 15m multiplier 1.5 max 1h - info: average cpu utilization for the last 10 minutes (excluding iowait, nice and steal) - to: sysadmin -``` - -To tune this alarm to trigger warning and critical alarms at a lower CPU utilization, change the `warn` and `crit` lines -to the values of your choosing. For example: - -```yaml - warn: $this > (($status >= $WARNING) ? (60) : (75)) - crit: $this > (($status == $CRITICAL) ? (75) : (85)) -``` - -Save the file and [reload Netdata's health configuration](#reload-health-configuration) to make your changes live. - -### Silence an individual alarm - -Instead of disabling an alarm altogether, or even disabling _all_ alarms, you can silence individual alarms by changing -one line in a given health entity. To silence any single alarm, change the `to:` line in its entity to `silent`. - -```yaml - to: silent -``` - -## Write a new health entity - -While tuning existing alarms may work in some cases, you may need to write entirely new health entities based on how -your systems, containers, and applications work. - -Read Netdata's [health reference](https://github.com/netdata/netdata/blob/master/health/REFERENCE.md#health-entity-reference) for a full listing of the format, -syntax, and functionality of health entities. - -To write a new health entity into a new file, navigate to your [Netdata config directory](https://github.com/netdata/netdata/blob/master/docs/configure/nodes.md), -then use `touch` to create a new file in the `health.d/` directory. Use `edit-config` to start editing the file. - -As an example, let's create a `ram-usage.conf` file. - -```bash -sudo touch health.d/ram-usage.conf -sudo ./edit-config health.d/ram-usage.conf -``` - -For example, here is a health entity that triggers a warning alarm when a node's RAM usage rises above 80%, and a -critical alarm above 90%: - -```yaml - alarm: ram_usage - on: system.ram -lookup: average -1m percentage of used - units: % - every: 1m - warn: $this > 80 - crit: $this > 90 - info: The percentage of RAM being used by the system. -``` - -Let's look into each of the lines to see how they create a working health entity. - -- `alarm`: The name for your new entity. The name needs to follow these requirements: - - Any alphabet letter or number. - - The symbols `.` and `_`. - - Cannot be `chart name`, `dimension name`, `family name`, or `chart variable names`. -- `on`: Which chart the entity listens to. -- `lookup`: Which metrics the alarm monitors, the duration of time to monitor, and how to process the metrics into a - usable format. - - `average`: Calculate the average of all the metrics collected. - - `-1m`: Use metrics from 1 minute ago until now to calculate that average. - - `percentage`: Clarify that we're calculating a percentage of RAM usage. - - `of used`: Specify which dimension (`used`) on the `system.ram` chart you want to monitor with this entity. -- `units`: Use percentages rather than absolute units. -- `every`: How often to perform the `lookup` calculation to decide whether or not to trigger this alarm. -- `warn`/`crit`: The value at which Netdata should trigger a warning or critical alarm. This example uses simple - syntax, but most pre-configured health entities use - [hysteresis](https://github.com/netdata/netdata/blob/master/health/REFERENCE.md#special-use-of-the-conditional-operator) to avoid superfluous notifications. -- `info`: A description of the alarm, which will appear in the dashboard and notifications. - -In human-readable format: - -> This health entity, named **ram_usage**, watches the **system.ram** chart. It looks up the last **1 minute** of -> metrics from the **used** dimension and calculates the **average** of all those metrics in a **percentage** format, -> using a **% unit**. The entity performs this lookup **every minute**. -> -> If the average RAM usage percentage over the last 1 minute is **more than 80%**, the entity triggers a warning alarm. -> If the usage is **more than 90%**, the entity triggers a critical alarm. - -When you finish writing this new health entity, [reload Netdata's health configuration](#reload-health-configuration) to -see it live on the local dashboard or Netdata Cloud. - -## Reload health configuration - -To make any changes to your health configuration live, you must reload Netdata's health monitoring system. To do that -without restarting all of Netdata, run `netdatacli reload-health` or `killall -USR2 netdata`. - -## What's next? - -With your health entities configured properly, it's time to [enable -notifications](https://github.com/netdata/netdata/blob/master/docs/monitor/enable-notifications.md) to get notified whenever a node reaches a warning or critical -state. - -To build complex, dynamic alarms, read our guide on [dimension templates](https://github.com/netdata/netdata/blob/master/docs/guides/monitor/dimension-templates.md). - - diff --git a/docs/monitor/enable-notifications.md b/docs/monitor/enable-notifications.md index 99c24b64e..1174561cf 100644 --- a/docs/monitor/enable-notifications.md +++ b/docs/monitor/enable-notifications.md @@ -1,51 +1,49 @@ <!-- -title: "Enable alarm notifications" +title: "Alert notifications" description: "Send Netdata alarms from a centralized place with Netdata Cloud, or configure nodes individually, to enable incident response and faster resolution." custom_edit_url: "https://github.com/netdata/netdata/edit/master/docs/monitor/enable-notifications.md" -sidebar_label: "Enable alarm notifications" +sidebar_label: "Notify" learn_status: "Published" -learn_topic_type: "Tasks" -learn_rel_path: "Setup" +learn_rel_path: "Integrations/Notify" --> -# Enable alarm notifications +# Alert notifications -Netdata offers two ways to receive alarm notifications on external platforms. These methods work independently _or_ in -parallel, which means you can enable both at the same time to send alarm notifications to any number of endpoints. +Netdata offers two ways to receive alert notifications on external platforms. These methods work independently _or_ in +parallel, which means you can enable both at the same time to send alert notifications to any number of endpoints. -Both methods use a node's health alarms to generate the content of alarm notifications. Read the doc on [configuring -alarms](https://github.com/netdata/netdata/blob/master/docs/monitor/configure-alarms.md) to change the preconfigured thresholds or to create tailored alarms for your +Both methods use a node's health alerts to generate the content of alert notifications. Read our documentation on [configuring alerts](https://github.com/netdata/netdata/blob/master/health/REFERENCE.md) to change the preconfigured thresholds or to create tailored alerts for your infrastructure. -Netdata Cloud offers [centralized alarm notifications](#netdata-cloud) via email, which leverages the health status +Netdata Cloud offers [centralized alert notifications](#netdata-cloud) via email, which leverages the health status information already streamed to Netdata Cloud from connected nodes to send notifications to those who have enabled them. The Netdata Agent has a [notification system](#netdata-agent) that supports more than a dozen services, such as email, Slack, PagerDuty, Twilio, Amazon SNS, Discord, and much more. -For example, use centralized alarm notifications in Netdata Cloud for immediate, zero-configuration alarm notifications +For example, use centralized alert notifications in Netdata Cloud for immediate, zero-configuration alert notifications for your team, then configure individual nodes send notifications to a PagerDuty endpoint for an automated incident response process. ## Netdata Cloud -Netdata Cloud's [centralized alarm -notifications](https://github.com/netdata/netdata/blob/master/docs/cloud/alerts-notifications/notifications.mdx) is a zero-configuration way to +Netdata Cloud's [centralized alert +notifications](https://github.com/netdata/netdata/blob/master/docs/cloud/alerts-notifications/notifications.md) is a zero-configuration way to get notified when an anomaly or incident strikes any node or application in your infrastructure. The advantage of using -centralized alarm notifications from Netdata Cloud is that you don't have to worry about configuring each node in your +centralized alert notifications from Netdata Cloud is that you don't have to worry about configuring each node in your infrastructure. -To enable centralized alarm notifications for a Space, click on **Manage Space** in the left-hand menu, then click on +To enable centralized alert notifications for a Space, click on **Manage Space** in the left-hand menu, then click on the **Notifications** tab. Click the toggle switch next to **E-mail** to enable this notification method. Next, enable notifications on a user level by clicking on your profile icon, then **Profile** in the dropdown. The **Notifications** tab reveals rich management settings, including the ability to enable/disable methods entirely or choose what types of notifications to receive from each War Room. -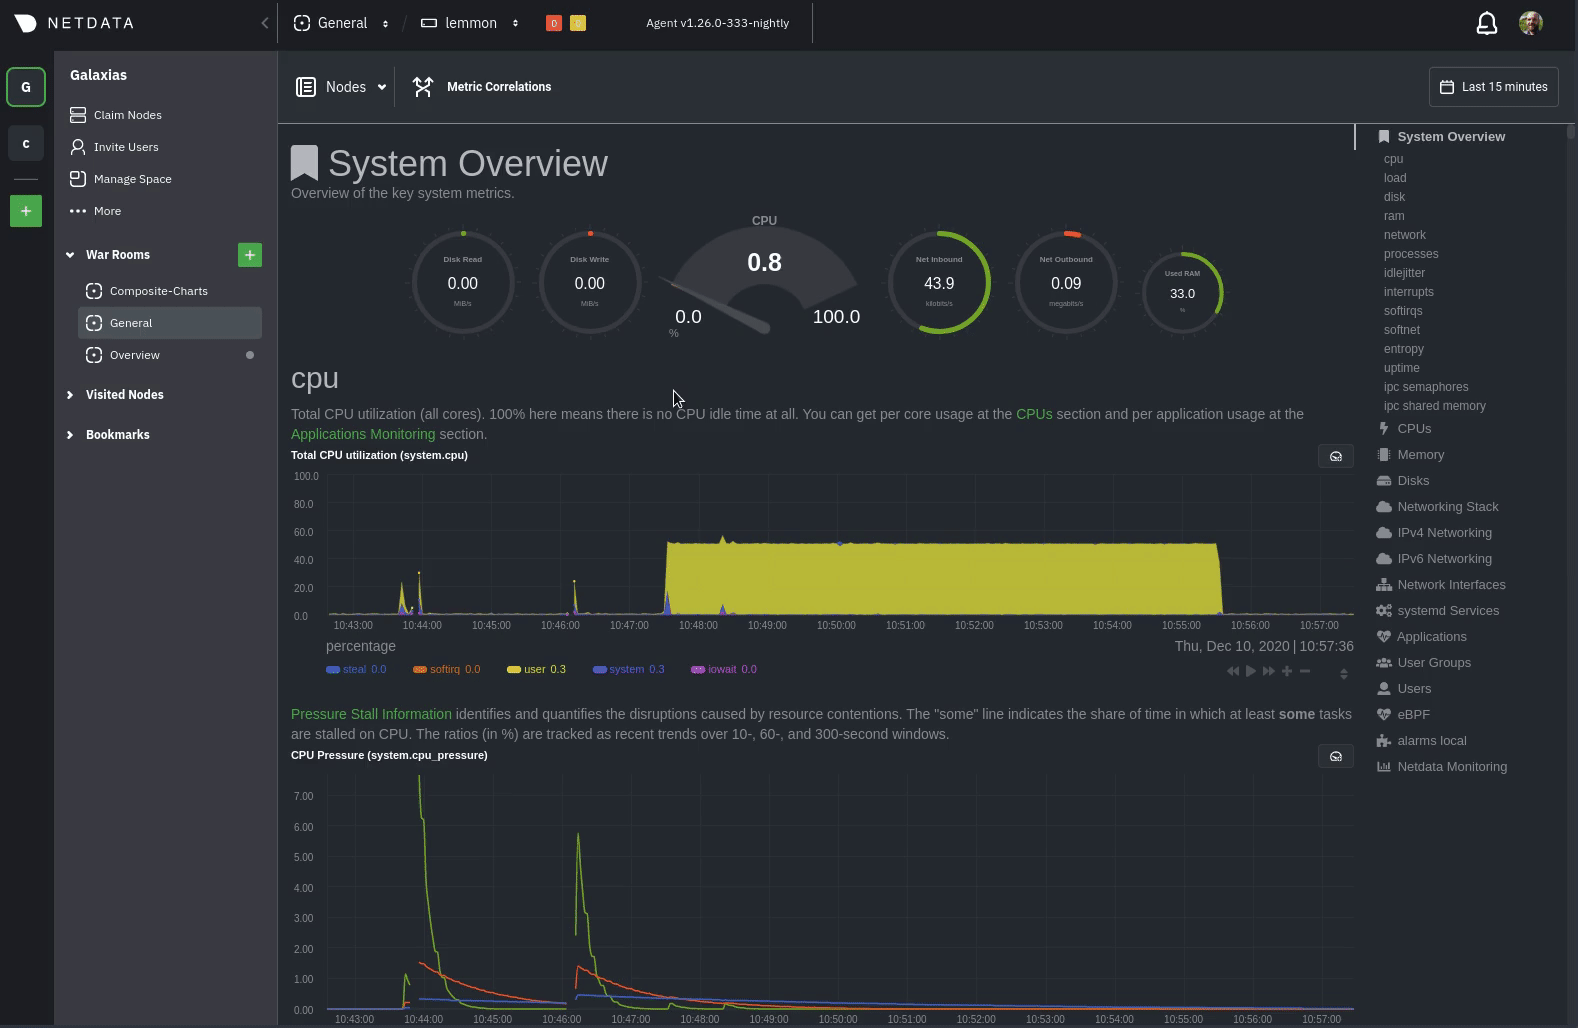 -See the [centralized alarm notifications](https://github.com/netdata/netdata/blob/master/docs/cloud/alerts-notifications/notifications.mdx) +See the [centralized alert notifications](https://github.com/netdata/netdata/blob/master/docs/cloud/alerts-notifications/notifications.md) reference doc for further details about what information is conveyed in an email notification, flood protection, and more. @@ -53,7 +51,7 @@ more. The Netdata Agent's [notification system](https://github.com/netdata/netdata/blob/master/health/notifications/README.md) runs on every node and dispatches notifications based on configured endpoints and roles. You can enable multiple endpoints on any one node _and_ use Agent -notifications in parallel with centralized alarm notifications in Netdata Cloud. +notifications in parallel with centralized alert notifications in Netdata Cloud. > ❗ If you want to enable notifications from multiple nodes in your infrastructure, each running the Netdata Agent, you > must configure each node individually. @@ -70,7 +68,6 @@ notification platform. - [**Dynatrace**](https://github.com/netdata/netdata/blob/master/health/notifications/dynatrace/README.md) - [**Email**](https://github.com/netdata/netdata/blob/master/health/notifications/email/README.md) - [**Flock**](https://github.com/netdata/netdata/blob/master/health/notifications/flock/README.md) -- [**Google Hangouts**](https://github.com/netdata/netdata/blob/master/health/notifications/hangouts/README.md) - [**Gotify**](https://github.com/netdata/netdata/blob/master/health/notifications/gotify/README.md) - [**IRC**](https://github.com/netdata/netdata/blob/master/health/notifications/irc/README.md) - [**Kavenegar**](https://github.com/netdata/netdata/blob/master/health/notifications/kavenegar/README.md) @@ -91,61 +88,4 @@ notification platform. - [**Telegram**](https://github.com/netdata/netdata/blob/master/health/notifications/telegram/README.md) - [**Twilio**](https://github.com/netdata/netdata/blob/master/health/notifications/twilio/README.md) -### Enable Slack notifications - -First, [Add an incoming webhook](https://slack.com/apps/A0F7XDUAZ-incoming-webhooks) in Slack for the channel where you -want to see alarm notifications from Netdata. Click the green **Add to Slack** button, choose the channel, and click the -**Add Incoming WebHooks Integration** button. - -On the following page, you'll receive a **Webhook URL**. That's what you'll need to configure Netdata, so keep it handy. - -Navigate to your [Netdata config directory](https://github.com/netdata/netdata/blob/master/docs/configure/nodes.md#the-netdata-config-directory) and use `edit-config` to -open the `health_alarm_notify.conf` file: - -```bash -sudo ./edit-config health_alarm_notify.conf -``` - -Look for the `SLACK_WEBHOOK_URL=" "` line and add the incoming webhook URL you got from Slack: - -```conf -SLACK_WEBHOOK_URL="https://hooks.slack.com/services/XXXXXXXXX/XXXXXXXXX/XXXXXXXXXXXX" -``` - -A few lines down, edit the `DEFAULT_RECIPIENT_SLACK` line to contain a single hash `#` character. This instructs Netdata -to send a notification to the channel you configured with the incoming webhook. - -```conf -DEFAULT_RECIPIENT_SLACK="#" -``` - -To test Slack notifications, switch to the Netdata user. - -```bash -sudo su -s /bin/bash netdata -``` - -Next, run the `alarm-notify` script using the `test` option. - -```bash -/usr/libexec/netdata/plugins.d/alarm-notify.sh test -``` - -You should receive three notifications in your Slack channel for each health status change: `WARNING`, `CRITICAL`, and -`CLEAR`. - -See the [Agent Slack notifications](https://github.com/netdata/netdata/blob/master/health/notifications/slack/README.md) doc for more options and information. - -## What's next? - -Now that you have health entities configured to your infrastructure's needs and notifications to inform you of anomalies -or incidents, your health monitoring setup is complete. - -To make your dashboards most useful during root cause analysis, use Netdata's [distributed data -architecture](https://github.com/netdata/netdata/blob/master/docs/store/distributed-data-architecture.md) for the best-in-class performance and scalability. - -### Related reference documentation - -- [Netdata Cloud · Alarm notifications](https://github.com/netdata/netdata/blob/master/docs/cloud/alerts-notifications/notifications.mdx) -- [Netdata Agent · Notifications](https://github.com/netdata/netdata/blob/master/health/notifications/README.md) diff --git a/docs/monitor/view-active-alarms.md b/docs/monitor/view-active-alarms.md index 07c22fe12..cc6a2d3a1 100644 --- a/docs/monitor/view-active-alarms.md +++ b/docs/monitor/view-active-alarms.md @@ -1,45 +1,46 @@ -<!-- -title: "View active health alarms" -description: "View active alarms and their rich data to discover and resolve anomalies and performance issues across your infrastructure." -custom_edit_url: "https://github.com/netdata/netdata/edit/master/docs/monitor/view-active-alarms.md" -sidebar_label: "View active health alarms" -learn_status: "Published" -learn_topic_type: "Concepts" -learn_rel_path: "Operations/Alerts" ---> +# View active alerts -# View active health alarms +Netdata comes with hundreds of pre-configured health alerts designed to notify you when an anomaly or performance issue affects your node or its applications. -Every Netdata Agent comes with hundreds of pre-installed health alarms designed to notify you when an anomaly or -performance issue affects your node or the applications it runs. +From the Alerts tab you can see all the active alerts in your War Room. You will be presented with a table having information about each alert that is in warning and critical state. +You can always sort the table by a certain column by clicking on the name of that column, and use the gear icon on the top right to control which columns are visible at any given time. -## Netdata Cloud +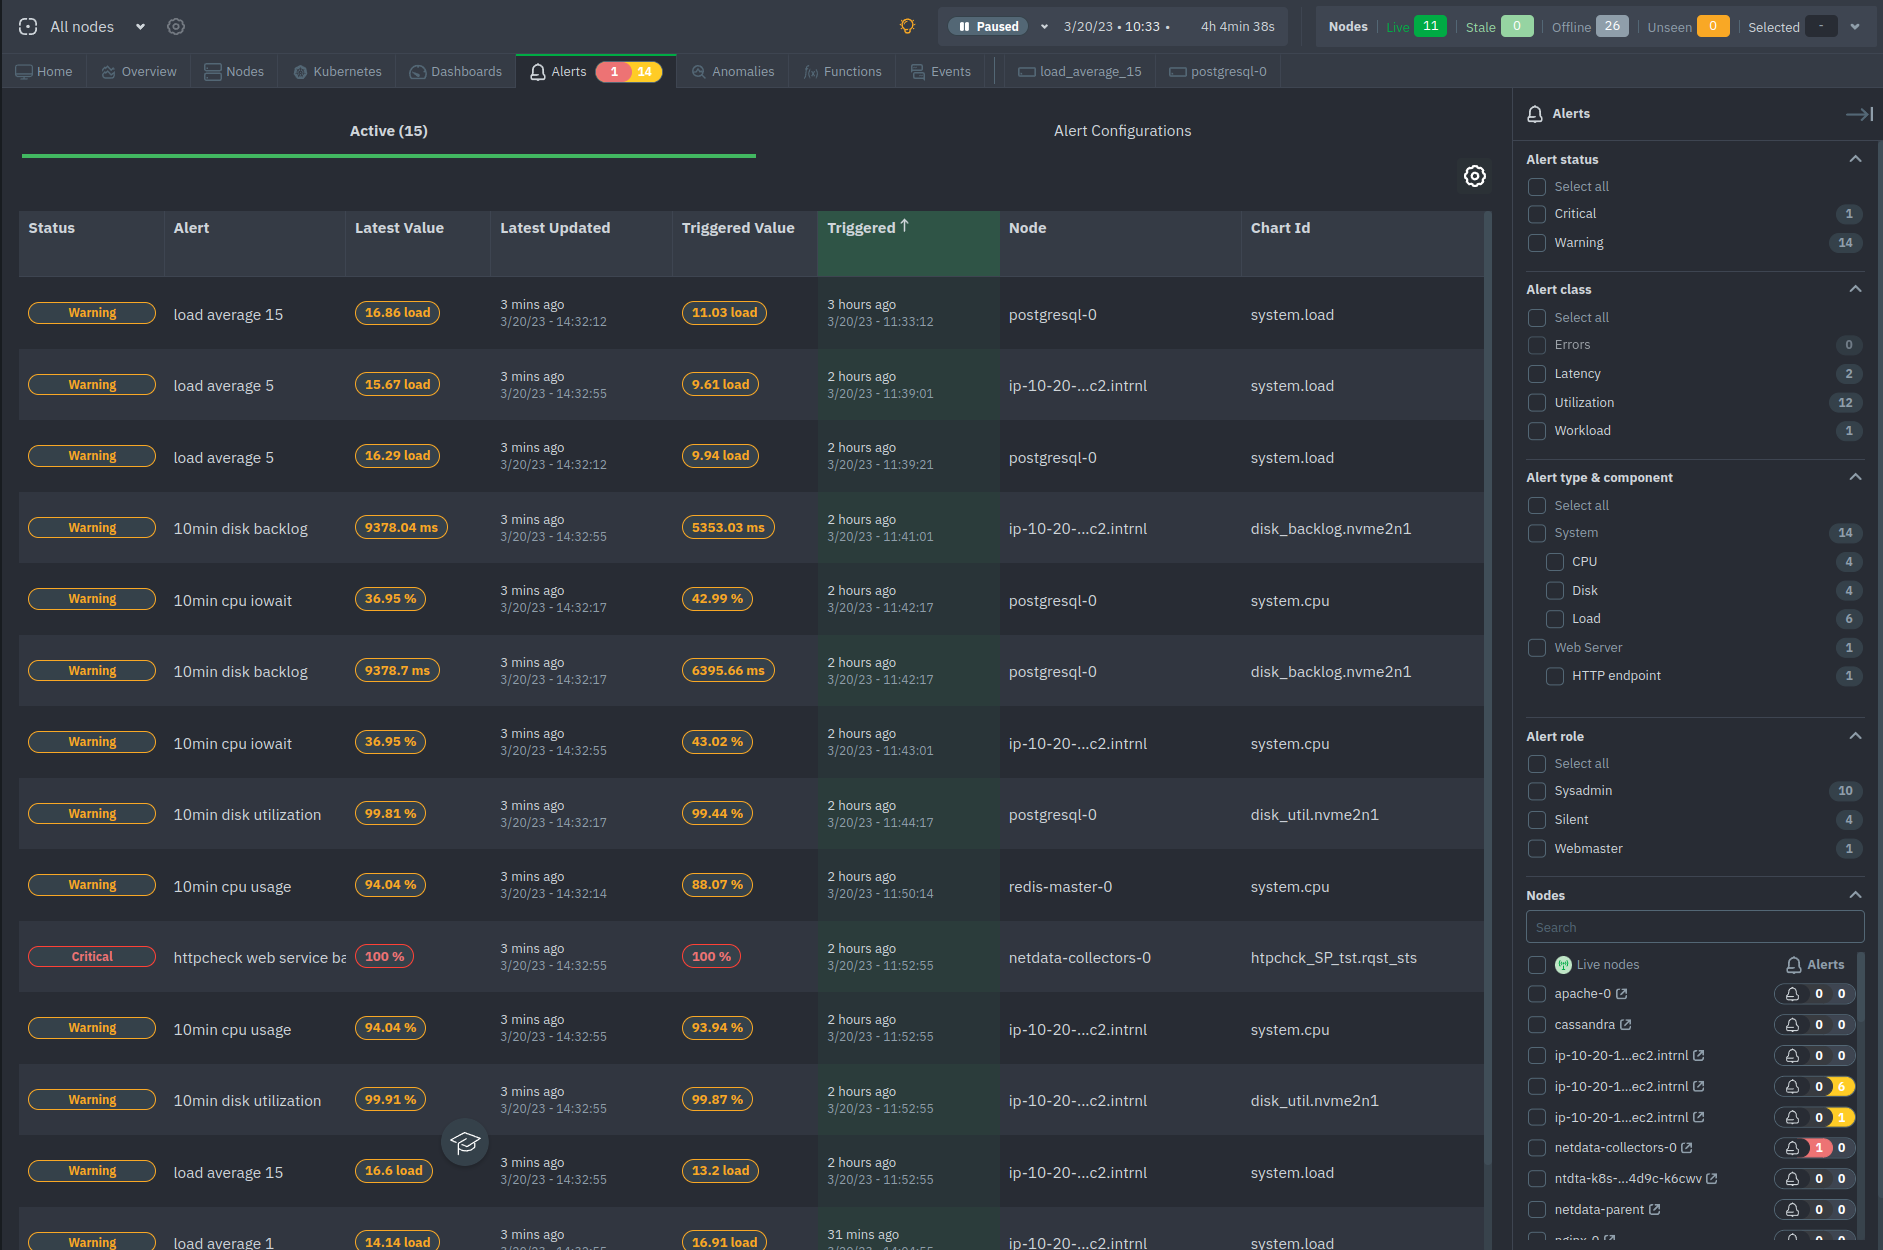 -A War Room's [alarms indicator](https://learn.netdata.cloud/docs/cloud/war-rooms#indicators) displays the number of -active `critical` (red) and `warning` (yellow) alerts for the nodes in this War Room. Click on either the critical or -warning badges to open a pre-filtered modal displaying only those types of [active -alarms](https://github.com/netdata/netdata/blob/master/docs/cloud/alerts-notifications/view-active-alerts.mdx). +## Filter alerts -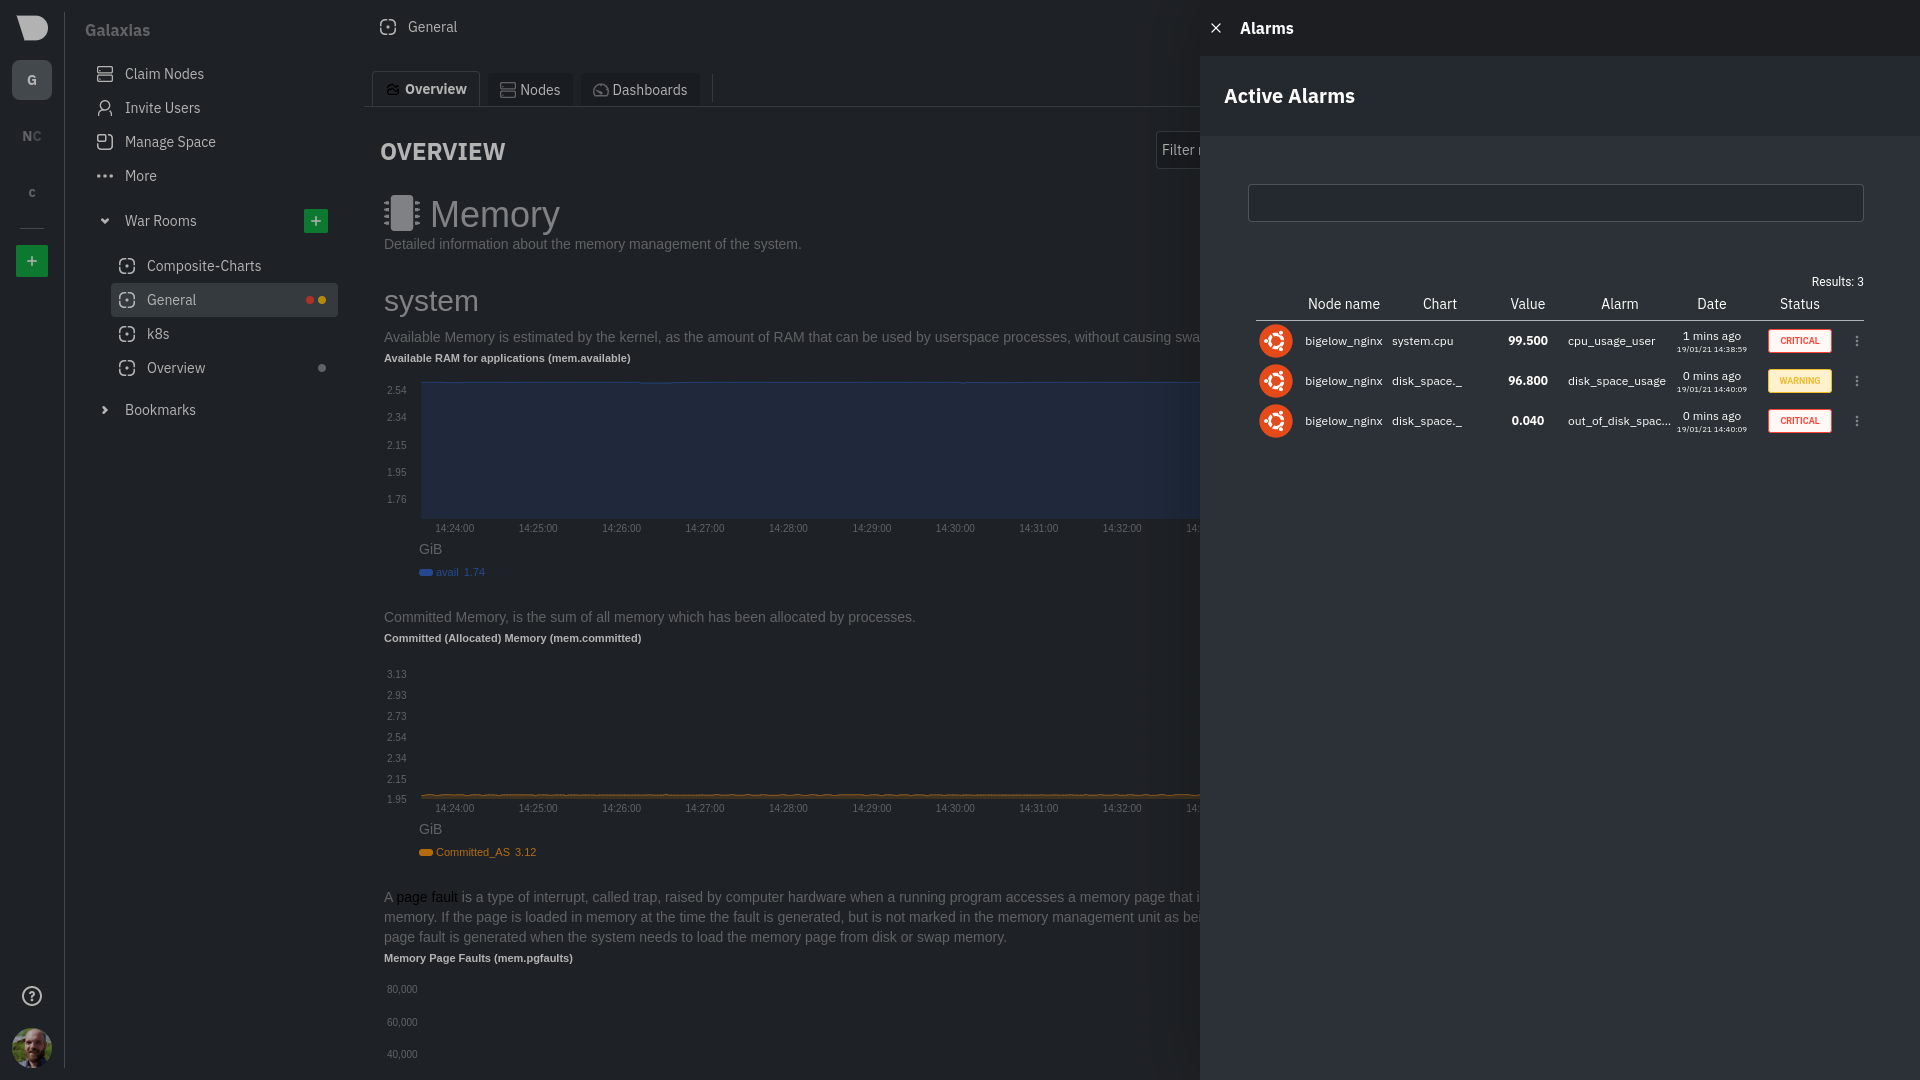 +From this tab, you can also filter alerts with the right hand bar. More specifically you can filter: -The Alarms panel lists all active alarms for nodes within that War Room, and tells you which chart triggered the alarm, -what that chart's current value is, the alarm that triggered it, and when the alarm status first began. +- Alert status + - Filter based on the status of the alerts (e.g. Warning, Critical) +- Alert class + - Filter based on the class of the alert (e.g. Latency, Utilization, Workload etc.) +- Alert type & component + - Filter based on the alert's type (e.g. System, Web Server) and component (e.g. CPU, Disk, Load) +- Alert role + - Filter by the role that the alert is set to notify (e.g. Sysadmin, Webmaster etc.) +- Nodes + - Filter the alerts based on the nodes that are online, next to each node's name you can see how many alerts the node has, "critical" colored in red and "warning" colored in yellow -Use the input field in the Alarms panel to filter active alarms. You can sort by the node's name, alarm, status, chart -that triggered the alarm, or the operating system. Read more about the [filtering -syntax](https://learn.netdata.cloud/docs/cloud/war-rooms#node-filter) to build valuable filters for your infrastructure. +## View alert details -Click on the 3-dot icon (`⋮`) to view active alarm information or navigate directly to the offending chart in that -node's Cloud dashboard with the **Go to chart** button. +By clicking on the name of an entry of the table you can access that alert's details page, providing you with: -The active alarm information gives you details about the alarm that's been triggered. You can see the alarm's -configuration, how it calculates warning or critical alarms, and which configuration file you could edit on that node if -you want to tweak or disable the alarm to better suit your needs. +- Latest and Triggered time values +- The alert's description +- A link to the Community forum's alert page +- The chart at the time frame that the alert was triggered +- The alert's information: Node name, chart ID, type, component and class +- Configuration section +- Instance values - Node Instances -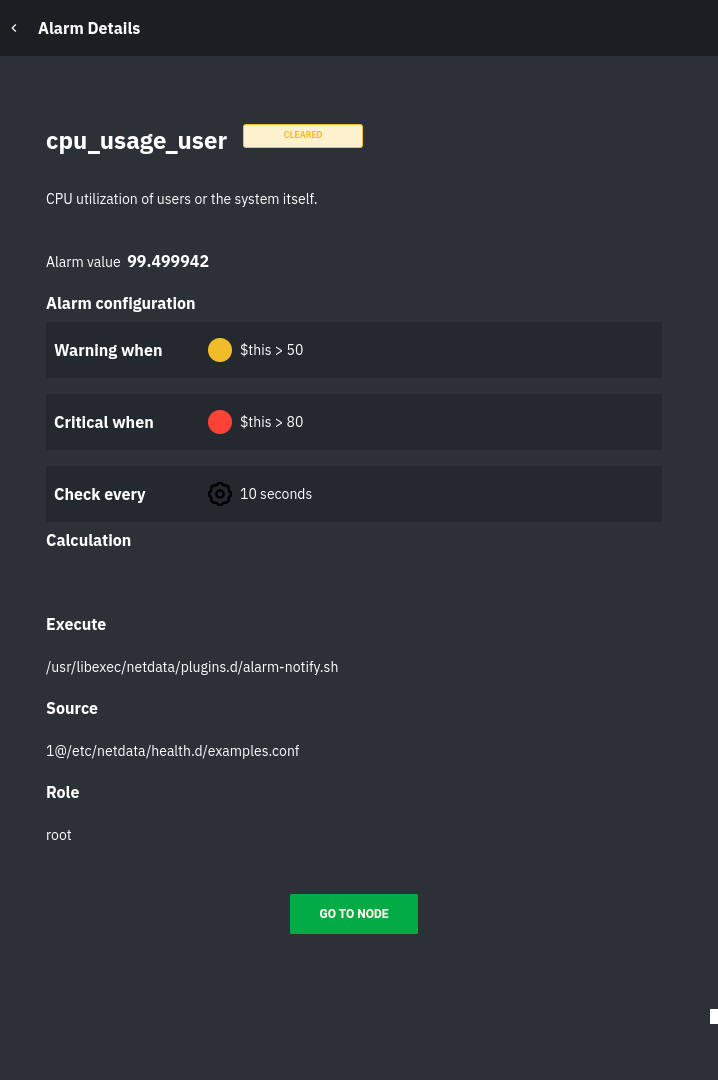 +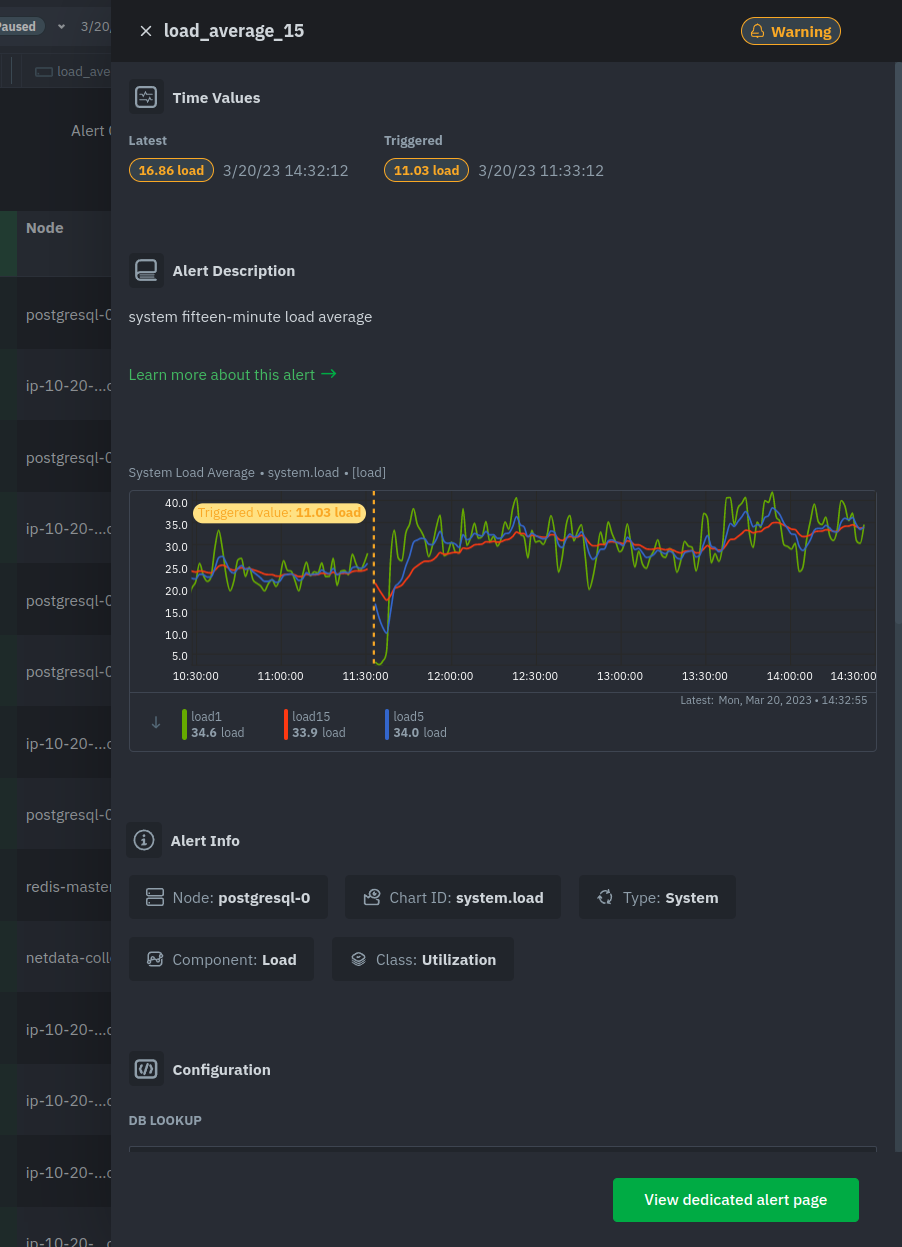 +At the bottom of the panel you can click the green button "View dedicated alert page" to open a [dynamic tab](https://github.com/netdata/netdata/blob/master/docs/quickstart/infrastructure.md#dynamic-tabs) containing all the info for this alert in a tab format, where you can also run correlations and go to the node's chart that raised the particular alert. + +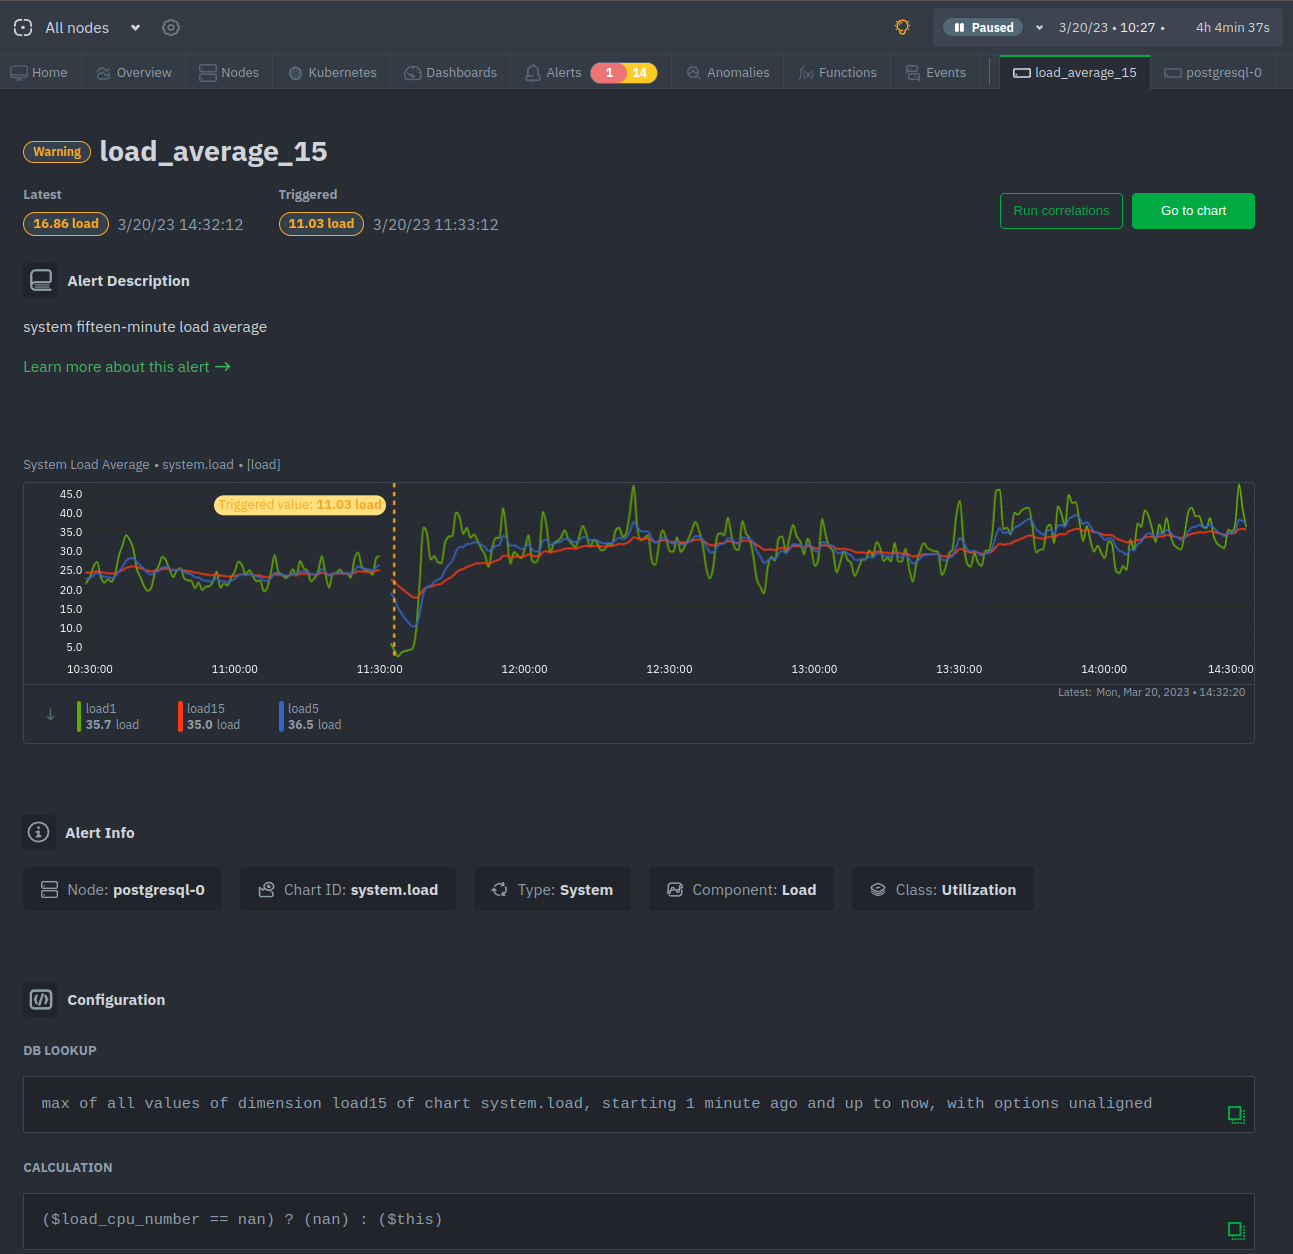 + +<!-- ## Local Netdata Agent dashboard Find the alarms icon . - -## What's next? - -With the information that appears on Netdata Cloud and the local dashboard about active alarms, you can [configure -alarms](https://github.com/netdata/netdata/blob/master/docs/monitor/configure-alarms.md) to match your infrastructure's needs or your team's goals. - -If you're happy with the pre-configured alarms, skip ahead to [enable -notifications](https://github.com/netdata/netdata/blob/master/docs/monitor/enable-notifications.md) to use Netdata Cloud's centralized alarm notifications and/or -per-node notifications to endpoints like Slack, PagerDuty, Twilio, and more. - - +use as a reference to [configure alarms](https://github.com/netdata/netdata/blob/master/health/REFERENCE.md). + --> |