
diff options
Diffstat (limited to 'docs/monitor')
| -rw-r--r-- | docs/monitor/enable-notifications.md | 90 | ||||
| -rw-r--r-- | docs/monitor/view-active-alerts.md | 70 |
2 files changed, 0 insertions, 160 deletions
diff --git a/docs/monitor/enable-notifications.md b/docs/monitor/enable-notifications.md deleted file mode 100644 index 7fec9ed50..000000000 --- a/docs/monitor/enable-notifications.md +++ /dev/null @@ -1,90 +0,0 @@ -<!-- -title: "Alert notifications" -description: "Send Netdata alerts from a centralized place with Netdata Cloud, or configure nodes individually, to enable incident response and faster resolution." -custom_edit_url: "https://github.com/netdata/netdata/edit/master/docs/monitor/enable-notifications.md" -sidebar_label: "Notify" -learn_status: "Published" -learn_rel_path: "Integrations/Notify" ---> - -# Alert notifications - -Netdata offers two ways to receive alert notifications on external platforms. These methods work independently _or_ in -parallel, which means you can enable both at the same time to send alert notifications to any number of endpoints. - -Both methods use a node's health alerts to generate the content of alert notifications. Read our documentation on [configuring alerts](https://github.com/netdata/netdata/blob/master/src/health/REFERENCE.md) to change the preconfigured thresholds or to create tailored alerts for your -infrastructure. - -Netdata Cloud offers [centralized alert notifications](#netdata-cloud) via email, which leverages the health status -information already streamed to Netdata Cloud from connected nodes to send notifications to those who have enabled them. - -The Netdata Agent has a [notification system](#netdata-agent) that supports more than a dozen services, such as email, -Slack, PagerDuty, Twilio, Amazon SNS, Discord, and much more. - -For example, use centralized alert notifications in Netdata Cloud for immediate, zero-configuration alert notifications -for your team, then configure individual nodes send notifications to a PagerDuty endpoint for an automated incident -response process. - -## Netdata Cloud - -Netdata Cloud's [centralized alert -notifications](https://github.com/netdata/netdata/blob/master/docs/cloud/alerts-notifications/notifications.md) is a zero-configuration way to -get notified when an anomaly or incident strikes any node or application in your infrastructure. The advantage of using -centralized alert notifications from Netdata Cloud is that you don't have to worry about configuring each node in your -infrastructure. - -To enable centralized alert notifications for a Space, click on **Manage Space** in the left-hand menu, then click on -the **Notifications** tab. Click the toggle switch next to **E-mail** to enable this notification method. - -Next, enable notifications on a user level by clicking on your profile icon, then **Profile** in the dropdown. The -**Notifications** tab reveals rich management settings, including the ability to enable/disable methods entirely or -choose what types of notifications to receive from each War Room. - - - -See the [centralized alert notifications](https://github.com/netdata/netdata/blob/master/docs/cloud/alerts-notifications/notifications.md) -reference doc for further details about what information is conveyed in an email notification, flood protection, and -more. - -## Netdata Agent - -The Netdata Agent's [notification system](https://github.com/netdata/netdata/blob/master/src/health/notifications/README.md) runs on every node and dispatches -notifications based on configured endpoints and roles. You can enable multiple endpoints on any one node _and_ use Agent -notifications in parallel with centralized alert notifications in Netdata Cloud. - -> ❗ If you want to enable notifications from multiple nodes in your infrastructure, each running the Netdata Agent, you -> must configure each node individually. - -Below, we'll use [Slack notifications](#enable-slack-notifications) as an example of the process of enabling any -notification platform. - -### Supported notification endpoints - -- [**alerta.io**](https://github.com/netdata/netdata/blob/master/src/health/notifications/alerta/README.md) -- [**Amazon SNS**](https://github.com/netdata/netdata/blob/master/src/health/notifications/awssns/README.md) -- [**Custom endpoint**](https://github.com/netdata/netdata/blob/master/src/health/notifications/custom/README.md) -- [**Discord**](https://github.com/netdata/netdata/blob/master/src/health/notifications/discord/README.md) -- [**Dynatrace**](https://github.com/netdata/netdata/blob/master/src/health/notifications/dynatrace/README.md) -- [**Email**](https://github.com/netdata/netdata/blob/master/src/health/notifications/email/README.md) -- [**Flock**](https://github.com/netdata/netdata/blob/master/src/health/notifications/flock/README.md) -- [**Gotify**](https://github.com/netdata/netdata/blob/master/src/health/notifications/gotify/README.md) -- [**IRC**](https://github.com/netdata/netdata/blob/master/src/health/notifications/irc/README.md) -- [**Kavenegar**](https://github.com/netdata/netdata/blob/master/src/health/notifications/kavenegar/README.md) -- [**Matrix**](https://github.com/netdata/netdata/blob/master/src/health/notifications/matrix/README.md) -- [**Messagebird**](https://github.com/netdata/netdata/blob/master/src/health/notifications/messagebird/README.md) -- [**Microsoft Teams**](https://github.com/netdata/netdata/blob/master/src/health/notifications/msteams/README.md) -- [**Netdata Agent dashboard**](https://github.com/netdata/netdata/blob/master/src/health/notifications/web/README.md) -- [**Opsgenie**](https://github.com/netdata/netdata/blob/master/src/health/notifications/opsgenie/README.md) -- [**PagerDuty**](https://github.com/netdata/netdata/blob/master/src/health/notifications/pagerduty/README.md) -- [**Prowl**](https://github.com/netdata/netdata/blob/master/src/health/notifications/prowl/README.md) -- [**PushBullet**](https://github.com/netdata/netdata/blob/master/src/health/notifications/pushbullet/README.md) -- [**PushOver**](https://github.com/netdata/netdata/blob/master/src/health/notifications/pushover/README.md) -- [**Rocket.Chat**](https://github.com/netdata/netdata/blob/master/src/health/notifications/rocketchat/README.md) -- [**Slack**](https://github.com/netdata/netdata/blob/master/src/health/notifications/slack/README.md) -- [**SMS Server Tools 3**](https://github.com/netdata/netdata/blob/master/src/health/notifications/smstools3/README.md) -- [**Syslog**](https://github.com/netdata/netdata/blob/master/src/health/notifications/syslog/README.md) -- [**Telegram**](https://github.com/netdata/netdata/blob/master/src/health/notifications/telegram/README.md) -- [**Twilio**](https://github.com/netdata/netdata/blob/master/src/health/notifications/twilio/README.md) - - diff --git a/docs/monitor/view-active-alerts.md b/docs/monitor/view-active-alerts.md deleted file mode 100644 index 02eed0a84..000000000 --- a/docs/monitor/view-active-alerts.md +++ /dev/null @@ -1,70 +0,0 @@ -# View active alerts - -Netdata comes with hundreds of pre-configured health alerts designed to notify you when an anomaly or performance issue affects your node or its applications. - -From the Alerts tab you can see all the active alerts in your War Room. You will be presented with a table having information about each alert that is in warning and critical state. -You can always sort the table by a certain column by clicking on the name of that column, and use the gear icon on the top right to control which columns are visible at any given time. - -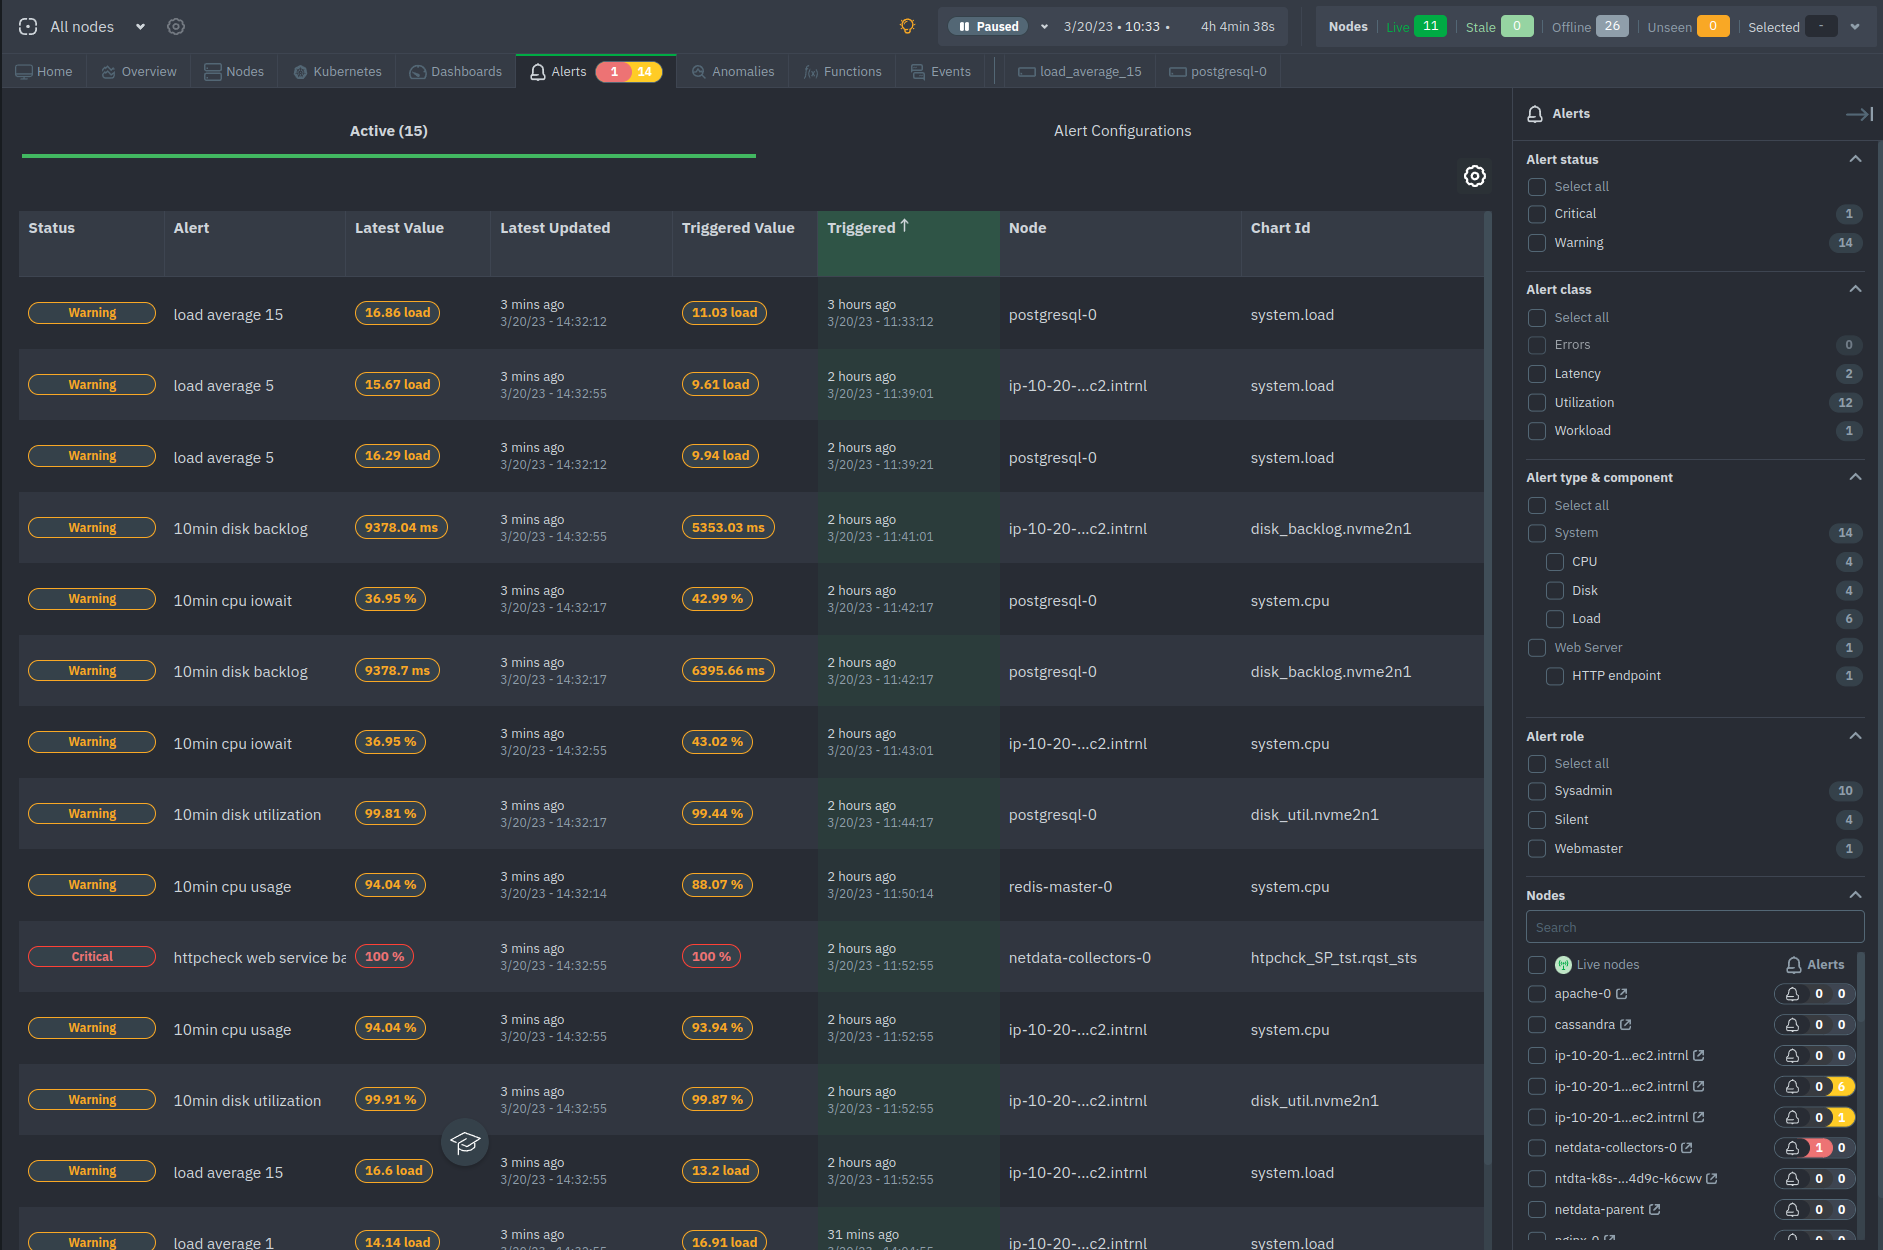 - -## Filter alerts - -From this tab, you can also filter alerts with the right hand bar. More specifically you can filter: - -- Alert status - - Filter based on the status of the alerts (e.g. Warning, Critical) -- Alert class - - Filter based on the class of the alert (e.g. Latency, Utilization, Workload etc.) -- Alert type & component - - Filter based on the alert's type (e.g. System, Web Server) and component (e.g. CPU, Disk, Load) -- Alert role - - Filter by the role that the alert is set to notify (e.g. Sysadmin, Webmaster etc.) -- Nodes - - Filter the alerts based on the nodes that are online, next to each node's name you can see how many alerts the node has, "critical" colored in red and "warning" colored in yellow - -## View alert details - -By clicking on the name of an entry of the table you can access that alert's details page, providing you with: - -- Latest and Triggered time values -- The alert's description -- A link to the Community forum's alert page -- The chart at the time frame that the alert was triggered -- The alert's information: Node name, chart ID, type, component and class -- Configuration section -- Instance values - Node Instances - -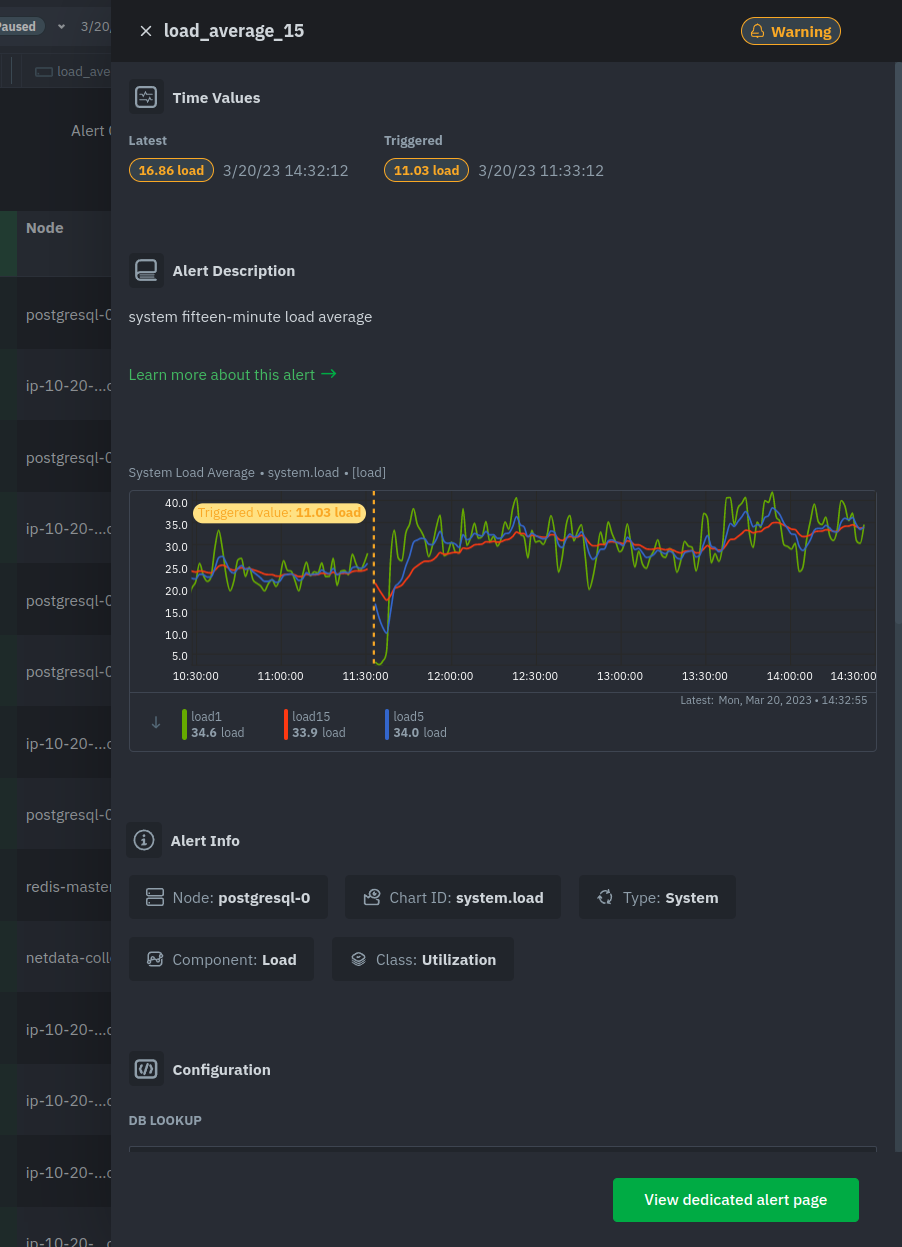 - -At the bottom of the panel you can click the green button "View dedicated alert page" to open a [dynamic tab](https://github.com/netdata/netdata/blob/master/docs/quickstart/infrastructure.md#dynamic-tabs) containing all the info for this alert in a tab format, where you can also run correlations and go to the node's chart that raised the particular alert. - -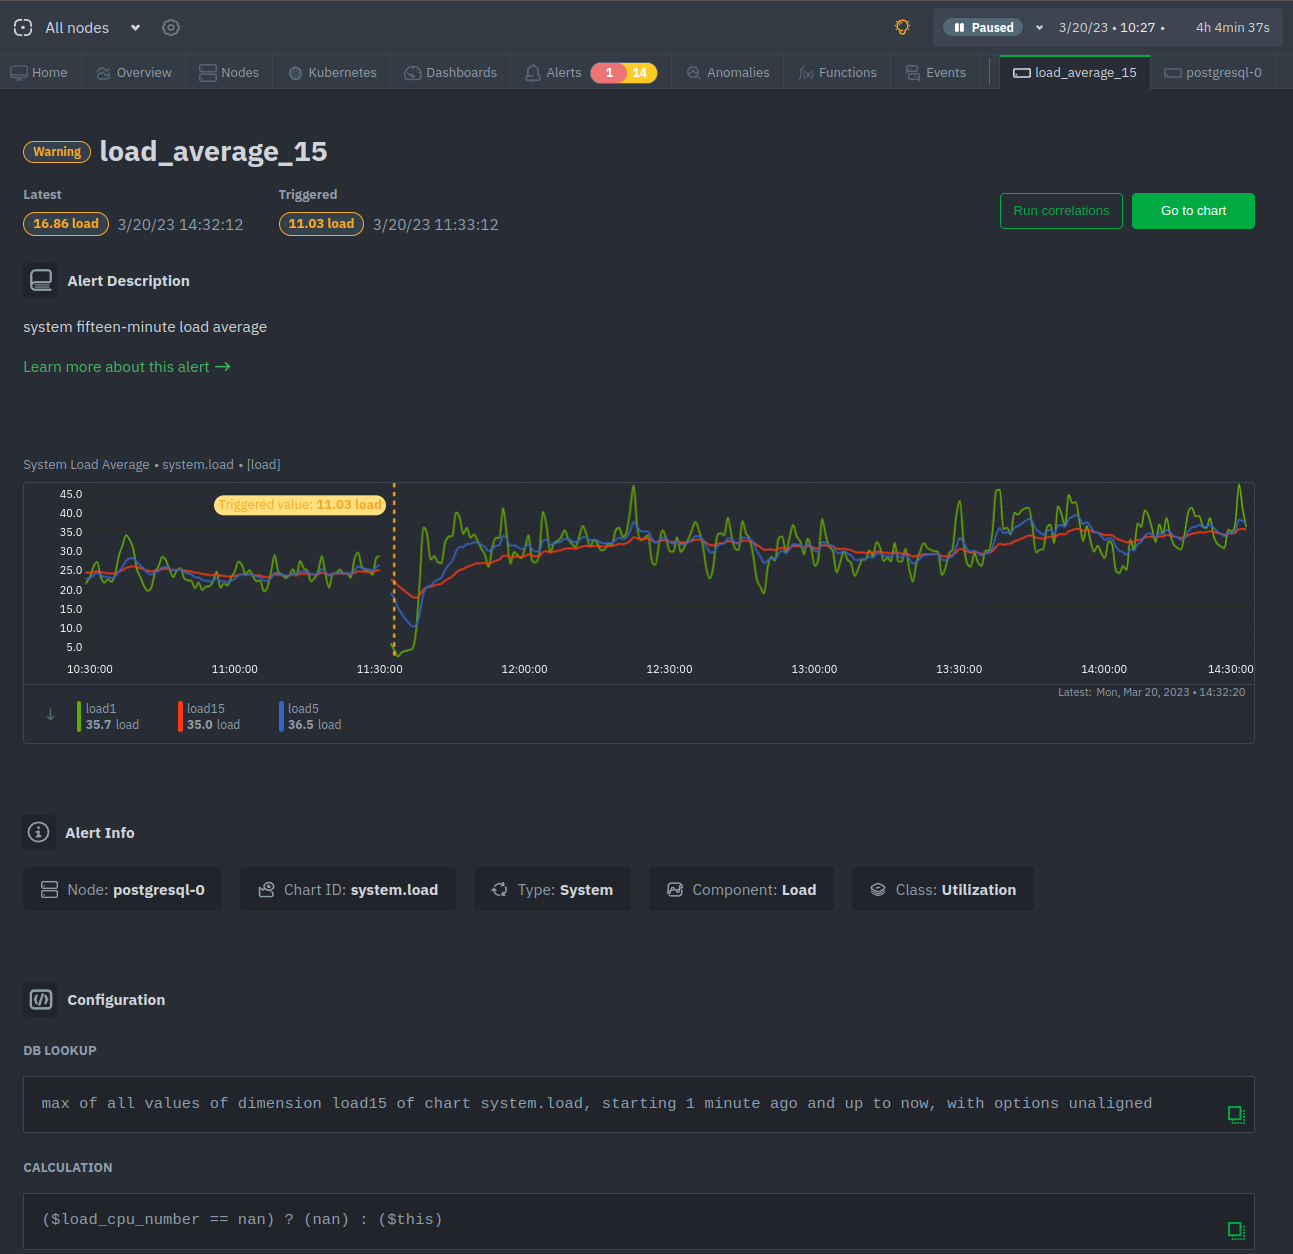 - -<!-- -## Local Netdata Agent dashboard - -Find the alerts icon  -in the top navigation to bring up a modal that shows currently raised alerts, all running alerts, and the alerts log. -Here is an example of a raised `system.cpu` alert, followed by the full list and alert log: - - - -And a static screenshot of the raised CPU alert: - - - -The alert itself is named **system - cpu**, and its context is `system.cpu`. Beneath that is an auto-updating badge that -shows the latest value of the chart that triggered the alert. - -With the three icons beneath that and the **role** designation, you can: - -1. Scroll to the chart associated with this raised alert. -2. Copy a link to the badge to your clipboard. -3. Copy the code to embed the badge onto another web page using an `<embed>` element. - -The table on the right-hand side displays information about the health entity that triggered the alert, which you can -use as a reference to [configure alerts](https://github.com/netdata/netdata/blob/master/src/health/REFERENCE.md). - --> |