
diff options
Diffstat (limited to 'docs/netdata-for-IoT.md')
| -rw-r--r-- | docs/netdata-for-IoT.md | 78 |
1 files changed, 0 insertions, 78 deletions
diff --git a/docs/netdata-for-IoT.md b/docs/netdata-for-IoT.md deleted file mode 100644 index 8dfed21eb..000000000 --- a/docs/netdata-for-IoT.md +++ /dev/null @@ -1,78 +0,0 @@ -<!-- -title: "Netdata for IoT" -custom_edit_url: https://github.com/netdata/netdata/edit/master/docs/netdata-for-IoT.md -sidebar_label: "Netdata for IoT" -learn_status: "Published" -learn_rel_path: "Miscellaneous" ---> - -# Netdata for IoT - - - -> New to Netdata? Check its demo: **<https://my-netdata.io/>** -> ->[](https://registry.my-netdata.io/#netdata_registry) -> [](https://registry.my-netdata.io/#netdata_registry) -> [](https://registry.my-netdata.io/#netdata_registry) -> ->[](https://registry.my-netdata.io/#netdata_registry) -> [](https://registry.my-netdata.io/#netdata_registry) -> [](https://registry.my-netdata.io/#netdata_registry) - ---- - -Netdata is a [very efficient](https://github.com/netdata/netdata/blob/master/docs/guides/configure/performance.md) -server performance monitoring solution. When running in server hardware, it can collect -thousands of system and application metrics **per second** with just 1% CPU utilization of a single core. Its web server -responds to most data requests in about **half a millisecond** making its web dashboards spontaneous, amazingly fast! - -Netdata can also be a very efficient real-time monitoring solution for **IoT devices** (RPIs, routers, media players, -wifi access points, industrial controllers and sensors of all kinds). Netdata will generally run everywhere a Linux -kernel runs (and it is glibc and [musl-libc](https://www.musl-libc.org/) friendly). - -You can use it as both a data collection agent (where you pull data using its API), for embedding its charts on other -web pages / consoles, but also for accessing it directly with your browser to view its dashboard. - -The Netdata web API already provides **reduce** functions allowing it to report **average** and **max** for any -timeframe. It can also respond in many formats including JSON, JSONP, CSV, HTML. Its API is also a **google charts** -provider so it can directly be used by google sheets, google charts, google widgets. - - - -Although Netdata has been significantly optimized to lower the CPU and RAM resources it consumes, the plethora of data -collection plugins may be inappropriate for weak IoT devices. Please follow -the [Netdata Agent performance guide](https://github.com/netdata/netdata/blob/master/docs/guides/configure/performance.md) - -## Monitoring RPi temperature - -The python version of the sensors plugin uses `lm-sensors`. Unfortunately the temperature reading of RPi are not -supported by `lm-sensors`. - -Netdata also has a bash version of the sensors plugin that can read RPi temperatures. It is disabled by default to avoid -the conflicts with the python version. - -To enable it, run: - -```bash -cd /etc/netdata # Replace this path with your Netdata config directory -sudo ./edit-config charts.d.conf -``` - -and uncomment this line: - -```sh -sensors=force -``` - -Then restart Netdata. You will get this: - -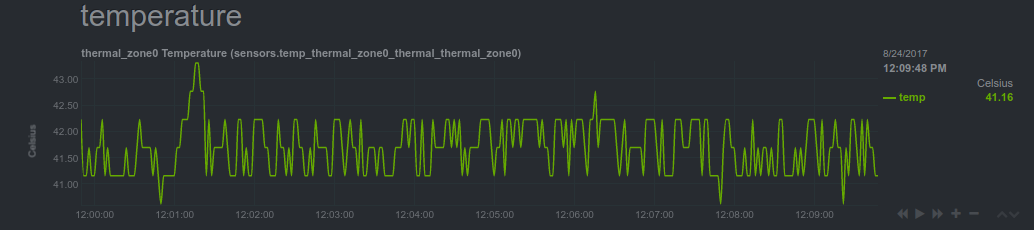 - - |