
diff options
| author | Daniel Baumann <daniel.baumann@progress-linux.org> | 2024-05-18 02:49:50 +0000 |
|---|---|---|
| committer | Daniel Baumann <daniel.baumann@progress-linux.org> | 2024-05-18 02:49:50 +0000 |
| commit | 9835e2ae736235810b4ea1c162ca5e65c547e770 (patch) | |
| tree | 3fcebf40ed70e581d776a8a4c65923e8ec20e026 /vendor/plotters | |
| parent | Releasing progress-linux version 1.70.0+dfsg2-1~progress7.99u1. (diff) | |
| download | rustc-9835e2ae736235810b4ea1c162ca5e65c547e770.tar.xz rustc-9835e2ae736235810b4ea1c162ca5e65c547e770.zip | |
Merging upstream version 1.71.1+dfsg1.
Signed-off-by: Daniel Baumann <daniel.baumann@progress-linux.org>
Diffstat (limited to 'vendor/plotters')
108 files changed, 20900 insertions, 0 deletions
diff --git a/vendor/plotters/.cargo-checksum.json b/vendor/plotters/.cargo-checksum.json new file mode 100644 index 000000000..ace0845e4 --- /dev/null +++ b/vendor/plotters/.cargo-checksum.json @@ -0,0 +1 @@ +{"files":{"Cargo.lock":"cdd445ef4fdcd729b258bedbdd92b728f1fc04571982cf7398b93ec0fe674fad","Cargo.toml":"44c533a32176a6cdef9d848e75b45864b568e26aedf78daece29695156b60b74","README.md":"87ce13e9d69d0020e98b6af03c1e09cfb370565eb938d0daa00357ac95d942a5","benches/benches/data.rs":"ee565bcc25fa39184db0792a23515ee2b226d630e6285cd12dcda3ddb2995501","benches/benches/mod.rs":"9a70c8cb5d5b3ae43dd43dfb8d60a346bd54d9d62462038e870a06fca4517d02","benches/main.rs":"0114d1bbc994f078cfbb6771a5834e5e104a26c8ffa081ae28e9de61a0ef0694","clippy.toml":"411cc9d76101033c506fa429c78180f8be88257ba9f30266b302363c9afb00f2","examples/3d-plot.rs":"76968c425e3675bd628edc16eb55fdfdd6a99ca926bd580732fbc94fe5128550","examples/3d-plot2.rs":"b59b804e878d70d55e8b83ec023a297bdea3ead3de900894b1c057f1d623f66c","examples/README.md":"bf18dae91d0706d8d1267da2de8c728a8d32d01b143b0e5d491a21b0abe5290b","examples/animation.rs":"e23a612c33b0170c4a0c9cc9384a2149592f3e5770e87522b02296044e6c1acf","examples/area-chart.rs":"f954fecdae673ea71afd1734616e461303881e8f63339b62c317320ae98debba","examples/blit-bitmap.rs":"4be6c07c311224c14ef317dd91ce7d4c28c004ba111cd3d69315256d7ee662d6","examples/boxplot.rs":"4e330279a946b2ea19107e9c1fd26d31fe7661eac8e709f05dc95e2c963ba715","examples/chart.rs":"0e0cdcc8e58c1a32fb74e0466a17436c341c1003f98bbab40e7264020535edcb","examples/console.rs":"67aab36d675c230abfd969609c033f781dc15ffac03c87959b3a08a799747f38","examples/customized_coord.rs":"b915454e5846263924c1c7bc25de86d2dde2bf2068536b236d300dc7bcc5b63a","examples/errorbar.rs":"3568ac7878752a04e03e97b78b45b65919bfcf6f411256362453be88fdd52187","examples/full_palette.rs":"f5a9d7174dd9f75cbc3c49fae84578227740c53955a18141099c38a9bbc38a64","examples/histogram.rs":"6e52c83983f19f2a72973d80fd468a51e1e122723b577c12c1d29b952f9d42f6","examples/mandelbrot.rs":"488f28f682e8a0a94d0dc9dc46f29b199f644c665273c793165a620e30eb8885","examples/matshow.rs":"c70c9403fa5fff84cd9394985d12c51005627439140084504328d46ec48d58fb","examples/nested_coord.rs":"94939893618f102912b23af23575922d33596e4020de56668d3c539f48e62d05","examples/normal-dist.rs":"d6bfc1e83068cb869916d9e494807f08286c3ea079962bad508e82a30823d32c","examples/normal-dist2.rs":"f6df7a69b23c24b669edebf6c116c1d4786f6dc8bce5df3e078b951732da2508","examples/pie.rs":"48ad7d49d9bfc401b44df04713c5e2a63fa444c9a75dc7ac89423387087c4989","examples/relative_size.rs":"456b8932bac0b9f265d98c55d25302aa29e410035554683a2100fa7d97653425","examples/sierpinski.rs":"519b31a62bdd8c3ba34ff9066ac72b9e94b39dae6f9a988eec4377f78f598378","examples/slc-temp.rs":"6af56c96687daaf4397cd4c0c7970e8dcb2936bb755a1d707e2bcc95e0d43b7a","examples/snowflake.rs":"7bfccf5824bffefb944b0f4156aa9fb96275c25eeb83a621615db3542bafcb37","examples/stock.rs":"f5bf468038380d0caf45f6fe3d3a5478ecbe35bf86effae5a970f95ca3878444","examples/tick_control.rs":"8bed1adb4c89cd6660691baed73c0b7b2ec68bb0dea4460fb017aaa3b40a747b","examples/two-scales.rs":"fff9d82bc2384ea7eda6ce50b8c55b46a2ba6467600e2a133325f6e6db94ad20","src/chart/axes3d.rs":"aca78a20166747c02d382e3d61c1f5707c080c1e19e51a06d532078ee6b51514","src/chart/builder.rs":"9c9432fc8e60401f2ab7157a61509397a9ab9c78f29f07b671f69545771580c1","src/chart/context.rs":"c05b89193ead37ddfed12902fd470979df2ac6664d30eaf6f68ad2456eb1ab3c","src/chart/context/cartesian2d/draw_impl.rs":"75a40eb43d5b09bf4d9d44b9e6f70035cf1ac9bb40d562d2ffb2f6288dab1aba","src/chart/context/cartesian2d/mod.rs":"276262ab8f284ffa8174513631601b26e4836f7e77b3ff420075da079e6d2466","src/chart/context/cartesian3d/draw_impl.rs":"19b8c6ee6012a7a18a713394a3af1f56388d672051fa85d0e3a76aca8c8cbdd7","src/chart/context/cartesian3d/mod.rs":"d19191831ada5913903ac4306874cb8b3ee60f4db2d945dc4ac209443d585d11","src/chart/dual_coord.rs":"4235845526bbb10d701fa5428f3d1b9b3f866a5e88f1219fb25b4f0edbdb0d33","src/chart/mesh.rs":"27ce1c614530aa76a2b1ce0f82c26ac10f4f914a07cdc1a9abefb285c7327e2b","src/chart/mod.rs":"c8856d1f40a99bcb5612625f2d0c05f0541730e0f966bed5e8e6bb98dbe0a230","src/chart/series.rs":"b6ddf4861cecc4c2b2ecef45f0515d80be6ec53a3a35677e9e3c8d7609dcab7e","src/chart/state.rs":"7b85c21a0c4dd5cb664d4ca53e55624632b3c3063a8608cd596f0944b98d8372","src/coord/mod.rs":"e1b634aaaec3123f53879fca2b5e0ba5cc79dffa8a1c9ff267f8b4eb77e82e62","src/coord/ranged1d/combinators/ckps.rs":"570a479e1108d1aba51434a840a9d23d41b01876210ee690ac8b1402ef6fc39a","src/coord/ranged1d/combinators/group_by.rs":"7bb131582cfc6c435e7ab7213ad1b854cce6cf33893f2c75580651a59ce86ac5","src/coord/ranged1d/combinators/linspace.rs":"743d1ea2acc5a0e35eccc3be86e2c1ef6ab2cbbad76074ebce9b542c49061404","src/coord/ranged1d/combinators/logarithmic.rs":"d06f09ef29d43abf8b266281a34e8e37e8b49e0ef23ef187552027a0114df108","src/coord/ranged1d/combinators/mod.rs":"866be8da7f0d96ca25f2cdca8c1fe4c67cc695eb7dac8b499b03f62bd9490c9d","src/coord/ranged1d/combinators/nested.rs":"4c1437c85529e6a8fb1a00fc3e2c658de1683a69da8b988ac0e23e9323079131","src/coord/ranged1d/combinators/partial_axis.rs":"53622acc763437aa08b91ec5c3d58a891a08fcd3783fa79ed4e0c8cf3a7c74fe","src/coord/ranged1d/discrete.rs":"ad4d1cf4180db9d6694b945136bbea91afdba756b304317b4bab9188b1a534fb","src/coord/ranged1d/mod.rs":"af0ba484382cbf651930ed5e9f8625f98056289ad6aafbde903bc728f6ce4a69","src/coord/ranged1d/types/datetime.rs":"09156d1f40e63ae9c9643dc329a461791e8e3429b54b9194face60d5bf29c831","src/coord/ranged1d/types/mod.rs":"c8ceee19ffcc1b971d4265507f9d6d7feeeab611fa8bb414ad1195982c1f0274","src/coord/ranged1d/types/numeric.rs":"034f620b6776dfd914538e0eee385aefbd641c770c4b51bfe5c79868f38df622","src/coord/ranged1d/types/slice.rs":"9a5b5bf911b43cbf888bac134dc9b6995f3c8690d18416c6e7bb122793d9cb2a","src/coord/ranged2d/cartesian.rs":"74f24f20eeb1e57af3c2dc0a2436891794fd7cde26cec1cf58ece76e0fd65d6b","src/coord/ranged2d/mod.rs":"8973be763af6d2652745c94648bb1bae66866938919121779b907e92d16e4916","src/coord/ranged3d/cartesian3d.rs":"70a54dc5441d8042d528f695df140c8a05c7d111f88c31415de99df2ce969ac9","src/coord/ranged3d/mod.rs":"32dc18d0e2b1c76f7946e746442551698814278ff58dcf12b8c6a787aa66fbc5","src/coord/ranged3d/projection.rs":"635aa97a050059035fe227a7a49bcec1c1c6b7b66a7a9ea3623b0c81c289c02d","src/coord/translate.rs":"9cf8c1a453e17468245e15258cb0c2e85a00e8ac0e9e58d489ee3e7f64fd5562","src/data/data_range.rs":"f6a92dd1318db98e3d4bb210d9860bcb035a917a01b768253116f12a36027e14","src/data/float.rs":"6882eb368b04fa8029f9d5c06f8068f4823f3688e93d582568887cfb48323acb","src/data/mod.rs":"01a20b9c818255f20bca6d126e92036c5edf847267f84ea14227316fde02a810","src/data/quartiles.rs":"3778d853821ff4d4c42aa4d13f3e7f4c388e6ae69b5ab0850edbda444ae49e0f","src/drawing/area.rs":"9977bb61ce035fbd8cd4b59857a7266c0526643eacf16d6029df40dee2f42fdd","src/drawing/backend_impl/mocked.rs":"6a109adaab3ab4853dfb2107fe63eb36f27fddf8adae671e4474805bf6d71678","src/drawing/backend_impl/mod.rs":"fb1644e77c523165ce27335f87b112b5e15ca8676abdbeb4ed8b4adcef8f3c1d","src/drawing/mod.rs":"b9b8c7063216ff1cfb900052cf4e6755e52d6366f67f31d08417bc0516824f57","src/element/basic_shapes.rs":"778ab9b71b1ba98c0346105b9e3ffbeb84adfa47f90ab6bd594d1b1de4d8a666","src/element/basic_shapes_3d.rs":"2c04f453b1b0960c6d355d7d1154f66aae42df3370bbce5b9065b5cb30f6e9f0","src/element/boxplot.rs":"c7ddce762c7d3b12e8e819601c900363b301c9cade3e985dbd839b68f41d7010","src/element/candlestick.rs":"38c35a8711062e44dfc5ed38f9f1ef45f9d978fc7f0db0d3297fbe1a84480ae2","src/element/composable.rs":"4656f8d94290767096871eb06bad0c6992a0daf32f8a8f9600b64ae90cf45517","src/element/dynelem.rs":"951211ba906425f25e96510b8b45c6a0bb1212e9d1b7a045f9144d520c832c0d","src/element/errorbar.rs":"087d79a464221f00456a8372dc7f9c8cfb7b1d247540dcb28db781ef62b1ba38","src/element/image.rs":"32afe849ee1ef9ad4e485c682c93f12feb20d0df859ea6be09d5170d331f7f5f","src/element/mod.rs":"3c538115334a4c03edf40efd3f857e8ce4189b6e72e69abfd3bc2f57410dd899","src/element/pie.rs":"9f40161545bc6ac8097e354a17c3f9e707b6caadf63f6b32b66b92dbdd5199c0","src/element/points.rs":"bafb67d71c43b8959905fe3236274f1cb0defe5254cc267d34d222e11a6ded53","src/element/text.rs":"7a924d38f475579b1632a37950c71220f921330c1f3c649e6b84c73a2a80637a","src/evcxr.rs":"185ec947e019d1874735f33ab0534b63f47c31ebc13bb801fa006916f6e39179","src/lib.rs":"f760f56da591c2fe9b70ed93b4480d7970a2913f35cd12ff6c0f9c1a9db53791","src/series/area_series.rs":"85336f046bc5bd5ab18252ff91288057d6783f8ecf51e226f447646a16815cfa","src/series/histogram.rs":"62b35bfa9b9e541d8b5246b05f8a20ba5659a8f7daa138cb3ff294ce0ce7a2ae","src/series/line_series.rs":"a8d27d4df8b920b7004554e5507dfe69dcd629a15c2d451a04a8f6d07eb5bbe3","src/series/mod.rs":"387d280583147ae79ad134199ac6ca7a0dbba46bba14fbf361eea7867e6a3263","src/series/point_series.rs":"cf056e06f1e740ea724d8bcadbe373cb49d93a02beef14064fe550e8ef1f3636","src/series/surface.rs":"001701ebf777eca631c9738db7e8262860f87686c5f3fd4f5c35c79babf37d97","src/style/color.rs":"6026e93bd93a84045e073340aca685167ad12067901169347e060a6139c02417","src/style/colors/full_palette.rs":"395e8b82f79156f24c459195aba417f9f8fbe8624405900c435bc2ed3f107c37","src/style/colors/mod.rs":"934714cdc192029c447f48cb667f6a301a29ed7e0c1031b65eb7fe6432c433ef","src/style/font/font_desc.rs":"b4e1741ac2f04578a6c787004914e1e323cd237824c56b6e499bf3b2a542dee4","src/style/font/mod.rs":"da7213df6c22248f65480d43c2c8c6d94f3a6b9091af78bd8bf5c25789864350","src/style/font/naive.rs":"7e48b31d788b76b7e1aa6924b05181f68ce7e5b24aa28dfd9d72dace0cab4202","src/style/font/ttf.rs":"ccbe8eb961f01b6287f9982ed9459111d84ced87cc90c61cceb6ae3773ae3dfb","src/style/font/web.rs":"28f8c20d816a4b915682cfc671fdf6391956045e23f768443f80dc61dc0b2d01","src/style/mod.rs":"bec830ef90ced85cf4f9fd3d4ef89f6b2dff4f5f886eed3631735a49a1021545","src/style/palette.rs":"a89c9739c62dd310ad4c70dee192558a5b37294b75747f084a1d2dacbd6e5224","src/style/shape.rs":"a7b729684f3121c88ebe597df2eea0c601b7ae8fa80b9d462adb82e7f99d6185","src/style/size.rs":"c570b18b04d1fcdbba847d20ec09e4086ba34e357495398cb0efb1045ee8912b","src/style/text.rs":"d35ff6b0a998584d52c983d8a21b3f2a9c2977961f41e40af5c25c42c8187e8a","src/test.rs":"09f7685d7c1daed2966a476be0eca093c8271bfb9664fad8166a89e7958d5736"},"package":"2538b639e642295546c50fcd545198c9d64ee2a38620a628724a3b266d5fbf97"}
\ No newline at end of file diff --git a/vendor/plotters/Cargo.lock b/vendor/plotters/Cargo.lock new file mode 100644 index 000000000..66be7f6c8 --- /dev/null +++ b/vendor/plotters/Cargo.lock @@ -0,0 +1,1262 @@ +# This file is automatically @generated by Cargo. +# It is not intended for manual editing. +version = 3 + +[[package]] +name = "adler" +version = "1.0.2" +source = "registry+https://github.com/rust-lang/crates.io-index" +checksum = "f26201604c87b1e01bd3d98f8d5d9a8fcbb815e8cedb41ffccbeb4bf593a35fe" + +[[package]] +name = "android_system_properties" +version = "0.1.5" +source = "registry+https://github.com/rust-lang/crates.io-index" +checksum = "819e7219dbd41043ac279b19830f2efc897156490d7fd6ea916720117ee66311" +dependencies = [ + "libc", +] + +[[package]] +name = "atty" +version = "0.2.14" +source = "registry+https://github.com/rust-lang/crates.io-index" +checksum = "d9b39be18770d11421cdb1b9947a45dd3f37e93092cbf377614828a319d5fee8" +dependencies = [ + "hermit-abi", + "libc", + "winapi", +] + +[[package]] +name = "autocfg" +version = "1.1.0" +source = "registry+https://github.com/rust-lang/crates.io-index" +checksum = "d468802bab17cbc0cc575e9b053f41e72aa36bfa6b7f55e3529ffa43161b97fa" + +[[package]] +name = "bitflags" +version = "1.3.2" +source = "registry+https://github.com/rust-lang/crates.io-index" +checksum = "bef38d45163c2f1dde094a7dfd33ccf595c92905c8f8f4fdc18d06fb1037718a" + +[[package]] +name = "bstr" +version = "0.2.17" +source = "registry+https://github.com/rust-lang/crates.io-index" +checksum = "ba3569f383e8f1598449f1a423e72e99569137b47740b1da11ef19af3d5c3223" +dependencies = [ + "lazy_static", + "memchr", + "regex-automata", + "serde", +] + +[[package]] +name = "bumpalo" +version = "3.11.0" +source = "registry+https://github.com/rust-lang/crates.io-index" +checksum = "c1ad822118d20d2c234f427000d5acc36eabe1e29a348c89b63dd60b13f28e5d" + +[[package]] +name = "bytemuck" +version = "1.12.1" +source = "registry+https://github.com/rust-lang/crates.io-index" +checksum = "2f5715e491b5a1598fc2bef5a606847b5dc1d48ea625bd3c02c00de8285591da" + +[[package]] +name = "byteorder" +version = "1.4.3" +source = "registry+https://github.com/rust-lang/crates.io-index" +checksum = "14c189c53d098945499cdfa7ecc63567cf3886b3332b312a5b4585d8d3a6a610" + +[[package]] +name = "cast" +version = "0.3.0" +source = "registry+https://github.com/rust-lang/crates.io-index" +checksum = "37b2a672a2cb129a2e41c10b1224bb368f9f37a2b16b612598138befd7b37eb5" + +[[package]] +name = "cc" +version = "1.0.73" +source = "registry+https://github.com/rust-lang/crates.io-index" +checksum = "2fff2a6927b3bb87f9595d67196a70493f627687a71d87a0d692242c33f58c11" + +[[package]] +name = "cfg-if" +version = "1.0.0" +source = "registry+https://github.com/rust-lang/crates.io-index" +checksum = "baf1de4339761588bc0619e3cbc0120ee582ebb74b53b4efbf79117bd2da40fd" + +[[package]] +name = "chrono" +version = "0.4.22" +source = "registry+https://github.com/rust-lang/crates.io-index" +checksum = "bfd4d1b31faaa3a89d7934dbded3111da0d2ef28e3ebccdb4f0179f5929d1ef1" +dependencies = [ + "iana-time-zone", + "js-sys", + "num-integer", + "num-traits", + "time", + "wasm-bindgen", + "winapi", +] + +[[package]] +name = "clap" +version = "2.34.0" +source = "registry+https://github.com/rust-lang/crates.io-index" +checksum = "a0610544180c38b88101fecf2dd634b174a62eef6946f84dfc6a7127512b381c" +dependencies = [ + "bitflags", + "textwrap", + "unicode-width", +] + +[[package]] +name = "cmake" +version = "0.1.48" +source = "registry+https://github.com/rust-lang/crates.io-index" +checksum = "e8ad8cef104ac57b68b89df3208164d228503abbdce70f6880ffa3d970e7443a" +dependencies = [ + "cc", +] + +[[package]] +name = "color_quant" +version = "1.1.0" +source = "registry+https://github.com/rust-lang/crates.io-index" +checksum = "3d7b894f5411737b7867f4827955924d7c254fc9f4d91a6aad6b097804b1018b" + +[[package]] +name = "console_error_panic_hook" +version = "0.1.7" +source = "registry+https://github.com/rust-lang/crates.io-index" +checksum = "a06aeb73f470f66dcdbf7223caeebb85984942f22f1adb2a088cf9668146bbbc" +dependencies = [ + "cfg-if", + "wasm-bindgen", +] + +[[package]] +name = "const-cstr" +version = "0.3.0" +source = "registry+https://github.com/rust-lang/crates.io-index" +checksum = "ed3d0b5ff30645a68f35ece8cea4556ca14ef8a1651455f789a099a0513532a6" + +[[package]] +name = "core-foundation" +version = "0.9.3" +source = "registry+https://github.com/rust-lang/crates.io-index" +checksum = "194a7a9e6de53fa55116934067c844d9d749312f75c6f6d0980e8c252f8c2146" +dependencies = [ + "core-foundation-sys", + "libc", +] + +[[package]] +name = "core-foundation-sys" +version = "0.8.3" +source = "registry+https://github.com/rust-lang/crates.io-index" +checksum = "5827cebf4670468b8772dd191856768aedcb1b0278a04f989f7766351917b9dc" + +[[package]] +name = "core-graphics" +version = "0.22.3" +source = "registry+https://github.com/rust-lang/crates.io-index" +checksum = "2581bbab3b8ffc6fcbd550bf46c355135d16e9ff2a6ea032ad6b9bf1d7efe4fb" +dependencies = [ + "bitflags", + "core-foundation", + "core-graphics-types", + "foreign-types", + "libc", +] + +[[package]] +name = "core-graphics-types" +version = "0.1.1" +source = "registry+https://github.com/rust-lang/crates.io-index" +checksum = "3a68b68b3446082644c91ac778bf50cd4104bfb002b5a6a7c44cca5a2c70788b" +dependencies = [ + "bitflags", + "core-foundation", + "foreign-types", + "libc", +] + +[[package]] +name = "core-text" +version = "19.2.0" +source = "registry+https://github.com/rust-lang/crates.io-index" +checksum = "99d74ada66e07c1cefa18f8abfba765b486f250de2e4a999e5727fc0dd4b4a25" +dependencies = [ + "core-foundation", + "core-graphics", + "foreign-types", + "libc", +] + +[[package]] +name = "crc32fast" +version = "1.3.2" +source = "registry+https://github.com/rust-lang/crates.io-index" +checksum = "b540bd8bc810d3885c6ea91e2018302f68baba2129ab3e88f32389ee9370880d" +dependencies = [ + "cfg-if", +] + +[[package]] +name = "criterion" +version = "0.3.6" +source = "registry+https://github.com/rust-lang/crates.io-index" +checksum = "b01d6de93b2b6c65e17c634a26653a29d107b3c98c607c765bf38d041531cd8f" +dependencies = [ + "atty", + "cast", + "clap", + "criterion-plot", + "csv", + "itertools", + "lazy_static", + "num-traits", + "oorandom", + "plotters 0.3.3", + "rayon", + "regex", + "serde", + "serde_cbor", + "serde_derive", + "serde_json", + "tinytemplate", + "walkdir", +] + +[[package]] +name = "criterion-plot" +version = "0.4.5" +source = "registry+https://github.com/rust-lang/crates.io-index" +checksum = "2673cc8207403546f45f5fd319a974b1e6983ad1a3ee7e6041650013be041876" +dependencies = [ + "cast", + "itertools", +] + +[[package]] +name = "crossbeam-channel" +version = "0.5.6" +source = "registry+https://github.com/rust-lang/crates.io-index" +checksum = "c2dd04ddaf88237dc3b8d8f9a3c1004b506b54b3313403944054d23c0870c521" +dependencies = [ + "cfg-if", + "crossbeam-utils", +] + +[[package]] +name = "crossbeam-deque" +version = "0.8.2" +source = "registry+https://github.com/rust-lang/crates.io-index" +checksum = "715e8152b692bba2d374b53d4875445368fdf21a94751410af607a5ac677d1fc" +dependencies = [ + "cfg-if", + "crossbeam-epoch", + "crossbeam-utils", +] + +[[package]] +name = "crossbeam-epoch" +version = "0.9.10" +source = "registry+https://github.com/rust-lang/crates.io-index" +checksum = "045ebe27666471bb549370b4b0b3e51b07f56325befa4284db65fc89c02511b1" +dependencies = [ + "autocfg", + "cfg-if", + "crossbeam-utils", + "memoffset", + "once_cell", + "scopeguard", +] + +[[package]] +name = "crossbeam-utils" +version = "0.8.11" +source = "registry+https://github.com/rust-lang/crates.io-index" +checksum = "51887d4adc7b564537b15adcfb307936f8075dfcd5f00dde9a9f1d29383682bc" +dependencies = [ + "cfg-if", + "once_cell", +] + +[[package]] +name = "csv" +version = "1.1.6" +source = "registry+https://github.com/rust-lang/crates.io-index" +checksum = "22813a6dc45b335f9bade10bf7271dc477e81113e89eb251a0bc2a8a81c536e1" +dependencies = [ + "bstr", + "csv-core", + "itoa 0.4.8", + "ryu", + "serde", +] + +[[package]] +name = "csv-core" +version = "0.1.10" +source = "registry+https://github.com/rust-lang/crates.io-index" +checksum = "2b2466559f260f48ad25fe6317b3c8dac77b5bdb5763ac7d9d6103530663bc90" +dependencies = [ + "memchr", +] + +[[package]] +name = "dirs-next" +version = "2.0.0" +source = "registry+https://github.com/rust-lang/crates.io-index" +checksum = "b98cf8ebf19c3d1b223e151f99a4f9f0690dca41414773390fc824184ac833e1" +dependencies = [ + "cfg-if", + "dirs-sys-next", +] + +[[package]] +name = "dirs-sys-next" +version = "0.1.2" +source = "registry+https://github.com/rust-lang/crates.io-index" +checksum = "4ebda144c4fe02d1f7ea1a7d9641b6fc6b580adcfa024ae48797ecdeb6825b4d" +dependencies = [ + "libc", + "redox_users", + "winapi", +] + +[[package]] +name = "dlib" +version = "0.5.0" +source = "registry+https://github.com/rust-lang/crates.io-index" +checksum = "ac1b7517328c04c2aa68422fc60a41b92208182142ed04a25879c26c8f878794" +dependencies = [ + "libloading", +] + +[[package]] +name = "dwrote" +version = "0.11.0" +source = "registry+https://github.com/rust-lang/crates.io-index" +checksum = "439a1c2ba5611ad3ed731280541d36d2e9c4ac5e7fb818a27b604bdc5a6aa65b" +dependencies = [ + "lazy_static", + "libc", + "winapi", + "wio", +] + +[[package]] +name = "either" +version = "1.8.0" +source = "registry+https://github.com/rust-lang/crates.io-index" +checksum = "90e5c1c8368803113bf0c9584fc495a58b86dc8a29edbf8fe877d21d9507e797" + +[[package]] +name = "flate2" +version = "1.0.24" +source = "registry+https://github.com/rust-lang/crates.io-index" +checksum = "f82b0f4c27ad9f8bfd1f3208d882da2b09c301bc1c828fd3a00d0216d2fbbff6" +dependencies = [ + "crc32fast", + "miniz_oxide", +] + +[[package]] +name = "float-ord" +version = "0.2.0" +source = "registry+https://github.com/rust-lang/crates.io-index" +checksum = "7bad48618fdb549078c333a7a8528acb57af271d0433bdecd523eb620628364e" + +[[package]] +name = "font-kit" +version = "0.11.0" +source = "registry+https://github.com/rust-lang/crates.io-index" +checksum = "21fe28504d371085fae9ac7a3450f0b289ab71e07c8e57baa3fb68b9e57d6ce5" +dependencies = [ + "bitflags", + "byteorder", + "core-foundation", + "core-graphics", + "core-text", + "dirs-next", + "dwrote", + "float-ord", + "freetype", + "lazy_static", + "libc", + "log", + "pathfinder_geometry", + "pathfinder_simd", + "walkdir", + "winapi", + "yeslogic-fontconfig-sys", +] + +[[package]] +name = "foreign-types" +version = "0.3.2" +source = "registry+https://github.com/rust-lang/crates.io-index" +checksum = "f6f339eb8adc052cd2ca78910fda869aefa38d22d5cb648e6485e4d3fc06f3b1" +dependencies = [ + "foreign-types-shared", +] + +[[package]] +name = "foreign-types-shared" +version = "0.1.1" +source = "registry+https://github.com/rust-lang/crates.io-index" +checksum = "00b0228411908ca8685dba7fc2cdd70ec9990a6e753e89b6ac91a84c40fbaf4b" + +[[package]] +name = "freetype" +version = "0.7.0" +source = "registry+https://github.com/rust-lang/crates.io-index" +checksum = "bee38378a9e3db1cc693b4f88d166ae375338a0ff75cb8263e1c601d51f35dc6" +dependencies = [ + "freetype-sys", + "libc", +] + +[[package]] +name = "freetype-sys" +version = "0.13.1" +source = "registry+https://github.com/rust-lang/crates.io-index" +checksum = "a37d4011c0cc628dfa766fcc195454f4b068d7afdc2adfd28861191d866e731a" +dependencies = [ + "cmake", + "libc", + "pkg-config", +] + +[[package]] +name = "getrandom" +version = "0.2.7" +source = "registry+https://github.com/rust-lang/crates.io-index" +checksum = "4eb1a864a501629691edf6c15a593b7a51eebaa1e8468e9ddc623de7c9b58ec6" +dependencies = [ + "cfg-if", + "libc", + "wasi 0.11.0+wasi-snapshot-preview1", +] + +[[package]] +name = "gif" +version = "0.11.4" +source = "registry+https://github.com/rust-lang/crates.io-index" +checksum = "3edd93c6756b4dfaf2709eafcc345ba2636565295c198a9cfbf75fa5e3e00b06" +dependencies = [ + "color_quant", + "weezl", +] + +[[package]] +name = "half" +version = "1.8.2" +source = "registry+https://github.com/rust-lang/crates.io-index" +checksum = "eabb4a44450da02c90444cf74558da904edde8fb4e9035a9a6a4e15445af0bd7" + +[[package]] +name = "hermit-abi" +version = "0.1.19" +source = "registry+https://github.com/rust-lang/crates.io-index" +checksum = "62b467343b94ba476dcb2500d242dadbb39557df889310ac77c5d99100aaac33" +dependencies = [ + "libc", +] + +[[package]] +name = "iana-time-zone" +version = "0.1.47" +source = "registry+https://github.com/rust-lang/crates.io-index" +checksum = "4c495f162af0bf17656d0014a0eded5f3cd2f365fdd204548c2869db89359dc7" +dependencies = [ + "android_system_properties", + "core-foundation-sys", + "js-sys", + "once_cell", + "wasm-bindgen", + "winapi", +] + +[[package]] +name = "image" +version = "0.24.3" +source = "registry+https://github.com/rust-lang/crates.io-index" +checksum = "7e30ca2ecf7666107ff827a8e481de6a132a9b687ed3bb20bb1c144a36c00964" +dependencies = [ + "bytemuck", + "byteorder", + "color_quant", + "jpeg-decoder", + "num-rational", + "num-traits", + "png", +] + +[[package]] +name = "itertools" +version = "0.10.3" +source = "registry+https://github.com/rust-lang/crates.io-index" +checksum = "a9a9d19fa1e79b6215ff29b9d6880b706147f16e9b1dbb1e4e5947b5b02bc5e3" +dependencies = [ + "either", +] + +[[package]] +name = "itoa" +version = "0.4.8" +source = "registry+https://github.com/rust-lang/crates.io-index" +checksum = "b71991ff56294aa922b450139ee08b3bfc70982c6b2c7562771375cf73542dd4" + +[[package]] +name = "itoa" +version = "1.0.3" +source = "registry+https://github.com/rust-lang/crates.io-index" +checksum = "6c8af84674fe1f223a982c933a0ee1086ac4d4052aa0fb8060c12c6ad838e754" + +[[package]] +name = "jpeg-decoder" +version = "0.2.6" +source = "registry+https://github.com/rust-lang/crates.io-index" +checksum = "9478aa10f73e7528198d75109c8be5cd7d15fb530238040148d5f9a22d4c5b3b" + +[[package]] +name = "js-sys" +version = "0.3.59" +source = "registry+https://github.com/rust-lang/crates.io-index" +checksum = "258451ab10b34f8af53416d1fdab72c22e805f0c92a1136d59470ec0b11138b2" +dependencies = [ + "wasm-bindgen", +] + +[[package]] +name = "lazy_static" +version = "1.4.0" +source = "registry+https://github.com/rust-lang/crates.io-index" +checksum = "e2abad23fbc42b3700f2f279844dc832adb2b2eb069b2df918f455c4e18cc646" + +[[package]] +name = "libc" +version = "0.2.132" +source = "registry+https://github.com/rust-lang/crates.io-index" +checksum = "8371e4e5341c3a96db127eb2465ac681ced4c433e01dd0e938adbef26ba93ba5" + +[[package]] +name = "libloading" +version = "0.7.3" +source = "registry+https://github.com/rust-lang/crates.io-index" +checksum = "efbc0f03f9a775e9f6aed295c6a1ba2253c5757a9e03d55c6caa46a681abcddd" +dependencies = [ + "cfg-if", + "winapi", +] + +[[package]] +name = "libm" +version = "0.2.5" +source = "registry+https://github.com/rust-lang/crates.io-index" +checksum = "292a948cd991e376cf75541fe5b97a1081d713c618b4f1b9500f8844e49eb565" + +[[package]] +name = "log" +version = "0.4.17" +source = "registry+https://github.com/rust-lang/crates.io-index" +checksum = "abb12e687cfb44aa40f41fc3978ef76448f9b6038cad6aef4259d3c095a2382e" +dependencies = [ + "cfg-if", +] + +[[package]] +name = "memchr" +version = "2.5.0" +source = "registry+https://github.com/rust-lang/crates.io-index" +checksum = "2dffe52ecf27772e601905b7522cb4ef790d2cc203488bbd0e2fe85fcb74566d" + +[[package]] +name = "memoffset" +version = "0.6.5" +source = "registry+https://github.com/rust-lang/crates.io-index" +checksum = "5aa361d4faea93603064a027415f07bd8e1d5c88c9fbf68bf56a285428fd79ce" +dependencies = [ + "autocfg", +] + +[[package]] +name = "miniz_oxide" +version = "0.5.4" +source = "registry+https://github.com/rust-lang/crates.io-index" +checksum = "96590ba8f175222643a85693f33d26e9c8a015f599c216509b1a6894af675d34" +dependencies = [ + "adler", +] + +[[package]] +name = "num-integer" +version = "0.1.45" +source = "registry+https://github.com/rust-lang/crates.io-index" +checksum = "225d3389fb3509a24c93f5c29eb6bde2586b98d9f016636dff58d7c6f7569cd9" +dependencies = [ + "autocfg", + "num-traits", +] + +[[package]] +name = "num-rational" +version = "0.4.1" +source = "registry+https://github.com/rust-lang/crates.io-index" +checksum = "0638a1c9d0a3c0914158145bc76cff373a75a627e6ecbfb71cbe6f453a5a19b0" +dependencies = [ + "autocfg", + "num-integer", + "num-traits", +] + +[[package]] +name = "num-traits" +version = "0.2.15" +source = "registry+https://github.com/rust-lang/crates.io-index" +checksum = "578ede34cf02f8924ab9447f50c28075b4d3e5b269972345e7e0372b38c6cdcd" +dependencies = [ + "autocfg", + "libm", +] + +[[package]] +name = "num_cpus" +version = "1.13.1" +source = "registry+https://github.com/rust-lang/crates.io-index" +checksum = "19e64526ebdee182341572e50e9ad03965aa510cd94427a4549448f285e957a1" +dependencies = [ + "hermit-abi", + "libc", +] + +[[package]] +name = "once_cell" +version = "1.14.0" +source = "registry+https://github.com/rust-lang/crates.io-index" +checksum = "2f7254b99e31cad77da24b08ebf628882739a608578bb1bcdfc1f9c21260d7c0" + +[[package]] +name = "oorandom" +version = "11.1.3" +source = "registry+https://github.com/rust-lang/crates.io-index" +checksum = "0ab1bc2a289d34bd04a330323ac98a1b4bc82c9d9fcb1e66b63caa84da26b575" + +[[package]] +name = "pathfinder_geometry" +version = "0.5.1" +source = "registry+https://github.com/rust-lang/crates.io-index" +checksum = "0b7b7e7b4ea703700ce73ebf128e1450eb69c3a8329199ffbfb9b2a0418e5ad3" +dependencies = [ + "log", + "pathfinder_simd", +] + +[[package]] +name = "pathfinder_simd" +version = "0.5.1" +source = "registry+https://github.com/rust-lang/crates.io-index" +checksum = "39fe46acc5503595e5949c17b818714d26fdf9b4920eacf3b2947f0199f4a6ff" +dependencies = [ + "rustc_version", +] + +[[package]] +name = "pest" +version = "2.3.0" +source = "registry+https://github.com/rust-lang/crates.io-index" +checksum = "4b0560d531d1febc25a3c9398a62a71256c0178f2e3443baedd9ad4bb8c9deb4" +dependencies = [ + "thiserror", + "ucd-trie", +] + +[[package]] +name = "pkg-config" +version = "0.3.25" +source = "registry+https://github.com/rust-lang/crates.io-index" +checksum = "1df8c4ec4b0627e53bdf214615ad287367e482558cf84b109250b37464dc03ae" + +[[package]] +name = "plotters" +version = "0.3.3" +source = "registry+https://github.com/rust-lang/crates.io-index" +checksum = "716b4eeb6c4a1d3ecc956f75b43ec2e8e8ba80026413e70a3f41fd3313d3492b" +dependencies = [ + "num-traits", + "plotters-backend", + "plotters-svg", + "wasm-bindgen", + "web-sys", +] + +[[package]] +name = "plotters" +version = "0.3.4" +dependencies = [ + "chrono", + "criterion", + "font-kit", + "image", + "itertools", + "lazy_static", + "num-traits", + "pathfinder_geometry", + "plotters-backend", + "plotters-bitmap", + "plotters-svg", + "rand", + "rand_distr", + "rand_xorshift", + "rayon", + "serde", + "serde_derive", + "serde_json", + "ttf-parser", + "wasm-bindgen", + "wasm-bindgen-test", + "web-sys", +] + +[[package]] +name = "plotters-backend" +version = "0.3.4" +source = "registry+https://github.com/rust-lang/crates.io-index" +checksum = "193228616381fecdc1224c62e96946dfbc73ff4384fba576e052ff8c1bea8142" + +[[package]] +name = "plotters-bitmap" +version = "0.3.2" +source = "registry+https://github.com/rust-lang/crates.io-index" +checksum = "0c4a1f21490a6cf4a84c272ad20bd7844ed99a3178187a4c5ab7f2051295beef" +dependencies = [ + "gif", + "image", + "plotters-backend", +] + +[[package]] +name = "plotters-svg" +version = "0.3.3" +source = "registry+https://github.com/rust-lang/crates.io-index" +checksum = "f9a81d2759aae1dae668f783c308bc5c8ebd191ff4184aaa1b37f65a6ae5a56f" +dependencies = [ + "image", + "plotters-backend", +] + +[[package]] +name = "png" +version = "0.17.6" +source = "registry+https://github.com/rust-lang/crates.io-index" +checksum = "8f0e7f4c94ec26ff209cee506314212639d6c91b80afb82984819fafce9df01c" +dependencies = [ + "bitflags", + "crc32fast", + "flate2", + "miniz_oxide", +] + +[[package]] +name = "ppv-lite86" +version = "0.2.16" +source = "registry+https://github.com/rust-lang/crates.io-index" +checksum = "eb9f9e6e233e5c4a35559a617bf40a4ec447db2e84c20b55a6f83167b7e57872" + +[[package]] +name = "proc-macro2" +version = "1.0.43" +source = "registry+https://github.com/rust-lang/crates.io-index" +checksum = "0a2ca2c61bc9f3d74d2886294ab7b9853abd9c1ad903a3ac7815c58989bb7bab" +dependencies = [ + "unicode-ident", +] + +[[package]] +name = "quote" +version = "1.0.21" +source = "registry+https://github.com/rust-lang/crates.io-index" +checksum = "bbe448f377a7d6961e30f5955f9b8d106c3f5e449d493ee1b125c1d43c2b5179" +dependencies = [ + "proc-macro2", +] + +[[package]] +name = "rand" +version = "0.8.5" +source = "registry+https://github.com/rust-lang/crates.io-index" +checksum = "34af8d1a0e25924bc5b7c43c079c942339d8f0a8b57c39049bef581b46327404" +dependencies = [ + "libc", + "rand_chacha", + "rand_core", +] + +[[package]] +name = "rand_chacha" +version = "0.3.1" +source = "registry+https://github.com/rust-lang/crates.io-index" +checksum = "e6c10a63a0fa32252be49d21e7709d4d4baf8d231c2dbce1eaa8141b9b127d88" +dependencies = [ + "ppv-lite86", + "rand_core", +] + +[[package]] +name = "rand_core" +version = "0.6.3" +source = "registry+https://github.com/rust-lang/crates.io-index" +checksum = "d34f1408f55294453790c48b2f1ebbb1c5b4b7563eb1f418bcfcfdbb06ebb4e7" +dependencies = [ + "getrandom", +] + +[[package]] +name = "rand_distr" +version = "0.4.3" +source = "registry+https://github.com/rust-lang/crates.io-index" +checksum = "32cb0b9bc82b0a0876c2dd994a7e7a2683d3e7390ca40e6886785ef0c7e3ee31" +dependencies = [ + "num-traits", + "rand", +] + +[[package]] +name = "rand_xorshift" +version = "0.3.0" +source = "registry+https://github.com/rust-lang/crates.io-index" +checksum = "d25bf25ec5ae4a3f1b92f929810509a2f53d7dca2f50b794ff57e3face536c8f" +dependencies = [ + "rand_core", +] + +[[package]] +name = "rayon" +version = "1.5.3" +source = "registry+https://github.com/rust-lang/crates.io-index" +checksum = "bd99e5772ead8baa5215278c9b15bf92087709e9c1b2d1f97cdb5a183c933a7d" +dependencies = [ + "autocfg", + "crossbeam-deque", + "either", + "rayon-core", +] + +[[package]] +name = "rayon-core" +version = "1.9.3" +source = "registry+https://github.com/rust-lang/crates.io-index" +checksum = "258bcdb5ac6dad48491bb2992db6b7cf74878b0384908af124823d118c99683f" +dependencies = [ + "crossbeam-channel", + "crossbeam-deque", + "crossbeam-utils", + "num_cpus", +] + +[[package]] +name = "redox_syscall" +version = "0.2.16" +source = "registry+https://github.com/rust-lang/crates.io-index" +checksum = "fb5a58c1855b4b6819d59012155603f0b22ad30cad752600aadfcb695265519a" +dependencies = [ + "bitflags", +] + +[[package]] +name = "redox_users" +version = "0.4.3" +source = "registry+https://github.com/rust-lang/crates.io-index" +checksum = "b033d837a7cf162d7993aded9304e30a83213c648b6e389db233191f891e5c2b" +dependencies = [ + "getrandom", + "redox_syscall", + "thiserror", +] + +[[package]] +name = "regex" +version = "1.6.0" +source = "registry+https://github.com/rust-lang/crates.io-index" +checksum = "4c4eb3267174b8c6c2f654116623910a0fef09c4753f8dd83db29c48a0df988b" +dependencies = [ + "regex-syntax", +] + +[[package]] +name = "regex-automata" +version = "0.1.10" +source = "registry+https://github.com/rust-lang/crates.io-index" +checksum = "6c230d73fb8d8c1b9c0b3135c5142a8acee3a0558fb8db5cf1cb65f8d7862132" + +[[package]] +name = "regex-syntax" +version = "0.6.27" +source = "registry+https://github.com/rust-lang/crates.io-index" +checksum = "a3f87b73ce11b1619a3c6332f45341e0047173771e8b8b73f87bfeefb7b56244" + +[[package]] +name = "rustc_version" +version = "0.3.3" +source = "registry+https://github.com/rust-lang/crates.io-index" +checksum = "f0dfe2087c51c460008730de8b57e6a320782fbfb312e1f4d520e6c6fae155ee" +dependencies = [ + "semver", +] + +[[package]] +name = "ryu" +version = "1.0.11" +source = "registry+https://github.com/rust-lang/crates.io-index" +checksum = "4501abdff3ae82a1c1b477a17252eb69cee9e66eb915c1abaa4f44d873df9f09" + +[[package]] +name = "same-file" +version = "1.0.6" +source = "registry+https://github.com/rust-lang/crates.io-index" +checksum = "93fc1dc3aaa9bfed95e02e6eadabb4baf7e3078b0bd1b4d7b6b0b68378900502" +dependencies = [ + "winapi-util", +] + +[[package]] +name = "scoped-tls" +version = "1.0.0" +source = "registry+https://github.com/rust-lang/crates.io-index" +checksum = "ea6a9290e3c9cf0f18145ef7ffa62d68ee0bf5fcd651017e586dc7fd5da448c2" + +[[package]] +name = "scopeguard" +version = "1.1.0" +source = "registry+https://github.com/rust-lang/crates.io-index" +checksum = "d29ab0c6d3fc0ee92fe66e2d99f700eab17a8d57d1c1d3b748380fb20baa78cd" + +[[package]] +name = "semver" +version = "0.11.0" +source = "registry+https://github.com/rust-lang/crates.io-index" +checksum = "f301af10236f6df4160f7c3f04eec6dbc70ace82d23326abad5edee88801c6b6" +dependencies = [ + "semver-parser", +] + +[[package]] +name = "semver-parser" +version = "0.10.2" +source = "registry+https://github.com/rust-lang/crates.io-index" +checksum = "00b0bef5b7f9e0df16536d3961cfb6e84331c065b4066afb39768d0e319411f7" +dependencies = [ + "pest", +] + +[[package]] +name = "serde" +version = "1.0.144" +source = "registry+https://github.com/rust-lang/crates.io-index" +checksum = "0f747710de3dcd43b88c9168773254e809d8ddbdf9653b84e2554ab219f17860" + +[[package]] +name = "serde_cbor" +version = "0.11.2" +source = "registry+https://github.com/rust-lang/crates.io-index" +checksum = "2bef2ebfde456fb76bbcf9f59315333decc4fda0b2b44b420243c11e0f5ec1f5" +dependencies = [ + "half", + "serde", +] + +[[package]] +name = "serde_derive" +version = "1.0.144" +source = "registry+https://github.com/rust-lang/crates.io-index" +checksum = "94ed3a816fb1d101812f83e789f888322c34e291f894f19590dc310963e87a00" +dependencies = [ + "proc-macro2", + "quote", + "syn", +] + +[[package]] +name = "serde_json" +version = "1.0.85" +source = "registry+https://github.com/rust-lang/crates.io-index" +checksum = "e55a28e3aaef9d5ce0506d0a14dbba8054ddc7e499ef522dd8b26859ec9d4a44" +dependencies = [ + "itoa 1.0.3", + "ryu", + "serde", +] + +[[package]] +name = "syn" +version = "1.0.99" +source = "registry+https://github.com/rust-lang/crates.io-index" +checksum = "58dbef6ec655055e20b86b15a8cc6d439cca19b667537ac6a1369572d151ab13" +dependencies = [ + "proc-macro2", + "quote", + "unicode-ident", +] + +[[package]] +name = "textwrap" +version = "0.11.0" +source = "registry+https://github.com/rust-lang/crates.io-index" +checksum = "d326610f408c7a4eb6f51c37c330e496b08506c9457c9d34287ecc38809fb060" +dependencies = [ + "unicode-width", +] + +[[package]] +name = "thiserror" +version = "1.0.34" +source = "registry+https://github.com/rust-lang/crates.io-index" +checksum = "8c1b05ca9d106ba7d2e31a9dab4a64e7be2cce415321966ea3132c49a656e252" +dependencies = [ + "thiserror-impl", +] + +[[package]] +name = "thiserror-impl" +version = "1.0.34" +source = "registry+https://github.com/rust-lang/crates.io-index" +checksum = "e8f2591983642de85c921015f3f070c665a197ed69e417af436115e3a1407487" +dependencies = [ + "proc-macro2", + "quote", + "syn", +] + +[[package]] +name = "time" +version = "0.1.44" +source = "registry+https://github.com/rust-lang/crates.io-index" +checksum = "6db9e6914ab8b1ae1c260a4ae7a49b6c5611b40328a735b21862567685e73255" +dependencies = [ + "libc", + "wasi 0.10.0+wasi-snapshot-preview1", + "winapi", +] + +[[package]] +name = "tinytemplate" +version = "1.2.1" +source = "registry+https://github.com/rust-lang/crates.io-index" +checksum = "be4d6b5f19ff7664e8c98d03e2139cb510db9b0a60b55f8e8709b689d939b6bc" +dependencies = [ + "serde", + "serde_json", +] + +[[package]] +name = "ttf-parser" +version = "0.15.2" +source = "registry+https://github.com/rust-lang/crates.io-index" +checksum = "7b3e06c9b9d80ed6b745c7159c40b311ad2916abb34a49e9be2653b90db0d8dd" + +[[package]] +name = "ucd-trie" +version = "0.1.5" +source = "registry+https://github.com/rust-lang/crates.io-index" +checksum = "9e79c4d996edb816c91e4308506774452e55e95c3c9de07b6729e17e15a5ef81" + +[[package]] +name = "unicode-ident" +version = "1.0.3" +source = "registry+https://github.com/rust-lang/crates.io-index" +checksum = "c4f5b37a154999a8f3f98cc23a628d850e154479cd94decf3414696e12e31aaf" + +[[package]] +name = "unicode-width" +version = "0.1.9" +source = "registry+https://github.com/rust-lang/crates.io-index" +checksum = "3ed742d4ea2bd1176e236172c8429aaf54486e7ac098db29ffe6529e0ce50973" + +[[package]] +name = "walkdir" +version = "2.3.2" +source = "registry+https://github.com/rust-lang/crates.io-index" +checksum = "808cf2735cd4b6866113f648b791c6adc5714537bc222d9347bb203386ffda56" +dependencies = [ + "same-file", + "winapi", + "winapi-util", +] + +[[package]] +name = "wasi" +version = "0.10.0+wasi-snapshot-preview1" +source = "registry+https://github.com/rust-lang/crates.io-index" +checksum = "1a143597ca7c7793eff794def352d41792a93c481eb1042423ff7ff72ba2c31f" + +[[package]] +name = "wasi" +version = "0.11.0+wasi-snapshot-preview1" +source = "registry+https://github.com/rust-lang/crates.io-index" +checksum = "9c8d87e72b64a3b4db28d11ce29237c246188f4f51057d65a7eab63b7987e423" + +[[package]] +name = "wasm-bindgen" +version = "0.2.82" +source = "registry+https://github.com/rust-lang/crates.io-index" +checksum = "fc7652e3f6c4706c8d9cd54832c4a4ccb9b5336e2c3bd154d5cccfbf1c1f5f7d" +dependencies = [ + "cfg-if", + "wasm-bindgen-macro", +] + +[[package]] +name = "wasm-bindgen-backend" +version = "0.2.82" +source = "registry+https://github.com/rust-lang/crates.io-index" +checksum = "662cd44805586bd52971b9586b1df85cdbbd9112e4ef4d8f41559c334dc6ac3f" +dependencies = [ + "bumpalo", + "log", + "once_cell", + "proc-macro2", + "quote", + "syn", + "wasm-bindgen-shared", +] + +[[package]] +name = "wasm-bindgen-futures" +version = "0.4.32" +source = "registry+https://github.com/rust-lang/crates.io-index" +checksum = "fa76fb221a1f8acddf5b54ace85912606980ad661ac7a503b4570ffd3a624dad" +dependencies = [ + "cfg-if", + "js-sys", + "wasm-bindgen", + "web-sys", +] + +[[package]] +name = "wasm-bindgen-macro" +version = "0.2.82" +source = "registry+https://github.com/rust-lang/crates.io-index" +checksum = "b260f13d3012071dfb1512849c033b1925038373aea48ced3012c09df952c602" +dependencies = [ + "quote", + "wasm-bindgen-macro-support", +] + +[[package]] +name = "wasm-bindgen-macro-support" +version = "0.2.82" +source = "registry+https://github.com/rust-lang/crates.io-index" +checksum = "5be8e654bdd9b79216c2929ab90721aa82faf65c48cdf08bdc4e7f51357b80da" +dependencies = [ + "proc-macro2", + "quote", + "syn", + "wasm-bindgen-backend", + "wasm-bindgen-shared", +] + +[[package]] +name = "wasm-bindgen-shared" +version = "0.2.82" +source = "registry+https://github.com/rust-lang/crates.io-index" +checksum = "6598dd0bd3c7d51095ff6531a5b23e02acdc81804e30d8f07afb77b7215a140a" + +[[package]] +name = "wasm-bindgen-test" +version = "0.3.32" +source = "registry+https://github.com/rust-lang/crates.io-index" +checksum = "513df541345bb9fcc07417775f3d51bbb677daf307d8035c0afafd87dc2e6599" +dependencies = [ + "console_error_panic_hook", + "js-sys", + "scoped-tls", + "wasm-bindgen", + "wasm-bindgen-futures", + "wasm-bindgen-test-macro", +] + +[[package]] +name = "wasm-bindgen-test-macro" +version = "0.3.32" +source = "registry+https://github.com/rust-lang/crates.io-index" +checksum = "6150d36a03e90a3cf6c12650be10626a9902d70c5270fd47d7a47e5389a10d56" +dependencies = [ + "proc-macro2", + "quote", +] + +[[package]] +name = "web-sys" +version = "0.3.59" +source = "registry+https://github.com/rust-lang/crates.io-index" +checksum = "ed055ab27f941423197eb86b2035720b1a3ce40504df082cac2ecc6ed73335a1" +dependencies = [ + "js-sys", + "wasm-bindgen", +] + +[[package]] +name = "weezl" +version = "0.1.7" +source = "registry+https://github.com/rust-lang/crates.io-index" +checksum = "9193164d4de03a926d909d3bc7c30543cecb35400c02114792c2cae20d5e2dbb" + +[[package]] +name = "winapi" +version = "0.3.9" +source = "registry+https://github.com/rust-lang/crates.io-index" +checksum = "5c839a674fcd7a98952e593242ea400abe93992746761e38641405d28b00f419" +dependencies = [ + "winapi-i686-pc-windows-gnu", + "winapi-x86_64-pc-windows-gnu", +] + +[[package]] +name = "winapi-i686-pc-windows-gnu" +version = "0.4.0" +source = "registry+https://github.com/rust-lang/crates.io-index" +checksum = "ac3b87c63620426dd9b991e5ce0329eff545bccbbb34f3be09ff6fb6ab51b7b6" + +[[package]] +name = "winapi-util" +version = "0.1.5" +source = "registry+https://github.com/rust-lang/crates.io-index" +checksum = "70ec6ce85bb158151cae5e5c87f95a8e97d2c0c4b001223f33a334e3ce5de178" +dependencies = [ + "winapi", +] + +[[package]] +name = "winapi-x86_64-pc-windows-gnu" +version = "0.4.0" +source = "registry+https://github.com/rust-lang/crates.io-index" +checksum = "712e227841d057c1ee1cd2fb22fa7e5a5461ae8e48fa2ca79ec42cfc1931183f" + +[[package]] +name = "wio" +version = "0.2.2" +source = "registry+https://github.com/rust-lang/crates.io-index" +checksum = "5d129932f4644ac2396cb456385cbf9e63b5b30c6e8dc4820bdca4eb082037a5" +dependencies = [ + "winapi", +] + +[[package]] +name = "yeslogic-fontconfig-sys" +version = "3.2.0" +source = "registry+https://github.com/rust-lang/crates.io-index" +checksum = "f2bbd69036d397ebbff671b1b8e4d918610c181c5a16073b96f984a38d08c386" +dependencies = [ + "const-cstr", + "dlib", + "once_cell", + "pkg-config", +] diff --git a/vendor/plotters/Cargo.toml b/vendor/plotters/Cargo.toml new file mode 100644 index 000000000..ef249f68a --- /dev/null +++ b/vendor/plotters/Cargo.toml @@ -0,0 +1,189 @@ +# THIS FILE IS AUTOMATICALLY GENERATED BY CARGO +# +# When uploading crates to the registry Cargo will automatically +# "normalize" Cargo.toml files for maximal compatibility +# with all versions of Cargo and also rewrite `path` dependencies +# to registry (e.g., crates.io) dependencies. +# +# If you are reading this file be aware that the original Cargo.toml +# will likely look very different (and much more reasonable). +# See Cargo.toml.orig for the original contents. + +[package] +edition = "2018" +name = "plotters" +version = "0.3.4" +authors = ["Hao Hou <haohou302@gmail.com>"] +exclude = [ + "doc-template", + "plotters-doc-data", +] +description = "A Rust drawing library focus on data plotting for both WASM and native applications" +homepage = "https://plotters-rs.github.io/" +readme = "README.md" +keywords = [ + "WebAssembly", + "Visualization", + "Plotting", + "Drawing", +] +categories = [ + "visualization", + "wasm", +] +license = "MIT" +repository = "https://github.com/plotters-rs/plotters" + +[[bench]] +name = "benchmark" +path = "benches/main.rs" +harness = false + +[dependencies.chrono] +version = "0.4.20" +optional = true + +[dependencies.num-traits] +version = "0.2.14" + +[dependencies.plotters-backend] +version = "0.3" + +[dependencies.plotters-bitmap] +version = "0.3" +optional = true +default_features = false + +[dependencies.plotters-svg] +version = "^0.3" +optional = true + +[dev-dependencies.criterion] +version = "0.3.6" + +[dev-dependencies.itertools] +version = "0.10.0" + +[dev-dependencies.rayon] +version = "1.5.1" + +[dev-dependencies.serde] +version = "1.0.139" + +[dev-dependencies.serde_derive] +version = "1.0.140" + +[dev-dependencies.serde_json] +version = "1.0.82" + +[features] +all_elements = [ + "errorbar", + "candlestick", + "boxplot", + "histogram", +] +all_series = [ + "area_series", + "line_series", + "point_series", + "surface_series", +] +area_series = [] +bitmap_backend = [ + "plotters-bitmap", + "ttf", +] +bitmap_encoder = ["plotters-bitmap/image_encoder"] +bitmap_gif = ["plotters-bitmap/gif_backend"] +boxplot = [] +candlestick = [] +datetime = ["chrono"] +default = [ + "bitmap_backend", + "bitmap_encoder", + "bitmap_gif", + "svg_backend", + "chrono", + "ttf", + "image", + "deprecated_items", + "all_series", + "all_elements", + "full_palette", +] +deprecated_items = [] +errorbar = [] +evcxr = ["svg_backend"] +evcxr_bitmap = [ + "evcxr", + "bitmap_backend", + "plotters-svg/bitmap_encoder", +] +fontconfig-dlopen = ["font-kit/source-fontconfig-dlopen"] +full_palette = [] +histogram = [] +line_series = [] +point_series = [] +surface_series = [] +svg_backend = ["plotters-svg"] +ttf = [ + "font-kit", + "ttf-parser", + "lazy_static", + "pathfinder_geometry", +] + +[target."cfg(all(target_arch = \"wasm32\", not(target_os = \"wasi\")))".dependencies.wasm-bindgen] +version = "0.2.62" + +[target."cfg(all(target_arch = \"wasm32\", not(target_os = \"wasi\")))".dependencies.web-sys] +version = "0.3.51" +features = [ + "Document", + "DomRect", + "Element", + "HtmlElement", + "Node", + "Window", + "HtmlCanvasElement", + "CanvasRenderingContext2d", +] + +[target."cfg(all(target_arch = \"wasm32\", not(target_os = \"wasi\")))".dev-dependencies.wasm-bindgen-test] +version = "0.3.24" + +[target."cfg(not(all(target_arch = \"wasm32\", not(target_os = \"wasi\"))))".dependencies.font-kit] +version = "0.11.0" +optional = true + +[target."cfg(not(all(target_arch = \"wasm32\", not(target_os = \"wasi\"))))".dependencies.image] +version = "0.24.3" +features = [ + "jpeg", + "png", + "bmp", +] +optional = true +default-features = false + +[target."cfg(not(all(target_arch = \"wasm32\", not(target_os = \"wasi\"))))".dependencies.lazy_static] +version = "1.4.0" +optional = true + +[target."cfg(not(all(target_arch = \"wasm32\", not(target_os = \"wasi\"))))".dependencies.pathfinder_geometry] +version = "0.5.1" +optional = true + +[target."cfg(not(all(target_arch = \"wasm32\", not(target_os = \"wasi\"))))".dependencies.ttf-parser] +version = "0.15.0" +optional = true + +[target."cfg(not(target_arch = \"wasm32\"))".dev-dependencies.rand] +version = "0.8.3" + +[target."cfg(not(target_arch = \"wasm32\"))".dev-dependencies.rand_distr] +version = "0.4.0" + +[target."cfg(not(target_arch = \"wasm32\"))".dev-dependencies.rand_xorshift] +version = "0.3.0" diff --git a/vendor/plotters/README.md b/vendor/plotters/README.md new file mode 100644 index 000000000..fa451dddf --- /dev/null +++ b/vendor/plotters/README.md @@ -0,0 +1,601 @@ +# Plotters - A Rust drawing library focus on data plotting for both WASM and native applications 🦀📈🚀 + +<a href="https://crates.io/crates/plotters"> + <img style="display: inline!important" src="https://img.shields.io/crates/v/plotters.svg"></img> +</a> +<a href="https://docs.rs/plotters"> + <img style="display: inline!important" src="https://docs.rs/plotters/badge.svg"></img> +</a> +<a href="https://docs.rs/plotters"> + <img style="display: inline!important" src="https://img.shields.io/crates/d/plotters"></img> +</a> +<a href="https://plotters-rs.github.io/rustdoc/plotters/"> + <img style="display: inline! important" src="https://img.shields.io/badge/docs-development-lightgrey.svg"></img> +</a> + +Plotters is drawing library designed for rendering figures, plots, and charts, in pure rust. Plotters supports various types of back-ends, +including bitmap, vector graph, piston window, GTK/Cairo and WebAssembly. + +- A new Plotters Developer's Guide is working in progress. The preview version is available at [here](https://plotters-rs.github.io/book). +- To try Plotters with interactive Jupyter notebook, or view [here](https://plotters-rs.github.io/plotters-doc-data/evcxr-jupyter-integration.html) for the static HTML version. +- To view the WASM example, go to this [link](https://plotters-rs.github.io/wasm-demo/www/index.html) +- Currently we have all the internal code ready for console plotting, but a console based backend is still not ready. See [this example](https://github.com/38/plotters/blob/master/examples/console.rs) for how to plotting on Console with a customized backend. +- Plotters now moved all backend code to sperate repositories, check [FAQ list](#faq-list) for details +- Some interesting [demo projects](#demo-projects) are available, feel free to try them out. + +## Gallery + +To view the source code for each example, please click on the example image. + +<a href="https://github.com/38/plotters/blob/master/plotters/examples/chart.rs"> + <img src="https://plotters-rs.github.io/plotters-doc-data/sample.png" class="galleryItem" width=200px></img> +</a> + +<a href="https://github.com/38/plotters/blob/master/plotters/examples/stock.rs"> + <img src="https://plotters-rs.github.io/plotters-doc-data/stock.png" class="galleryItem" width=200px></img> +</a> + +<a href="https://github.com/38/plotters/blob/master/plotters/examples/histogram.rs"> + <img src="https://plotters-rs.github.io/plotters-doc-data/histogram.png" class="galleryItem" width=200px></img> +</a> + +<a href="https://github.com/38/plotters#quick-start"> + <img src="https://plotters-rs.github.io/plotters-doc-data/0.png" class="galleryItem" width=200px></img> +</a> + +<a href="#"> + <img src="https://plotters-rs.github.io/plotters-doc-data/console-2.png" class="galleryItem" width=200px></img> +</a> + +<a href="https://github.com/38/plotters/blob/master/plotters/examples/mandelbrot.rs"> + <img src="https://plotters-rs.github.io/plotters-doc-data/mandelbrot.png" class="galleryItem" width=200px></img> +</a> + +<a href="https://github.com/38/plotters#trying-with-jupyter-evcxr-kernel-interactively"> + <img src="https://plotters-rs.github.io/plotters-doc-data/evcxr_animation.gif" class="galleryItem" width=200px></img> +</a> + + +<a href="https://github.com/plotters-rs/plotters-piston/blob/master/plotters/examples/cpustat.rs"> + <img src="https://plotters-rs.github.io/plotters-doc-data/plotters-piston.gif" class="galleryItem" width=200px></img> +</a> + +<a href="https://github.com/38/plotters/blob/master/plotters/examples/normal-dist.rs"> + <img src="https://plotters-rs.github.io/plotters-doc-data/normal-dist.png" class="galleryItem" width=200px></img> +</a> + +<a href="https://github.com/38/plotters/blob/master/plotters/examples/two-scales.rs"> + <img src="https://plotters-rs.github.io/plotters-doc-data/twoscale.png" class="galleryItem" width=200px></img> +</a> + +<a href="https://github.com/38/plotters/blob/master/plotters/examples/matshow.rs"> + <img src="https://plotters-rs.github.io/plotters-doc-data/matshow.png" class="galleryItem" width=200px></img> +</a> + +<a href="https://github.com/38/plotters/blob/master/plotters/examples/sierpinski.rs"> + <img src="https://plotters-rs.github.io/plotters-doc-data/sierpinski.png" class="galleryItem" width=200px></img> +</a> + +<a href="https://github.com/38/plotters/blob/master/plotters/examples/normal-dist2.rs"> + <img src="https://plotters-rs.github.io/plotters-doc-data/normal-dist2.png" class="galleryItem" width=200px></img> +</a> + +<a href="https://github.com/38/plotters/blob/master/plotters/examples/errorbar.rs"> + <img src="https://plotters-rs.github.io/plotters-doc-data/errorbar.png" class="galleryItem" width=200px></img> +</a> + +<a href="https://github.com/38/plotters/blob/master/plotters/examples/slc-temp.rs"> + <img src="https://plotters-rs.github.io/plotters-doc-data/slc-temp.png" class="galleryItem" width=200px></img> +</a> + +<a href="https://github.com/38/plotters/blob/master/plotters/examples/area-chart.rs"> + <img src="https://plotters-rs.github.io/plotters-doc-data/area-chart.png" class="galleryItem" width=200px></img> +</a> + +<a href="https://github.com/38/plotters/blob/master/plotters/examples/snowflake.rs"> + <img src="https://plotters-rs.github.io/plotters-doc-data/snowflake.png" class="galleryItem" width=200px></img> +</a> + +<a href="https://github.com/38/plotters/blob/master/plotters/examples/animation.rs"> + <img src="https://plotters-rs.github.io/plotters-doc-data/animation.gif" class="galleryItem" width=200px></img> +</a> + +<a href="https://github.com/38/plotters/blob/master/plotters/examples/console.rs"> + <img src="https://plotters-rs.github.io/plotters-doc-data/console-example.png" class="galleryItem" width=200px></img> +</a> + +<a href="https://github.com/38/plotters/blob/master/plotters/examples/console.rs"> + <img src="https://plotters-rs.github.io/plotters-doc-data/console.png" class="galleryItem" width=200px></img> +</a> + +<a href="https://github.com/38/plotters/blob/master/plotters/examples/blit-bitmap.rs"> + <img src="https://plotters-rs.github.io/plotters-doc-data/blit-bitmap.png" class="galleryItem" width=200px></img> +</a> + +<a href="https://github.com/38/plotters/blob/master/plotters/examples/boxplot.rs"> + <img src="https://plotters-rs.github.io/plotters-doc-data/boxplot.svg" class="galleryItem" width=200px></img> +</a> + +<a href="https://github.com/38/plotters/blob/master/plotters/examples/3d-plot.rs"> + <img src="https://plotters-rs.github.io/plotters-doc-data/3d-plot.svg" class="galleryItem" width=200px></img> +</a> + +<a href="https://github.com/38/plotters/blob/master/plotters/examples/3d-plot2.rs"> + <img src="https://plotters-rs.github.io/plotters-doc-data/3d-plot2.gif" class="galleryItem" width=200px></img> +</a> + +<a href="https://github.com/38/plotters/blob/master/plotters/examples/tick_control.rs"> + <img src="https://plotters-rs.github.io/plotters-doc-data/tick_control.svg" class="galleryItem" width=200px></img> +</a> + + +## Table of Contents + * [Gallery](#gallery) + * [Dependencies](#dependencies) + + [Ubuntu Linux](#ubuntu-linux) + * [Quick Start](#quick-start) + * [Demo Projects](#demo-projects) + * [Trying with Jupyter evcxr Kernel Interactively](#trying-with-jupyter-evcxr-kernel-interactively) + * [Interactive Tutorial with Jupyter Notebook](#interactive-tutorial-with-jupyter-notebook) + * [Plotting in Rust](#plotting-in-rust) + * [Plotting on HTML5 canvas with WASM Backend](#plotting-on-html5-canvas-with-wasm-backend) + * [What types of figure are supported?](#what-types-of-figure-are-supported) + * [Concepts by examples](#concepts-by-examples) + + [Drawing Back-ends](#drawing-back-ends) + + [Drawing Area](#drawing-area) + + [Elements](#elements) + + [Composable Elements](#composable-elements) + + [Chart Context](#chart-context) + * [Misc](#misc) + + [Development Version](#development-version) + + [Reducing Depending Libraries && Turning Off Backends](#reducing-depending-libraries--turning-off-backends) + + [List of Features](#list-of-features) + * [FAQ List](#faq-list) + +## Dependencies + +### Ubuntu Linux + + ```sudo apt install pkg-config libfreetype6-dev libfontconfig1-dev``` + +## Quick Start + +To use Plotters, you can simply add Plotters into your `Cargo.toml` +```toml +[dependencies] +plotters = "0.3.1" +``` + +And the following code draws a quadratic function. `src/main.rs`, + +```rust +use plotters::prelude::*; +fn main() -> Result<(), Box<dyn std::error::Error>> { + let root = BitMapBackend::new("plotters-doc-data/0.png", (640, 480)).into_drawing_area(); + root.fill(&WHITE)?; + let mut chart = ChartBuilder::on(&root) + .caption("y=x^2", ("sans-serif", 50).into_font()) + .margin(5) + .x_label_area_size(30) + .y_label_area_size(30) + .build_cartesian_2d(-1f32..1f32, -0.1f32..1f32)?; + + chart.configure_mesh().draw()?; + + chart + .draw_series(LineSeries::new( + (-50..=50).map(|x| x as f32 / 50.0).map(|x| (x, x * x)), + &RED, + ))? + .label("y = x^2") + .legend(|(x, y)| PathElement::new(vec![(x, y), (x + 20, y)], &RED)); + + chart + .configure_series_labels() + .background_style(&WHITE.mix(0.8)) + .border_style(&BLACK) + .draw()?; + + root.present()?; + + Ok(()) +} +``` + +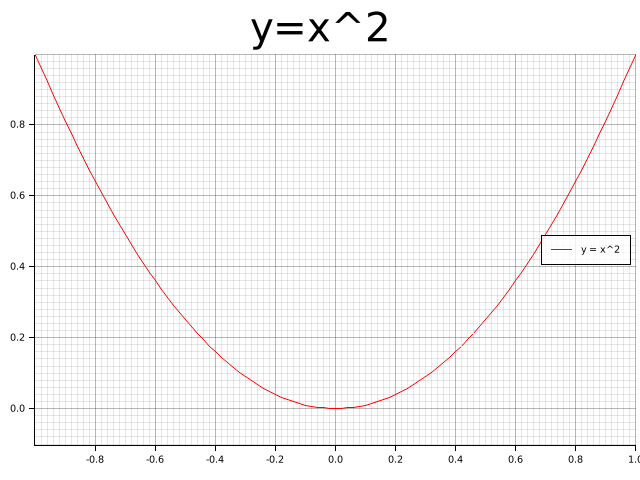 + +## Demo Projects + +To learn how to use Plotters in different scenarios by checking out the following demo projects: + +- WebAssembly + Plotters: [plotters-wasm-demo](https://github.com/plotters-rs/plotters-wasm-demo) +- minifb + Plotters: [plotters-minifb-demo](https://github.com/plotters-rs/plotters-minifb-demo) +- GTK + Plotters: [plotters-gtk-demo](https://github.com/plotters-rs/plotters-gtk-demo) + + +## Trying with Jupyter evcxr Kernel Interactively + +Plotters now supports integrate with `evcxr` and is able to interactively drawing plots in Jupyter Notebook. +The feature `evcxr` should be enabled when including Plotters to Jupyter Notebook. + +The following code shows a minimal example of this. + +```text +:dep plotters = { git = "https://github.com/38/plotters", default_features = false, features = ["evcxr"] } +extern crate plotters; +use plotters::prelude::*; + +let figure = evcxr_figure((640, 480), |root| { + root.fill(&WHITE)?; + let mut chart = ChartBuilder::on(&root) + .caption("y=x^2", ("Arial", 50).into_font()) + .margin(5) + .x_label_area_size(30) + .y_label_area_size(30) + .build_cartesian_2d(-1f32..1f32, -0.1f32..1f32)?; + + chart.configure_mesh().draw()?; + + chart.draw_series(LineSeries::new( + (-50..=50).map(|x| x as f32 / 50.0).map(|x| (x, x * x)), + &RED, + )).unwrap() + .label("y = x^2") + .legend(|(x,y)| PathElement::new(vec![(x,y), (x + 20,y)], &RED)); + + chart.configure_series_labels() + .background_style(&WHITE.mix(0.8)) + .border_style(&BLACK) + .draw()?; + Ok(()) +}); +figure +``` + +<img src="https://plotters-rs.github.io/plotters-doc-data/evcxr_animation.gif" width="450px"></img> + +## Interactive Tutorial with Jupyter Notebook + +*This tutorial is now working in progress and isn't complete* + +Thanks to the evcxr, now we have an interactive tutorial for Plotters! +To use the interactive notebook, you must have Jupyter and evcxr installed on your computer. +Follow the instruction on [this page](https://github.com/google/evcxr/tree/master/evcxr_jupyter) below to install it. + +After that, you should be able to start your Jupyter server locally and load the tutorial! + +```bash +git clone https://github.com/38/plotters-doc-data +cd plotteres-doc-data +jupyter notebook +``` + +And select the notebook called `evcxr-jupyter-integration.ipynb`. + +Also, there's a static HTML version of this notebook available at the [this location](https://plotters-rs.github.io/plotters-doc-data/evcxr-jupyter-integration.html) + +## Plotting in Rust + +Rust is a perfect language for data visualization. Although there are many mature visualization libraries in many different languages. +But Rust is one of the best languages fits the need. + +* **Easy to use** Rust has a very good iterator system built into the standard library. With the help of iterators, +Plotting in Rust can be as easy as most of the high-level programming languages. The Rust based plotting library +can be very easy to use. + +* **Fast** If you need rendering a figure with trillions of data points, +Rust is a good choice. Rust's performance allows you to combine data processing step +and rendering step into a single application. When plotting in high-level programming languages, +e.g. Javascript or Python, data points must be down-sampled before feeding into the plotting +program because of the performance considerations. Rust is fast enough to do the data processing and visualization +within a single program. You can also integrate the +figure rendering code into your application handling a huge amount of data and visualize it in real-time. + +* **WebAssembly Support** Rust is one of few the language with the best WASM support. Plotting in Rust could be +very useful for visualization on a web page and would have a huge performance improvement comparing to Javascript. + +## Plotting on HTML5 canvas with WASM Backend + +Plotters currently supports backend that uses the HTML5 canvas. To use the WASM support, you can simply use +`CanvasBackend` instead of other backend and all other API remains the same! + +There's a small demo for Plotters + WASM available at [here](https://github.com/plotters-rs/plotters-wasm-demo). +To play with the deployed version, follow this [link](https://plotters-rs.github.io/wasm-demo/www/index.html). + + +## What types of figure are supported? + +Plotters is not limited to any specific type of figure. +You can create your own types of figures easily with the Plotters API. + +But Plotters provides some builtin figure types for convenience. +Currently, we support line series, point series, candlestick series, and histogram. +And the library is designed to be able to render multiple figure into a single image. +But Plotter is aimed to be a platform that is fully extendable to support any other types of figure. + +## Concepts by examples + +### Drawing Back-ends +Plotters can use different drawing back-ends, including SVG, BitMap, and even real-time rendering. For example, a bitmap drawing backend. + +```rust +use plotters::prelude::*; +fn main() -> Result<(), Box<dyn std::error::Error>> { + // Create a 800*600 bitmap and start drawing + let mut backend = BitMapBackend::new("plotters-doc-data/1.png", (300, 200)); + // And if we want SVG backend + // let backend = SVGBackend::new("output.svg", (800, 600)); + backend.draw_rect((50, 50), (200, 150), &RED, true)?; + backend.present()?; + Ok(()) +} +``` + + + +### Drawing Area +Plotters uses a concept called drawing area for layout purpose. +Plotters support multiple integrating into a single image. +This is done by creating sub-drawing-areas. + +Besides that, the drawing area also allows the customized coordinate system, by doing so, the coordinate mapping is done by the drawing area automatically. + +```rust +use plotters::prelude::*; +fn main() -> Result<(), Box<dyn std::error::Error>> { + let root_drawing_area = + BitMapBackend::new("plotters-doc-data/2.png", (300, 200)).into_drawing_area(); + // And we can split the drawing area into 3x3 grid + let child_drawing_areas = root_drawing_area.split_evenly((3, 3)); + // Then we fill the drawing area with different color + for (area, color) in child_drawing_areas.into_iter().zip(0..) { + area.fill(&Palette99::pick(color))?; + } + root_drawing_area.present()?; + Ok(()) +} +``` + + + +### Elements + +In Plotters, elements are build blocks of figures. All elements are able to draw on a drawing area. +There are different types of built-in elements, like lines, texts, circles, etc. +You can also define your own element in the application code. + +You may also combine existing elements to build a complex element. + +To learn more about the element system, please read the [element module documentation](./element/index.html). + +```rust +use plotters::prelude::*; +fn main() -> Result<(), Box<dyn std::error::Error>> { + let root = BitMapBackend::new("plotters-doc-data/3.png", (300, 200)).into_drawing_area(); + root.fill(&WHITE)?; + // Draw an circle on the drawing area + root.draw(&Circle::new( + (100, 100), + 50, + Into::<ShapeStyle>::into(&GREEN).filled(), + ))?; + root.present()?; + Ok(()) +} +``` + + + +### Composable Elements + +Besides the built-in elements, elements can be composed into a logic group we called composed elements. +When composing new elements, the upper-left corner is given in the target coordinate, and a new pixel-based +coordinate which has the upper-left corner defined as `(0,0)` is used for further element composition purpose. + +For example, we can have an element which includes a dot and its coordinate. + +```rust +use plotters::prelude::*; +use plotters::coord::types::RangedCoordf32; + +fn main() -> Result<(), Box<dyn std::error::Error>> { + let root = BitMapBackend::new("plotters-doc-data/4.png", (640, 480)).into_drawing_area(); + + root.fill(&RGBColor(240, 200, 200))?; + + let root = root.apply_coord_spec(Cartesian2d::<RangedCoordf32, RangedCoordf32>::new( + 0f32..1f32, + 0f32..1f32, + (0..640, 0..480), + )); + + let dot_and_label = |x: f32, y: f32| { + return EmptyElement::at((x, y)) + + Circle::new((0, 0), 3, ShapeStyle::from(&BLACK).filled()) + + Text::new( + format!("({:.2},{:.2})", x, y), + (10, 0), + ("sans-serif", 15.0).into_font(), + ); + }; + + root.draw(&dot_and_label(0.5, 0.6))?; + root.draw(&dot_and_label(0.25, 0.33))?; + root.draw(&dot_and_label(0.8, 0.8))?; + root.present()?; + Ok(()) +} +``` + +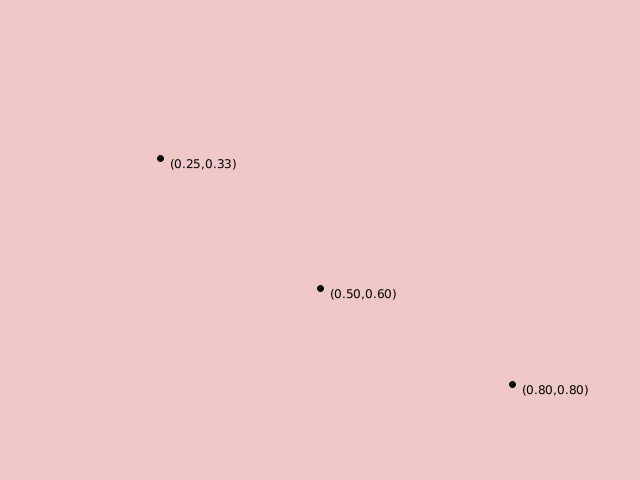 + +### Chart Context + +In order to draw a chart, Plotters need a data object built on top of the drawing area called `ChartContext`. +The chart context defines even higher level constructs compare to the drawing area. +For example, you can define the label areas, meshes, and put a data series onto the drawing area with the help +of the chart context object. + +```rust +use plotters::prelude::*; +fn main() -> Result<(), Box<dyn std::error::Error>> { + let root = BitMapBackend::new("plotters-doc-data/5.png", (640, 480)).into_drawing_area(); + root.fill(&WHITE); + let root = root.margin(10, 10, 10, 10); + // After this point, we should be able to draw construct a chart context + let mut chart = ChartBuilder::on(&root) + // Set the caption of the chart + .caption("This is our first plot", ("sans-serif", 40).into_font()) + // Set the size of the label region + .x_label_area_size(20) + .y_label_area_size(40) + // Finally attach a coordinate on the drawing area and make a chart context + .build_cartesian_2d(0f32..10f32, 0f32..10f32)?; + + // Then we can draw a mesh + chart + .configure_mesh() + // We can customize the maximum number of labels allowed for each axis + .x_labels(5) + .y_labels(5) + // We can also change the format of the label text + .y_label_formatter(&|x| format!("{:.3}", x)) + .draw()?; + + // And we can draw something in the drawing area + chart.draw_series(LineSeries::new( + vec![(0.0, 0.0), (5.0, 5.0), (8.0, 7.0)], + &RED, + ))?; + // Similarly, we can draw point series + chart.draw_series(PointSeries::of_element( + vec![(0.0, 0.0), (5.0, 5.0), (8.0, 7.0)], + 5, + &RED, + &|c, s, st| { + return EmptyElement::at(c) // We want to construct a composed element on-the-fly + + Circle::new((0,0),s,st.filled()) // At this point, the new pixel coordinate is established + + Text::new(format!("{:?}", c), (10, 0), ("sans-serif", 10).into_font()); + }, + ))?; + root.present()?; + Ok(()) +} +``` + +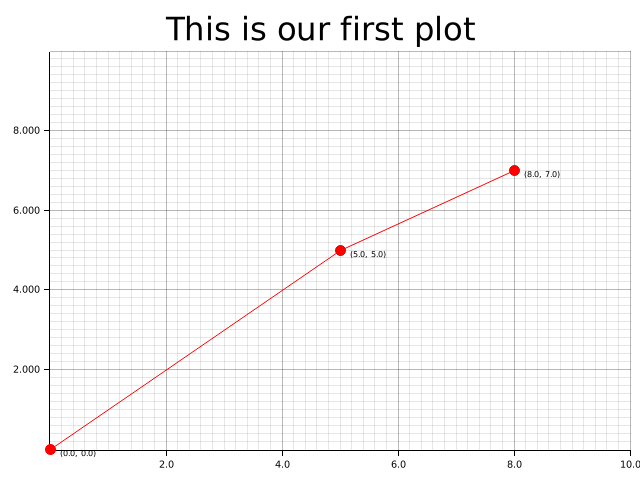 + +## Misc + +### Development Version + +Find the latest development version of Plotters on [GitHub](https://github.com/38/plotters.git). +Clone the repository and learn more about the Plotters API and ways to contribute. Your help is needed! + +If you want to add the development version of Plotters to your project, add the following to your `Cargo.toml`: + +```toml +[dependencies] +plotters = { git = "https://github.com/38/plotters.git" } +``` + +### Reducing Depending Libraries && Turning Off Backends +Plotters now supports use features to control the backend dependencies. By default, `BitMapBackend` and `SVGBackend` are supported, +use `default_features = false` in the dependency description in `Cargo.toml` and you can cherry-pick the backend implementations. + +- `svg` Enable the `SVGBackend` +- `bitmap` Enable the `BitMapBackend` + +For example, the following dependency description would avoid compiling with bitmap support: + +```toml +[dependencies] +plotters = { git = "https://github.com/38/plotters.git", default_features = false, features = ["svg"] } +``` + +The library also allows consumers to make use of the [`Palette`](https://crates.io/crates/palette/) crate's color types by default. +This behavior can also be turned off by setting `default_features = false`. + +### List of Features + +This is the full list of features that is defined by `Plotters` crate. +Use `default_features = false` to disable those default enabled features, +and then you should be able to cherry-pick what features you want to include into `Plotters` crate. +By doing so, you can minimize the number of dependencies down to only `itertools` and compile time is less than 6s. + +The following list is a complete list of features that can be opt in and out. + +- Tier 1 drawing backends + +| Name | Description | Additional Dependency |Default?| +|---------|--------------|--------|------------| +| bitmap\_encoder | Allow `BitMapBackend` save the result to bitmap files | image, rusttype, font-kit | Yes | +| svg\_backend | Enable `SVGBackend` Support | None | Yes | +| bitmap\_gif| Opt-in GIF animation Rendering support for `BitMapBackend`, implies `bitmap` enabled | gif | Yes | + +- Font manipulation features + +| Name | Description | Additional Dependency |Default?| +|---------|--------------|--------|------------| +| ttf | Allows TrueType font support | rusttype, font-kit | Yes | + +- Coordinate features + +| Name | Description | Additional Dependency |Default?| +|---------|--------------|--------|------------| +| datetime | Enable the date and time coordinate support | chrono | Yes | + +- Element, series and util functions + +| Name | Description | Additional Dependency |Default?| +|---------|--------------|--------|------------| +| errorbar | The errorbar element support | None | Yes | +| candlestick | The candlestick element support | None | Yes | +| boxplot | The boxplot element support | None | Yes | +| area\_series | The area series support | None | Yes | +| line\_series | The line series support | None | Yes | +| histogram | The histogram series support | None | Yes | +| point\_series| The point series support | None | Yes | + +- Misc + +| Name | Description | Additional Dependency |Default?| +|---------|--------------|--------|------------| +| deprecated\_items | This feature allows use of deprecated items which is going to be removed in the future | None | Yes | +| debug | Enable the code used for debugging | None | No | + + +## FAQ List + +* Why does the WASM example break on my machine ? + + The WASM example requires using `wasm32` target to build. Using `cargo build` is likely to use the default target + which in most of the case is any of the x86 target. Thus you need add `--target=wasm32-unknown-unknown` in the cargo + parameter list to build it. + +* How to draw text/circle/point/rectangle/... on the top of chart ? + + As you may realized, Plotters is a drawing library rather than a traditional data plotting library, + you have the freedom to draw anything you want on the drawing area. + Use `DrawingArea::draw` to draw any element on the drawing area. + +* Where can I find the backend code ? + + Since Plotters 0.3, all drawing backends are independent crate from the main Plotters crate. + Use the following link to find the backend code: + + - [Bitmap Backend](https://github.com/plotters-rs/plotters-bitmap.git) + - [SVG Backend](https://github.com/plotters-rs/plotters-svg.git) + - [HTML5 Canvas Backend](https://github.com/plotters-rs/plotters-canvas.git) + - [GTK/Cairo Backend](https://github.com/plotters-rs/plotters-cairo.git) + +* How to check if a backend writes file successfully ? + + The behavior of Plotters backend is consistent with standard library. + When the backend instance is being dropped, [`crate::drawing::DrawingArea::present()`] or `Backend::present()` is called automatically + whenever is needed. When the `present()` method is called from `drop`, any error will be silently ignored. + + In the case that error handling is important, you need manually call the `present()` method before the backend gets dropped. + For more information, please see the examples. + + diff --git a/vendor/plotters/benches/benches/data.rs b/vendor/plotters/benches/benches/data.rs new file mode 100644 index 000000000..22dc9f4d4 --- /dev/null +++ b/vendor/plotters/benches/benches/data.rs @@ -0,0 +1,37 @@ +use criterion::{criterion_group, Criterion}; +use plotters::data::Quartiles; + +struct Lcg { + state: u32, +} + +impl Lcg { + fn new() -> Lcg { + Lcg { state: 0 } + } +} + +impl Iterator for Lcg { + type Item = u32; + + fn next(&mut self) -> Option<u32> { + self.state = self.state.wrapping_mul(1_103_515_245).wrapping_add(12_345); + self.state %= 1 << 31; + Some(self.state) + } +} + +fn quartiles_calc(c: &mut Criterion) { + let src: Vec<u32> = Lcg::new().take(100000).collect(); + c.bench_function("data::quartiles_calc", |b| { + b.iter(|| { + Quartiles::new(&src); + }) + }); +} + +criterion_group! { + name = quartiles_group; + config = Criterion::default().sample_size(10); + targets = quartiles_calc +} diff --git a/vendor/plotters/benches/benches/mod.rs b/vendor/plotters/benches/benches/mod.rs new file mode 100644 index 000000000..7a345e4c6 --- /dev/null +++ b/vendor/plotters/benches/benches/mod.rs @@ -0,0 +1 @@ +pub mod data; diff --git a/vendor/plotters/benches/main.rs b/vendor/plotters/benches/main.rs new file mode 100644 index 000000000..f1975f5f0 --- /dev/null +++ b/vendor/plotters/benches/main.rs @@ -0,0 +1,7 @@ +use criterion::criterion_main; + +mod benches; + +criterion_main! { + benches::data::quartiles_group +} diff --git a/vendor/plotters/clippy.toml b/vendor/plotters/clippy.toml new file mode 100644 index 000000000..178520091 --- /dev/null +++ b/vendor/plotters/clippy.toml @@ -0,0 +1 @@ +msrv = "1.56"
\ No newline at end of file diff --git a/vendor/plotters/examples/3d-plot.rs b/vendor/plotters/examples/3d-plot.rs new file mode 100644 index 000000000..af40cc29e --- /dev/null +++ b/vendor/plotters/examples/3d-plot.rs @@ -0,0 +1,62 @@ +use plotters::prelude::*; +const OUT_FILE_NAME: &'static str = "plotters-doc-data/3d-plot.svg"; +fn main() -> Result<(), Box<dyn std::error::Error>> { + let area = SVGBackend::new(OUT_FILE_NAME, (1024, 760)).into_drawing_area(); + + area.fill(&WHITE)?; + + let x_axis = (-3.0..3.0).step(0.1); + let z_axis = (-3.0..3.0).step(0.1); + + let mut chart = ChartBuilder::on(&area) + .caption(format!("3D Plot Test"), ("sans", 20)) + .build_cartesian_3d(x_axis.clone(), -3.0..3.0, z_axis.clone())?; + + chart.with_projection(|mut pb| { + pb.yaw = 0.5; + pb.scale = 0.9; + pb.into_matrix() + }); + + chart + .configure_axes() + .light_grid_style(BLACK.mix(0.15)) + .max_light_lines(3) + .draw()?; + + chart + .draw_series( + SurfaceSeries::xoz( + (-30..30).map(|f| f as f64 / 10.0), + (-30..30).map(|f| f as f64 / 10.0), + |x, z| (x * x + z * z).cos(), + ) + .style(BLUE.mix(0.2).filled()), + )? + .label("Surface") + .legend(|(x, y)| Rectangle::new([(x + 5, y - 5), (x + 15, y + 5)], BLUE.mix(0.5).filled())); + + chart + .draw_series(LineSeries::new( + (-100..100) + .map(|y| y as f64 / 40.0) + .map(|y| ((y * 10.0).sin(), y, (y * 10.0).cos())), + &BLACK, + ))? + .label("Line") + .legend(|(x, y)| PathElement::new(vec![(x, y), (x + 20, y)], &BLACK)); + + chart + .configure_series_labels() + .border_style(&BLACK) + .draw()?; + + // To avoid the IO failure being ignored silently, we manually call the present function + area.present().expect("Unable to write result to file, please make sure 'plotters-doc-data' dir exists under current dir"); + println!("Result has been saved to {}", OUT_FILE_NAME); + Ok(()) +} +#[test] +fn entry_point() { + main().unwrap() +} diff --git a/vendor/plotters/examples/3d-plot2.rs b/vendor/plotters/examples/3d-plot2.rs new file mode 100644 index 000000000..0b5ca2131 --- /dev/null +++ b/vendor/plotters/examples/3d-plot2.rs @@ -0,0 +1,56 @@ +use plotters::prelude::*; +fn pdf(x: f64, y: f64) -> f64 { + const SDX: f64 = 0.1; + const SDY: f64 = 0.1; + const A: f64 = 5.0; + let x = x as f64 / 10.0; + let y = y as f64 / 10.0; + A * (-x * x / 2.0 / SDX / SDX - y * y / 2.0 / SDY / SDY).exp() +} + +const OUT_FILE_NAME: &'static str = "plotters-doc-data/3d-plot2.gif"; +fn main() -> Result<(), Box<dyn std::error::Error>> { + let root = BitMapBackend::gif(OUT_FILE_NAME, (600, 400), 100)?.into_drawing_area(); + + for pitch in 0..157 { + root.fill(&WHITE)?; + + let mut chart = ChartBuilder::on(&root) + .caption("2D Gaussian PDF", ("sans-serif", 20)) + .build_cartesian_3d(-3.0..3.0, 0.0..6.0, -3.0..3.0)?; + chart.with_projection(|mut p| { + p.pitch = 1.57 - (1.57 - pitch as f64 / 50.0).abs(); + p.scale = 0.7; + p.into_matrix() // build the projection matrix + }); + + chart + .configure_axes() + .light_grid_style(BLACK.mix(0.15)) + .max_light_lines(3) + .draw()?; + + chart.draw_series( + SurfaceSeries::xoz( + (-15..=15).map(|x| x as f64 / 5.0), + (-15..=15).map(|x| x as f64 / 5.0), + pdf, + ) + .style_func(&|&v| { + (&HSLColor(240.0 / 360.0 - 240.0 / 360.0 * v / 5.0, 1.0, 0.7)).into() + }), + )?; + + root.present()?; + } + + // To avoid the IO failure being ignored silently, we manually call the present function + root.present().expect("Unable to write result to file, please make sure 'plotters-doc-data' dir exists under current dir"); + println!("Result has been saved to {}", OUT_FILE_NAME); + + Ok(()) +} +#[test] +fn entry_point() { + main().unwrap() +} diff --git a/vendor/plotters/examples/README.md b/vendor/plotters/examples/README.md new file mode 100644 index 000000000..b6dd1666a --- /dev/null +++ b/vendor/plotters/examples/README.md @@ -0,0 +1,19 @@ +# plotters examples + +* The example projects have been moved to independent git repository under plotters-rs organization, please check the [Example Project](#example-project) section for the links. + +To run any example, from within the repo, run `cargo run --example <example_name>` where `<example name>` is the name of the file without the `.rs` extension. + +All the examples assumes the directory [plotters-doc-data](https://github.com/38/plotters-doc-data) exists, otherwise those example crashs. + +The output of these example files are used to generate the [plotters-doc-data](https://github.com/38/plotters-doc-data) repo that populates the sample images in the main README. +We also rely on the output of examples to detect potential layout changes. +For that reason, **they must be run with `cargo` from within the repo, or you must change the output filename in the example code to a directory that exists.** + +The examples that have their own directories and `Cargo.toml` files work differently. They are run the same way you would a standalone project. + +## Example Projects + +- For WebAssembly sample project, check [plotters-wasm-demo](https://github.com/plotters-rs/plotters-wasm-demo) +- For Frame Buffer, Realtime Readering example, check [plotters-minifb-demo](https://github.com/plotters-rs/plotters-minifb-demo) +- For GTK integration, check [plotters-gtk-demo](https://github.com/plotters-rs/plotters-gtk-demo) diff --git a/vendor/plotters/examples/animation.rs b/vendor/plotters/examples/animation.rs new file mode 100644 index 000000000..dab7d451d --- /dev/null +++ b/vendor/plotters/examples/animation.rs @@ -0,0 +1,65 @@ +use plotters::prelude::*; + +fn snowflake_iter(points: &[(f64, f64)]) -> Vec<(f64, f64)> { + let mut ret = vec![]; + for i in 0..points.len() { + let (start, end) = (points[i], points[(i + 1) % points.len()]); + let t = ((end.0 - start.0) / 3.0, (end.1 - start.1) / 3.0); + let s = ( + t.0 * 0.5 - t.1 * (0.75f64).sqrt(), + t.1 * 0.5 + (0.75f64).sqrt() * t.0, + ); + ret.push(start); + ret.push((start.0 + t.0, start.1 + t.1)); + ret.push((start.0 + t.0 + s.0, start.1 + t.1 + s.1)); + ret.push((start.0 + t.0 * 2.0, start.1 + t.1 * 2.0)); + } + ret +} + +const OUT_FILE_NAME: &'static str = "plotters-doc-data/animation.gif"; +fn main() -> Result<(), Box<dyn std::error::Error>> { + let root = BitMapBackend::gif(OUT_FILE_NAME, (800, 600), 1_000)?.into_drawing_area(); + + for i in 0..8 { + root.fill(&WHITE)?; + + let mut chart = ChartBuilder::on(&root) + .caption( + format!("Koch's Snowflake (n_iter = {})", i), + ("sans-serif", 50), + ) + .build_cartesian_2d(-2.0..2.0, -1.5..1.5)?; + + let mut snowflake_vertices = { + let mut current: Vec<(f64, f64)> = vec![ + (0.0, 1.0), + ((3.0f64).sqrt() / 2.0, -0.5), + (-(3.0f64).sqrt() / 2.0, -0.5), + ]; + for _ in 0..i { + current = snowflake_iter(¤t[..]); + } + current + }; + + chart.draw_series(std::iter::once(Polygon::new( + snowflake_vertices.clone(), + &RED.mix(0.2), + )))?; + + snowflake_vertices.push(snowflake_vertices[0]); + chart.draw_series(std::iter::once(PathElement::new(snowflake_vertices, &RED)))?; + + root.present()?; + } + + println!("Result has been saved to {}", OUT_FILE_NAME); + + Ok(()) +} + +#[test] +fn entry_point() { + main().unwrap() +} diff --git a/vendor/plotters/examples/area-chart.rs b/vendor/plotters/examples/area-chart.rs new file mode 100644 index 000000000..5b1a7a5a5 --- /dev/null +++ b/vendor/plotters/examples/area-chart.rs @@ -0,0 +1,54 @@ +use plotters::prelude::*; + +use rand::SeedableRng; +use rand_distr::{Distribution, Normal}; +use rand_xorshift::XorShiftRng; + +const OUT_FILE_NAME: &'static str = "plotters-doc-data/area-chart.png"; +fn main() -> Result<(), Box<dyn std::error::Error>> { + let data: Vec<_> = { + let norm_dist = Normal::new(500.0, 100.0).unwrap(); + let mut x_rand = XorShiftRng::from_seed(*b"MyFragileSeed123"); + let x_iter = norm_dist.sample_iter(&mut x_rand); + x_iter + .filter(|x| *x < 1500.0) + .take(100) + .zip(0..) + .map(|(x, b)| x + (b as f64).powf(1.2)) + .collect() + }; + + let root = BitMapBackend::new(OUT_FILE_NAME, (1024, 768)).into_drawing_area(); + + root.fill(&WHITE)?; + + let mut chart = ChartBuilder::on(&root) + .set_label_area_size(LabelAreaPosition::Left, 60) + .set_label_area_size(LabelAreaPosition::Bottom, 60) + .caption("Area Chart Demo", ("sans-serif", 40)) + .build_cartesian_2d(0..(data.len() - 1), 0.0..1500.0)?; + + chart + .configure_mesh() + .disable_x_mesh() + .disable_y_mesh() + .draw()?; + + chart.draw_series( + AreaSeries::new( + (0..).zip(data.iter()).map(|(x, y)| (x, *y)), + 0.0, + &RED.mix(0.2), + ) + .border_style(&RED), + )?; + + // To avoid the IO failure being ignored silently, we manually call the present function + root.present().expect("Unable to write result to file, please make sure 'plotters-doc-data' dir exists under current dir"); + println!("Result has been saved to {}", OUT_FILE_NAME); + Ok(()) +} +#[test] +fn entry_point() { + main().unwrap() +} diff --git a/vendor/plotters/examples/blit-bitmap.rs b/vendor/plotters/examples/blit-bitmap.rs new file mode 100644 index 000000000..990b25645 --- /dev/null +++ b/vendor/plotters/examples/blit-bitmap.rs @@ -0,0 +1,45 @@ +use plotters::prelude::*; + +use image::{imageops::FilterType, ImageFormat}; + +use std::fs::File; +use std::io::BufReader; + +const OUT_FILE_NAME: &'static str = "plotters-doc-data/blit-bitmap.png"; + +fn main() -> Result<(), Box<dyn std::error::Error>> { + let root = BitMapBackend::new(OUT_FILE_NAME, (1024, 768)).into_drawing_area(); + root.fill(&WHITE)?; + + let mut chart = ChartBuilder::on(&root) + .caption("Bitmap Example", ("sans-serif", 30)) + .margin(5) + .set_label_area_size(LabelAreaPosition::Left, 40) + .set_label_area_size(LabelAreaPosition::Bottom, 40) + .build_cartesian_2d(0.0..1.0, 0.0..1.0)?; + + chart.configure_mesh().disable_mesh().draw()?; + + let (w, h) = chart.plotting_area().dim_in_pixel(); + let image = image::load( + BufReader::new( + File::open("plotters-doc-data/cat.png").map_err(|e| { + eprintln!("Unable to open file plotters-doc-data.png, please make sure you have clone this repo with --recursive"); + e + })?), + ImageFormat::Png, + )? + .resize_exact(w - w / 10, h - h / 10, FilterType::Nearest); + + let elem: BitMapElement<_> = ((0.05, 0.95), image).into(); + + chart.draw_series(std::iter::once(elem))?; + // To avoid the IO failure being ignored silently, we manually call the present function + root.present().expect("Unable to write result to file, please make sure 'plotters-doc-data' dir exists under current dir"); + println!("Result has been saved to {}", OUT_FILE_NAME); + Ok(()) +} +#[test] +fn entry_point() { + main().unwrap() +} diff --git a/vendor/plotters/examples/boxplot.rs b/vendor/plotters/examples/boxplot.rs new file mode 100644 index 000000000..6e46db40a --- /dev/null +++ b/vendor/plotters/examples/boxplot.rs @@ -0,0 +1,229 @@ +use itertools::Itertools; +use plotters::data::fitting_range; +use plotters::prelude::*; +use std::collections::BTreeMap; +use std::collections::HashMap; +use std::env; +use std::fs; +use std::io::{self, prelude::*, BufReader}; + +fn read_data<BR: BufRead>(reader: BR) -> HashMap<(String, String), Vec<f64>> { + let mut ds = HashMap::new(); + for l in reader.lines() { + let line = l.unwrap(); + let tuple: Vec<&str> = line.split('\t').collect(); + if tuple.len() == 3 { + let key = (String::from(tuple[0]), String::from(tuple[1])); + let entry = ds.entry(key).or_insert_with(Vec::new); + entry.push(tuple[2].parse::<f64>().unwrap()); + } + } + ds +} + +const OUT_FILE_NAME: &'static str = "plotters-doc-data/boxplot.svg"; +fn main() -> Result<(), Box<dyn std::error::Error>> { + let root = SVGBackend::new(OUT_FILE_NAME, (1024, 768)).into_drawing_area(); + root.fill(&WHITE)?; + + let root = root.margin(5, 5, 5, 5); + + let (upper, lower) = root.split_vertically(512); + + let args: Vec<String> = env::args().collect(); + + let ds = if args.len() < 2 { + read_data(io::Cursor::new(get_data())) + } else { + let file = fs::File::open(&args[1])?; + read_data(BufReader::new(file)) + }; + let dataset: Vec<(String, String, Quartiles)> = ds + .iter() + .map(|(k, v)| (k.0.clone(), k.1.clone(), Quartiles::new(&v))) + .collect(); + + let host_list: Vec<_> = dataset + .iter() + .unique_by(|x| x.0.clone()) + .sorted_by(|a, b| b.2.median().partial_cmp(&a.2.median()).unwrap()) + .map(|x| x.0.clone()) + .collect(); + + let mut colors = (0..).map(Palette99::pick); + let mut offsets = (-12..).step_by(24); + let mut series = BTreeMap::new(); + for x in dataset.iter() { + let entry = series + .entry(x.1.clone()) + .or_insert_with(|| (Vec::new(), colors.next().unwrap(), offsets.next().unwrap())); + entry.0.push((x.0.clone(), &x.2)); + } + + let values: Vec<f32> = dataset + .iter() + .map(|x| x.2.values().to_vec()) + .flatten() + .collect(); + let values_range = fitting_range(values.iter()); + + let mut chart = ChartBuilder::on(&upper) + .x_label_area_size(40) + .y_label_area_size(80) + .caption("Ping Boxplot", ("sans-serif", 20)) + .build_cartesian_2d( + values_range.start - 1.0..values_range.end + 1.0, + host_list[..].into_segmented(), + )?; + + chart + .configure_mesh() + .x_desc("Ping, ms") + .y_desc("Host") + .y_labels(host_list.len()) + .light_line_style(&WHITE) + .draw()?; + + for (label, (values, style, offset)) in &series { + chart + .draw_series(values.iter().map(|x| { + Boxplot::new_horizontal(SegmentValue::CenterOf(&x.0), &x.1) + .width(20) + .whisker_width(0.5) + .style(style) + .offset(*offset) + }))? + .label(label) + .legend(move |(x, y)| Rectangle::new([(x, y - 6), (x + 12, y + 6)], style.filled())); + } + chart + .configure_series_labels() + .position(SeriesLabelPosition::UpperRight) + .background_style(WHITE.filled()) + .border_style(&BLACK.mix(0.5)) + .legend_area_size(22) + .draw()?; + + let drawing_areas = lower.split_evenly((1, 2)); + let (left, right) = (&drawing_areas[0], &drawing_areas[1]); + + let quartiles_a = Quartiles::new(&[ + 6.0, 7.0, 15.9, 36.9, 39.0, 40.0, 41.0, 42.0, 43.0, 47.0, 49.0, + ]); + let quartiles_b = Quartiles::new(&[16.0, 17.0, 50.0, 60.0, 40.2, 41.3, 42.7, 43.3, 47.0]); + + let ab_axis = ["a", "b"]; + + let values_range = fitting_range( + quartiles_a + .values() + .iter() + .chain(quartiles_b.values().iter()), + ); + let mut chart = ChartBuilder::on(&left) + .x_label_area_size(40) + .y_label_area_size(40) + .caption("Vertical Boxplot", ("sans-serif", 20)) + .build_cartesian_2d( + ab_axis[..].into_segmented(), + values_range.start - 10.0..values_range.end + 10.0, + )?; + + chart.configure_mesh().light_line_style(&WHITE).draw()?; + chart.draw_series(vec![ + Boxplot::new_vertical(SegmentValue::CenterOf(&"a"), &quartiles_a), + Boxplot::new_vertical(SegmentValue::CenterOf(&"b"), &quartiles_b), + ])?; + + let mut chart = ChartBuilder::on(&right) + .x_label_area_size(40) + .y_label_area_size(40) + .caption("Horizontal Boxplot", ("sans-serif", 20)) + .build_cartesian_2d(-30f32..90f32, 0..3)?; + + chart.configure_mesh().light_line_style(&WHITE).draw()?; + chart.draw_series(vec![ + Boxplot::new_horizontal(1, &quartiles_a), + Boxplot::new_horizontal(2, &Quartiles::new(&[30])), + ])?; + + // To avoid the IO failure being ignored silently, we manually call the present function + root.present().expect("Unable to write result to file, please make sure 'plotters-doc-data' dir exists under current dir"); + println!("Result has been saved to {}", OUT_FILE_NAME); + Ok(()) +} + +fn get_data() -> String { + String::from( + " + 1.1.1.1 wireless 41.6 + 1.1.1.1 wireless 32.5 + 1.1.1.1 wireless 33.1 + 1.1.1.1 wireless 32.3 + 1.1.1.1 wireless 36.7 + 1.1.1.1 wireless 32.0 + 1.1.1.1 wireless 33.1 + 1.1.1.1 wireless 32.0 + 1.1.1.1 wireless 32.9 + 1.1.1.1 wireless 32.7 + 1.1.1.1 wireless 34.5 + 1.1.1.1 wireless 36.5 + 1.1.1.1 wireless 31.9 + 1.1.1.1 wireless 33.7 + 1.1.1.1 wireless 32.6 + 1.1.1.1 wireless 35.1 + 8.8.8.8 wireless 42.3 + 8.8.8.8 wireless 32.9 + 8.8.8.8 wireless 32.9 + 8.8.8.8 wireless 34.3 + 8.8.8.8 wireless 32.0 + 8.8.8.8 wireless 33.3 + 8.8.8.8 wireless 31.5 + 8.8.8.8 wireless 33.1 + 8.8.8.8 wireless 33.2 + 8.8.8.8 wireless 35.9 + 8.8.8.8 wireless 42.3 + 8.8.8.8 wireless 34.1 + 8.8.8.8 wireless 34.2 + 8.8.8.8 wireless 34.2 + 8.8.8.8 wireless 32.4 + 8.8.8.8 wireless 33.0 + 1.1.1.1 wired 31.8 + 1.1.1.1 wired 28.6 + 1.1.1.1 wired 29.4 + 1.1.1.1 wired 28.8 + 1.1.1.1 wired 28.2 + 1.1.1.1 wired 28.8 + 1.1.1.1 wired 28.4 + 1.1.1.1 wired 28.6 + 1.1.1.1 wired 28.3 + 1.1.1.1 wired 28.5 + 1.1.1.1 wired 28.5 + 1.1.1.1 wired 28.5 + 1.1.1.1 wired 28.4 + 1.1.1.1 wired 28.6 + 1.1.1.1 wired 28.4 + 1.1.1.1 wired 28.9 + 8.8.8.8 wired 33.3 + 8.8.8.8 wired 28.4 + 8.8.8.8 wired 28.7 + 8.8.8.8 wired 29.1 + 8.8.8.8 wired 29.6 + 8.8.8.8 wired 28.9 + 8.8.8.8 wired 28.6 + 8.8.8.8 wired 29.3 + 8.8.8.8 wired 28.6 + 8.8.8.8 wired 29.1 + 8.8.8.8 wired 28.7 + 8.8.8.8 wired 28.3 + 8.8.8.8 wired 28.3 + 8.8.8.8 wired 28.6 + 8.8.8.8 wired 29.4 + 8.8.8.8 wired 33.1 +", + ) +} +#[test] +fn entry_point() { + main().unwrap() +} diff --git a/vendor/plotters/examples/chart.rs b/vendor/plotters/examples/chart.rs new file mode 100644 index 000000000..acdddc3c1 --- /dev/null +++ b/vendor/plotters/examples/chart.rs @@ -0,0 +1,94 @@ +use plotters::prelude::*; + +const OUT_FILE_NAME: &'static str = "plotters-doc-data/sample.png"; +fn main() -> Result<(), Box<dyn std::error::Error>> { + let root_area = BitMapBackend::new(OUT_FILE_NAME, (1024, 768)).into_drawing_area(); + + root_area.fill(&WHITE)?; + + let root_area = root_area.titled("Image Title", ("sans-serif", 60))?; + + let (upper, lower) = root_area.split_vertically(512); + + let x_axis = (-3.4f32..3.4).step(0.1); + + let mut cc = ChartBuilder::on(&upper) + .margin(5) + .set_all_label_area_size(50) + .caption("Sine and Cosine", ("sans-serif", 40)) + .build_cartesian_2d(-3.4f32..3.4, -1.2f32..1.2f32)?; + + cc.configure_mesh() + .x_labels(20) + .y_labels(10) + .disable_mesh() + .x_label_formatter(&|v| format!("{:.1}", v)) + .y_label_formatter(&|v| format!("{:.1}", v)) + .draw()?; + + cc.draw_series(LineSeries::new(x_axis.values().map(|x| (x, x.sin())), &RED))? + .label("Sine") + .legend(|(x, y)| PathElement::new(vec![(x, y), (x + 20, y)], &RED)); + + cc.draw_series(LineSeries::new( + x_axis.values().map(|x| (x, x.cos())), + &BLUE, + ))? + .label("Cosine") + .legend(|(x, y)| PathElement::new(vec![(x, y), (x + 20, y)], &BLUE)); + + cc.configure_series_labels().border_style(&BLACK).draw()?; + + /* + // It's possible to use a existing pointing element + cc.draw_series(PointSeries::<_, _, Circle<_>>::new( + (-3.0f32..2.1f32).step(1.0).values().map(|x| (x, x.sin())), + 5, + Into::<ShapeStyle>::into(&RGBColor(255,0,0)).filled(), + ))?;*/ + + // Otherwise you can use a function to construct your pointing element yourself + cc.draw_series(PointSeries::of_element( + (-3.0f32..2.1f32).step(1.0).values().map(|x| (x, x.sin())), + 5, + ShapeStyle::from(&RED).filled(), + &|coord, size, style| { + EmptyElement::at(coord) + + Circle::new((0, 0), size, style) + + Text::new(format!("{:?}", coord), (0, 15), ("sans-serif", 15)) + }, + ))?; + + let drawing_areas = lower.split_evenly((1, 2)); + + for (drawing_area, idx) in drawing_areas.iter().zip(1..) { + let mut cc = ChartBuilder::on(&drawing_area) + .x_label_area_size(30) + .y_label_area_size(30) + .margin_right(20) + .caption(format!("y = x^{}", 1 + 2 * idx), ("sans-serif", 40)) + .build_cartesian_2d(-1f32..1f32, -1f32..1f32)?; + cc.configure_mesh() + .x_labels(5) + .y_labels(3) + .max_light_lines(4) + .draw()?; + + cc.draw_series(LineSeries::new( + (-1f32..1f32) + .step(0.01) + .values() + .map(|x| (x, x.powf(idx as f32 * 2.0 + 1.0))), + &BLUE, + ))?; + } + + // To avoid the IO failure being ignored silently, we manually call the present function + root_area.present().expect("Unable to write result to file, please make sure 'plotters-doc-data' dir exists under current dir"); + println!("Result has been saved to {}", OUT_FILE_NAME); + Ok(()) +} +#[test] +fn entry_point() { + main().unwrap() +} diff --git a/vendor/plotters/examples/console.rs b/vendor/plotters/examples/console.rs new file mode 100644 index 000000000..feba0956b --- /dev/null +++ b/vendor/plotters/examples/console.rs @@ -0,0 +1,200 @@ +use plotters::prelude::*; +use plotters::style::text_anchor::{HPos, VPos}; +use plotters_backend::{ + BackendColor, BackendStyle, BackendTextStyle, DrawingBackend, DrawingErrorKind, +}; +use std::error::Error; + +#[derive(Copy, Clone)] +enum PixelState { + Empty, + HLine, + VLine, + Cross, + Pixel, + Text(char), + Circle(bool), +} + +impl PixelState { + fn to_char(self) -> char { + match self { + Self::Empty => ' ', + Self::HLine => '-', + Self::VLine => '|', + Self::Cross => '+', + Self::Pixel => '.', + Self::Text(c) => c, + Self::Circle(filled) => { + if filled { + '@' + } else { + 'O' + } + } + } + } + + fn update(&mut self, new_state: PixelState) { + let next_state = match (*self, new_state) { + (Self::HLine, Self::VLine) => Self::Cross, + (Self::VLine, Self::HLine) => Self::Cross, + (_, Self::Circle(what)) => Self::Circle(what), + (Self::Circle(what), _) => Self::Circle(what), + (_, Self::Pixel) => Self::Pixel, + (Self::Pixel, _) => Self::Pixel, + (_, new) => new, + }; + + *self = next_state; + } +} + +pub struct TextDrawingBackend(Vec<PixelState>); + +impl DrawingBackend for TextDrawingBackend { + type ErrorType = std::io::Error; + + fn get_size(&self) -> (u32, u32) { + (100, 30) + } + + fn ensure_prepared(&mut self) -> Result<(), DrawingErrorKind<std::io::Error>> { + Ok(()) + } + + fn present(&mut self) -> Result<(), DrawingErrorKind<std::io::Error>> { + for r in 0..30 { + let mut buf = String::new(); + for c in 0..100 { + buf.push(self.0[r * 100 + c].to_char()); + } + println!("{}", buf); + } + + Ok(()) + } + + fn draw_pixel( + &mut self, + pos: (i32, i32), + color: BackendColor, + ) -> Result<(), DrawingErrorKind<std::io::Error>> { + if color.alpha > 0.3 { + self.0[(pos.1 * 100 + pos.0) as usize].update(PixelState::Pixel); + } + Ok(()) + } + + fn draw_line<S: BackendStyle>( + &mut self, + from: (i32, i32), + to: (i32, i32), + style: &S, + ) -> Result<(), DrawingErrorKind<Self::ErrorType>> { + if from.0 == to.0 { + let x = from.0; + let y0 = from.1.min(to.1); + let y1 = from.1.max(to.1); + for y in y0..y1 { + self.0[(y * 100 + x) as usize].update(PixelState::VLine); + } + return Ok(()); + } + + if from.1 == to.1 { + let y = from.1; + let x0 = from.0.min(to.0); + let x1 = from.0.max(to.0); + for x in x0..x1 { + self.0[(y * 100 + x) as usize].update(PixelState::HLine); + } + return Ok(()); + } + + plotters_backend::rasterizer::draw_line(self, from, to, style) + } + + fn estimate_text_size<S: BackendTextStyle>( + &self, + text: &str, + _: &S, + ) -> Result<(u32, u32), DrawingErrorKind<Self::ErrorType>> { + Ok((text.len() as u32, 1)) + } + + fn draw_text<S: BackendTextStyle>( + &mut self, + text: &str, + style: &S, + pos: (i32, i32), + ) -> Result<(), DrawingErrorKind<Self::ErrorType>> { + let (width, height) = self.estimate_text_size(text, style)?; + let (width, height) = (width as i32, height as i32); + let dx = match style.anchor().h_pos { + HPos::Left => 0, + HPos::Right => -width, + HPos::Center => -width / 2, + }; + let dy = match style.anchor().v_pos { + VPos::Top => 0, + VPos::Center => -height / 2, + VPos::Bottom => -height, + }; + let offset = (pos.1 + dy).max(0) * 100 + (pos.0 + dx).max(0); + for (idx, chr) in (offset..).zip(text.chars()) { + self.0[idx as usize].update(PixelState::Text(chr)); + } + Ok(()) + } +} + +fn draw_chart<DB: DrawingBackend>( + b: DrawingArea<DB, plotters::coord::Shift>, +) -> Result<(), Box<dyn Error>> +where + DB::ErrorType: 'static, +{ + let mut chart = ChartBuilder::on(&b) + .margin(1) + .caption("Sine and Cosine", ("sans-serif", (10).percent_height())) + .set_label_area_size(LabelAreaPosition::Left, (5i32).percent_width()) + .set_label_area_size(LabelAreaPosition::Bottom, (10i32).percent_height()) + .build_cartesian_2d(-std::f64::consts::PI..std::f64::consts::PI, -1.2..1.2)?; + + chart + .configure_mesh() + .disable_x_mesh() + .disable_y_mesh() + .draw()?; + + chart.draw_series(LineSeries::new( + (-314..314).map(|x| x as f64 / 100.0).map(|x| (x, x.sin())), + &RED, + ))?; + + chart.draw_series(LineSeries::new( + (-314..314).map(|x| x as f64 / 100.0).map(|x| (x, x.cos())), + &RED, + ))?; + + b.present()?; + + Ok(()) +} + +const OUT_FILE_NAME: &'static str = "plotters-doc-data/console-example.png"; +fn main() -> Result<(), Box<dyn Error>> { + draw_chart(TextDrawingBackend(vec![PixelState::Empty; 5000]).into_drawing_area())?; + let b = BitMapBackend::new(OUT_FILE_NAME, (1024, 768)).into_drawing_area(); + b.fill(&WHITE)?; + draw_chart(b)?; + + println!("Image result has been saved to {}", OUT_FILE_NAME); + + Ok(()) +} +#[test] +fn entry_point() { + main().unwrap() +} diff --git a/vendor/plotters/examples/customized_coord.rs b/vendor/plotters/examples/customized_coord.rs new file mode 100644 index 000000000..cb3a18f03 --- /dev/null +++ b/vendor/plotters/examples/customized_coord.rs @@ -0,0 +1,54 @@ +use plotters::{ + coord::ranged1d::{KeyPointHint, NoDefaultFormatting, ValueFormatter}, + prelude::*, +}; +const OUT_FILE_NAME: &'static str = "plotters-doc-data/customized_coord.svg"; + +struct CustomizedX(u32); + +impl Ranged for CustomizedX { + type ValueType = u32; + type FormatOption = NoDefaultFormatting; + fn map(&self, value: &Self::ValueType, limit: (i32, i32)) -> i32 { + let size = limit.1 - limit.0; + ((*value as f64 / self.0 as f64) * size as f64) as i32 + limit.0 + } + + fn range(&self) -> std::ops::Range<Self::ValueType> { + 0..self.0 + } + + fn key_points<Hint: KeyPointHint>(&self, hint: Hint) -> Vec<Self::ValueType> { + if hint.max_num_points() < (self.0 as usize) { + return vec![]; + } + + (0..self.0).collect() + } +} + +impl ValueFormatter<u32> for CustomizedX { + fn format_ext(&self, value: &u32) -> String { + format!("{} of {}", value, self.0) + } +} + +fn main() -> Result<(), Box<dyn std::error::Error>> { + let area = SVGBackend::new(OUT_FILE_NAME, (1024, 760)).into_drawing_area(); + area.fill(&WHITE)?; + + let mut chart = ChartBuilder::on(&area) + .set_all_label_area_size(50) + .build_cartesian_2d(CustomizedX(7), 0.0..10.0)?; + + chart.configure_mesh().draw()?; + + area.present().expect("Unable to write result to file, please make sure 'plotters-doc-data' dir exists under current dir"); + println!("Result has been saved to {}", OUT_FILE_NAME); + Ok(()) +} + +#[test] +fn entry_point() { + main().unwrap() +} diff --git a/vendor/plotters/examples/errorbar.rs b/vendor/plotters/examples/errorbar.rs new file mode 100644 index 000000000..75c5dbea0 --- /dev/null +++ b/vendor/plotters/examples/errorbar.rs @@ -0,0 +1,98 @@ +use plotters::prelude::*; + +use rand::SeedableRng; +use rand_distr::{Distribution, Normal}; +use rand_xorshift::XorShiftRng; + +use itertools::Itertools; + +use num_traits::sign::Signed; + +const OUT_FILE_NAME: &'static str = "plotters-doc-data/errorbar.png"; +fn main() -> Result<(), Box<dyn std::error::Error>> { + let data = generate_random_data(); + let down_sampled = down_sample(&data[..]); + + let root = BitMapBackend::new(OUT_FILE_NAME, (1024, 768)).into_drawing_area(); + + root.fill(&WHITE)?; + + let mut chart = ChartBuilder::on(&root) + .caption("Linear Function with Noise", ("sans-serif", 60)) + .margin(10) + .set_label_area_size(LabelAreaPosition::Left, 40) + .set_label_area_size(LabelAreaPosition::Bottom, 40) + .build_cartesian_2d(-10f64..10f64, -10f64..10f64)?; + + chart.configure_mesh().draw()?; + + chart + .draw_series(LineSeries::new(data, &GREEN.mix(0.3)))? + .label("Raw Data") + .legend(|(x, y)| PathElement::new(vec![(x, y), (x + 20, y)], &GREEN)); + + chart.draw_series(LineSeries::new( + down_sampled.iter().map(|(x, _, y, _)| (*x, *y)), + &BLUE, + ))?; + + chart + .draw_series( + down_sampled.iter().map(|(x, yl, ym, yh)| { + ErrorBar::new_vertical(*x, *yl, *ym, *yh, BLUE.filled(), 20) + }), + )? + .label("Down-sampled") + .legend(|(x, y)| PathElement::new(vec![(x, y), (x + 20, y)], &BLUE)); + + chart + .configure_series_labels() + .background_style(WHITE.filled()) + .draw()?; + + // To avoid the IO failure being ignored silently, we manually call the present function + root.present().expect("Unable to write result to file, please make sure 'plotters-doc-data' dir exists under current dir"); + println!("Result has been saved to {}", OUT_FILE_NAME); + + Ok(()) +} + +fn generate_random_data() -> Vec<(f64, f64)> { + let norm_dist = Normal::new(0.0, 1.0).unwrap(); + let mut x_rand = XorShiftRng::from_seed(*b"MyFragileSeed123"); + let x_iter = norm_dist.sample_iter(&mut x_rand); + x_iter + .take(20000) + .filter(|x| x.abs() <= 4.0) + .zip(-10000..10000) + .map(|(yn, x)| { + ( + x as f64 / 1000.0, + x as f64 / 1000.0 + yn * x as f64 / 10000.0, + ) + }) + .collect() +} + +fn down_sample(data: &[(f64, f64)]) -> Vec<(f64, f64, f64, f64)> { + let down_sampled: Vec<_> = data + .iter() + .group_by(|x| (x.0 * 1.0).round() / 1.0) + .into_iter() + .map(|(x, g)| { + let mut g: Vec<_> = g.map(|(_, y)| *y).collect(); + g.sort_by(|a, b| a.partial_cmp(b).unwrap()); + ( + x, + g[0], + g.iter().sum::<f64>() / g.len() as f64, + g[g.len() - 1], + ) + }) + .collect(); + down_sampled +} +#[test] +fn entry_point() { + main().unwrap() +} diff --git a/vendor/plotters/examples/full_palette.rs b/vendor/plotters/examples/full_palette.rs new file mode 100644 index 000000000..dbd0d4290 --- /dev/null +++ b/vendor/plotters/examples/full_palette.rs @@ -0,0 +1,548 @@ +use plotters::prelude::*; + +const OUT_FILE_NAME: &'static str = "plotters-doc-data/full_palette.png"; + +fn main() -> Result<(), Box<dyn std::error::Error>> { + let root = BitMapBackend::new(OUT_FILE_NAME, (2000, 850)).into_drawing_area(); + + root.fill(&WHITE)?; + + let mut chart = ChartBuilder::on(&root) + .caption("Demonstration of full_palette Colors", ("sans-serif", 50)) + .build_cartesian_2d(-0.5f32..19f32, -1f32..15f32)?; + + use full_palette::*; + let colors = [ + [ + RED, RED_50, RED_100, RED_200, RED_300, RED_400, RED_500, RED_600, RED_700, RED_800, + RED_900, RED_A100, RED_A200, RED_A400, RED_A700, + ], + [ + PINK, PINK_50, PINK_100, PINK_200, PINK_300, PINK_400, PINK_500, PINK_600, PINK_700, + PINK_800, PINK_900, PINK_A100, PINK_A200, PINK_A400, PINK_A700, + ], + [ + PURPLE, + PURPLE_50, + PURPLE_100, + PURPLE_200, + PURPLE_300, + PURPLE_400, + PURPLE_500, + PURPLE_600, + PURPLE_700, + PURPLE_800, + PURPLE_900, + PURPLE_A100, + PURPLE_A200, + PURPLE_A400, + PURPLE_A700, + ], + [ + DEEPPURPLE, + DEEPPURPLE_50, + DEEPPURPLE_100, + DEEPPURPLE_200, + DEEPPURPLE_300, + DEEPPURPLE_400, + DEEPPURPLE_500, + DEEPPURPLE_600, + DEEPPURPLE_700, + DEEPPURPLE_800, + DEEPPURPLE_900, + DEEPPURPLE_A100, + DEEPPURPLE_A200, + DEEPPURPLE_A400, + DEEPPURPLE_A700, + ], + [ + INDIGO, + INDIGO_50, + INDIGO_100, + INDIGO_200, + INDIGO_300, + INDIGO_400, + INDIGO_500, + INDIGO_600, + INDIGO_700, + INDIGO_800, + INDIGO_900, + INDIGO_A100, + INDIGO_A200, + INDIGO_A400, + INDIGO_A700, + ], + [ + BLUE, BLUE_50, BLUE_100, BLUE_200, BLUE_300, BLUE_400, BLUE_500, BLUE_600, BLUE_700, + BLUE_800, BLUE_900, BLUE_A100, BLUE_A200, BLUE_A400, BLUE_A700, + ], + [ + LIGHTBLUE, + LIGHTBLUE_50, + LIGHTBLUE_100, + LIGHTBLUE_200, + LIGHTBLUE_300, + LIGHTBLUE_400, + LIGHTBLUE_500, + LIGHTBLUE_600, + LIGHTBLUE_700, + LIGHTBLUE_800, + LIGHTBLUE_900, + LIGHTBLUE_A100, + LIGHTBLUE_A200, + LIGHTBLUE_A400, + LIGHTBLUE_A700, + ], + [ + CYAN, CYAN_50, CYAN_100, CYAN_200, CYAN_300, CYAN_400, CYAN_500, CYAN_600, CYAN_700, + CYAN_800, CYAN_900, CYAN_A100, CYAN_A200, CYAN_A400, CYAN_A700, + ], + [ + TEAL, TEAL_50, TEAL_100, TEAL_200, TEAL_300, TEAL_400, TEAL_500, TEAL_600, TEAL_700, + TEAL_800, TEAL_900, TEAL_A100, TEAL_A200, TEAL_A400, TEAL_A700, + ], + [ + GREEN, GREEN_50, GREEN_100, GREEN_200, GREEN_300, GREEN_400, GREEN_500, GREEN_600, + GREEN_700, GREEN_800, GREEN_900, GREEN_A100, GREEN_A200, GREEN_A400, GREEN_A700, + ], + [ + LIGHTGREEN, + LIGHTGREEN_50, + LIGHTGREEN_100, + LIGHTGREEN_200, + LIGHTGREEN_300, + LIGHTGREEN_400, + LIGHTGREEN_500, + LIGHTGREEN_600, + LIGHTGREEN_700, + LIGHTGREEN_800, + LIGHTGREEN_900, + LIGHTGREEN_A100, + LIGHTGREEN_A200, + LIGHTGREEN_A400, + LIGHTGREEN_A700, + ], + [ + LIME, LIME_50, LIME_100, LIME_200, LIME_300, LIME_400, LIME_500, LIME_600, LIME_700, + LIME_800, LIME_900, LIME_A100, LIME_A200, LIME_A400, LIME_A700, + ], + [ + YELLOW, + YELLOW_50, + YELLOW_100, + YELLOW_200, + YELLOW_300, + YELLOW_400, + YELLOW_500, + YELLOW_600, + YELLOW_700, + YELLOW_800, + YELLOW_900, + YELLOW_A100, + YELLOW_A200, + YELLOW_A400, + YELLOW_A700, + ], + [ + AMBER, AMBER_50, AMBER_100, AMBER_200, AMBER_300, AMBER_400, AMBER_500, AMBER_600, + AMBER_700, AMBER_800, AMBER_900, AMBER_A100, AMBER_A200, AMBER_A400, AMBER_A700, + ], + [ + ORANGE, + ORANGE_50, + ORANGE_100, + ORANGE_200, + ORANGE_300, + ORANGE_400, + ORANGE_500, + ORANGE_600, + ORANGE_700, + ORANGE_800, + ORANGE_900, + ORANGE_A100, + ORANGE_A200, + ORANGE_A400, + ORANGE_A700, + ], + [ + DEEPORANGE, + DEEPORANGE_50, + DEEPORANGE_100, + DEEPORANGE_200, + DEEPORANGE_300, + DEEPORANGE_400, + DEEPORANGE_500, + DEEPORANGE_600, + DEEPORANGE_700, + DEEPORANGE_800, + DEEPORANGE_900, + DEEPORANGE_A100, + DEEPORANGE_A200, + DEEPORANGE_A400, + DEEPORANGE_A700, + ], + [ + BROWN, BROWN_50, BROWN_100, BROWN_200, BROWN_300, BROWN_400, BROWN_500, BROWN_600, + BROWN_700, BROWN_800, BROWN_900, BROWN_A100, BROWN_A200, BROWN_A400, BROWN_A700, + ], + [ + GREY, GREY_50, GREY_100, GREY_200, GREY_300, GREY_400, GREY_500, GREY_600, GREY_700, + GREY_800, GREY_900, GREY_A100, GREY_A200, GREY_A400, GREY_A700, + ], + [ + BLUEGREY, + BLUEGREY_50, + BLUEGREY_100, + BLUEGREY_200, + BLUEGREY_300, + BLUEGREY_400, + BLUEGREY_500, + BLUEGREY_600, + BLUEGREY_700, + BLUEGREY_800, + BLUEGREY_900, + BLUEGREY_A100, + BLUEGREY_A200, + BLUEGREY_A400, + BLUEGREY_A700, + ], + ]; + let color_names = [ + [ + "RED", "RED_50", "RED_100", "RED_200", "RED_300", "RED_400", "RED_500", "RED_600", + "RED_700", "RED_800", "RED_900", "RED_A100", "RED_A200", "RED_A400", "RED_A700", + ], + [ + "PINK", + "PINK_50", + "PINK_100", + "PINK_200", + "PINK_300", + "PINK_400", + "PINK_500", + "PINK_600", + "PINK_700", + "PINK_800", + "PINK_900", + "PINK_A100", + "PINK_A200", + "PINK_A400", + "PINK_A700", + ], + [ + "PURPLE", + "PURPLE_50", + "PURPLE_100", + "PURPLE_200", + "PURPLE_300", + "PURPLE_400", + "PURPLE_500", + "PURPLE_600", + "PURPLE_700", + "PURPLE_800", + "PURPLE_900", + "PURPLE_A100", + "PURPLE_A200", + "PURPLE_A400", + "PURPLE_A700", + ], + [ + "DEEPPURPLE", + "DEEPPURPLE_50", + "DEEPPURPLE_100", + "DEEPPURPLE_200", + "DEEPPURPLE_300", + "DEEPPURPLE_400", + "DEEPPURPLE_500", + "DEEPPURPLE_600", + "DEEPPURPLE_700", + "DEEPPURPLE_800", + "DEEPPURPLE_900", + "DEEPPURPLE_A100", + "DEEPPURPLE_A200", + "DEEPPURPLE_A400", + "DEEPPURPLE_A700", + ], + [ + "INDIGO", + "INDIGO_50", + "INDIGO_100", + "INDIGO_200", + "INDIGO_300", + "INDIGO_400", + "INDIGO_500", + "INDIGO_600", + "INDIGO_700", + "INDIGO_800", + "INDIGO_900", + "INDIGO_A100", + "INDIGO_A200", + "INDIGO_A400", + "INDIGO_A700", + ], + [ + "BLUE", + "BLUE_50", + "BLUE_100", + "BLUE_200", + "BLUE_300", + "BLUE_400", + "BLUE_500", + "BLUE_600", + "BLUE_700", + "BLUE_800", + "BLUE_900", + "BLUE_A100", + "BLUE_A200", + "BLUE_A400", + "BLUE_A700", + ], + [ + "LIGHTBLUE", + "LIGHTBLUE_50", + "LIGHTBLUE_100", + "LIGHTBLUE_200", + "LIGHTBLUE_300", + "LIGHTBLUE_400", + "LIGHTBLUE_500", + "LIGHTBLUE_600", + "LIGHTBLUE_700", + "LIGHTBLUE_800", + "LIGHTBLUE_900", + "LIGHTBLUE_A100", + "LIGHTBLUE_A200", + "LIGHTBLUE_A400", + "LIGHTBLUE_A700", + ], + [ + "CYAN", + "CYAN_50", + "CYAN_100", + "CYAN_200", + "CYAN_300", + "CYAN_400", + "CYAN_500", + "CYAN_600", + "CYAN_700", + "CYAN_800", + "CYAN_900", + "CYAN_A100", + "CYAN_A200", + "CYAN_A400", + "CYAN_A700", + ], + [ + "TEAL", + "TEAL_50", + "TEAL_100", + "TEAL_200", + "TEAL_300", + "TEAL_400", + "TEAL_500", + "TEAL_600", + "TEAL_700", + "TEAL_800", + "TEAL_900", + "TEAL_A100", + "TEAL_A200", + "TEAL_A400", + "TEAL_A700", + ], + [ + "GREEN", + "GREEN_50", + "GREEN_100", + "GREEN_200", + "GREEN_300", + "GREEN_400", + "GREEN_500", + "GREEN_600", + "GREEN_700", + "GREEN_800", + "GREEN_900", + "GREEN_A100", + "GREEN_A200", + "GREEN_A400", + "GREEN_A700", + ], + [ + "LIGHTGREEN", + "LIGHTGREEN_50", + "LIGHTGREEN_100", + "LIGHTGREEN_200", + "LIGHTGREEN_300", + "LIGHTGREEN_400", + "LIGHTGREEN_500", + "LIGHTGREEN_600", + "LIGHTGREEN_700", + "LIGHTGREEN_800", + "LIGHTGREEN_900", + "LIGHTGREEN_A100", + "LIGHTGREEN_A200", + "LIGHTGREEN_A400", + "LIGHTGREEN_A700", + ], + [ + "LIME", + "LIME_50", + "LIME_100", + "LIME_200", + "LIME_300", + "LIME_400", + "LIME_500", + "LIME_600", + "LIME_700", + "LIME_800", + "LIME_900", + "LIME_A100", + "LIME_A200", + "LIME_A400", + "LIME_A700", + ], + [ + "YELLOW", + "YELLOW_50", + "YELLOW_100", + "YELLOW_200", + "YELLOW_300", + "YELLOW_400", + "YELLOW_500", + "YELLOW_600", + "YELLOW_700", + "YELLOW_800", + "YELLOW_900", + "YELLOW_A100", + "YELLOW_A200", + "YELLOW_A400", + "YELLOW_A700", + ], + [ + "AMBER", + "AMBER_50", + "AMBER_100", + "AMBER_200", + "AMBER_300", + "AMBER_400", + "AMBER_500", + "AMBER_600", + "AMBER_700", + "AMBER_800", + "AMBER_900", + "AMBER_A100", + "AMBER_A200", + "AMBER_A400", + "AMBER_A700", + ], + [ + "ORANGE", + "ORANGE_50", + "ORANGE_100", + "ORANGE_200", + "ORANGE_300", + "ORANGE_400", + "ORANGE_500", + "ORANGE_600", + "ORANGE_700", + "ORANGE_800", + "ORANGE_900", + "ORANGE_A100", + "ORANGE_A200", + "ORANGE_A400", + "ORANGE_A700", + ], + [ + "DEEPORANGE", + "DEEPORANGE_50", + "DEEPORANGE_100", + "DEEPORANGE_200", + "DEEPORANGE_300", + "DEEPORANGE_400", + "DEEPORANGE_500", + "DEEPORANGE_600", + "DEEPORANGE_700", + "DEEPORANGE_800", + "DEEPORANGE_900", + "DEEPORANGE_A100", + "DEEPORANGE_A200", + "DEEPORANGE_A400", + "DEEPORANGE_A700", + ], + [ + "BROWN", + "BROWN_50", + "BROWN_100", + "BROWN_200", + "BROWN_300", + "BROWN_400", + "BROWN_500", + "BROWN_600", + "BROWN_700", + "BROWN_800", + "BROWN_900", + "BROWN_A100", + "BROWN_A200", + "BROWN_A400", + "BROWN_A700", + ], + [ + "GREY", + "GREY_50", + "GREY_100", + "GREY_200", + "GREY_300", + "GREY_400", + "GREY_500", + "GREY_600", + "GREY_700", + "GREY_800", + "GREY_900", + "GREY_A100", + "GREY_A200", + "GREY_A400", + "GREY_A700", + ], + [ + "BLUEGREY", + "BLUEGREY_50", + "BLUEGREY_100", + "BLUEGREY_200", + "BLUEGREY_300", + "BLUEGREY_400", + "BLUEGREY_500", + "BLUEGREY_600", + "BLUEGREY_700", + "BLUEGREY_800", + "BLUEGREY_900", + "BLUEGREY_A100", + "BLUEGREY_A200", + "BLUEGREY_A400", + "BLUEGREY_A700", + ], + ]; + + use plotters::style::text_anchor::*; + let centered = Pos::new(HPos::Center, VPos::Top); + let label_style = TextStyle::from(("monospace", 14.0).into_font()).pos(centered); + + for (col, colors) in colors.iter().enumerate() { + chart.draw_series(colors.iter().zip(color_names[col].iter()).enumerate().map( + |(row, (color, &name))| { + let row = row as f32; + let col = col as f32; + EmptyElement::at((col, row)) + + Circle::new((0, 0), 15, color.filled()) + + Text::new(name, (0, 16), &label_style) + }, + ))?; + } + + // To avoid the IO failure being ignored silently, we manually call the present function + root.present().expect("Unable to write result to file, please make sure 'plotters-doc-data' dir exists under current dir"); + println!("Result has been saved to {}", OUT_FILE_NAME); + + Ok(()) +} +#[test] +fn entry_point() { + main().unwrap() +} diff --git a/vendor/plotters/examples/histogram.rs b/vendor/plotters/examples/histogram.rs new file mode 100644 index 000000000..5cda05dbe --- /dev/null +++ b/vendor/plotters/examples/histogram.rs @@ -0,0 +1,43 @@ +use plotters::prelude::*; +const OUT_FILE_NAME: &'static str = "plotters-doc-data/histogram.png"; +fn main() -> Result<(), Box<dyn std::error::Error>> { + let root = BitMapBackend::new(OUT_FILE_NAME, (640, 480)).into_drawing_area(); + + root.fill(&WHITE)?; + + let mut chart = ChartBuilder::on(&root) + .x_label_area_size(35) + .y_label_area_size(40) + .margin(5) + .caption("Histogram Test", ("sans-serif", 50.0)) + .build_cartesian_2d((0u32..10u32).into_segmented(), 0u32..10u32)?; + + chart + .configure_mesh() + .disable_x_mesh() + .bold_line_style(&WHITE.mix(0.3)) + .y_desc("Count") + .x_desc("Bucket") + .axis_desc_style(("sans-serif", 15)) + .draw()?; + + let data = [ + 0u32, 1, 1, 1, 4, 2, 5, 7, 8, 6, 4, 2, 1, 8, 3, 3, 3, 4, 4, 3, 3, 3, + ]; + + chart.draw_series( + Histogram::vertical(&chart) + .style(RED.mix(0.5).filled()) + .data(data.iter().map(|x: &u32| (*x, 1))), + )?; + + // To avoid the IO failure being ignored silently, we manually call the present function + root.present().expect("Unable to write result to file, please make sure 'plotters-doc-data' dir exists under current dir"); + println!("Result has been saved to {}", OUT_FILE_NAME); + + Ok(()) +} +#[test] +fn entry_point() { + main().unwrap() +} diff --git a/vendor/plotters/examples/mandelbrot.rs b/vendor/plotters/examples/mandelbrot.rs new file mode 100644 index 000000000..413c319c6 --- /dev/null +++ b/vendor/plotters/examples/mandelbrot.rs @@ -0,0 +1,71 @@ +use plotters::prelude::*; +use std::ops::Range; + +const OUT_FILE_NAME: &'static str = "plotters-doc-data/mandelbrot.png"; +fn main() -> Result<(), Box<dyn std::error::Error>> { + let root = BitMapBackend::new(OUT_FILE_NAME, (800, 600)).into_drawing_area(); + + root.fill(&WHITE)?; + + let mut chart = ChartBuilder::on(&root) + .margin(20) + .x_label_area_size(10) + .y_label_area_size(10) + .build_cartesian_2d(-2.1f64..0.6f64, -1.2f64..1.2f64)?; + + chart + .configure_mesh() + .disable_x_mesh() + .disable_y_mesh() + .draw()?; + + let plotting_area = chart.plotting_area(); + + let range = plotting_area.get_pixel_range(); + + let (pw, ph) = (range.0.end - range.0.start, range.1.end - range.1.start); + let (xr, yr) = (chart.x_range(), chart.y_range()); + + for (x, y, c) in mandelbrot_set(xr, yr, (pw as usize, ph as usize), 100) { + if c != 100 { + plotting_area.draw_pixel((x, y), &HSLColor(c as f64 / 100.0, 1.0, 0.5))?; + } else { + plotting_area.draw_pixel((x, y), &BLACK)?; + } + } + + // To avoid the IO failure being ignored silently, we manually call the present function + root.present().expect("Unable to write result to file, please make sure 'plotters-doc-data' dir exists under current dir"); + println!("Result has been saved to {}", OUT_FILE_NAME); + + Ok(()) +} + +fn mandelbrot_set( + real: Range<f64>, + complex: Range<f64>, + samples: (usize, usize), + max_iter: usize, +) -> impl Iterator<Item = (f64, f64, usize)> { + let step = ( + (real.end - real.start) / samples.0 as f64, + (complex.end - complex.start) / samples.1 as f64, + ); + return (0..(samples.0 * samples.1)).map(move |k| { + let c = ( + real.start + step.0 * (k % samples.0) as f64, + complex.start + step.1 * (k / samples.0) as f64, + ); + let mut z = (0.0, 0.0); + let mut cnt = 0; + while cnt < max_iter && z.0 * z.0 + z.1 * z.1 <= 1e10 { + z = (z.0 * z.0 - z.1 * z.1 + c.0, 2.0 * z.0 * z.1 + c.1); + cnt += 1; + } + return (c.0, c.1, cnt); + }); +} +#[test] +fn entry_point() { + main().unwrap() +} diff --git a/vendor/plotters/examples/matshow.rs b/vendor/plotters/examples/matshow.rs new file mode 100644 index 000000000..30c71a745 --- /dev/null +++ b/vendor/plotters/examples/matshow.rs @@ -0,0 +1,62 @@ +use plotters::prelude::*; + +const OUT_FILE_NAME: &'static str = "plotters-doc-data/matshow.png"; +fn main() -> Result<(), Box<dyn std::error::Error>> { + let root = BitMapBackend::new(OUT_FILE_NAME, (1024, 768)).into_drawing_area(); + + root.fill(&WHITE)?; + + let mut chart = ChartBuilder::on(&root) + .caption("Matshow Example", ("sans-serif", 80)) + .margin(5) + .top_x_label_area_size(40) + .y_label_area_size(40) + .build_cartesian_2d(0i32..15i32, 15i32..0i32)?; + + chart + .configure_mesh() + .x_labels(15) + .y_labels(15) + .max_light_lines(4) + .x_label_offset(35) + .y_label_offset(25) + .disable_x_mesh() + .disable_y_mesh() + .label_style(("sans-serif", 20)) + .draw()?; + + let mut matrix = [[0; 15]; 15]; + + for i in 0..15 { + matrix[i][i] = i + 4; + } + + chart.draw_series( + matrix + .iter() + .zip(0..) + .map(|(l, y)| l.iter().zip(0..).map(move |(v, x)| (x as i32, y as i32, v))) + .flatten() + .map(|(x, y, v)| { + Rectangle::new( + [(x, y), (x + 1, y + 1)], + HSLColor( + 240.0 / 360.0 - 240.0 / 360.0 * (*v as f64 / 20.0), + 0.7, + 0.1 + 0.4 * *v as f64 / 20.0, + ) + .filled(), + ) + }), + )?; + + // To avoid the IO failure being ignored silently, we manually call the present function + root.present().expect("Unable to write result to file, please make sure 'plotters-doc-data' dir exists under current dir"); + println!("Result has been saved to {}", OUT_FILE_NAME); + + Ok(()) +} +#[test] +fn entry_point() { + main().unwrap() +} diff --git a/vendor/plotters/examples/nested_coord.rs b/vendor/plotters/examples/nested_coord.rs new file mode 100644 index 000000000..b70010148 --- /dev/null +++ b/vendor/plotters/examples/nested_coord.rs @@ -0,0 +1,47 @@ +use plotters::prelude::*; +const OUT_FILE_NAME: &'static str = "plotters-doc-data/nested_coord.png"; +fn main() -> Result<(), Box<dyn std::error::Error>> { + let root = BitMapBackend::new(OUT_FILE_NAME, (640, 480)).into_drawing_area(); + + root.fill(&WHITE)?; + + let mut chart = ChartBuilder::on(&root) + .x_label_area_size(35) + .y_label_area_size(40) + .margin(5) + .caption("Nested Coord", ("sans-serif", 50.0)) + .build_cartesian_2d( + ["Linear", "Quadratic"].nested_coord(|_| 0.0..10.0), + 0.0..10.0, + )?; + + chart + .configure_mesh() + .disable_mesh() + .axis_desc_style(("sans-serif", 15)) + .draw()?; + + chart.draw_series(LineSeries::new( + (0..10) + .map(|x| x as f64 / 1.0) + .map(|x| ((&"Linear", x).into(), x)), + &RED, + ))?; + + chart.draw_series(LineSeries::new( + (0..10) + .map(|x| x as f64 / 1.0) + .map(|x| ((&"Quadratic", x).into(), x * x / 10.0)), + &RED, + ))?; + + // To avoid the IO failure being ignored silently, we manually call the present function + root.present().expect("Unable to write result to file, please make sure 'plotters-doc-data' dir exists under current dir"); + println!("Result has been saved to {}", OUT_FILE_NAME); + + Ok(()) +} +#[test] +fn entry_point() { + main().unwrap() +} diff --git a/vendor/plotters/examples/normal-dist.rs b/vendor/plotters/examples/normal-dist.rs new file mode 100644 index 000000000..be4878630 --- /dev/null +++ b/vendor/plotters/examples/normal-dist.rs @@ -0,0 +1,66 @@ +use plotters::prelude::*; + +use rand::SeedableRng; +use rand_distr::{Distribution, Normal}; +use rand_xorshift::XorShiftRng; + +const OUT_FILE_NAME: &'static str = "plotters-doc-data/normal-dist.png"; +fn main() -> Result<(), Box<dyn std::error::Error>> { + let root = BitMapBackend::new(OUT_FILE_NAME, (1024, 768)).into_drawing_area(); + + root.fill(&WHITE)?; + + let sd = 0.13; + + let random_points: Vec<(f64, f64)> = { + let norm_dist = Normal::new(0.5, sd).unwrap(); + let mut x_rand = XorShiftRng::from_seed(*b"MyFragileSeed123"); + let mut y_rand = XorShiftRng::from_seed(*b"MyFragileSeed321"); + let x_iter = norm_dist.sample_iter(&mut x_rand); + let y_iter = norm_dist.sample_iter(&mut y_rand); + x_iter.zip(y_iter).take(5000).collect() + }; + + let areas = root.split_by_breakpoints([944], [80]); + + let mut x_hist_ctx = ChartBuilder::on(&areas[0]) + .y_label_area_size(40) + .build_cartesian_2d((0.0..1.0).step(0.01).use_round().into_segmented(), 0..250)?; + let mut y_hist_ctx = ChartBuilder::on(&areas[3]) + .x_label_area_size(40) + .build_cartesian_2d(0..250, (0.0..1.0).step(0.01).use_round())?; + let mut scatter_ctx = ChartBuilder::on(&areas[2]) + .x_label_area_size(40) + .y_label_area_size(40) + .build_cartesian_2d(0f64..1f64, 0f64..1f64)?; + scatter_ctx + .configure_mesh() + .disable_x_mesh() + .disable_y_mesh() + .draw()?; + scatter_ctx.draw_series( + random_points + .iter() + .map(|(x, y)| Circle::new((*x, *y), 2, GREEN.filled())), + )?; + let x_hist = Histogram::vertical(&x_hist_ctx) + .style(GREEN.filled()) + .margin(0) + .data(random_points.iter().map(|(x, _)| (*x, 1))); + let y_hist = Histogram::horizontal(&y_hist_ctx) + .style(GREEN.filled()) + .margin(0) + .data(random_points.iter().map(|(_, y)| (*y, 1))); + x_hist_ctx.draw_series(x_hist)?; + y_hist_ctx.draw_series(y_hist)?; + + // To avoid the IO failure being ignored silently, we manually call the present function + root.present().expect("Unable to write result to file, please make sure 'plotters-doc-data' dir exists under current dir"); + println!("Result has been saved to {}", OUT_FILE_NAME); + + Ok(()) +} +#[test] +fn entry_point() { + main().unwrap() +} diff --git a/vendor/plotters/examples/normal-dist2.rs b/vendor/plotters/examples/normal-dist2.rs new file mode 100644 index 000000000..6c84ab3ab --- /dev/null +++ b/vendor/plotters/examples/normal-dist2.rs @@ -0,0 +1,83 @@ +use plotters::prelude::*; + +use rand::SeedableRng; +use rand_distr::{Distribution, Normal}; +use rand_xorshift::XorShiftRng; + +use num_traits::sign::Signed; + +const OUT_FILE_NAME: &'static str = "plotters-doc-data/normal-dist2.png"; +fn main() -> Result<(), Box<dyn std::error::Error>> { + let sd = 0.60; + + let random_points: Vec<f64> = { + let norm_dist = Normal::new(0.0, sd).unwrap(); + let mut x_rand = XorShiftRng::from_seed(*b"MyFragileSeed123"); + let x_iter = norm_dist.sample_iter(&mut x_rand); + x_iter.take(5000).filter(|x| x.abs() <= 4.0).collect() + }; + + let root = BitMapBackend::new(OUT_FILE_NAME, (1024, 768)).into_drawing_area(); + + root.fill(&WHITE)?; + + let mut chart = ChartBuilder::on(&root) + .margin(5) + .caption("1D Gaussian Distribution Demo", ("sans-serif", 30)) + .set_label_area_size(LabelAreaPosition::Left, 60) + .set_label_area_size(LabelAreaPosition::Bottom, 60) + .set_label_area_size(LabelAreaPosition::Right, 60) + .build_cartesian_2d(-4f64..4f64, 0f64..0.1)? + .set_secondary_coord( + (-4f64..4f64).step(0.1).use_round().into_segmented(), + 0u32..500u32, + ); + + chart + .configure_mesh() + .disable_x_mesh() + .disable_y_mesh() + .y_label_formatter(&|y| format!("{:.0}%", *y * 100.0)) + .y_desc("Percentage") + .draw()?; + + chart.configure_secondary_axes().y_desc("Count").draw()?; + + let actual = Histogram::vertical(chart.borrow_secondary()) + .style(GREEN.filled()) + .margin(3) + .data(random_points.iter().map(|x| (*x, 1))); + + chart + .draw_secondary_series(actual)? + .label("Observed") + .legend(|(x, y)| Rectangle::new([(x, y - 5), (x + 10, y + 5)], GREEN.filled())); + + let pdf = LineSeries::new( + (-400..400).map(|x| x as f64 / 100.0).map(|x| { + ( + x, + (-x * x / 2.0 / sd / sd).exp() / (2.0 * std::f64::consts::PI * sd * sd).sqrt() + * 0.1, + ) + }), + &RED, + ); + + chart + .draw_series(pdf)? + .label("PDF") + .legend(|(x, y)| PathElement::new(vec![(x, y), (x + 20, y)], RED.filled())); + + chart.configure_series_labels().draw()?; + + // To avoid the IO failure being ignored silently, we manually call the present function + root.present().expect("Unable to write result to file, please make sure 'plotters-doc-data' dir exists under current dir"); + println!("Result has been saved to {}", OUT_FILE_NAME); + + Ok(()) +} +#[test] +fn entry_point() { + main().unwrap() +} diff --git a/vendor/plotters/examples/pie.rs b/vendor/plotters/examples/pie.rs new file mode 100644 index 000000000..a950c0218 --- /dev/null +++ b/vendor/plotters/examples/pie.rs @@ -0,0 +1,25 @@ +use plotters::{prelude::*, style::full_palette::ORANGE}; + +const OUT_FILE_NAME: &'static str = "plotters-doc-data/pie-chart.png"; +fn main() -> Result<(), Box<dyn std::error::Error>> { + let root_area = BitMapBackend::new(&OUT_FILE_NAME, (950, 700)).into_drawing_area(); + root_area.fill(&WHITE).unwrap(); + let title_style = TextStyle::from(("sans-serif", 30).into_font()).color(&(BLACK)); + root_area.titled("BEST CIRCLES", title_style).unwrap(); + + let dims = root_area.dim_in_pixel(); + let center = (dims.0 as i32 / 2, dims.1 as i32 / 2); + let radius = 300.0; + let sizes = vec![66.0, 33.0]; + let _rgba = RGBAColor(0, 50, 255, 1.0); + let colors = vec![RGBColor(0, 50, 255), CYAN]; + let labels = vec!["Pizza", "Pacman"]; + + let mut pie = Pie::new(¢er, &radius, &sizes, &colors, &labels); + pie.start_angle(66.0); + pie.label_style((("sans-serif", 50).into_font()).color(&(ORANGE))); + pie.percentages((("sans-serif", radius * 0.08).into_font()).color(&BLACK)); + root_area.draw(&pie)?; + + Ok(()) +} diff --git a/vendor/plotters/examples/relative_size.rs b/vendor/plotters/examples/relative_size.rs new file mode 100644 index 000000000..66eaec130 --- /dev/null +++ b/vendor/plotters/examples/relative_size.rs @@ -0,0 +1,57 @@ +use plotters::coord::Shift; +use plotters::prelude::*; + +fn draw_chart<B: DrawingBackend>(root: &DrawingArea<B, Shift>) -> DrawResult<(), B> { + let mut chart = ChartBuilder::on(root) + .caption( + "Relative Size Example", + ("sans-serif", (5).percent_height()), + ) + .x_label_area_size((10).percent_height()) + .y_label_area_size((10).percent_width()) + .margin(5) + .build_cartesian_2d(-5.0..5.0, -1.0..1.0)?; + + chart + .configure_mesh() + .disable_x_mesh() + .disable_y_mesh() + .label_style(("sans-serif", (3).percent_height())) + .draw()?; + + chart.draw_series(LineSeries::new( + (0..1000) + .map(|x| x as f64 / 100.0 - 5.0) + .map(|x| (x, x.sin())), + &RED, + ))?; + Ok(()) +} + +const OUT_FILE_NAME: &'static str = "plotters-doc-data/relative_size.png"; +fn main() -> Result<(), Box<dyn std::error::Error>> { + let root = BitMapBackend::new(OUT_FILE_NAME, (1024, 768)).into_drawing_area(); + + root.fill(&WHITE)?; + + let (left, right) = root.split_horizontally((70).percent_width()); + + draw_chart(&left)?; + + let (upper, lower) = right.split_vertically(300); + + draw_chart(&upper)?; + draw_chart(&lower)?; + let root = root.shrink((200, 200), (150, 100)); + draw_chart(&root)?; + + // To avoid the IO failure being ignored silently, we manually call the present function + root.present().expect("Unable to write result to file, please make sure 'plotters-doc-data' dir exists under current dir"); + println!("Result has been saved to {}", OUT_FILE_NAME); + + Ok(()) +} +#[test] +fn entry_point() { + main().unwrap() +} diff --git a/vendor/plotters/examples/sierpinski.rs b/vendor/plotters/examples/sierpinski.rs new file mode 100644 index 000000000..b9655bf94 --- /dev/null +++ b/vendor/plotters/examples/sierpinski.rs @@ -0,0 +1,43 @@ +use plotters::coord::Shift; +use plotters::prelude::*; + +pub fn sierpinski_carpet( + depth: u32, + drawing_area: &DrawingArea<BitMapBackend, Shift>, +) -> Result<(), Box<dyn std::error::Error>> { + if depth > 0 { + let sub_areas = drawing_area.split_evenly((3, 3)); + for (idx, sub_area) in (0..).zip(sub_areas.iter()) { + if idx != 4 { + sub_area.fill(&BLUE)?; + sierpinski_carpet(depth - 1, sub_area)?; + } else { + sub_area.fill(&WHITE)?; + } + } + } + Ok(()) +} + +const OUT_FILE_NAME: &'static str = "plotters-doc-data/sierpinski.png"; +fn main() -> Result<(), Box<dyn std::error::Error>> { + let root = BitMapBackend::new(OUT_FILE_NAME, (1024, 768)).into_drawing_area(); + + root.fill(&WHITE)?; + + let root = root + .titled("Sierpinski Carpet Demo", ("sans-serif", 60))? + .shrink(((1024 - 700) / 2, 0), (700, 700)); + + sierpinski_carpet(5, &root)?; + + // To avoid the IO failure being ignored silently, we manually call the present function + root.present().expect("Unable to write result to file, please make sure 'plotters-doc-data' dir exists under current dir"); + println!("Result has been saved to {}", OUT_FILE_NAME); + + Ok(()) +} +#[test] +fn entry_point() { + main().unwrap() +} diff --git a/vendor/plotters/examples/slc-temp.rs b/vendor/plotters/examples/slc-temp.rs new file mode 100644 index 000000000..9d6e47313 --- /dev/null +++ b/vendor/plotters/examples/slc-temp.rs @@ -0,0 +1,174 @@ +use plotters::prelude::*; + +use chrono::{TimeZone, Utc}; + +use std::error::Error; + +const OUT_FILE_NAME: &'static str = "plotters-doc-data/slc-temp.png"; +fn main() -> Result<(), Box<dyn Error>> { + let root = BitMapBackend::new(OUT_FILE_NAME, (1024, 768)).into_drawing_area(); + + root.fill(&WHITE)?; + + let mut chart = ChartBuilder::on(&root) + .margin(10) + .caption( + "Monthly Average Temperate in Salt Lake City, UT", + ("sans-serif", 40), + ) + .set_label_area_size(LabelAreaPosition::Left, 60) + .set_label_area_size(LabelAreaPosition::Right, 60) + .set_label_area_size(LabelAreaPosition::Bottom, 40) + .build_cartesian_2d( + (Utc.ymd(2010, 1, 1)..Utc.ymd(2018, 12, 1)).monthly(), + 14.0..104.0, + )? + .set_secondary_coord( + (Utc.ymd(2010, 1, 1)..Utc.ymd(2018, 12, 1)).monthly(), + -10.0..40.0, + ); + + chart + .configure_mesh() + .disable_x_mesh() + .disable_y_mesh() + .x_labels(30) + .max_light_lines(4) + .y_desc("Average Temp (F)") + .draw()?; + chart + .configure_secondary_axes() + .y_desc("Average Temp (C)") + .draw()?; + + chart.draw_series(LineSeries::new( + DATA.iter().map(|(y, m, t)| (Utc.ymd(*y, *m, 1), *t)), + &BLUE, + ))?; + + chart.draw_series( + DATA.iter() + .map(|(y, m, t)| Circle::new((Utc.ymd(*y, *m, 1), *t), 3, BLUE.filled())), + )?; + + // To avoid the IO failure being ignored silently, we manually call the present function + root.present().expect("Unable to write result to file, please make sure 'plotters-doc-data' dir exists under current dir"); + println!("Result has been saved to {}", OUT_FILE_NAME); + + Ok(()) +} + +const DATA: [(i32, u32, f64); 12 * 9] = [ + (2010, 1, 32.4), + (2010, 2, 37.5), + (2010, 3, 44.5), + (2010, 4, 50.3), + (2010, 5, 55.0), + (2010, 6, 70.0), + (2010, 7, 78.7), + (2010, 8, 76.5), + (2010, 9, 68.9), + (2010, 10, 56.3), + (2010, 11, 40.3), + (2010, 12, 36.5), + (2011, 1, 28.8), + (2011, 2, 35.1), + (2011, 3, 45.5), + (2011, 4, 48.9), + (2011, 5, 55.1), + (2011, 6, 68.8), + (2011, 7, 77.9), + (2011, 8, 78.4), + (2011, 9, 68.2), + (2011, 10, 55.0), + (2011, 11, 41.5), + (2011, 12, 31.0), + (2012, 1, 35.6), + (2012, 2, 38.1), + (2012, 3, 49.1), + (2012, 4, 56.1), + (2012, 5, 63.4), + (2012, 6, 73.0), + (2012, 7, 79.0), + (2012, 8, 79.0), + (2012, 9, 68.8), + (2012, 10, 54.9), + (2012, 11, 45.2), + (2012, 12, 34.9), + (2013, 1, 19.7), + (2013, 2, 31.1), + (2013, 3, 46.2), + (2013, 4, 49.8), + (2013, 5, 61.3), + (2013, 6, 73.3), + (2013, 7, 80.3), + (2013, 8, 77.2), + (2013, 9, 68.3), + (2013, 10, 52.0), + (2013, 11, 43.2), + (2013, 12, 25.7), + (2014, 1, 31.5), + (2014, 2, 39.3), + (2014, 3, 46.4), + (2014, 4, 52.5), + (2014, 5, 63.0), + (2014, 6, 71.3), + (2014, 7, 81.0), + (2014, 8, 75.3), + (2014, 9, 70.0), + (2014, 10, 58.6), + (2014, 11, 42.1), + (2014, 12, 38.0), + (2015, 1, 35.3), + (2015, 2, 45.2), + (2015, 3, 50.9), + (2015, 4, 54.3), + (2015, 5, 60.5), + (2015, 6, 77.1), + (2015, 7, 76.2), + (2015, 8, 77.3), + (2015, 9, 70.4), + (2015, 10, 60.6), + (2015, 11, 40.9), + (2015, 12, 32.4), + (2016, 1, 31.5), + (2016, 2, 35.1), + (2016, 3, 49.1), + (2016, 4, 55.1), + (2016, 5, 60.9), + (2016, 6, 76.9), + (2016, 7, 80.0), + (2016, 8, 77.0), + (2016, 9, 67.1), + (2016, 10, 59.1), + (2016, 11, 47.4), + (2016, 12, 31.8), + (2017, 1, 29.4), + (2017, 2, 42.4), + (2017, 3, 51.7), + (2017, 4, 51.7), + (2017, 5, 62.5), + (2017, 6, 74.8), + (2017, 7, 81.3), + (2017, 8, 78.1), + (2017, 9, 65.7), + (2017, 10, 52.5), + (2017, 11, 49.0), + (2017, 12, 34.4), + (2018, 1, 38.1), + (2018, 2, 37.5), + (2018, 3, 45.4), + (2018, 4, 54.6), + (2018, 5, 64.0), + (2018, 6, 74.9), + (2018, 7, 82.5), + (2018, 8, 78.1), + (2018, 9, 71.9), + (2018, 10, 53.2), + (2018, 11, 39.7), + (2018, 12, 33.6), +]; +#[test] +fn entry_point() { + main().unwrap() +} diff --git a/vendor/plotters/examples/snowflake.rs b/vendor/plotters/examples/snowflake.rs new file mode 100644 index 000000000..6e52f25b6 --- /dev/null +++ b/vendor/plotters/examples/snowflake.rs @@ -0,0 +1,57 @@ +use plotters::prelude::*; + +fn snowflake_iter(points: &[(f64, f64)]) -> Vec<(f64, f64)> { + let mut ret = vec![]; + for i in 0..points.len() { + let (start, end) = (points[i], points[(i + 1) % points.len()]); + let t = ((end.0 - start.0) / 3.0, (end.1 - start.1) / 3.0); + let s = ( + t.0 * 0.5 - t.1 * (0.75f64).sqrt(), + t.1 * 0.5 + (0.75f64).sqrt() * t.0, + ); + ret.push(start); + ret.push((start.0 + t.0, start.1 + t.1)); + ret.push((start.0 + t.0 + s.0, start.1 + t.1 + s.1)); + ret.push((start.0 + t.0 * 2.0, start.1 + t.1 * 2.0)); + } + ret +} + +const OUT_FILE_NAME: &'static str = "plotters-doc-data/snowflake.png"; +fn main() -> Result<(), Box<dyn std::error::Error>> { + let root = BitMapBackend::new(OUT_FILE_NAME, (1024, 768)).into_drawing_area(); + + root.fill(&WHITE)?; + + let mut chart = ChartBuilder::on(&root) + .caption("Koch's Snowflake", ("sans-serif", 50)) + .build_cartesian_2d(-2.0..2.0, -1.5..1.5)?; + + let mut snowflake_vertices = { + let mut current: Vec<(f64, f64)> = vec![ + (0.0, 1.0), + ((3.0f64).sqrt() / 2.0, -0.5), + (-(3.0f64).sqrt() / 2.0, -0.5), + ]; + for _ in 0..6 { + current = snowflake_iter(¤t[..]); + } + current + }; + + chart.draw_series(std::iter::once(Polygon::new( + snowflake_vertices.clone(), + &RED.mix(0.2), + )))?; + snowflake_vertices.push(snowflake_vertices[0]); + chart.draw_series(std::iter::once(PathElement::new(snowflake_vertices, &RED)))?; + + // To avoid the IO failure being ignored silently, we manually call the present function + root.present().expect("Unable to write result to file, please make sure 'plotters-doc-data' dir exists under current dir"); + println!("Result has been saved to {}", OUT_FILE_NAME); + Ok(()) +} +#[test] +fn entry_point() { + main().unwrap() +} diff --git a/vendor/plotters/examples/stock.rs b/vendor/plotters/examples/stock.rs new file mode 100644 index 000000000..8e9416f6d --- /dev/null +++ b/vendor/plotters/examples/stock.rs @@ -0,0 +1,79 @@ +use chrono::offset::{Local, TimeZone}; +use chrono::{Date, Duration}; +use plotters::prelude::*; +fn parse_time(t: &str) -> Date<Local> { + Local + .datetime_from_str(&format!("{} 0:0", t), "%Y-%m-%d %H:%M") + .unwrap() + .date() +} +const OUT_FILE_NAME: &'static str = "plotters-doc-data/stock.png"; +fn main() -> Result<(), Box<dyn std::error::Error>> { + let data = get_data(); + let root = BitMapBackend::new(OUT_FILE_NAME, (1024, 768)).into_drawing_area(); + root.fill(&WHITE)?; + + let (to_date, from_date) = ( + parse_time(&data[0].0) + Duration::days(1), + parse_time(&data[29].0) - Duration::days(1), + ); + + let mut chart = ChartBuilder::on(&root) + .x_label_area_size(40) + .y_label_area_size(40) + .caption("MSFT Stock Price", ("sans-serif", 50.0).into_font()) + .build_cartesian_2d(from_date..to_date, 110f32..135f32)?; + + chart.configure_mesh().light_line_style(&WHITE).draw()?; + + chart.draw_series( + data.iter().map(|x| { + CandleStick::new(parse_time(x.0), x.1, x.2, x.3, x.4, GREEN.filled(), RED, 15) + }), + )?; + + // To avoid the IO failure being ignored silently, we manually call the present function + root.present().expect("Unable to write result to file, please make sure 'plotters-doc-data' dir exists under current dir"); + println!("Result has been saved to {}", OUT_FILE_NAME); + + Ok(()) +} + +fn get_data() -> Vec<(&'static str, f32, f32, f32, f32)> { + return vec![ + ("2019-04-25", 130.0600, 131.3700, 128.8300, 129.1500), + ("2019-04-24", 125.7900, 125.8500, 124.5200, 125.0100), + ("2019-04-23", 124.1000, 125.5800, 123.8300, 125.4400), + ("2019-04-22", 122.6200, 124.0000, 122.5700, 123.7600), + ("2019-04-18", 122.1900, 123.5200, 121.3018, 123.3700), + ("2019-04-17", 121.2400, 121.8500, 120.5400, 121.7700), + ("2019-04-16", 121.6400, 121.6500, 120.1000, 120.7700), + ("2019-04-15", 120.9400, 121.5800, 120.5700, 121.0500), + ("2019-04-12", 120.6400, 120.9800, 120.3700, 120.9500), + ("2019-04-11", 120.5400, 120.8500, 119.9200, 120.3300), + ("2019-04-10", 119.7600, 120.3500, 119.5400, 120.1900), + ("2019-04-09", 118.6300, 119.5400, 118.5800, 119.2800), + ("2019-04-08", 119.8100, 120.0200, 118.6400, 119.9300), + ("2019-04-05", 119.3900, 120.2300, 119.3700, 119.8900), + ("2019-04-04", 120.1000, 120.2300, 118.3800, 119.3600), + ("2019-04-03", 119.8600, 120.4300, 119.1500, 119.9700), + ("2019-04-02", 119.0600, 119.4800, 118.5200, 119.1900), + ("2019-04-01", 118.9500, 119.1085, 118.1000, 119.0200), + ("2019-03-29", 118.0700, 118.3200, 116.9600, 117.9400), + ("2019-03-28", 117.4400, 117.5800, 116.1300, 116.9300), + ("2019-03-27", 117.8750, 118.2100, 115.5215, 116.7700), + ("2019-03-26", 118.6200, 118.7050, 116.8500, 117.9100), + ("2019-03-25", 116.5600, 118.0100, 116.3224, 117.6600), + ("2019-03-22", 119.5000, 119.5900, 117.0400, 117.0500), + ("2019-03-21", 117.1350, 120.8200, 117.0900, 120.2200), + ("2019-03-20", 117.3900, 118.7500, 116.7100, 117.5200), + ("2019-03-19", 118.0900, 118.4400, 116.9900, 117.6500), + ("2019-03-18", 116.1700, 117.6100, 116.0500, 117.5700), + ("2019-03-15", 115.3400, 117.2500, 114.5900, 115.9100), + ("2019-03-14", 114.5400, 115.2000, 114.3300, 114.5900), + ]; +} +#[test] +fn entry_point() { + main().unwrap() +} diff --git a/vendor/plotters/examples/tick_control.rs b/vendor/plotters/examples/tick_control.rs new file mode 100644 index 000000000..b34fc88c1 --- /dev/null +++ b/vendor/plotters/examples/tick_control.rs @@ -0,0 +1,89 @@ +// Data is pulled from https://covid.ourworldindata.org/data/owid-covid-data.json +use plotters::prelude::*; +use std::fs::File; +use std::io::BufReader; + +#[derive(serde_derive::Deserialize)] +struct DailyData { + #[serde(default)] + new_cases: f64, + #[serde(default)] + total_cases: f64, +} + +#[derive(serde_derive::Deserialize)] +struct CountryData { + data: Vec<DailyData>, +} + +const OUT_FILE_NAME: &'static str = "plotters-doc-data/tick_control.svg"; +fn main() -> Result<(), Box<dyn std::error::Error>> { + let root = SVGBackend::new(OUT_FILE_NAME, (1024, 768)).into_drawing_area(); + root.fill(&WHITE)?; + + let (upper, lower) = root.split_vertically(750); + + lower.titled( + "Data Source: https://covid.ourworldindata.org/data/owid-covid-data.json", + ("sans-serif", 10).into_font().color(&BLACK.mix(0.5)), + )?; + + let mut chart = ChartBuilder::on(&upper) + .caption("World COVID-19 Cases", ("sans-serif", (5).percent_height())) + .set_label_area_size(LabelAreaPosition::Left, (8).percent()) + .set_label_area_size(LabelAreaPosition::Bottom, (4).percent()) + .margin((1).percent()) + .build_cartesian_2d( + (20u32..5000_0000u32) + .log_scale() + .with_key_points(vec![50, 100, 1000, 10000, 100000, 1000000, 10000000]), + (0u32..50_0000u32) + .log_scale() + .with_key_points(vec![10, 50, 100, 1000, 10000, 100000, 200000]), + )?; + + chart + .configure_mesh() + .x_desc("Total Cases") + .y_desc("New Cases") + .draw()?; + + let data: std::collections::HashMap<String, CountryData> = serde_json::from_reader( + BufReader::new(File::open("plotters-doc-data/covid-data.json")?), + )?; + + for (idx, &series) in ["CHN", "USA", "RUS", "JPN", "DEU", "IND", "OWID_WRL"] + .iter() + .enumerate() + { + let color = Palette99::pick(idx).mix(0.9); + chart + .draw_series(LineSeries::new( + data[series].data.iter().map( + |&DailyData { + new_cases, + total_cases, + .. + }| (total_cases as u32, new_cases as u32), + ), + color.stroke_width(3), + ))? + .label(series) + .legend(move |(x, y)| Rectangle::new([(x, y - 5), (x + 10, y + 5)], color.filled())); + } + + chart + .configure_series_labels() + .border_style(&BLACK) + .draw()?; + + // To avoid the IO failure being ignored silently, we manually call the present function + root.present().expect("Unable to write result to file, please make sure 'plotters-doc-data' dir exists under current dir"); + println!("Result has been saved to {}", OUT_FILE_NAME); + + Ok(()) +} +#[test] +fn entry_point() { + main().unwrap() +} diff --git a/vendor/plotters/examples/two-scales.rs b/vendor/plotters/examples/two-scales.rs new file mode 100644 index 000000000..6e1dfa4c2 --- /dev/null +++ b/vendor/plotters/examples/two-scales.rs @@ -0,0 +1,60 @@ +use plotters::prelude::*; + +const OUT_FILE_NAME: &'static str = "plotters-doc-data/twoscale.png"; +fn main() -> Result<(), Box<dyn std::error::Error>> { + let root = BitMapBackend::new(OUT_FILE_NAME, (1024, 768)).into_drawing_area(); + root.fill(&WHITE)?; + + let mut chart = ChartBuilder::on(&root) + .x_label_area_size(35) + .y_label_area_size(40) + .right_y_label_area_size(40) + .margin(5) + .caption("Dual Y-Axis Example", ("sans-serif", 50.0).into_font()) + .build_cartesian_2d(0f32..10f32, (0.1f32..1e10f32).log_scale())? + .set_secondary_coord(0f32..10f32, -1.0f32..1.0f32); + + chart + .configure_mesh() + .disable_x_mesh() + .disable_y_mesh() + .y_desc("Log Scale") + .y_label_formatter(&|x| format!("{:e}", x)) + .draw()?; + + chart + .configure_secondary_axes() + .y_desc("Linear Scale") + .draw()?; + + chart + .draw_series(LineSeries::new( + (0..=100).map(|x| (x as f32 / 10.0, (1.02f32).powf(x as f32 * x as f32 / 10.0))), + &BLUE, + ))? + .label("y = 1.02^x^2") + .legend(|(x, y)| PathElement::new(vec![(x, y), (x + 20, y)], &BLUE)); + + chart + .draw_secondary_series(LineSeries::new( + (0..=100).map(|x| (x as f32 / 10.0, (x as f32 / 5.0).sin())), + &RED, + ))? + .label("y = sin(2x)") + .legend(|(x, y)| PathElement::new(vec![(x, y), (x + 20, y)], &RED)); + + chart + .configure_series_labels() + .background_style(&RGBColor(128, 128, 128)) + .draw()?; + + // To avoid the IO failure being ignored silently, we manually call the present function + root.present().expect("Unable to write result to file, please make sure 'plotters-doc-data' dir exists under current dir"); + println!("Result has been saved to {}", OUT_FILE_NAME); + + Ok(()) +} +#[test] +fn entry_point() { + main().unwrap() +} diff --git a/vendor/plotters/src/chart/axes3d.rs b/vendor/plotters/src/chart/axes3d.rs new file mode 100644 index 000000000..33d7de39c --- /dev/null +++ b/vendor/plotters/src/chart/axes3d.rs @@ -0,0 +1,317 @@ +use std::marker::PhantomData; + +use super::ChartContext; +use crate::coord::cartesian::Cartesian3d; +use crate::coord::ranged1d::{BoldPoints, LightPoints, Ranged, ValueFormatter}; +use crate::style::colors::{BLACK, TRANSPARENT}; +use crate::style::Color; +use crate::style::{AsRelative, ShapeStyle, SizeDesc, TextStyle}; + +use super::Coord3D; + +use crate::drawing::DrawingAreaErrorKind; + +use plotters_backend::DrawingBackend; + +/** +Implements 3D plot axes configurations. + +The best way to use this struct is by way of the [`configure_axes()`] function. +See [`ChartContext::configure_axes()`] for more information and examples. +*/ +pub struct Axes3dStyle<'a, 'b, X: Ranged, Y: Ranged, Z: Ranged, DB: DrawingBackend> { + pub(super) parent_size: (u32, u32), + pub(super) target: Option<&'b mut ChartContext<'a, DB, Cartesian3d<X, Y, Z>>>, + pub(super) tick_size: i32, + pub(super) light_lines_limit: [usize; 3], + pub(super) n_labels: [usize; 3], + pub(super) bold_line_style: ShapeStyle, + pub(super) light_line_style: ShapeStyle, + pub(super) axis_panel_style: ShapeStyle, + pub(super) axis_style: ShapeStyle, + pub(super) label_style: TextStyle<'b>, + pub(super) format_x: &'b dyn Fn(&X::ValueType) -> String, + pub(super) format_y: &'b dyn Fn(&Y::ValueType) -> String, + pub(super) format_z: &'b dyn Fn(&Z::ValueType) -> String, + _phantom: PhantomData<&'a (X, Y, Z)>, +} + +impl<'a, 'b, X, Y, Z, XT, YT, ZT, DB> Axes3dStyle<'a, 'b, X, Y, Z, DB> +where + X: Ranged<ValueType = XT> + ValueFormatter<XT>, + Y: Ranged<ValueType = YT> + ValueFormatter<YT>, + Z: Ranged<ValueType = ZT> + ValueFormatter<ZT>, + DB: DrawingBackend, +{ + /** + Set the size of the tick marks. + + - `value` Desired tick mark size, in pixels. + + See [`ChartContext::configure_axes()`] for more information and examples. + */ + pub fn tick_size<Size: SizeDesc>(&mut self, size: Size) -> &mut Self { + let actual_size = size.in_pixels(&self.parent_size); + self.tick_size = actual_size; + self + } + + /** + Set the maximum number of divisions for the minor grid in the X axis. + + - `value`: Maximum desired divisions between two consecutive X labels. + + See [`ChartContext::configure_axes()`] for more information and examples. + */ + pub fn x_max_light_lines(&mut self, value: usize) -> &mut Self { + self.light_lines_limit[0] = value; + self + } + + /** + Set the maximum number of divisions for the minor grid in the Y axis. + + - `value`: Maximum desired divisions between two consecutive Y labels. + + See [`ChartContext::configure_axes()`] for more information and examples. + */ + pub fn y_max_light_lines(&mut self, value: usize) -> &mut Self { + self.light_lines_limit[1] = value; + self + } + + /** + Set the maximum number of divisions for the minor grid in the Z axis. + + - `value`: Maximum desired divisions between two consecutive Z labels. + + See [`ChartContext::configure_axes()`] for more information and examples. + */ + pub fn z_max_light_lines(&mut self, value: usize) -> &mut Self { + self.light_lines_limit[2] = value; + self + } + + /** + Set the maximum number of divisions for the minor grid. + + - `value`: Maximum desired divisions between two consecutive labels in X, Y, and Z. + + See [`ChartContext::configure_axes()`] for more information and examples. + */ + pub fn max_light_lines(&mut self, value: usize) -> &mut Self { + self.light_lines_limit[0] = value; + self.light_lines_limit[1] = value; + self.light_lines_limit[2] = value; + self + } + + /** + Set the number of labels on the X axes. + + See [`ChartContext::configure_axes()`] for more information and examples. + */ + pub fn x_labels(&mut self, n: usize) -> &mut Self { + self.n_labels[0] = n; + self + } + + /** + Set the number of labels on the Y axes. + + See [`ChartContext::configure_axes()`] for more information and examples. + */ + pub fn y_labels(&mut self, n: usize) -> &mut Self { + self.n_labels[1] = n; + self + } + + /** + Set the number of labels on the Z axes. + + See [`ChartContext::configure_axes()`] for more information and examples. + */ + pub fn z_labels(&mut self, n: usize) -> &mut Self { + self.n_labels[2] = n; + self + } + + /** + Sets the style of the panels in the background. + + See [`ChartContext::configure_axes()`] for more information and examples. + */ + pub fn axis_panel_style<S: Into<ShapeStyle>>(&mut self, style: S) -> &mut Self { + self.axis_panel_style = style.into(); + self + } + + /** + Sets the style of the major grid lines. + + See [`ChartContext::configure_axes()`] for more information and examples. + */ + pub fn bold_grid_style<S: Into<ShapeStyle>>(&mut self, style: S) -> &mut Self { + self.bold_line_style = style.into(); + self + } + + /** + Sets the style of the minor grid lines. + + See [`ChartContext::configure_axes()`] for more information and examples. + */ + pub fn light_grid_style<S: Into<ShapeStyle>>(&mut self, style: S) -> &mut Self { + self.light_line_style = style.into(); + self + } + + /** + Sets the text style of the axis labels. + + See [`ChartContext::configure_axes()`] for more information and examples. + */ + pub fn label_style<S: Into<TextStyle<'b>>>(&mut self, style: S) -> &mut Self { + self.label_style = style.into(); + self + } + + /** + Specifies the string format of the X axis labels. + + See [`ChartContext::configure_axes()`] for more information and examples. + */ + pub fn x_formatter<F: Fn(&X::ValueType) -> String>(&mut self, f: &'b F) -> &mut Self { + self.format_x = f; + self + } + + /** + Specifies the string format of the Y axis labels. + + See [`ChartContext::configure_axes()`] for more information and examples. + */ + pub fn y_formatter<F: Fn(&Y::ValueType) -> String>(&mut self, f: &'b F) -> &mut Self { + self.format_y = f; + self + } + + /** + Specifies the string format of the Z axis labels. + + See [`ChartContext::configure_axes()`] for more information and examples. + */ + pub fn z_formatter<F: Fn(&Z::ValueType) -> String>(&mut self, f: &'b F) -> &mut Self { + self.format_z = f; + self + } + + /** + Constructs a new configuration object and defines the defaults. + + This is used internally by Plotters and should probably not be included in user code. + See [`ChartContext::configure_axes()`] for more information and examples. + */ + pub(crate) fn new(chart: &'b mut ChartContext<'a, DB, Cartesian3d<X, Y, Z>>) -> Self { + let parent_size = chart.drawing_area.dim_in_pixel(); + let base_tick_size = (5u32).percent().max(5).in_pixels(chart.plotting_area()); + let tick_size = base_tick_size; + Self { + parent_size, + tick_size, + light_lines_limit: [10, 10, 10], + n_labels: [10, 10, 10], + bold_line_style: Into::<ShapeStyle>::into(&BLACK.mix(0.2)), + light_line_style: Into::<ShapeStyle>::into(&TRANSPARENT), + axis_panel_style: Into::<ShapeStyle>::into(&BLACK.mix(0.1)), + axis_style: Into::<ShapeStyle>::into(&BLACK.mix(0.8)), + label_style: ("sans-serif", (12).percent().max(12).in_pixels(&parent_size)).into(), + format_x: &X::format, + format_y: &Y::format, + format_z: &Z::format, + _phantom: PhantomData, + target: Some(chart), + } + } + + pub fn draw(&mut self) -> Result<(), DrawingAreaErrorKind<DB::ErrorType>> + where + XT: Clone, + YT: Clone, + ZT: Clone, + { + let chart = self.target.take().unwrap(); + let kps_bold = chart.get_key_points( + BoldPoints(self.n_labels[0]), + BoldPoints(self.n_labels[1]), + BoldPoints(self.n_labels[2]), + ); + let kps_light = chart.get_key_points( + LightPoints::new( + self.n_labels[0], + self.n_labels[0] * self.light_lines_limit[0], + ), + LightPoints::new( + self.n_labels[1], + self.n_labels[1] * self.light_lines_limit[1], + ), + LightPoints::new( + self.n_labels[2], + self.n_labels[2] * self.light_lines_limit[2], + ), + ); + + let panels = chart.draw_axis_panels( + &kps_bold, + &kps_light, + self.axis_panel_style, + self.bold_line_style, + self.light_line_style, + )?; + + for i in 0..3 { + let axis = chart.draw_axis(i, &panels, self.axis_style)?; + let labels: Vec<_> = match i { + 0 => kps_bold + .x_points + .iter() + .map(|x| { + let x_text = (self.format_x)(x); + let mut p = axis[0].clone(); + p[0] = Coord3D::X(x.clone()); + (p, x_text) + }) + .collect(), + 1 => kps_bold + .y_points + .iter() + .map(|y| { + let y_text = (self.format_y)(y); + let mut p = axis[0].clone(); + p[1] = Coord3D::Y(y.clone()); + (p, y_text) + }) + .collect(), + _ => kps_bold + .z_points + .iter() + .map(|z| { + let z_text = (self.format_z)(z); + let mut p = axis[0].clone(); + p[2] = Coord3D::Z(z.clone()); + (p, z_text) + }) + .collect(), + }; + chart.draw_axis_ticks( + axis, + &labels[..], + self.tick_size, + self.axis_style, + self.label_style.clone(), + )?; + } + + Ok(()) + } +} diff --git a/vendor/plotters/src/chart/builder.rs b/vendor/plotters/src/chart/builder.rs new file mode 100644 index 000000000..cf804c6e6 --- /dev/null +++ b/vendor/plotters/src/chart/builder.rs @@ -0,0 +1,568 @@ +use super::context::ChartContext; + +use crate::coord::cartesian::{Cartesian2d, Cartesian3d}; +use crate::coord::ranged1d::AsRangedCoord; +use crate::coord::Shift; + +use crate::drawing::{DrawingArea, DrawingAreaErrorKind}; +use crate::style::{IntoTextStyle, SizeDesc, TextStyle}; + +use plotters_backend::DrawingBackend; + +/** +Specifies one of the four label positions around the figure. + +This is used to configure the label area size with function +[`ChartBuilder::set_label_area_size()`]. + +# Example + +``` +use plotters::prelude::*; +let drawing_area = SVGBackend::new("label_area_position.svg", (300, 200)).into_drawing_area(); +drawing_area.fill(&WHITE).unwrap(); +let mut chart_builder = ChartBuilder::on(&drawing_area); +chart_builder.set_label_area_size(LabelAreaPosition::Bottom, 60).set_label_area_size(LabelAreaPosition::Left, 35); +let mut chart_context = chart_builder.build_cartesian_2d(0.0..4.0, 0.0..3.0).unwrap(); +chart_context.configure_mesh().x_desc("Spacious X label area").y_desc("Narrow Y label area").draw().unwrap(); +``` + +The result is a chart with a spacious X label area and a narrow Y label area: + + + +# See also + +[`ChartBuilder::set_left_and_bottom_label_area_size()`] +*/ +#[derive(Copy, Clone)] +pub enum LabelAreaPosition { + /// Top of the figure + Top = 0, + /// Bottom of the figure + Bottom = 1, + /// Left side of the figure + Left = 2, + /// Right side of the figure + Right = 3, +} + +/** +The helper object to create a chart context, which is used for the high-level figure drawing. + +With the help of this object, we can convert a basic drawing area into a chart context, which +allows the high-level charting API being used on the drawing area. + +See [`ChartBuilder::on()`] for more information and examples. +*/ +pub struct ChartBuilder<'a, 'b, DB: DrawingBackend> { + label_area_size: [u32; 4], // [upper, lower, left, right] + overlap_plotting_area: [bool; 4], + root_area: &'a DrawingArea<DB, Shift>, + title: Option<(String, TextStyle<'b>)>, + margin: [u32; 4], +} + +impl<'a, 'b, DB: DrawingBackend> ChartBuilder<'a, 'b, DB> { + /** + Create a chart builder on the given drawing area + + - `root`: The root drawing area + - Returns: The chart builder object + + # Example + + ``` + use plotters::prelude::*; + let drawing_area = SVGBackend::new("chart_builder_on.svg", (300, 200)).into_drawing_area(); + drawing_area.fill(&WHITE).unwrap(); + let mut chart_builder = ChartBuilder::on(&drawing_area); + chart_builder.margin(5).set_left_and_bottom_label_area_size(35) + .caption("Figure title or caption", ("Calibri", 20, FontStyle::Italic, &RED).into_text_style(&drawing_area)); + let mut chart_context = chart_builder.build_cartesian_2d(0.0..3.8, 0.0..2.8).unwrap(); + chart_context.configure_mesh().draw().unwrap(); + ``` + The result is a chart with customized margins, label area sizes, and title: + +  + + */ + pub fn on(root: &'a DrawingArea<DB, Shift>) -> Self { + Self { + label_area_size: [0; 4], + root_area: root, + title: None, + margin: [0; 4], + overlap_plotting_area: [false; 4], + } + } + + /** + Sets the size of the four margins of the chart. + + - `size`: The desired size of the four chart margins in backend units (pixels). + + See [`ChartBuilder::on()`] for more information and examples. + */ + pub fn margin<S: SizeDesc>(&mut self, size: S) -> &mut Self { + let size = size.in_pixels(self.root_area).max(0) as u32; + self.margin = [size, size, size, size]; + self + } + + /** + Sets the size of the top margin of the chart. + + - `size`: The desired size of the margin in backend units (pixels). + + See [`ChartBuilder::on()`] for more information and examples. + */ + pub fn margin_top<S: SizeDesc>(&mut self, size: S) -> &mut Self { + let size = size.in_pixels(self.root_area).max(0) as u32; + self.margin[0] = size; + self + } + + /** + Sets the size of the bottom margin of the chart. + + - `size`: The desired size of the margin in backend units (pixels). + + See [`ChartBuilder::on()`] for more information and examples. + */ + pub fn margin_bottom<S: SizeDesc>(&mut self, size: S) -> &mut Self { + let size = size.in_pixels(self.root_area).max(0) as u32; + self.margin[1] = size; + self + } + + /** + Sets the size of the left margin of the chart. + + - `size`: The desired size of the margin in backend units (pixels). + + See [`ChartBuilder::on()`] for more information and examples. + */ + pub fn margin_left<S: SizeDesc>(&mut self, size: S) -> &mut Self { + let size = size.in_pixels(self.root_area).max(0) as u32; + self.margin[2] = size; + self + } + + /** + Sets the size of the right margin of the chart. + + - `size`: The desired size of the margin in backend units (pixels). + + See [`ChartBuilder::on()`] for more information and examples. + */ + pub fn margin_right<S: SizeDesc>(&mut self, size: S) -> &mut Self { + let size = size.in_pixels(self.root_area).max(0) as u32; + self.margin[3] = size; + self + } + + /** + Sets the size of the four label areas of the chart. + + - `size`: The desired size of the four label areas in backend units (pixels). + + See [`ChartBuilder::on()`] for more information and examples. + */ + pub fn set_all_label_area_size<S: SizeDesc>(&mut self, size: S) -> &mut Self { + let size = size.in_pixels(self.root_area); + self.set_label_area_size(LabelAreaPosition::Top, size) + .set_label_area_size(LabelAreaPosition::Bottom, size) + .set_label_area_size(LabelAreaPosition::Left, size) + .set_label_area_size(LabelAreaPosition::Right, size) + } + + /** + Sets the size of the left and bottom label areas of the chart. + + - `size`: The desired size of the left and bottom label areas in backend units (pixels). + + See [`ChartBuilder::on()`] for more information and examples. + */ + pub fn set_left_and_bottom_label_area_size<S: SizeDesc>(&mut self, size: S) -> &mut Self { + let size = size.in_pixels(self.root_area); + self.set_label_area_size(LabelAreaPosition::Left, size) + .set_label_area_size(LabelAreaPosition::Bottom, size) + } + + /** + Sets the size of the X label area at the bottom of the chart. + + - `size`: The desired size of the X label area in backend units (pixels). + If set to 0, the X label area is removed. + + See [`ChartBuilder::on()`] for more information and examples. + */ + pub fn x_label_area_size<S: SizeDesc>(&mut self, size: S) -> &mut Self { + self.set_label_area_size(LabelAreaPosition::Bottom, size) + } + + /** + Sets the size of the Y label area to the left of the chart. + + - `size`: The desired size of the Y label area in backend units (pixels). + If set to 0, the Y label area is removed. + + See [`ChartBuilder::on()`] for more information and examples. + */ + pub fn y_label_area_size<S: SizeDesc>(&mut self, size: S) -> &mut Self { + self.set_label_area_size(LabelAreaPosition::Left, size) + } + + /** + Sets the size of the X label area at the top of the chart. + + - `size`: The desired size of the top X label area in backend units (pixels). + If set to 0, the top X label area is removed. + + See [`ChartBuilder::on()`] for more information and examples. + */ + pub fn top_x_label_area_size<S: SizeDesc>(&mut self, size: S) -> &mut Self { + self.set_label_area_size(LabelAreaPosition::Top, size) + } + + /** + Sets the size of the Y label area to the right of the chart. + + - `size`: The desired size of the Y label area in backend units (pixels). + If set to 0, the Y label area to the right is removed. + + See [`ChartBuilder::on()`] for more information and examples. + */ + pub fn right_y_label_area_size<S: SizeDesc>(&mut self, size: S) -> &mut Self { + self.set_label_area_size(LabelAreaPosition::Right, size) + } + + /** + Sets the size of a chart label area. + + - `pos`: The position of the desired label area to adjust + - `size`: The desired size of the label area in backend units (pixels). + If set to 0, the label area is removed. + + See [`ChartBuilder::on()`] for more information and examples. + */ + pub fn set_label_area_size<S: SizeDesc>( + &mut self, + pos: LabelAreaPosition, + size: S, + ) -> &mut Self { + let size = size.in_pixels(self.root_area); + self.label_area_size[pos as usize] = size.unsigned_abs(); + self.overlap_plotting_area[pos as usize] = size < 0; + self + } + + /** + Sets the title or caption of the chart. + + - `caption`: The caption of the chart + - `style`: The text style + + The title or caption will be centered at the top of the drawing area. + + See [`ChartBuilder::on()`] for more information and examples. + */ + pub fn caption<S: AsRef<str>, Style: IntoTextStyle<'b>>( + &mut self, + caption: S, + style: Style, + ) -> &mut Self { + self.title = Some(( + caption.as_ref().to_string(), + style.into_text_style(self.root_area), + )); + self + } + + /// This function has been renamed to [`ChartBuilder::build_cartesian_2d()`] and is to be removed in the future. + #[allow(clippy::type_complexity)] + #[deprecated( + note = "`build_ranged` has been renamed to `build_cartesian_2d` and is to be removed in the future." + )] + pub fn build_ranged<X: AsRangedCoord, Y: AsRangedCoord>( + &mut self, + x_spec: X, + y_spec: Y, + ) -> Result< + ChartContext<'a, DB, Cartesian2d<X::CoordDescType, Y::CoordDescType>>, + DrawingAreaErrorKind<DB::ErrorType>, + > { + self.build_cartesian_2d(x_spec, y_spec) + } + + /** + Builds a chart with a 2D Cartesian coordinate system. + + - `x_spec`: Specifies the X axis range and data properties + - `y_spec`: Specifies the Y axis range and data properties + - Returns: A `ChartContext` object, ready to visualize data. + + See [`ChartBuilder::on()`] and [`ChartContext::configure_mesh()`] for more information and examples. + */ + #[allow(clippy::type_complexity)] + pub fn build_cartesian_2d<X: AsRangedCoord, Y: AsRangedCoord>( + &mut self, + x_spec: X, + y_spec: Y, + ) -> Result< + ChartContext<'a, DB, Cartesian2d<X::CoordDescType, Y::CoordDescType>>, + DrawingAreaErrorKind<DB::ErrorType>, + > { + let mut label_areas = [None, None, None, None]; + + let mut drawing_area = DrawingArea::clone(self.root_area); + + if *self.margin.iter().max().unwrap_or(&0) > 0 { + drawing_area = drawing_area.margin( + self.margin[0] as i32, + self.margin[1] as i32, + self.margin[2] as i32, + self.margin[3] as i32, + ); + } + + let (title_dx, title_dy) = if let Some((ref title, ref style)) = self.title { + let (origin_dx, origin_dy) = drawing_area.get_base_pixel(); + drawing_area = drawing_area.titled(title, style.clone())?; + let (current_dx, current_dy) = drawing_area.get_base_pixel(); + (current_dx - origin_dx, current_dy - origin_dy) + } else { + (0, 0) + }; + + let (w, h) = drawing_area.dim_in_pixel(); + + let mut actual_drawing_area_pos = [0, h as i32, 0, w as i32]; + + const DIR: [(i16, i16); 4] = [(0, -1), (0, 1), (-1, 0), (1, 0)]; + + for (idx, (dx, dy)) in (0..4).map(|idx| (idx, DIR[idx])) { + if self.overlap_plotting_area[idx] { + continue; + } + + let size = self.label_area_size[idx] as i32; + + let split_point = if dx + dy < 0 { size } else { -size }; + + actual_drawing_area_pos[idx] += split_point; + } + + // Now the root drawing area is to be split into + // + // +----------+------------------------------+------+ + // | 0 | 1 (Top Label Area) | 2 | + // +----------+------------------------------+------+ + // | 3 | | 5 | + // | Left | 4 (Plotting Area) | Right| + // | Labels | | Label| + // +----------+------------------------------+------+ + // | 6 | 7 (Bottom Labels) | 8 | + // +----------+------------------------------+------+ + + let mut split: Vec<_> = drawing_area + .split_by_breakpoints( + &actual_drawing_area_pos[2..4], + &actual_drawing_area_pos[0..2], + ) + .into_iter() + .map(Some) + .collect(); + + // Take out the plotting area + std::mem::swap(&mut drawing_area, split[4].as_mut().unwrap()); + + // Initialize the label areas - since the label area might be overlapping + // with the plotting area, in this case, we need handle them differently + for (src_idx, dst_idx) in [1, 7, 3, 5].iter().zip(0..4) { + if !self.overlap_plotting_area[dst_idx] { + let (h, w) = split[*src_idx].as_ref().unwrap().dim_in_pixel(); + if h > 0 && w > 0 { + std::mem::swap(&mut label_areas[dst_idx], &mut split[*src_idx]); + } + } else if self.label_area_size[dst_idx] != 0 { + let size = self.label_area_size[dst_idx] as i32; + let (dw, dh) = drawing_area.dim_in_pixel(); + let x0 = if DIR[dst_idx].0 > 0 { + dw as i32 - size + } else { + 0 + }; + let y0 = if DIR[dst_idx].1 > 0 { + dh as i32 - size + } else { + 0 + }; + let x1 = if DIR[dst_idx].0 >= 0 { dw as i32 } else { size }; + let y1 = if DIR[dst_idx].1 >= 0 { dh as i32 } else { size }; + + label_areas[dst_idx] = Some( + drawing_area + .clone() + .shrink((x0, y0), ((x1 - x0), (y1 - y0))), + ); + } + } + + let mut pixel_range = drawing_area.get_pixel_range(); + pixel_range.0.end -= 1; + pixel_range.1.end -= 1; + pixel_range.1 = pixel_range.1.end..pixel_range.1.start; + + let mut x_label_area = [None, None]; + let mut y_label_area = [None, None]; + + std::mem::swap(&mut x_label_area[0], &mut label_areas[0]); + std::mem::swap(&mut x_label_area[1], &mut label_areas[1]); + std::mem::swap(&mut y_label_area[0], &mut label_areas[2]); + std::mem::swap(&mut y_label_area[1], &mut label_areas[3]); + + Ok(ChartContext { + x_label_area, + y_label_area, + drawing_area: drawing_area.apply_coord_spec(Cartesian2d::new( + x_spec, + y_spec, + pixel_range, + )), + series_anno: vec![], + drawing_area_pos: ( + actual_drawing_area_pos[2] + title_dx + self.margin[2] as i32, + actual_drawing_area_pos[0] + title_dy + self.margin[0] as i32, + ), + }) + } + + /** + Builds a chart with a 3D Cartesian coordinate system. + + - `x_spec`: Specifies the X axis range and data properties + - `y_spec`: Specifies the Y axis range and data properties + - `z_sepc`: Specifies the Z axis range and data properties + - Returns: A `ChartContext` object, ready to visualize data. + + See [`ChartBuilder::on()`] and [`ChartContext::configure_axes()`] for more information and examples. + */ + #[allow(clippy::type_complexity)] + pub fn build_cartesian_3d<X: AsRangedCoord, Y: AsRangedCoord, Z: AsRangedCoord>( + &mut self, + x_spec: X, + y_spec: Y, + z_spec: Z, + ) -> Result< + ChartContext<'a, DB, Cartesian3d<X::CoordDescType, Y::CoordDescType, Z::CoordDescType>>, + DrawingAreaErrorKind<DB::ErrorType>, + > { + let mut drawing_area = DrawingArea::clone(self.root_area); + + if *self.margin.iter().max().unwrap_or(&0) > 0 { + drawing_area = drawing_area.margin( + self.margin[0] as i32, + self.margin[1] as i32, + self.margin[2] as i32, + self.margin[3] as i32, + ); + } + + let (title_dx, title_dy) = if let Some((ref title, ref style)) = self.title { + let (origin_dx, origin_dy) = drawing_area.get_base_pixel(); + drawing_area = drawing_area.titled(title, style.clone())?; + let (current_dx, current_dy) = drawing_area.get_base_pixel(); + (current_dx - origin_dx, current_dy - origin_dy) + } else { + (0, 0) + }; + + let pixel_range = drawing_area.get_pixel_range(); + + Ok(ChartContext { + x_label_area: [None, None], + y_label_area: [None, None], + drawing_area: drawing_area.apply_coord_spec(Cartesian3d::new( + x_spec, + y_spec, + z_spec, + pixel_range, + )), + series_anno: vec![], + drawing_area_pos: ( + title_dx + self.margin[2] as i32, + title_dy + self.margin[0] as i32, + ), + }) + } +} + +#[cfg(test)] +mod test { + use super::*; + use crate::prelude::*; + #[test] + fn test_label_area_size() { + let drawing_area = create_mocked_drawing_area(200, 200, |_| {}); + let mut chart = ChartBuilder::on(&drawing_area); + + chart + .x_label_area_size(10) + .y_label_area_size(20) + .top_x_label_area_size(30) + .right_y_label_area_size(40); + assert_eq!(chart.label_area_size[1], 10); + assert_eq!(chart.label_area_size[2], 20); + assert_eq!(chart.label_area_size[0], 30); + assert_eq!(chart.label_area_size[3], 40); + + chart.set_label_area_size(LabelAreaPosition::Left, 100); + chart.set_label_area_size(LabelAreaPosition::Right, 200); + chart.set_label_area_size(LabelAreaPosition::Top, 300); + chart.set_label_area_size(LabelAreaPosition::Bottom, 400); + + assert_eq!(chart.label_area_size[0], 300); + assert_eq!(chart.label_area_size[1], 400); + assert_eq!(chart.label_area_size[2], 100); + assert_eq!(chart.label_area_size[3], 200); + } + + #[test] + fn test_margin_configure() { + let drawing_area = create_mocked_drawing_area(200, 200, |_| {}); + let mut chart = ChartBuilder::on(&drawing_area); + + chart.margin(5); + assert_eq!(chart.margin[0], 5); + assert_eq!(chart.margin[1], 5); + assert_eq!(chart.margin[2], 5); + assert_eq!(chart.margin[3], 5); + + chart.margin_top(10); + chart.margin_bottom(11); + chart.margin_left(12); + chart.margin_right(13); + assert_eq!(chart.margin[0], 10); + assert_eq!(chart.margin[1], 11); + assert_eq!(chart.margin[2], 12); + assert_eq!(chart.margin[3], 13); + } + + #[test] + fn test_caption() { + let drawing_area = create_mocked_drawing_area(200, 200, |_| {}); + let mut chart = ChartBuilder::on(&drawing_area); + + chart.caption("This is a test case", ("serif", 10)); + + assert_eq!(chart.title.as_ref().unwrap().0, "This is a test case"); + assert_eq!(chart.title.as_ref().unwrap().1.font.get_name(), "serif"); + assert_eq!(chart.title.as_ref().unwrap().1.font.get_size(), 10.0); + check_color(chart.title.as_ref().unwrap().1.color, BLACK.to_rgba()); + + chart.caption("This is a test case", ("serif", 10)); + assert_eq!(chart.title.as_ref().unwrap().1.font.get_name(), "serif"); + } +} diff --git a/vendor/plotters/src/chart/context.rs b/vendor/plotters/src/chart/context.rs new file mode 100644 index 000000000..ef91af195 --- /dev/null +++ b/vendor/plotters/src/chart/context.rs @@ -0,0 +1,221 @@ +use std::borrow::Borrow; + +use plotters_backend::{BackendCoord, DrawingBackend}; + +use crate::chart::{SeriesAnno, SeriesLabelStyle}; +use crate::coord::{CoordTranslate, ReverseCoordTranslate, Shift}; +use crate::drawing::{DrawingArea, DrawingAreaErrorKind}; +use crate::element::{CoordMapper, Drawable, PointCollection}; + +pub(super) mod cartesian2d; +pub(super) mod cartesian3d; + +pub(super) use cartesian3d::Coord3D; + +/** +The context of the chart. This is the core object of Plotters. + +Any plot/chart is abstracted as this type, and any data series can be placed to the chart context. + +- To draw a series on a chart context, use [`ChartContext::draw_series()`]. +- To draw a single element on the chart, you may want to use [`ChartContext::plotting_area()`]. + +See [`crate::series::LineSeries`] and [`ChartContext::configure_series_labels()`] for more information and examples +*/ +pub struct ChartContext<'a, DB: DrawingBackend, CT: CoordTranslate> { + pub(crate) x_label_area: [Option<DrawingArea<DB, Shift>>; 2], + pub(crate) y_label_area: [Option<DrawingArea<DB, Shift>>; 2], + pub(crate) drawing_area: DrawingArea<DB, CT>, + pub(crate) series_anno: Vec<SeriesAnno<'a, DB>>, + pub(crate) drawing_area_pos: (i32, i32), +} + +impl<'a, DB: DrawingBackend, CT: ReverseCoordTranslate> ChartContext<'a, DB, CT> { + /// Convert the chart context into an closure that can be used for coordinate translation + pub fn into_coord_trans(self) -> impl Fn(BackendCoord) -> Option<CT::From> { + let coord_spec = self.drawing_area.into_coord_spec(); + move |coord| coord_spec.reverse_translate(coord) + } +} + +impl<'a, DB: DrawingBackend, CT: CoordTranslate> ChartContext<'a, DB, CT> { + /** + Configure the styles for drawing series labels in the chart + + # Example + + ``` + use plotters::prelude::*; + let data = [(1.0, 3.3), (2., 2.1), (3., 1.5), (4., 1.9), (5., 1.0)]; + let drawing_area = SVGBackend::new("configure_series_labels.svg", (300, 200)).into_drawing_area(); + drawing_area.fill(&WHITE).unwrap(); + let mut chart_builder = ChartBuilder::on(&drawing_area); + chart_builder.margin(7).set_left_and_bottom_label_area_size(20); + let mut chart_context = chart_builder.build_cartesian_2d(0.0..5.5, 0.0..5.5).unwrap(); + chart_context.configure_mesh().draw().unwrap(); + chart_context.draw_series(LineSeries::new(data, BLACK)).unwrap().label("Series 1") + .legend(|(x,y)| Rectangle::new([(x - 15, y + 1), (x, y)], BLACK)); + chart_context.configure_series_labels().position(SeriesLabelPosition::UpperRight).margin(20) + .legend_area_size(5).border_style(BLUE).background_style(BLUE.mix(0.1)).label_font(("Calibri", 20)).draw().unwrap(); + ``` + + The result is a chart with one data series labeled "Series 1" in a blue legend box: + +  + + # See also + + See [`crate::series::LineSeries`] for more information and examples + */ + pub fn configure_series_labels<'b>(&'b mut self) -> SeriesLabelStyle<'a, 'b, DB, CT> + where + DB: 'a, + { + SeriesLabelStyle::new(self) + } + + /// Get a reference of underlying plotting area + pub fn plotting_area(&self) -> &DrawingArea<DB, CT> { + &self.drawing_area + } + + /// Cast the reference to a chart context to a reference to underlying coordinate specification. + pub fn as_coord_spec(&self) -> &CT { + self.drawing_area.as_coord_spec() + } + + // TODO: All draw_series_impl is overly strict about lifetime, because we don't have stable HKT, + // what we can ensure is for all lifetime 'b the element reference &'b E is a iterator + // of points reference with the same lifetime. + // However, this doesn't work if the coordinate doesn't live longer than the backend, + // this is unnecessarily strict + pub(crate) fn draw_series_impl<B, E, R, S>( + &mut self, + series: S, + ) -> Result<(), DrawingAreaErrorKind<DB::ErrorType>> + where + B: CoordMapper, + for<'b> &'b E: PointCollection<'b, CT::From, B>, + E: Drawable<DB, B>, + R: Borrow<E>, + S: IntoIterator<Item = R>, + { + for element in series { + self.drawing_area.draw(element.borrow())?; + } + Ok(()) + } + + pub(crate) fn alloc_series_anno(&mut self) -> &mut SeriesAnno<'a, DB> { + let idx = self.series_anno.len(); + self.series_anno.push(SeriesAnno::new()); + &mut self.series_anno[idx] + } + + /** + Draws a data series. A data series in Plotters is abstracted as an iterator of elements. + + See [`crate::series::LineSeries`] and [`ChartContext::configure_series_labels()`] for more information and examples. + */ + pub fn draw_series<B, E, R, S>( + &mut self, + series: S, + ) -> Result<&mut SeriesAnno<'a, DB>, DrawingAreaErrorKind<DB::ErrorType>> + where + B: CoordMapper, + for<'b> &'b E: PointCollection<'b, CT::From, B>, + E: Drawable<DB, B>, + R: Borrow<E>, + S: IntoIterator<Item = R>, + { + self.draw_series_impl(series)?; + Ok(self.alloc_series_anno()) + } +} + +#[cfg(test)] +mod test { + use crate::prelude::*; + + #[test] + fn test_chart_context() { + let drawing_area = create_mocked_drawing_area(200, 200, |_| {}); + + drawing_area.fill(&WHITE).expect("Fill"); + + let mut chart = ChartBuilder::on(&drawing_area) + .caption("Test Title", ("serif", 10)) + .x_label_area_size(20) + .y_label_area_size(20) + .set_label_area_size(LabelAreaPosition::Top, 20) + .set_label_area_size(LabelAreaPosition::Right, 20) + .build_cartesian_2d(0..10, 0..10) + .expect("Create chart") + .set_secondary_coord(0.0..1.0, 0.0..1.0); + + chart + .configure_mesh() + .x_desc("X") + .y_desc("Y") + .draw() + .expect("Draw mesh"); + chart + .configure_secondary_axes() + .x_desc("X") + .y_desc("Y") + .draw() + .expect("Draw Secondary axes"); + + // test that chart states work correctly with dual coord charts + let cs = chart.into_chart_state(); + let mut chart = cs.clone().restore(&drawing_area); + + chart + .draw_series(std::iter::once(Circle::new((5, 5), 5, &RED))) + .expect("Drawing error"); + chart + .draw_secondary_series(std::iter::once(Circle::new((0.3, 0.8), 5, &GREEN))) + .expect("Drawing error") + .label("Test label") + .legend(|(x, y)| Rectangle::new([(x - 10, y - 5), (x, y + 5)], &GREEN)); + + chart + .configure_series_labels() + .position(SeriesLabelPosition::UpperMiddle) + .draw() + .expect("Drawing error"); + } + + #[test] + fn test_chart_context_3d() { + let drawing_area = create_mocked_drawing_area(200, 200, |_| {}); + + drawing_area.fill(&WHITE).expect("Fill"); + + let mut chart = ChartBuilder::on(&drawing_area) + .caption("Test Title", ("serif", 10)) + .x_label_area_size(20) + .y_label_area_size(20) + .set_label_area_size(LabelAreaPosition::Top, 20) + .set_label_area_size(LabelAreaPosition::Right, 20) + .build_cartesian_3d(0..10, 0..10, 0..10) + .expect("Create chart"); + + chart.with_projection(|mut pb| { + pb.yaw = 0.5; + pb.pitch = 0.5; + pb.scale = 0.5; + pb.into_matrix() + }); + + chart.configure_axes().draw().expect("Drawing axes"); + + // test that chart states work correctly with 3d coordinates + let cs = chart.into_chart_state(); + let mut chart = cs.clone().restore(&drawing_area); + + chart + .draw_series(std::iter::once(Circle::new((5, 5, 5), 5, &RED))) + .expect("Drawing error"); + } +} diff --git a/vendor/plotters/src/chart/context/cartesian2d/draw_impl.rs b/vendor/plotters/src/chart/context/cartesian2d/draw_impl.rs new file mode 100644 index 000000000..6dafa0879 --- /dev/null +++ b/vendor/plotters/src/chart/context/cartesian2d/draw_impl.rs @@ -0,0 +1,372 @@ +use std::ops::Range; + +use plotters_backend::DrawingBackend; + +use crate::chart::ChartContext; +use crate::coord::{ + cartesian::{Cartesian2d, MeshLine}, + ranged1d::{KeyPointHint, Ranged}, + Shift, +}; +use crate::drawing::{DrawingArea, DrawingAreaErrorKind}; +use crate::element::PathElement; +use crate::style::{ + text_anchor::{HPos, Pos, VPos}, + FontTransform, ShapeStyle, TextStyle, +}; + +impl<'a, DB: DrawingBackend, X: Ranged, Y: Ranged> ChartContext<'a, DB, Cartesian2d<X, Y>> { + /// The actual function that draws the mesh lines. + /// It also returns the label that suppose to be there. + #[allow(clippy::type_complexity)] + fn draw_mesh_lines<FmtLabel, YH: KeyPointHint, XH: KeyPointHint>( + &mut self, + (r, c): (YH, XH), + (x_mesh, y_mesh): (bool, bool), + mesh_line_style: &ShapeStyle, + mut fmt_label: FmtLabel, + ) -> Result<(Vec<(i32, String)>, Vec<(i32, String)>), DrawingAreaErrorKind<DB::ErrorType>> + where + FmtLabel: FnMut(&X, &Y, &MeshLine<X, Y>) -> Option<String>, + { + let mut x_labels = vec![]; + let mut y_labels = vec![]; + let xr = self.drawing_area.as_coord_spec().x_spec(); + let yr = self.drawing_area.as_coord_spec().y_spec(); + self.drawing_area.draw_mesh( + |b, l| { + let draw = match l { + MeshLine::XMesh((x, _), _, _) => { + if let Some(label_text) = fmt_label(xr, yr, &l) { + x_labels.push((x, label_text)); + } + x_mesh + } + MeshLine::YMesh((_, y), _, _) => { + if let Some(label_text) = fmt_label(xr, yr, &l) { + y_labels.push((y, label_text)); + } + y_mesh + } + }; + if draw { + l.draw(b, mesh_line_style) + } else { + Ok(()) + } + }, + r, + c, + )?; + Ok((x_labels, y_labels)) + } + + fn draw_axis( + &self, + area: &DrawingArea<DB, Shift>, + axis_style: Option<&ShapeStyle>, + orientation: (i16, i16), + inward_labels: bool, + ) -> Result<Range<i32>, DrawingAreaErrorKind<DB::ErrorType>> { + let (x0, y0) = self.drawing_area.get_base_pixel(); + let (tw, th) = area.dim_in_pixel(); + + let mut axis_range = if orientation.0 == 0 { + self.drawing_area.get_x_axis_pixel_range() + } else { + self.drawing_area.get_y_axis_pixel_range() + }; + + // At this point, the coordinate system tells us the pixel range after the translation. + // However, we need to use the logic coordinate system for drawing. + if orientation.0 == 0 { + axis_range.start -= x0; + axis_range.end -= x0; + } else { + axis_range.start -= y0; + axis_range.end -= y0; + } + + if let Some(axis_style) = axis_style { + let mut x0 = if orientation.0 > 0 { 0 } else { tw as i32 - 1 }; + let mut y0 = if orientation.1 > 0 { 0 } else { th as i32 - 1 }; + let mut x1 = if orientation.0 >= 0 { 0 } else { tw as i32 - 1 }; + let mut y1 = if orientation.1 >= 0 { 0 } else { th as i32 - 1 }; + + if inward_labels { + if orientation.0 == 0 { + if y0 == 0 { + y0 = th as i32 - 1; + y1 = th as i32 - 1; + } else { + y0 = 0; + y1 = 0; + } + } else if x0 == 0 { + x0 = tw as i32 - 1; + x1 = tw as i32 - 1; + } else { + x0 = 0; + x1 = 0; + } + } + + if orientation.0 == 0 { + x0 = axis_range.start; + x1 = axis_range.end; + } else { + y0 = axis_range.start; + y1 = axis_range.end; + } + + area.draw(&PathElement::new( + vec![(x0, y0), (x1, y1)], + *axis_style, + ))?; + } + + Ok(axis_range) + } + + // TODO: consider make this function less complicated + #[allow(clippy::too_many_arguments)] + #[allow(clippy::cognitive_complexity)] + fn draw_axis_and_labels( + &self, + area: Option<&DrawingArea<DB, Shift>>, + axis_style: Option<&ShapeStyle>, + labels: &[(i32, String)], + label_style: &TextStyle, + label_offset: i32, + orientation: (i16, i16), + axis_desc: Option<(&str, &TextStyle)>, + tick_size: i32, + ) -> Result<(), DrawingAreaErrorKind<DB::ErrorType>> { + let area = if let Some(target) = area { + target + } else { + return Ok(()); + }; + + let (x0, y0) = self.drawing_area.get_base_pixel(); + let (tw, th) = area.dim_in_pixel(); + + /* This is the minimal distance from the axis to the box of the labels */ + let label_dist = tick_size.abs() * 2; + + /* Draw the axis and get the axis range so that we can do further label + * and tick mark drawing */ + let axis_range = self.draw_axis(area, axis_style, orientation, tick_size < 0)?; + + /* To make the right label area looks nice, it's a little bit tricky, since for a that is + * very long, we actually prefer left alignment instead of right alignment. + * Otherwise, the right alignment looks better. So we estimate the max and min label width + * So that we are able decide if we should apply right alignment for the text. */ + let label_width: Vec<_> = labels + .iter() + .map(|(_, text)| { + if orientation.0 > 0 && orientation.1 == 0 && tick_size >= 0 { + self.drawing_area + .estimate_text_size(text, label_style) + .map(|(w, _)| w) + .unwrap_or(0) as i32 + } else { + // Don't ever do the layout estimationfor the drawing area that is either not + // the right one or the tick mark is inward. + 0 + } + }) + .collect(); + + let min_width = *label_width.iter().min().unwrap_or(&1).max(&1); + let max_width = *label_width + .iter() + .filter(|&&x| x < min_width * 2) + .max() + .unwrap_or(&min_width); + let right_align_width = (min_width * 2).min(max_width); + + /* Then we need to draw the tick mark and the label */ + for ((p, t), w) in labels.iter().zip(label_width.into_iter()) { + /* Make sure we are actually in the visible range */ + let rp = if orientation.0 == 0 { *p - x0 } else { *p - y0 }; + + if rp < axis_range.start.min(axis_range.end) + || axis_range.end.max(axis_range.start) < rp + { + continue; + } + + let (cx, cy, h_pos, v_pos) = if tick_size >= 0 { + match orientation { + // Right + (dx, dy) if dx > 0 && dy == 0 => { + if w >= right_align_width { + (label_dist, *p - y0, HPos::Left, VPos::Center) + } else { + ( + label_dist + right_align_width, + *p - y0, + HPos::Right, + VPos::Center, + ) + } + } + // Left + (dx, dy) if dx < 0 && dy == 0 => { + (tw as i32 - label_dist, *p - y0, HPos::Right, VPos::Center) + } + // Bottom + (dx, dy) if dx == 0 && dy > 0 => (*p - x0, label_dist, HPos::Center, VPos::Top), + // Top + (dx, dy) if dx == 0 && dy < 0 => { + (*p - x0, th as i32 - label_dist, HPos::Center, VPos::Bottom) + } + _ => panic!("Bug: Invalid orientation specification"), + } + } else { + match orientation { + // Right + (dx, dy) if dx > 0 && dy == 0 => { + (tw as i32 - label_dist, *p - y0, HPos::Right, VPos::Center) + } + // Left + (dx, dy) if dx < 0 && dy == 0 => { + (label_dist, *p - y0, HPos::Left, VPos::Center) + } + // Bottom + (dx, dy) if dx == 0 && dy > 0 => { + (*p - x0, th as i32 - label_dist, HPos::Center, VPos::Bottom) + } + // Top + (dx, dy) if dx == 0 && dy < 0 => (*p - x0, label_dist, HPos::Center, VPos::Top), + _ => panic!("Bug: Invalid orientation specification"), + } + }; + + let (text_x, text_y) = if orientation.0 == 0 { + (cx + label_offset, cy) + } else { + (cx, cy + label_offset) + }; + + let label_style = &label_style.pos(Pos::new(h_pos, v_pos)); + area.draw_text(t, label_style, (text_x, text_y))?; + + if tick_size != 0 { + if let Some(style) = axis_style { + let xmax = tw as i32 - 1; + let ymax = th as i32 - 1; + let (kx0, ky0, kx1, ky1) = if tick_size > 0 { + match orientation { + (dx, dy) if dx > 0 && dy == 0 => (0, *p - y0, tick_size, *p - y0), + (dx, dy) if dx < 0 && dy == 0 => { + (xmax - tick_size, *p - y0, xmax, *p - y0) + } + (dx, dy) if dx == 0 && dy > 0 => (*p - x0, 0, *p - x0, tick_size), + (dx, dy) if dx == 0 && dy < 0 => { + (*p - x0, ymax - tick_size, *p - x0, ymax) + } + _ => panic!("Bug: Invalid orientation specification"), + } + } else { + match orientation { + (dx, dy) if dx > 0 && dy == 0 => { + (xmax, *p - y0, xmax + tick_size, *p - y0) + } + (dx, dy) if dx < 0 && dy == 0 => (0, *p - y0, -tick_size, *p - y0), + (dx, dy) if dx == 0 && dy > 0 => { + (*p - x0, ymax, *p - x0, ymax + tick_size) + } + (dx, dy) if dx == 0 && dy < 0 => (*p - x0, 0, *p - x0, -tick_size), + _ => panic!("Bug: Invalid orientation specification"), + } + }; + let line = PathElement::new(vec![(kx0, ky0), (kx1, ky1)], *style); + area.draw(&line)?; + } + } + } + + if let Some((text, style)) = axis_desc { + let actual_style = if orientation.0 == 0 { + style.clone() + } else if orientation.0 == -1 { + style.transform(FontTransform::Rotate270) + } else { + style.transform(FontTransform::Rotate90) + }; + + let (x0, y0, h_pos, v_pos) = match orientation { + // Right + (dx, dy) if dx > 0 && dy == 0 => (tw, th / 2, HPos::Center, VPos::Top), + // Left + (dx, dy) if dx < 0 && dy == 0 => (0, th / 2, HPos::Center, VPos::Top), + // Bottom + (dx, dy) if dx == 0 && dy > 0 => (tw / 2, th, HPos::Center, VPos::Bottom), + // Top + (dx, dy) if dx == 0 && dy < 0 => (tw / 2, 0, HPos::Center, VPos::Top), + _ => panic!("Bug: Invalid orientation specification"), + }; + + let actual_style = &actual_style.pos(Pos::new(h_pos, v_pos)); + area.draw_text(text, actual_style, (x0 as i32, y0 as i32))?; + } + + Ok(()) + } + + #[allow(clippy::too_many_arguments)] + pub(crate) fn draw_mesh<FmtLabel, YH: KeyPointHint, XH: KeyPointHint>( + &mut self, + (r, c): (YH, XH), + mesh_line_style: &ShapeStyle, + x_label_style: &TextStyle, + y_label_style: &TextStyle, + fmt_label: FmtLabel, + x_mesh: bool, + y_mesh: bool, + x_label_offset: i32, + y_label_offset: i32, + x_axis: bool, + y_axis: bool, + axis_style: &ShapeStyle, + axis_desc_style: &TextStyle, + x_desc: Option<String>, + y_desc: Option<String>, + x_tick_size: [i32; 2], + y_tick_size: [i32; 2], + ) -> Result<(), DrawingAreaErrorKind<DB::ErrorType>> + where + FmtLabel: FnMut(&X, &Y, &MeshLine<X, Y>) -> Option<String>, + { + let (x_labels, y_labels) = + self.draw_mesh_lines((r, c), (x_mesh, y_mesh), mesh_line_style, fmt_label)?; + + for idx in 0..2 { + self.draw_axis_and_labels( + self.x_label_area[idx].as_ref(), + if x_axis { Some(axis_style) } else { None }, + &x_labels[..], + x_label_style, + x_label_offset, + (0, -1 + idx as i16 * 2), + x_desc.as_ref().map(|desc| (&desc[..], axis_desc_style)), + x_tick_size[idx], + )?; + + self.draw_axis_and_labels( + self.y_label_area[idx].as_ref(), + if y_axis { Some(axis_style) } else { None }, + &y_labels[..], + y_label_style, + y_label_offset, + (-1 + idx as i16 * 2, 0), + y_desc.as_ref().map(|desc| (&desc[..], axis_desc_style)), + y_tick_size[idx], + )?; + } + + Ok(()) + } +} diff --git a/vendor/plotters/src/chart/context/cartesian2d/mod.rs b/vendor/plotters/src/chart/context/cartesian2d/mod.rs new file mode 100644 index 000000000..fd1aef272 --- /dev/null +++ b/vendor/plotters/src/chart/context/cartesian2d/mod.rs @@ -0,0 +1,90 @@ +use std::ops::Range; + +use plotters_backend::{BackendCoord, DrawingBackend}; + +use crate::chart::{ChartContext, DualCoordChartContext, MeshStyle}; +use crate::coord::{ + cartesian::Cartesian2d, + ranged1d::{AsRangedCoord, Ranged, ValueFormatter}, + Shift, +}; +use crate::drawing::DrawingArea; + +mod draw_impl; + +impl<'a, DB, XT, YT, X, Y> ChartContext<'a, DB, Cartesian2d<X, Y>> +where + DB: DrawingBackend, + X: Ranged<ValueType = XT> + ValueFormatter<XT>, + Y: Ranged<ValueType = YT> + ValueFormatter<YT>, +{ + pub(crate) fn is_overlapping_drawing_area( + &self, + area: Option<&DrawingArea<DB, Shift>>, + ) -> bool { + if let Some(area) = area { + let (x0, y0) = area.get_base_pixel(); + let (w, h) = area.dim_in_pixel(); + let (x1, y1) = (x0 + w as i32, y0 + h as i32); + let (dx0, dy0) = self.drawing_area.get_base_pixel(); + let (w, h) = self.drawing_area.dim_in_pixel(); + let (dx1, dy1) = (dx0 + w as i32, dy0 + h as i32); + + let (ox0, ox1) = (x0.max(dx0), x1.min(dx1)); + let (oy0, oy1) = (y0.max(dy0), y1.min(dy1)); + + ox1 > ox0 && oy1 > oy0 + } else { + false + } + } + + /// Initialize a mesh configuration object and mesh drawing can be finalized by calling + /// the function `MeshStyle::draw`. + pub fn configure_mesh(&mut self) -> MeshStyle<'a, '_, X, Y, DB> { + MeshStyle::new(self) + } +} + +impl<'a, DB: DrawingBackend, X: Ranged, Y: Ranged> ChartContext<'a, DB, Cartesian2d<X, Y>> { + /// Get the range of X axis + pub fn x_range(&self) -> Range<X::ValueType> { + self.drawing_area.get_x_range() + } + + /// Get range of the Y axis + pub fn y_range(&self) -> Range<Y::ValueType> { + self.drawing_area.get_y_range() + } + + /// Maps the coordinate to the backend coordinate. This is typically used + /// with an interactive chart. + pub fn backend_coord(&self, coord: &(X::ValueType, Y::ValueType)) -> BackendCoord { + self.drawing_area.map_coordinate(coord) + } +} + +impl<'a, DB: DrawingBackend, X: Ranged, Y: Ranged> ChartContext<'a, DB, Cartesian2d<X, Y>> { + /// Convert this chart context into a dual axis chart context and attach a second coordinate spec + /// on the chart context. For more detailed information, see documentation for [struct DualCoordChartContext](struct.DualCoordChartContext.html) + /// + /// - `x_coord`: The coordinate spec for the X axis + /// - `y_coord`: The coordinate spec for the Y axis + /// - **returns** The newly created dual spec chart context + #[allow(clippy::type_complexity)] + pub fn set_secondary_coord<SX: AsRangedCoord, SY: AsRangedCoord>( + self, + x_coord: SX, + y_coord: SY, + ) -> DualCoordChartContext< + 'a, + DB, + Cartesian2d<X, Y>, + Cartesian2d<SX::CoordDescType, SY::CoordDescType>, + > { + let mut pixel_range = self.drawing_area.get_pixel_range(); + pixel_range.1 = pixel_range.1.end..pixel_range.1.start; + + DualCoordChartContext::new(self, Cartesian2d::new(x_coord, y_coord, pixel_range)) + } +} diff --git a/vendor/plotters/src/chart/context/cartesian3d/draw_impl.rs b/vendor/plotters/src/chart/context/cartesian3d/draw_impl.rs new file mode 100644 index 000000000..fcc4c4f7b --- /dev/null +++ b/vendor/plotters/src/chart/context/cartesian3d/draw_impl.rs @@ -0,0 +1,309 @@ +use std::cmp::Ordering; + +use plotters_backend::DrawingBackend; + +use crate::chart::ChartContext; +use crate::coord::{ + cartesian::Cartesian3d, + ranged1d::{KeyPointHint, Ranged}, + CoordTranslate, +}; +use crate::drawing::DrawingAreaErrorKind; +use crate::element::{EmptyElement, PathElement, Polygon, Text}; +use crate::style::{ + text_anchor::{HPos, Pos, VPos}, + ShapeStyle, TextStyle, +}; + +use super::Coord3D; + +pub(crate) struct KeyPoints3d<X: Ranged, Y: Ranged, Z: Ranged> { + pub(crate) x_points: Vec<X::ValueType>, + pub(crate) y_points: Vec<Y::ValueType>, + pub(crate) z_points: Vec<Z::ValueType>, +} + +impl<'a, DB, X: Ranged, Y: Ranged, Z: Ranged> ChartContext<'a, DB, Cartesian3d<X, Y, Z>> +where + DB: DrawingBackend, + X::ValueType: Clone, + Y::ValueType: Clone, + Z::ValueType: Clone, +{ + pub(crate) fn get_key_points<XH: KeyPointHint, YH: KeyPointHint, ZH: KeyPointHint>( + &self, + x_hint: XH, + y_hint: YH, + z_hint: ZH, + ) -> KeyPoints3d<X, Y, Z> { + let coord = self.plotting_area().as_coord_spec(); + let x_points = coord.logic_x.key_points(x_hint); + let y_points = coord.logic_y.key_points(y_hint); + let z_points = coord.logic_z.key_points(z_hint); + KeyPoints3d { + x_points, + y_points, + z_points, + } + } + #[allow(clippy::type_complexity)] + pub(crate) fn draw_axis_ticks( + &mut self, + axis: [[Coord3D<X::ValueType, Y::ValueType, Z::ValueType>; 3]; 2], + labels: &[( + [Coord3D<X::ValueType, Y::ValueType, Z::ValueType>; 3], + String, + )], + tick_size: i32, + style: ShapeStyle, + font: TextStyle, + ) -> Result<(), DrawingAreaErrorKind<DB::ErrorType>> { + let coord = self.plotting_area().as_coord_spec(); + let begin = coord.translate(&Coord3D::build_coord([ + &axis[0][0], + &axis[0][1], + &axis[0][2], + ])); + let end = coord.translate(&Coord3D::build_coord([ + &axis[1][0], + &axis[1][1], + &axis[1][2], + ])); + let axis_dir = (end.0 - begin.0, end.1 - begin.1); + let (x_range, y_range) = self.plotting_area().get_pixel_range(); + let x_mid = (x_range.start + x_range.end) / 2; + let y_mid = (y_range.start + y_range.end) / 2; + + let x_dir = if begin.0 < x_mid { + (-tick_size, 0) + } else { + (tick_size, 0) + }; + + let y_dir = if begin.1 < y_mid { + (0, -tick_size) + } else { + (0, tick_size) + }; + + let x_score = (x_dir.0 * axis_dir.0 + x_dir.1 * axis_dir.1).abs(); + let y_score = (y_dir.0 * axis_dir.0 + y_dir.1 * axis_dir.1).abs(); + + let dir = if x_score < y_score { x_dir } else { y_dir }; + + for (pos, text) in labels { + let logic_pos = Coord3D::build_coord([&pos[0], &pos[1], &pos[2]]); + let mut font = font.clone(); + + match dir.0.cmp(&0) { + Ordering::Less => font.pos = Pos::new(HPos::Right, VPos::Center), + Ordering::Greater => font.pos = Pos::new(HPos::Left, VPos::Center), + _ => (), + } + + match dir.1.cmp(&0) { + Ordering::Less => font.pos = Pos::new(HPos::Center, VPos::Bottom), + Ordering::Greater => font.pos = Pos::new(HPos::Center, VPos::Top), + _ => (), + } + + let element = EmptyElement::at(logic_pos) + + PathElement::new(vec![(0, 0), dir], style) + + Text::new(text.to_string(), (dir.0 * 2, dir.1 * 2), font); + self.plotting_area().draw(&element)?; + } + Ok(()) + } + #[allow(clippy::type_complexity)] + pub(crate) fn draw_axis( + &mut self, + idx: usize, + panels: &[[[Coord3D<X::ValueType, Y::ValueType, Z::ValueType>; 3]; 2]; 3], + style: ShapeStyle, + ) -> Result< + [[Coord3D<X::ValueType, Y::ValueType, Z::ValueType>; 3]; 2], + DrawingAreaErrorKind<DB::ErrorType>, + > { + let coord = self.plotting_area().as_coord_spec(); + let x_range = coord.logic_x.range(); + let y_range = coord.logic_y.range(); + let z_range = coord.logic_z.range(); + + let ranges: [[Coord3D<X::ValueType, Y::ValueType, Z::ValueType>; 2]; 3] = [ + [Coord3D::X(x_range.start), Coord3D::X(x_range.end)], + [Coord3D::Y(y_range.start), Coord3D::Y(y_range.end)], + [Coord3D::Z(z_range.start), Coord3D::Z(z_range.end)], + ]; + + let (start, end) = { + let mut start = [&ranges[0][0], &ranges[1][0], &ranges[2][0]]; + let mut end = [&ranges[0][1], &ranges[1][1], &ranges[2][1]]; + + let mut plan = vec![]; + + for i in 0..3 { + if i == idx { + continue; + } + start[i] = &panels[i][0][i]; + end[i] = &panels[i][0][i]; + for j in 0..3 { + if i != idx && i != j && j != idx { + for k in 0..2 { + start[j] = &panels[i][k][j]; + end[j] = &panels[i][k][j]; + plan.push((start, end)); + } + } + } + } + plan.into_iter() + .min_by_key(|&(s, e)| { + let d = coord.projected_depth(s[0].get_x(), s[1].get_y(), s[2].get_z()); + let d = d + coord.projected_depth(e[0].get_x(), e[1].get_y(), e[2].get_z()); + let (_, y1) = coord.translate(&Coord3D::build_coord(s)); + let (_, y2) = coord.translate(&Coord3D::build_coord(e)); + let y = y1 + y2; + (d, y) + }) + .unwrap() + }; + + self.plotting_area().draw(&PathElement::new( + vec![Coord3D::build_coord(start), Coord3D::build_coord(end)], + style, + ))?; + + Ok([ + [start[0].clone(), start[1].clone(), start[2].clone()], + [end[0].clone(), end[1].clone(), end[2].clone()], + ]) + } + + #[allow(clippy::type_complexity)] + pub(crate) fn draw_axis_panels( + &mut self, + bold_points: &KeyPoints3d<X, Y, Z>, + light_points: &KeyPoints3d<X, Y, Z>, + panel_style: ShapeStyle, + bold_grid_style: ShapeStyle, + light_grid_style: ShapeStyle, + ) -> Result< + [[[Coord3D<X::ValueType, Y::ValueType, Z::ValueType>; 3]; 2]; 3], + DrawingAreaErrorKind<DB::ErrorType>, + > { + let mut r_iter = (0..3).map(|idx| { + self.draw_axis_panel( + idx, + bold_points, + light_points, + panel_style, + bold_grid_style, + light_grid_style, + ) + }); + Ok([ + r_iter.next().unwrap()?, + r_iter.next().unwrap()?, + r_iter.next().unwrap()?, + ]) + } + #[allow(clippy::type_complexity)] + fn draw_axis_panel( + &mut self, + idx: usize, + bold_points: &KeyPoints3d<X, Y, Z>, + light_points: &KeyPoints3d<X, Y, Z>, + panel_style: ShapeStyle, + bold_grid_style: ShapeStyle, + light_grid_style: ShapeStyle, + ) -> Result< + [[Coord3D<X::ValueType, Y::ValueType, Z::ValueType>; 3]; 2], + DrawingAreaErrorKind<DB::ErrorType>, + > { + let coord = self.plotting_area().as_coord_spec(); + let x_range = coord.logic_x.range(); + let y_range = coord.logic_y.range(); + let z_range = coord.logic_z.range(); + + let ranges: [[Coord3D<X::ValueType, Y::ValueType, Z::ValueType>; 2]; 3] = [ + [Coord3D::X(x_range.start), Coord3D::X(x_range.end)], + [Coord3D::Y(y_range.start), Coord3D::Y(y_range.end)], + [Coord3D::Z(z_range.start), Coord3D::Z(z_range.end)], + ]; + + let (mut panel, start, end) = { + let vert_a = [&ranges[0][0], &ranges[1][0], &ranges[2][0]]; + let mut vert_b = [&ranges[0][1], &ranges[1][1], &ranges[2][1]]; + let mut vert_c = vert_a; + let vert_d = vert_b; + + vert_b[idx] = &ranges[idx][0]; + vert_c[idx] = &ranges[idx][1]; + + let (vert_a, vert_b) = + if coord.projected_depth(vert_a[0].get_x(), vert_a[1].get_y(), vert_a[2].get_z()) + >= coord.projected_depth( + vert_c[0].get_x(), + vert_c[1].get_y(), + vert_c[2].get_z(), + ) + { + (vert_a, vert_b) + } else { + (vert_c, vert_d) + }; + + let mut m = vert_a; + m[(idx + 1) % 3] = vert_b[(idx + 1) % 3]; + let mut n = vert_a; + n[(idx + 2) % 3] = vert_b[(idx + 2) % 3]; + + ( + vec![ + Coord3D::build_coord(vert_a), + Coord3D::build_coord(m), + Coord3D::build_coord(vert_b), + Coord3D::build_coord(n), + ], + vert_a, + vert_b, + ) + }; + self.plotting_area() + .draw(&Polygon::new(panel.clone(), panel_style))?; + panel.push(panel[0].clone()); + self.plotting_area() + .draw(&PathElement::new(panel, bold_grid_style))?; + + for (kps, style) in vec![ + (light_points, light_grid_style), + (bold_points, bold_grid_style), + ] + .into_iter() + { + for idx in (0..3).filter(|&i| i != idx) { + let kps: Vec<_> = match idx { + 0 => kps.x_points.iter().map(|x| Coord3D::X(x.clone())).collect(), + 1 => kps.y_points.iter().map(|y| Coord3D::Y(y.clone())).collect(), + _ => kps.z_points.iter().map(|z| Coord3D::Z(z.clone())).collect(), + }; + for kp in kps.iter() { + let mut kp_start = start; + let mut kp_end = end; + kp_start[idx] = kp; + kp_end[idx] = kp; + self.plotting_area().draw(&PathElement::new( + vec![Coord3D::build_coord(kp_start), Coord3D::build_coord(kp_end)], + style, + ))?; + } + } + } + + Ok([ + [start[0].clone(), start[1].clone(), start[2].clone()], + [end[0].clone(), end[1].clone(), end[2].clone()], + ]) + } +} diff --git a/vendor/plotters/src/chart/context/cartesian3d/mod.rs b/vendor/plotters/src/chart/context/cartesian3d/mod.rs new file mode 100644 index 000000000..ff28adf4f --- /dev/null +++ b/vendor/plotters/src/chart/context/cartesian3d/mod.rs @@ -0,0 +1,130 @@ +use crate::chart::{axes3d::Axes3dStyle, ChartContext}; +use crate::coord::{ + cartesian::Cartesian3d, + ranged1d::{Ranged, ValueFormatter}, + ranged3d::{ProjectionMatrix, ProjectionMatrixBuilder}, +}; +use plotters_backend::DrawingBackend; + +mod draw_impl; + +#[derive(Clone, Debug)] +pub(crate) enum Coord3D<X, Y, Z> { + X(X), + Y(Y), + Z(Z), +} + +impl<X, Y, Z> Coord3D<X, Y, Z> { + fn get_x(&self) -> &X { + match self { + Coord3D::X(ret) => ret, + _ => panic!("Invalid call!"), + } + } + fn get_y(&self) -> &Y { + match self { + Coord3D::Y(ret) => ret, + _ => panic!("Invalid call!"), + } + } + fn get_z(&self) -> &Z { + match self { + Coord3D::Z(ret) => ret, + _ => panic!("Invalid call!"), + } + } + + fn build_coord([x, y, z]: [&Self; 3]) -> (X, Y, Z) + where + X: Clone, + Y: Clone, + Z: Clone, + { + (x.get_x().clone(), y.get_y().clone(), z.get_z().clone()) + } +} + +impl<'a, DB, X, Y, Z, XT, YT, ZT> ChartContext<'a, DB, Cartesian3d<X, Y, Z>> +where + DB: DrawingBackend, + X: Ranged<ValueType = XT> + ValueFormatter<XT>, + Y: Ranged<ValueType = YT> + ValueFormatter<YT>, + Z: Ranged<ValueType = ZT> + ValueFormatter<ZT>, +{ + /** + Create an axis configuration object, to set line styles, labels, sizes, etc. + + Default values for axis configuration are set by function `Axes3dStyle::new()`. + + # Example + + ``` + use plotters::prelude::*; + let drawing_area = SVGBackend::new("configure_axes.svg", (300, 200)).into_drawing_area(); + drawing_area.fill(&WHITE).unwrap(); + let mut chart_builder = ChartBuilder::on(&drawing_area); + let mut chart_context = chart_builder.margin_bottom(30).build_cartesian_3d(0.0..4.0, 0.0..3.0, 0.0..2.7).unwrap(); + chart_context.configure_axes().tick_size(8).x_labels(4).y_labels(3).z_labels(2) + .max_light_lines(5).axis_panel_style(GREEN.mix(0.1)).bold_grid_style(BLUE.mix(0.3)) + .light_grid_style(BLUE.mix(0.2)).label_style(("Calibri", 10)) + .x_formatter(&|x| format!("x={x}")).draw().unwrap(); + ``` + + The resulting chart reflects the customizations specified through `configure_axes()`: + +  + + All these customizations are `Axes3dStyle` methods. + + In the chart, `tick_size(8)` produces tick marks 8 pixels long. You can use + `(5u32).percent().max(5).in_pixels(chart.plotting_area()` to tell Plotters to calculate the tick mark + size as a percentage of the dimensions of the figure. See [`crate::style::RelativeSize`] and + [`crate::style::SizeDesc`] for more information. + + `x_labels(4)` specifies a maximum of 4 + tick marks and labels in the X axis. `max_light_lines(5)` specifies a maximum of 5 minor grid lines + between any two tick marks. `axis_panel_style(GREEN.mix(0.1))` specifies the style of the panels in + the background, a light green color. `bold_grid_style(BLUE.mix(0.3))` and `light_grid_style(BLUE.mix(0.2))` + specify the style of the major and minor grid lines, respectively. `label_style()` specifies the text + style of the axis labels, and `x_formatter(|x| format!("x={x}"))` specifies the string format of the X + axis labels. + + # See also + + [`ChartContext::configure_mesh()`], a similar function for 2D plots + */ + pub fn configure_axes(&mut self) -> Axes3dStyle<'a, '_, X, Y, Z, DB> { + Axes3dStyle::new(self) + } +} + +impl<'a, DB, X: Ranged, Y: Ranged, Z: Ranged> ChartContext<'a, DB, Cartesian3d<X, Y, Z>> +where + DB: DrawingBackend, +{ + /// Override the 3D projection matrix. This function allows to override the default projection + /// matrix. + /// - `pf`: A function that takes the default projection matrix configuration and returns the + /// projection matrix. This function will allow you to adjust the pitch, yaw angle and the + /// centeral point of the projection, etc. You can also build a projection matrix which is not + /// relies on the default configuration as well. + pub fn with_projection<P: FnOnce(ProjectionMatrixBuilder) -> ProjectionMatrix>( + &mut self, + pf: P, + ) -> &mut Self { + let (actual_x, actual_y) = self.drawing_area.get_pixel_range(); + self.drawing_area + .as_coord_spec_mut() + .set_projection(actual_x, actual_y, pf); + self + } + /// Sets the 3d coordinate pixel range. + pub fn set_3d_pixel_range(&mut self, size: (i32, i32, i32)) -> &mut Self { + let (actual_x, actual_y) = self.drawing_area.get_pixel_range(); + self.drawing_area + .as_coord_spec_mut() + .set_coord_pixel_range(actual_x, actual_y, size); + self + } +} diff --git a/vendor/plotters/src/chart/dual_coord.rs b/vendor/plotters/src/chart/dual_coord.rs new file mode 100644 index 000000000..d5960e030 --- /dev/null +++ b/vendor/plotters/src/chart/dual_coord.rs @@ -0,0 +1,242 @@ +/// The dual coordinate system support +use std::borrow::{Borrow, BorrowMut}; +use std::ops::{Deref, DerefMut}; +use std::sync::Arc; + +use super::mesh::SecondaryMeshStyle; +use super::{ChartContext, ChartState, SeriesAnno}; + +use crate::coord::cartesian::Cartesian2d; +use crate::coord::ranged1d::{Ranged, ValueFormatter}; +use crate::coord::{CoordTranslate, ReverseCoordTranslate, Shift}; + +use crate::drawing::DrawingArea; +use crate::drawing::DrawingAreaErrorKind; +use crate::element::{Drawable, PointCollection}; + +use plotters_backend::{BackendCoord, DrawingBackend}; + +/// The chart context that has two coordinate system attached. +/// This situation is quite common, for example, we with two different coodinate system. +/// For instance this example <img src="https://plotters-rs.github.io/plotters-doc-data/twoscale.png"></img> +/// This is done by attaching a second coordinate system to ChartContext by method [ChartContext::set_secondary_coord](struct.ChartContext.html#method.set_secondary_coord). +/// For instance of dual coordinate charts, see [this example](https://github.com/38/plotters/blob/master/examples/two-scales.rs#L15). +/// Note: `DualCoordChartContext` is always deref to the chart context. +/// - If you want to configure the secondary axis, method [DualCoordChartContext::configure_secondary_axes](struct.DualCoordChartContext.html#method.configure_secondary_axes) +/// - If you want to draw a series using secondary coordinate system, use [DualCoordChartContext::draw_secondary_series](struct.DualCoordChartContext.html#method.draw_secondary_series). And method [ChartContext::draw_series](struct.ChartContext.html#method.draw_series) will always use primary coordinate spec. +pub struct DualCoordChartContext<'a, DB: DrawingBackend, CT1: CoordTranslate, CT2: CoordTranslate> { + pub(super) primary: ChartContext<'a, DB, CT1>, + pub(super) secondary: ChartContext<'a, DB, CT2>, +} + +/// The chart state for a dual coord chart, see the detailed description for `ChartState` for more +/// information about the purpose of a chart state. +/// Similar to [ChartState](struct.ChartState.html), but used for the dual coordinate charts. +#[derive(Clone)] +pub struct DualCoordChartState<CT1: CoordTranslate, CT2: CoordTranslate> { + primary: ChartState<CT1>, + secondary: ChartState<CT2>, +} + +impl<DB: DrawingBackend, CT1: CoordTranslate, CT2: CoordTranslate> + DualCoordChartContext<'_, DB, CT1, CT2> +{ + /// Convert the chart context into a chart state, similar to [ChartContext::into_chart_state](struct.ChartContext.html#method.into_chart_state) + pub fn into_chart_state(self) -> DualCoordChartState<CT1, CT2> { + DualCoordChartState { + primary: self.primary.into(), + secondary: self.secondary.into(), + } + } + + /// Convert the chart context into a sharable chart state. + pub fn into_shared_chart_state(self) -> DualCoordChartState<Arc<CT1>, Arc<CT2>> { + DualCoordChartState { + primary: self.primary.into_shared_chart_state(), + secondary: self.secondary.into_shared_chart_state(), + } + } + + /// Copy the coordinate specs and make a chart state + pub fn to_chart_state(&self) -> DualCoordChartState<CT1, CT2> + where + CT1: Clone, + CT2: Clone, + { + DualCoordChartState { + primary: self.primary.to_chart_state(), + secondary: self.secondary.to_chart_state(), + } + } +} + +impl<CT1: CoordTranslate, CT2: CoordTranslate> DualCoordChartState<CT1, CT2> { + /// Restore the chart state on the given drawing area + pub fn restore<DB: DrawingBackend>( + self, + area: &DrawingArea<DB, Shift>, + ) -> DualCoordChartContext<'_, DB, CT1, CT2> { + let primary = self.primary.restore(area); + let secondary = self + .secondary + .restore(&primary.plotting_area().strip_coord_spec()); + DualCoordChartContext { primary, secondary } + } +} + +impl<DB: DrawingBackend, CT1: CoordTranslate, CT2: CoordTranslate> + From<DualCoordChartContext<'_, DB, CT1, CT2>> for DualCoordChartState<CT1, CT2> +{ + fn from(chart: DualCoordChartContext<'_, DB, CT1, CT2>) -> DualCoordChartState<CT1, CT2> { + chart.into_chart_state() + } +} + +impl<'b, DB: DrawingBackend, CT1: CoordTranslate + Clone, CT2: CoordTranslate + Clone> + From<&'b DualCoordChartContext<'_, DB, CT1, CT2>> for DualCoordChartState<CT1, CT2> +{ + fn from(chart: &'b DualCoordChartContext<'_, DB, CT1, CT2>) -> DualCoordChartState<CT1, CT2> { + chart.to_chart_state() + } +} + +impl<'a, DB: DrawingBackend, CT1: CoordTranslate, CT2: CoordTranslate> + DualCoordChartContext<'a, DB, CT1, CT2> +{ + pub(super) fn new(mut primary: ChartContext<'a, DB, CT1>, secondary_coord: CT2) -> Self { + let secondary_drawing_area = primary + .drawing_area + .strip_coord_spec() + .apply_coord_spec(secondary_coord); + let mut secondary_x_label_area = [None, None]; + let mut secondary_y_label_area = [None, None]; + + std::mem::swap(&mut primary.x_label_area[0], &mut secondary_x_label_area[0]); + std::mem::swap(&mut primary.y_label_area[1], &mut secondary_y_label_area[1]); + + Self { + primary, + secondary: ChartContext { + x_label_area: secondary_x_label_area, + y_label_area: secondary_y_label_area, + drawing_area: secondary_drawing_area, + series_anno: vec![], + drawing_area_pos: (0, 0), + }, + } + } + + /// Get a reference to the drawing area that uses the secondary coordinate system + pub fn secondary_plotting_area(&self) -> &DrawingArea<DB, CT2> { + &self.secondary.drawing_area + } + + /// Borrow a mutable reference to the chart context that uses the secondary + /// coordinate system + pub fn borrow_secondary(&self) -> &ChartContext<'a, DB, CT2> { + &self.secondary + } +} + +impl<DB: DrawingBackend, CT1: CoordTranslate, CT2: ReverseCoordTranslate> + DualCoordChartContext<'_, DB, CT1, CT2> +{ + /// Convert the chart context into the secondary coordinate translation function + pub fn into_secondary_coord_trans(self) -> impl Fn(BackendCoord) -> Option<CT2::From> { + let coord_spec = self.secondary.drawing_area.into_coord_spec(); + move |coord| coord_spec.reverse_translate(coord) + } +} + +impl<DB: DrawingBackend, CT1: ReverseCoordTranslate, CT2: ReverseCoordTranslate> + DualCoordChartContext<'_, DB, CT1, CT2> +{ + /// Convert the chart context into a pair of closures that maps the pixel coordinate into the + /// logical coordinate for both primary coordinate system and secondary coordinate system. + pub fn into_coord_trans_pair( + self, + ) -> ( + impl Fn(BackendCoord) -> Option<CT1::From>, + impl Fn(BackendCoord) -> Option<CT2::From>, + ) { + let coord_spec_1 = self.primary.drawing_area.into_coord_spec(); + let coord_spec_2 = self.secondary.drawing_area.into_coord_spec(); + ( + move |coord| coord_spec_1.reverse_translate(coord), + move |coord| coord_spec_2.reverse_translate(coord), + ) + } +} + +impl< + 'a, + DB: DrawingBackend, + CT1: CoordTranslate, + XT, + YT, + SX: Ranged<ValueType = XT>, + SY: Ranged<ValueType = YT>, + > DualCoordChartContext<'a, DB, CT1, Cartesian2d<SX, SY>> +where + SX: ValueFormatter<XT>, + SY: ValueFormatter<YT>, +{ + /// Start configure the style for the secondary axes + pub fn configure_secondary_axes<'b>(&'b mut self) -> SecondaryMeshStyle<'a, 'b, SX, SY, DB> { + SecondaryMeshStyle::new(&mut self.secondary) + } +} + +impl<'a, DB: DrawingBackend, X: Ranged, Y: Ranged, SX: Ranged, SY: Ranged> + DualCoordChartContext<'a, DB, Cartesian2d<X, Y>, Cartesian2d<SX, SY>> +{ + /// Draw a series use the secondary coordinate system. + /// - `series`: The series to draw + /// - `Returns` the series annotation object or error code + pub fn draw_secondary_series<E, R, S>( + &mut self, + series: S, + ) -> Result<&mut SeriesAnno<'a, DB>, DrawingAreaErrorKind<DB::ErrorType>> + where + for<'b> &'b E: PointCollection<'b, (SX::ValueType, SY::ValueType)>, + E: Drawable<DB>, + R: Borrow<E>, + S: IntoIterator<Item = R>, + { + self.secondary.draw_series_impl(series)?; + Ok(self.primary.alloc_series_anno()) + } +} + +impl<'a, DB: DrawingBackend, CT1: CoordTranslate, CT2: CoordTranslate> + Borrow<ChartContext<'a, DB, CT1>> for DualCoordChartContext<'a, DB, CT1, CT2> +{ + fn borrow(&self) -> &ChartContext<'a, DB, CT1> { + &self.primary + } +} + +impl<'a, DB: DrawingBackend, CT1: CoordTranslate, CT2: CoordTranslate> + BorrowMut<ChartContext<'a, DB, CT1>> for DualCoordChartContext<'a, DB, CT1, CT2> +{ + fn borrow_mut(&mut self) -> &mut ChartContext<'a, DB, CT1> { + &mut self.primary + } +} + +impl<'a, DB: DrawingBackend, CT1: CoordTranslate, CT2: CoordTranslate> Deref + for DualCoordChartContext<'a, DB, CT1, CT2> +{ + type Target = ChartContext<'a, DB, CT1>; + fn deref(&self) -> &Self::Target { + self.borrow() + } +} + +impl<'a, DB: DrawingBackend, CT1: CoordTranslate, CT2: CoordTranslate> DerefMut + for DualCoordChartContext<'a, DB, CT1, CT2> +{ + fn deref_mut(&mut self) -> &mut Self::Target { + self.borrow_mut() + } +} diff --git a/vendor/plotters/src/chart/mesh.rs b/vendor/plotters/src/chart/mesh.rs new file mode 100644 index 000000000..c2b7a9577 --- /dev/null +++ b/vendor/plotters/src/chart/mesh.rs @@ -0,0 +1,533 @@ +use std::marker::PhantomData; + +use super::builder::LabelAreaPosition; +use super::context::ChartContext; +use crate::coord::cartesian::{Cartesian2d, MeshLine}; +use crate::coord::ranged1d::{BoldPoints, LightPoints, Ranged, ValueFormatter}; +use crate::drawing::DrawingAreaErrorKind; +use crate::style::{ + AsRelative, Color, FontDesc, FontFamily, FontStyle, IntoTextStyle, RGBColor, ShapeStyle, + SizeDesc, TextStyle, +}; + +use plotters_backend::DrawingBackend; + +/// The style used to describe the mesh and axis for a secondary coordinate system. +pub struct SecondaryMeshStyle<'a, 'b, X: Ranged, Y: Ranged, DB: DrawingBackend> { + style: MeshStyle<'a, 'b, X, Y, DB>, +} + +impl<'a, 'b, XT, YT, X: Ranged<ValueType = XT>, Y: Ranged<ValueType = YT>, DB: DrawingBackend> + SecondaryMeshStyle<'a, 'b, X, Y, DB> +where + X: ValueFormatter<XT>, + Y: ValueFormatter<YT>, +{ + pub(super) fn new(target: &'b mut ChartContext<'a, DB, Cartesian2d<X, Y>>) -> Self { + let mut style = target.configure_mesh(); + style.draw_x_mesh = false; + style.draw_y_mesh = false; + Self { style } + } + + /// Set the style definition for the axis + /// - `style`: The style for the axis + pub fn axis_style<T: Into<ShapeStyle>>(&mut self, style: T) -> &mut Self { + self.style.axis_style(style); + self + } + + /// The offset of x labels. This is used when we want to place the label in the middle of + /// the grid. This is used to adjust label position for histograms, but since plotters 0.3, this + /// use case is deprecated, see [SegmentedCoord coord decorator](../coord/ranged1d/trait.IntoSegmentedCoord.html) for more details + /// - `value`: The offset in pixel + pub fn x_label_offset<S: SizeDesc>(&mut self, value: S) -> &mut Self { + self.style.x_label_offset(value); + self + } + + /// The offset of y labels. This is used when we want to place the label in the middle of + /// the grid. This is used to adjust label position for histograms, but since plotters 0.3, this + /// use case is deprecated, see [SegmentedCoord coord decorator](../coord/ranged1d/trait.IntoSegmentedCoord.html) for more details + /// - `value`: The offset in pixel + pub fn y_label_offset<S: SizeDesc>(&mut self, value: S) -> &mut Self { + self.style.y_label_offset(value); + self + } + + /// Set how many labels for the X axis at most + /// - `value`: The maximum desired number of labels in the X axis + pub fn x_labels(&mut self, value: usize) -> &mut Self { + self.style.x_labels(value); + self + } + + /// Set how many label for the Y axis at most + /// - `value`: The maximum desired number of labels in the Y axis + pub fn y_labels(&mut self, value: usize) -> &mut Self { + self.style.y_labels(value); + self + } + + /// Set the formatter function for the X label text + /// - `fmt`: The formatter function + pub fn x_label_formatter(&mut self, fmt: &'b dyn Fn(&X::ValueType) -> String) -> &mut Self { + self.style.x_label_formatter(fmt); + self + } + + /// Set the formatter function for the Y label text + /// - `fmt`: The formatter function + pub fn y_label_formatter(&mut self, fmt: &'b dyn Fn(&Y::ValueType) -> String) -> &mut Self { + self.style.y_label_formatter(fmt); + self + } + + /// Set the axis description's style. If not given, use label style instead. + /// - `style`: The text style that would be applied to descriptions + pub fn axis_desc_style<T: IntoTextStyle<'b>>(&mut self, style: T) -> &mut Self { + self.style + .axis_desc_style(style.into_text_style(&self.style.parent_size)); + self + } + + /// Set the X axis's description + /// - `desc`: The description of the X axis + pub fn x_desc<T: Into<String>>(&mut self, desc: T) -> &mut Self { + self.style.x_desc(desc); + self + } + + /// Set the Y axis's description + /// - `desc`: The description of the Y axis + pub fn y_desc<T: Into<String>>(&mut self, desc: T) -> &mut Self { + self.style.y_desc(desc); + self + } + + /// Draw the axes for the secondary coordinate system + pub fn draw(&mut self) -> Result<(), DrawingAreaErrorKind<DB::ErrorType>> { + self.style.draw() + } + + /// Set the label style for the secondary axis + pub fn label_style<T: IntoTextStyle<'b>>(&mut self, style: T) -> &mut Self { + self.style.label_style(style); + self + } + + /// Set all the tick marks to the same size + /// `value`: The new size + pub fn set_all_tick_mark_size<S: SizeDesc>(&mut self, value: S) -> &mut Self { + let size = value.in_pixels(&self.style.parent_size); + self.style.x_tick_size = [size, size]; + self.style.y_tick_size = [size, size]; + self + } + /// Sets the tick mark size for a given label area position. + /// `value`: The new size + pub fn set_tick_mark_size<S: SizeDesc>( + &mut self, + pos: LabelAreaPosition, + value: S, + ) -> &mut Self { + *match pos { + LabelAreaPosition::Top => &mut self.style.x_tick_size[0], + LabelAreaPosition::Bottom => &mut self.style.x_tick_size[1], + LabelAreaPosition::Left => &mut self.style.y_tick_size[0], + LabelAreaPosition::Right => &mut self.style.y_tick_size[1], + } = value.in_pixels(&self.style.parent_size); + self + } +} + +/// The struct that is used for tracking the configuration of a mesh of any chart +pub struct MeshStyle<'a, 'b, X: Ranged, Y: Ranged, DB: DrawingBackend> { + pub(super) parent_size: (u32, u32), + pub(super) draw_x_mesh: bool, + pub(super) draw_y_mesh: bool, + pub(super) draw_x_axis: bool, + pub(super) draw_y_axis: bool, + pub(super) x_label_offset: i32, + pub(super) y_label_offset: i32, + pub(super) x_light_lines_limit: usize, + pub(super) y_light_lines_limit: usize, + pub(super) n_x_labels: usize, + pub(super) n_y_labels: usize, + pub(super) axis_desc_style: Option<TextStyle<'b>>, + pub(super) x_desc: Option<String>, + pub(super) y_desc: Option<String>, + pub(super) bold_line_style: Option<ShapeStyle>, + pub(super) light_line_style: Option<ShapeStyle>, + pub(super) axis_style: Option<ShapeStyle>, + pub(super) x_label_style: Option<TextStyle<'b>>, + pub(super) y_label_style: Option<TextStyle<'b>>, + pub(super) format_x: Option<&'b dyn Fn(&X::ValueType) -> String>, + pub(super) format_y: Option<&'b dyn Fn(&Y::ValueType) -> String>, + pub(super) target: Option<&'b mut ChartContext<'a, DB, Cartesian2d<X, Y>>>, + pub(super) _phantom_data: PhantomData<(X, Y)>, + pub(super) x_tick_size: [i32; 2], + pub(super) y_tick_size: [i32; 2], +} + +impl<'a, 'b, X, Y, XT, YT, DB> MeshStyle<'a, 'b, X, Y, DB> +where + X: Ranged<ValueType = XT> + ValueFormatter<XT>, + Y: Ranged<ValueType = YT> + ValueFormatter<YT>, + DB: DrawingBackend, +{ + pub(crate) fn new(chart: &'b mut ChartContext<'a, DB, Cartesian2d<X, Y>>) -> Self { + let base_tick_size = (5u32).percent().max(5).in_pixels(chart.plotting_area()); + + let mut x_tick_size = [base_tick_size, base_tick_size]; + let mut y_tick_size = [base_tick_size, base_tick_size]; + + for idx in 0..2 { + if chart.is_overlapping_drawing_area(chart.x_label_area[idx].as_ref()) { + x_tick_size[idx] = -x_tick_size[idx]; + } + if chart.is_overlapping_drawing_area(chart.y_label_area[idx].as_ref()) { + y_tick_size[idx] = -y_tick_size[idx]; + } + } + + MeshStyle { + parent_size: chart.drawing_area.dim_in_pixel(), + axis_style: None, + x_label_offset: 0, + y_label_offset: 0, + draw_x_mesh: true, + draw_y_mesh: true, + draw_x_axis: true, + draw_y_axis: true, + x_light_lines_limit: 10, + y_light_lines_limit: 10, + n_x_labels: 11, + n_y_labels: 11, + bold_line_style: None, + light_line_style: None, + x_label_style: None, + y_label_style: None, + format_x: None, + format_y: None, + target: Some(chart), + _phantom_data: PhantomData, + x_desc: None, + y_desc: None, + axis_desc_style: None, + x_tick_size, + y_tick_size, + } + } +} + +impl<'a, 'b, X, Y, DB> MeshStyle<'a, 'b, X, Y, DB> +where + X: Ranged, + Y: Ranged, + DB: DrawingBackend, +{ + /// Set all the tick mark to the same size + /// `value`: The new size + pub fn set_all_tick_mark_size<S: SizeDesc>(&mut self, value: S) -> &mut Self { + let size = value.in_pixels(&self.parent_size); + self.x_tick_size = [size, size]; + self.y_tick_size = [size, size]; + self + } + + /// Set the tick mark size on the axes. When this is set to negative, the axis value label will + /// become inward. + /// + /// - `pos`: The which label area we want to set + /// - `value`: The size specification + pub fn set_tick_mark_size<S: SizeDesc>( + &mut self, + pos: LabelAreaPosition, + value: S, + ) -> &mut Self { + *match pos { + LabelAreaPosition::Top => &mut self.x_tick_size[0], + LabelAreaPosition::Bottom => &mut self.x_tick_size[1], + LabelAreaPosition::Left => &mut self.y_tick_size[0], + LabelAreaPosition::Right => &mut self.y_tick_size[1], + } = value.in_pixels(&self.parent_size); + self + } + + /// The offset of x labels. This is used when we want to place the label in the middle of + /// the grid. This is used to adjust label position for histograms, but since plotters 0.3, this + /// use case is deprecated, see [SegmentedCoord coord decorator](../coord/ranged1d/trait.IntoSegmentedCoord.html) for more details + /// - `value`: The offset in pixel + pub fn x_label_offset<S: SizeDesc>(&mut self, value: S) -> &mut Self { + self.x_label_offset = value.in_pixels(&self.parent_size); + self + } + + /// The offset of y labels. This is used when we want to place the label in the middle of + /// the grid. This is used to adjust label position for histograms, but since plotters 0.3, this + /// use case is deprecated, see [SegmentedCoord coord decorator](../coord/ranged1d/trait.IntoSegmentedCoord.html) for more details + /// - `value`: The offset in pixel + pub fn y_label_offset<S: SizeDesc>(&mut self, value: S) -> &mut Self { + self.y_label_offset = value.in_pixels(&self.parent_size); + self + } + + /// Disable the mesh for the x axis. + pub fn disable_x_mesh(&mut self) -> &mut Self { + self.draw_x_mesh = false; + self + } + + /// Disable the mesh for the y axis + pub fn disable_y_mesh(&mut self) -> &mut Self { + self.draw_y_mesh = false; + self + } + + /// Disable drawing the X axis + pub fn disable_x_axis(&mut self) -> &mut Self { + self.draw_x_axis = false; + self + } + + /// Disable drawing the Y axis + pub fn disable_y_axis(&mut self) -> &mut Self { + self.draw_y_axis = false; + self + } + + /// Disable drawing all meshes + pub fn disable_mesh(&mut self) -> &mut Self { + self.disable_x_mesh().disable_y_mesh() + } + + /// Disable drawing all axes + pub fn disable_axes(&mut self) -> &mut Self { + self.disable_x_axis().disable_y_axis() + } + + /// Set the style definition for the axis + /// - `style`: The style for the axis + pub fn axis_style<T: Into<ShapeStyle>>(&mut self, style: T) -> &mut Self { + self.axis_style = Some(style.into()); + self + } + + /// Set the maximum number of divisions for the minor grid + /// - `value`: Maximum desired divisions between two consecutive X labels + pub fn x_max_light_lines(&mut self, value: usize) -> &mut Self { + self.x_light_lines_limit = value; + self + } + + /// Set the maximum number of divisions for the minor grid + /// - `value`: Maximum desired divisions between two consecutive Y labels + pub fn y_max_light_lines(&mut self, value: usize) -> &mut Self { + self.y_light_lines_limit = value; + self + } + + /// Set the maximum number of divisions for the minor grid + /// - `value`: Maximum desired divisions between two consecutive labels in X and Y + pub fn max_light_lines(&mut self, value: usize) -> &mut Self { + self.x_light_lines_limit = value; + self.y_light_lines_limit = value; + self + } + + /// Set how many labels for the X axis at most + /// - `value`: The maximum desired number of labels in the X axis + pub fn x_labels(&mut self, value: usize) -> &mut Self { + self.n_x_labels = value; + self + } + + /// Set how many label for the Y axis at most + /// - `value`: The maximum desired number of labels in the Y axis + pub fn y_labels(&mut self, value: usize) -> &mut Self { + self.n_y_labels = value; + self + } + + /// Set the style for the coarse grind grid + /// - `style`: This is the coarse grind grid style + pub fn bold_line_style<T: Into<ShapeStyle>>(&mut self, style: T) -> &mut Self { + self.bold_line_style = Some(style.into()); + self + } + + /// Set the style for the fine grind grid + /// - `style`: The fine grind grid style + pub fn light_line_style<T: Into<ShapeStyle>>(&mut self, style: T) -> &mut Self { + self.light_line_style = Some(style.into()); + self + } + + /// Set the style of the label text + /// - `style`: The text style that would be applied to the labels + pub fn label_style<T: IntoTextStyle<'b>>(&mut self, style: T) -> &mut Self { + let style = style.into_text_style(&self.parent_size); + self.x_label_style = Some(style.clone()); + self.y_label_style = Some(style); + self + } + + /// Set the style of the label X axis text + /// - `style`: The text style that would be applied to the labels + pub fn x_label_style<T: IntoTextStyle<'b>>(&mut self, style: T) -> &mut Self { + self.x_label_style = Some(style.into_text_style(&self.parent_size)); + self + } + + /// Set the style of the label Y axis text + /// - `style`: The text style that would be applied to the labels + pub fn y_label_style<T: IntoTextStyle<'b>>(&mut self, style: T) -> &mut Self { + self.y_label_style = Some(style.into_text_style(&self.parent_size)); + self + } + + /// Set the formatter function for the X label text + /// - `fmt`: The formatter function + pub fn x_label_formatter(&mut self, fmt: &'b dyn Fn(&X::ValueType) -> String) -> &mut Self { + self.format_x = Some(fmt); + self + } + + /// Set the formatter function for the Y label text + /// - `fmt`: The formatter function + pub fn y_label_formatter(&mut self, fmt: &'b dyn Fn(&Y::ValueType) -> String) -> &mut Self { + self.format_y = Some(fmt); + self + } + + /// Set the axis description's style. If not given, use label style instead. + /// - `style`: The text style that would be applied to descriptions + pub fn axis_desc_style<T: IntoTextStyle<'b>>(&mut self, style: T) -> &mut Self { + self.axis_desc_style = Some(style.into_text_style(&self.parent_size)); + self + } + + /// Set the X axis's description + /// - `desc`: The description of the X axis + pub fn x_desc<T: Into<String>>(&mut self, desc: T) -> &mut Self { + self.x_desc = Some(desc.into()); + self + } + + /// Set the Y axis's description + /// - `desc`: The description of the Y axis + pub fn y_desc<T: Into<String>>(&mut self, desc: T) -> &mut Self { + self.y_desc = Some(desc.into()); + self + } + + /// Draw the configured mesh on the target plot + pub fn draw(&mut self) -> Result<(), DrawingAreaErrorKind<DB::ErrorType>> + where + X: ValueFormatter<<X as Ranged>::ValueType>, + Y: ValueFormatter<<Y as Ranged>::ValueType>, + { + let target = self.target.take().unwrap(); + + let default_mesh_color_1 = RGBColor(0, 0, 0).mix(0.2); + let default_mesh_color_2 = RGBColor(0, 0, 0).mix(0.1); + let default_axis_color = RGBColor(0, 0, 0); + let default_label_font = FontDesc::new( + FontFamily::SansSerif, + f64::from((12i32).percent().max(12).in_pixels(&self.parent_size)), + FontStyle::Normal, + ); + + let bold_style = self + .bold_line_style + .unwrap_or_else(|| (&default_mesh_color_1).into()); + let light_style = self + .light_line_style + .unwrap_or_else(|| (&default_mesh_color_2).into()); + let axis_style = self + .axis_style + .unwrap_or_else(|| (&default_axis_color).into()); + + let x_label_style = self + .x_label_style + .clone() + .unwrap_or_else(|| default_label_font.clone().into()); + + let y_label_style = self + .y_label_style + .clone() + .unwrap_or_else(|| default_label_font.into()); + + let axis_desc_style = self + .axis_desc_style + .clone() + .unwrap_or_else(|| x_label_style.clone()); + + target.draw_mesh( + ( + LightPoints::new(self.n_y_labels, self.n_y_labels * self.y_light_lines_limit), + LightPoints::new(self.n_x_labels, self.n_x_labels * self.x_light_lines_limit), + ), + &light_style, + &x_label_style, + &y_label_style, + |_, _, _| None, + self.draw_x_mesh, + self.draw_y_mesh, + self.x_label_offset, + self.y_label_offset, + false, + false, + &axis_style, + &axis_desc_style, + self.x_desc.clone(), + self.y_desc.clone(), + self.x_tick_size, + self.y_tick_size, + )?; + + target.draw_mesh( + (BoldPoints(self.n_y_labels), BoldPoints(self.n_x_labels)), + &bold_style, + &x_label_style, + &y_label_style, + |xr, yr, m| match m { + MeshLine::XMesh(_, _, v) => { + if self.draw_x_axis { + if let Some(fmt_func) = self.format_x { + Some(fmt_func(v)) + } else { + Some(xr.format_ext(v)) + } + } else { + None + } + } + MeshLine::YMesh(_, _, v) => { + if self.draw_y_axis { + if let Some(fmt_func) = self.format_y { + Some(fmt_func(v)) + } else { + Some(yr.format_ext(v)) + } + } else { + None + } + } + }, + self.draw_x_mesh, + self.draw_y_mesh, + self.x_label_offset, + self.y_label_offset, + self.draw_x_axis, + self.draw_y_axis, + &axis_style, + &axis_desc_style, + None, + None, + self.x_tick_size, + self.y_tick_size, + ) + } +} diff --git a/vendor/plotters/src/chart/mod.rs b/vendor/plotters/src/chart/mod.rs new file mode 100644 index 000000000..4a8802963 --- /dev/null +++ b/vendor/plotters/src/chart/mod.rs @@ -0,0 +1,30 @@ +/*! +The high-level plotting abstractions. + +Plotters uses `ChartContext`, a thin layer on the top of `DrawingArea`, to provide +high-level chart specific drawing functionalities, like, mesh line, coordinate label +and other common components for the data chart. + +To draw a series, `ChartContext::draw_series` is used to draw a series on the chart. +In Plotters, a series is abstracted as an iterator of elements. + +`ChartBuilder` is used to construct a chart. To learn more detailed information, check the +detailed description for each struct. +*/ + +mod axes3d; +mod builder; +mod context; +mod dual_coord; +mod mesh; +mod series; +mod state; + +pub use builder::{ChartBuilder, LabelAreaPosition}; +pub use context::ChartContext; +pub use dual_coord::{DualCoordChartContext, DualCoordChartState}; +pub use mesh::{MeshStyle, SecondaryMeshStyle}; +pub use series::{SeriesAnno, SeriesLabelPosition, SeriesLabelStyle}; +pub use state::ChartState; + +use context::Coord3D; diff --git a/vendor/plotters/src/chart/series.rs b/vendor/plotters/src/chart/series.rs new file mode 100644 index 000000000..8c430cbef --- /dev/null +++ b/vendor/plotters/src/chart/series.rs @@ -0,0 +1,301 @@ +use super::ChartContext; +use crate::coord::CoordTranslate; +use crate::drawing::DrawingAreaErrorKind; +use crate::element::{DynElement, EmptyElement, IntoDynElement, MultiLineText, Rectangle}; +use crate::style::{IntoFont, IntoTextStyle, ShapeStyle, SizeDesc, TextStyle, TRANSPARENT}; + +use plotters_backend::{BackendCoord, DrawingBackend, DrawingErrorKind}; + +type SeriesAnnoDrawFn<'a, DB> = dyn Fn(BackendCoord) -> DynElement<'a, DB, BackendCoord> + 'a; + +/// The annotations (such as the label of the series, the legend element, etc) +/// When a series is drawn onto a drawing area, an series annotation object +/// is created and a mutable reference is returned. +pub struct SeriesAnno<'a, DB: DrawingBackend> { + label: Option<String>, + draw_func: Option<Box<SeriesAnnoDrawFn<'a, DB>>>, +} + +impl<'a, DB: DrawingBackend> SeriesAnno<'a, DB> { + #[allow(clippy::option_as_ref_deref)] + pub(crate) fn get_label(&self) -> &str { + // TODO: Change this when we bump the MSRV + self.label.as_ref().map(|x| x.as_str()).unwrap_or("") + } + + pub(crate) fn get_draw_func(&self) -> Option<&SeriesAnnoDrawFn<'a, DB>> { + self.draw_func.as_ref().map(|x| x.as_ref()) + } + + pub(crate) fn new() -> Self { + Self { + label: None, + draw_func: None, + } + } + + /** + Sets the series label for the current series. + + See [`ChartContext::configure_series_labels()`] for more information and examples. + */ + pub fn label<L: Into<String>>(&mut self, label: L) -> &mut Self { + self.label = Some(label.into()); + self + } + + /** + Sets the legend element creator function. + + - `func`: The function use to create the element + + # Note + + The creation function uses a shifted pixel-based coordinate system, where the + point (0,0) is defined to the mid-right point of the shape. + + # See also + + See [`ChartContext::configure_series_labels()`] for more information and examples. + */ + pub fn legend<E: IntoDynElement<'a, DB, BackendCoord>, T: Fn(BackendCoord) -> E + 'a>( + &mut self, + func: T, + ) -> &mut Self { + self.draw_func = Some(Box::new(move |p| func(p).into_dyn())); + self + } +} + +/** +Useful to specify the position of the series label. + +See [`ChartContext::configure_series_labels()`] for more information and examples. +*/ +pub enum SeriesLabelPosition { + /// Places the series label at the upper left + UpperLeft, + /// Places the series label at the middle left + MiddleLeft, + /// Places the series label at the lower left + LowerLeft, + /// Places the series label at the upper middle + UpperMiddle, + /// Places the series label at the middle middle + MiddleMiddle, + /// Places the series label at the lower middle + LowerMiddle, + /// Places the series label at the upper right + UpperRight, + /// Places the series label at the middle right + MiddleRight, + /// Places the series label at the lower right + LowerRight, + /// Places the series label at the specific location in backend coordinates + Coordinate(i32, i32), +} + +impl SeriesLabelPosition { + fn layout_label_area(&self, label_dim: (i32, i32), area_dim: (u32, u32)) -> (i32, i32) { + use SeriesLabelPosition::*; + ( + match self { + UpperLeft | MiddleLeft | LowerLeft => 5, + UpperMiddle | MiddleMiddle | LowerMiddle => { + (area_dim.0 as i32 - label_dim.0 as i32) / 2 + } + UpperRight | MiddleRight | LowerRight => area_dim.0 as i32 - label_dim.0 as i32 - 5, + Coordinate(x, _) => *x, + }, + match self { + UpperLeft | UpperMiddle | UpperRight => 5, + MiddleLeft | MiddleMiddle | MiddleRight => { + (area_dim.1 as i32 - label_dim.1 as i32) / 2 + } + LowerLeft | LowerMiddle | LowerRight => area_dim.1 as i32 - label_dim.1 as i32 - 5, + Coordinate(_, y) => *y, + }, + ) + } +} + +/// The struct to specify the series label of a target chart context +pub struct SeriesLabelStyle<'a, 'b, DB: DrawingBackend, CT: CoordTranslate> { + target: &'b mut ChartContext<'a, DB, CT>, + position: SeriesLabelPosition, + legend_area_size: u32, + border_style: ShapeStyle, + background: ShapeStyle, + label_font: Option<TextStyle<'b>>, + margin: u32, +} + +impl<'a, 'b, DB: DrawingBackend + 'a, CT: CoordTranslate> SeriesLabelStyle<'a, 'b, DB, CT> { + pub(super) fn new(target: &'b mut ChartContext<'a, DB, CT>) -> Self { + Self { + target, + position: SeriesLabelPosition::MiddleRight, + legend_area_size: 30, + border_style: (&TRANSPARENT).into(), + background: (&TRANSPARENT).into(), + label_font: None, + margin: 10, + } + } + + /** + Sets the series label positioning style + + `pos` - The positioning style + + See [`ChartContext::configure_series_labels()`] for more information and examples. + */ + pub fn position(&mut self, pos: SeriesLabelPosition) -> &mut Self { + self.position = pos; + self + } + + /** + Sets the margin of the series label drawing area. + + - `value`: The size specification in backend units (pixels) + + See [`ChartContext::configure_series_labels()`] for more information and examples. + */ + pub fn margin<S: SizeDesc>(&mut self, value: S) -> &mut Self { + self.margin = value + .in_pixels(&self.target.plotting_area().dim_in_pixel()) + .max(0) as u32; + self + } + + /** + Sets the size of the legend area. + + `size` - The size of legend area in backend units (pixels) + + See [`ChartContext::configure_series_labels()`] for more information and examples. + */ + pub fn legend_area_size<S: SizeDesc>(&mut self, size: S) -> &mut Self { + let size = size + .in_pixels(&self.target.plotting_area().dim_in_pixel()) + .max(0) as u32; + self.legend_area_size = size; + self + } + + /** + Sets the style of the label series area. + + `style` - The style of the border + + See [`ChartContext::configure_series_labels()`] for more information and examples. + */ + pub fn border_style<S: Into<ShapeStyle>>(&mut self, style: S) -> &mut Self { + self.border_style = style.into(); + self + } + + /** + Sets the background style of the label series area. + + `style` - The style of the border + + See [`ChartContext::configure_series_labels()`] for more information and examples. + */ + pub fn background_style<S: Into<ShapeStyle>>(&mut self, style: S) -> &mut Self { + self.background = style.into(); + self + } + + /** + Sets the font for series labels. + + `font` - Desired font + + See [`ChartContext::configure_series_labels()`] for more information and examples. + */ + pub fn label_font<F: IntoTextStyle<'b>>(&mut self, font: F) -> &mut Self { + self.label_font = Some(font.into_text_style(&self.target.plotting_area().dim_in_pixel())); + self + } + + /** + Draws the series label area. + + See [`ChartContext::configure_series_labels()`] for more information and examples. + */ + pub fn draw(&mut self) -> Result<(), DrawingAreaErrorKind<DB::ErrorType>> { + let drawing_area = self.target.plotting_area().strip_coord_spec(); + + // TODO: Issue #68 Currently generic font family doesn't load on OSX, change this after the issue + // resolved + let default_font = ("sans-serif", 12).into_font(); + let default_style: TextStyle = default_font.into(); + + let font = { + let mut temp = None; + std::mem::swap(&mut self.label_font, &mut temp); + temp.unwrap_or(default_style) + }; + + let mut label_element = MultiLineText::<_, &str>::new((0, 0), &font); + let mut funcs = vec![]; + + for anno in self.target.series_anno.iter() { + let label_text = anno.get_label(); + let draw_func = anno.get_draw_func(); + + if label_text.is_empty() && draw_func.is_none() { + continue; + } + + funcs.push( + draw_func.unwrap_or(&|p: BackendCoord| EmptyElement::at(p).into_dyn()), + ); + label_element.push_line(label_text); + } + + let (mut w, mut h) = label_element.estimate_dimension().map_err(|e| { + DrawingAreaErrorKind::BackendError(DrawingErrorKind::FontError(Box::new(e))) + })?; + + let margin = self.margin as i32; + + w += self.legend_area_size as i32 + margin * 2; + h += margin * 2; + + let (area_w, area_h) = drawing_area.dim_in_pixel(); + + let (label_x, label_y) = self.position.layout_label_area((w, h), (area_w, area_h)); + + label_element.relocate(( + label_x + self.legend_area_size as i32 + margin, + label_y + margin, + )); + + drawing_area.draw(&Rectangle::new( + [(label_x, label_y), (label_x + w, label_y + h)], + self.background.filled(), + ))?; + drawing_area.draw(&Rectangle::new( + [(label_x, label_y), (label_x + w, label_y + h)], + self.border_style, + ))?; + drawing_area.draw(&label_element)?; + + for (((_, y0), (_, y1)), make_elem) in label_element + .compute_line_layout() + .map_err(|e| { + DrawingAreaErrorKind::BackendError(DrawingErrorKind::FontError(Box::new(e))) + })? + .into_iter() + .zip(funcs.into_iter()) + { + let legend_element = make_elem((label_x + margin, (y0 + y1) / 2)); + drawing_area.draw(&legend_element)?; + } + + Ok(()) + } +} diff --git a/vendor/plotters/src/chart/state.rs b/vendor/plotters/src/chart/state.rs new file mode 100644 index 000000000..1ce2f8285 --- /dev/null +++ b/vendor/plotters/src/chart/state.rs @@ -0,0 +1,112 @@ +use std::sync::Arc; + +use super::ChartContext; +use crate::coord::{CoordTranslate, Shift}; +use crate::drawing::DrawingArea; +use plotters_backend::DrawingBackend; + +/// A chart context state - This is the data that is needed to reconstruct the chart context +/// without actually drawing the chart. This is useful when we want to do realtime rendering and +/// want to incrementally update the chart. +/// +/// For each frame, instead of updating the entire backend, we are able to keep the keep the figure +/// component like axis, labels untouched and make updates only in the plotting drawing area. +/// This is very useful for incremental render. +/// ```rust +/// use plotters::prelude::*; +/// let mut buffer = vec![0u8;1024*768*3]; +/// let area = BitMapBackend::with_buffer(&mut buffer[..], (1024, 768)) +/// .into_drawing_area() +/// .split_evenly((1,2)); +/// let chart = ChartBuilder::on(&area[0]) +/// .caption("Incremental Example", ("sans-serif", 20)) +/// .set_all_label_area_size(30) +/// .build_cartesian_2d(0..10, 0..10) +/// .expect("Unable to build ChartContext"); +/// // Draw the first frame at this point +/// area[0].present().expect("Present"); +/// let state = chart.into_chart_state(); +/// // Let's draw the second frame +/// let chart = state.restore(&area[0]); +/// chart.plotting_area().fill(&WHITE).unwrap(); // Clear the previously drawn graph +/// // At this point, you are able to draw next frame +///``` +#[derive(Clone)] +pub struct ChartState<CT: CoordTranslate> { + drawing_area_pos: (i32, i32), + drawing_area_size: (u32, u32), + coord: CT, +} + +impl<'a, DB: DrawingBackend, CT: CoordTranslate> From<ChartContext<'a, DB, CT>> for ChartState<CT> { + fn from(chart: ChartContext<'a, DB, CT>) -> ChartState<CT> { + ChartState { + drawing_area_pos: chart.drawing_area_pos, + drawing_area_size: chart.drawing_area.dim_in_pixel(), + coord: chart.drawing_area.into_coord_spec(), + } + } +} + +impl<'a, DB: DrawingBackend, CT: CoordTranslate> ChartContext<'a, DB, CT> { + /// Convert a chart context into a chart state, by doing so, the chart context is consumed and + /// a saved chart state is created for later use. This is typically used in incrmental rendering. See documentation of `ChartState` for more detailed example. + pub fn into_chart_state(self) -> ChartState<CT> { + self.into() + } + + /// Convert the chart context into a sharable chart state. + /// Normally a chart state can not be clone, since the coordinate spec may not be able to be + /// cloned. In this case, we can use an `Arc` get the coordinate wrapped thus the state can be + /// cloned and shared by multiple chart context + pub fn into_shared_chart_state(self) -> ChartState<Arc<CT>> { + ChartState { + drawing_area_pos: self.drawing_area_pos, + drawing_area_size: self.drawing_area.dim_in_pixel(), + coord: Arc::new(self.drawing_area.into_coord_spec()), + } + } +} + +impl<'a, DB, CT> From<&ChartContext<'a, DB, CT>> for ChartState<CT> +where + DB: DrawingBackend, + CT: CoordTranslate + Clone, +{ + fn from(chart: &ChartContext<'a, DB, CT>) -> ChartState<CT> { + ChartState { + drawing_area_pos: chart.drawing_area_pos, + drawing_area_size: chart.drawing_area.dim_in_pixel(), + coord: chart.drawing_area.as_coord_spec().clone(), + } + } +} + +impl<'a, DB: DrawingBackend, CT: CoordTranslate + Clone> ChartContext<'a, DB, CT> { + /// Make the chart context, do not consume the chart context and clone the coordinate spec + pub fn to_chart_state(&self) -> ChartState<CT> { + self.into() + } +} + +impl<CT: CoordTranslate> ChartState<CT> { + /// Restore the chart context on the given drawing area + /// + /// - `area`: The given drawing area where we want to restore the chart context + /// - **returns** The newly created chart context + pub fn restore<'a, DB: DrawingBackend>( + self, + area: &DrawingArea<DB, Shift>, + ) -> ChartContext<'a, DB, CT> { + let area = area + .clone() + .shrink(self.drawing_area_pos, self.drawing_area_size); + ChartContext { + x_label_area: [None, None], + y_label_area: [None, None], + drawing_area: area.apply_coord_spec(self.coord), + series_anno: vec![], + drawing_area_pos: self.drawing_area_pos, + } + } +} diff --git a/vendor/plotters/src/coord/mod.rs b/vendor/plotters/src/coord/mod.rs new file mode 100644 index 000000000..574929d4c --- /dev/null +++ b/vendor/plotters/src/coord/mod.rs @@ -0,0 +1,73 @@ +/*! + +One of the key features of Plotters is flexible coordinate system abstraction and this module +provides all the abstraction used for the coordinate abstarction of Plotters. + +Generally speaking, the coordinate system in Plotters is responsible for mapping logic data points into +pixel based backend coordinate. This task is abstracted by a simple trait called +[CoordTranslate](trait.CoordTranslate.html). Please note `CoordTranslate` trait doesn't assume any property +about the coordinate values, thus we are able to extend Plotters's coordinate system to other types of coorindate +easily. + +Another important trait is [ReverseCoordTranslate](trait.ReverseCoordTranslate.html). This trait allows some coordinate +retrieve the logic value based on the pixel-based backend coordinate. This is particularly interesting for interactive plots. + +Plotters contains a set of pre-defined coordinate specifications that fulfills the most common use. See documentation for +module [types](types/index.html) for details about the basic 1D types. + +The coordinate system also can be tweaked by the coordinate combinators, such as logarithmic coordinate, nested coordinate, etc. +See documentation for module [combinators](combinators/index.html) for details. + +Currently we support the following 2D coordinate system: + +- 2-dimensional Cartesian Coordinate: This is done by the combinator [Cartesian2d](cartesian/struct.Cartesian2d.html). + +*/ + +use plotters_backend::BackendCoord; + +pub mod ranged1d; + +/// The coordinate combinators +/// +/// Coordinate combinators are very important part of Plotters' coordinate system. +/// The combinator is more about the "combinator pattern", which takes one or more coordinate specification +/// and transform them into a new coordinate specification. +pub mod combinators { + pub use super::ranged1d::combinators::*; +} + +/// The primitive types supported by Plotters coordinate system +pub mod types { + pub use super::ranged1d::types::*; +} + +mod ranged2d; +/// Ranged coordinates in 3d. +pub mod ranged3d; + +/// Groups Cartesian ranged coordinates in 2d and 3d. +pub mod cartesian { + pub use super::ranged2d::cartesian::{Cartesian2d, MeshLine}; + pub use super::ranged3d::Cartesian3d; +} + +mod translate; +pub use translate::{CoordTranslate, ReverseCoordTranslate}; + +/// The coordinate translation that only impose shift +#[derive(Debug, Clone)] +pub struct Shift(pub BackendCoord); + +impl CoordTranslate for Shift { + type From = BackendCoord; + fn translate(&self, from: &Self::From) -> BackendCoord { + (from.0 + (self.0).0, from.1 + (self.0).1) + } +} + +impl ReverseCoordTranslate for Shift { + fn reverse_translate(&self, input: BackendCoord) -> Option<BackendCoord> { + Some((input.0 - (self.0).0, input.1 - (self.0).1)) + } +} diff --git a/vendor/plotters/src/coord/ranged1d/combinators/ckps.rs b/vendor/plotters/src/coord/ranged1d/combinators/ckps.rs new file mode 100644 index 000000000..5e1ed72bd --- /dev/null +++ b/vendor/plotters/src/coord/ranged1d/combinators/ckps.rs @@ -0,0 +1,268 @@ +// The customized coordinate combinators. +// This file contains a set of coorindate combinators that allows you determine the +// keypoint by your own code. +use std::ops::Range; + +use crate::coord::ranged1d::{AsRangedCoord, DiscreteRanged, KeyPointHint, Ranged}; + +/// The coordinate decorator that binds a key point vector. +/// Normally, all the ranged coordinate implements its own keypoint algorithm +/// to determine how to render the tick mark and mesh grid. +/// This decorator allows customized tick mark specifiied by vector. +/// See [BindKeyPoints::with_key_points](trait.BindKeyPoints.html#tymethod.with_key_points) +/// for details. +/// Note: For any coordinate spec wrapped by this decorator, the maxium number of labels configured by +/// MeshStyle will be ignored and the key point function will always returns the entire vector +pub struct WithKeyPoints<Inner: Ranged> { + inner: Inner, + bold_points: Vec<Inner::ValueType>, + light_points: Vec<Inner::ValueType>, +} + +impl<I: Ranged> WithKeyPoints<I> { + /// Specify the light key points, which is used to render the light mesh line + pub fn with_light_points<T: IntoIterator<Item = I::ValueType>>(mut self, iter: T) -> Self { + self.light_points.clear(); + self.light_points.extend(iter); + self + } + + /// Get a reference to the bold points + pub fn bold_points(&self) -> &[I::ValueType] { + self.bold_points.as_ref() + } + + /// Get a mut reference to the bold points + pub fn bold_points_mut(&mut self) -> &mut [I::ValueType] { + self.bold_points.as_mut() + } + + /// Get a reference to light key points + pub fn light_points(&self) -> &[I::ValueType] { + self.light_points.as_ref() + } + + /// Get a mut reference to the light key points + pub fn light_points_mut(&mut self) -> &mut [I::ValueType] { + self.light_points.as_mut() + } +} + +impl<R: Ranged> Ranged for WithKeyPoints<R> +where + R::ValueType: Clone, +{ + type ValueType = R::ValueType; + type FormatOption = R::FormatOption; + + fn range(&self) -> Range<Self::ValueType> { + self.inner.range() + } + + fn map(&self, value: &Self::ValueType, limit: (i32, i32)) -> i32 { + self.inner.map(value, limit) + } + + fn key_points<Hint: KeyPointHint>(&self, hint: Hint) -> Vec<Self::ValueType> { + if hint.weight().allow_light_points() { + self.light_points.clone() + } else { + self.bold_points.clone() + } + } + + fn axis_pixel_range(&self, limit: (i32, i32)) -> Range<i32> { + self.inner.axis_pixel_range(limit) + } +} + +impl<R: DiscreteRanged> DiscreteRanged for WithKeyPoints<R> +where + R::ValueType: Clone, +{ + fn size(&self) -> usize { + self.inner.size() + } + fn index_of(&self, value: &Self::ValueType) -> Option<usize> { + self.inner.index_of(value) + } + fn from_index(&self, index: usize) -> Option<Self::ValueType> { + self.inner.from_index(index) + } +} + +/// Bind a existing coordinate spec with a given key points vector. See [WithKeyPoints](struct.WithKeyPoints.html ) for more details. +pub trait BindKeyPoints +where + Self: AsRangedCoord, +{ + /// Bind a existing coordinate spec with a given key points vector. See [WithKeyPoints](struct.WithKeyPoints.html ) for more details. + /// Example: + /// ``` + ///use plotters::prelude::*; + ///use plotters_bitmap::BitMapBackend; + ///let mut buffer = vec![0;1024*768*3]; + /// let root = BitMapBackend::with_buffer(&mut buffer, (1024, 768)).into_drawing_area(); + /// let mut chart = ChartBuilder::on(&root) + /// .build_cartesian_2d( + /// (0..100).with_key_points(vec![1,20,50,90]), // <= This line will make the plot shows 4 tick marks at 1, 20, 50, 90 + /// 0..10 + /// ).unwrap(); + /// chart.configure_mesh().draw().unwrap(); + ///``` + fn with_key_points(self, points: Vec<Self::Value>) -> WithKeyPoints<Self::CoordDescType> { + WithKeyPoints { + inner: self.into(), + bold_points: points, + light_points: vec![], + } + } +} + +impl<T: AsRangedCoord> BindKeyPoints for T {} + +/// The coordinate decorator that allows customized keypoint algorithms. +/// Normally, all the coordinate spec implements its own key point algorith +/// But this decorator allows you override the pre-defined key point algorithm. +/// +/// To use this decorator, see [BindKeyPointMethod::with_key_point_func](trait.BindKeyPointMethod.html#tymethod.with_key_point_func) +pub struct WithKeyPointMethod<R: Ranged> { + inner: R, + bold_func: Box<dyn Fn(usize) -> Vec<R::ValueType>>, + light_func: Box<dyn Fn(usize) -> Vec<R::ValueType>>, +} + +/// Bind an existing coordinate spec with a given key points algorithm. See [WithKeyPointMethod](struct.WithKeyMethod.html ) for more details. +pub trait BindKeyPointMethod +where + Self: AsRangedCoord, +{ + /// Bind a existing coordinate spec with a given key points algorithm. See [WithKeyPointMethod](struct.WithKeyMethod.html ) for more details. + /// Example: + /// ``` + ///use plotters::prelude::*; + ///use plotters_bitmap::BitMapBackend; + ///let mut buffer = vec![0;1024*768*3]; + /// let root = BitMapBackend::with_buffer(&mut buffer, (1024, 768)).into_drawing_area(); + /// let mut chart = ChartBuilder::on(&root) + /// .build_cartesian_2d( + /// (0..100).with_key_point_func(|n| (0..100 / n as i32).map(|x| x * 100 / n as i32).collect()), + /// 0..10 + /// ).unwrap(); + /// chart.configure_mesh().draw().unwrap(); + ///``` + fn with_key_point_func<F: Fn(usize) -> Vec<Self::Value> + 'static>( + self, + func: F, + ) -> WithKeyPointMethod<Self::CoordDescType> { + WithKeyPointMethod { + inner: self.into(), + bold_func: Box::new(func), + light_func: Box::new(|_| Vec::new()), + } + } +} + +impl<T: AsRangedCoord> BindKeyPointMethod for T {} + +impl<R: Ranged> WithKeyPointMethod<R> { + /// Define the light key point algorithm, by default this returns an empty set + pub fn with_light_point_func<F: Fn(usize) -> Vec<R::ValueType> + 'static>( + mut self, + func: F, + ) -> Self { + self.light_func = Box::new(func); + self + } +} + +impl<R: Ranged> Ranged for WithKeyPointMethod<R> { + type ValueType = R::ValueType; + type FormatOption = R::FormatOption; + + fn range(&self) -> Range<Self::ValueType> { + self.inner.range() + } + + fn map(&self, value: &Self::ValueType, limit: (i32, i32)) -> i32 { + self.inner.map(value, limit) + } + + fn key_points<Hint: KeyPointHint>(&self, hint: Hint) -> Vec<Self::ValueType> { + if hint.weight().allow_light_points() { + (self.light_func)(hint.max_num_points()) + } else { + (self.bold_func)(hint.max_num_points()) + } + } + + fn axis_pixel_range(&self, limit: (i32, i32)) -> Range<i32> { + self.inner.axis_pixel_range(limit) + } +} + +impl<R: DiscreteRanged> DiscreteRanged for WithKeyPointMethod<R> { + fn size(&self) -> usize { + self.inner.size() + } + fn index_of(&self, value: &Self::ValueType) -> Option<usize> { + self.inner.index_of(value) + } + fn from_index(&self, index: usize) -> Option<Self::ValueType> { + self.inner.from_index(index) + } +} + +#[cfg(test)] +mod test { + use super::*; + use crate::coord::ranged1d::{BoldPoints, LightPoints}; + #[test] + fn test_with_key_points() { + let range = (0..100).with_key_points(vec![1, 2, 3]); + assert_eq!(range.map(&3, (0, 1000)), 30); + assert_eq!(range.range(), 0..100); + assert_eq!(range.key_points(BoldPoints(100)), vec![1, 2, 3]); + assert_eq!(range.key_points(LightPoints::new(100, 100)), vec![]); + let range = range.with_light_points(5..10); + assert_eq!(range.key_points(BoldPoints(10)), vec![1, 2, 3]); + assert_eq!( + range.key_points(LightPoints::new(10, 10)), + (5..10).collect::<Vec<_>>() + ); + + assert_eq!(range.size(), 101); + assert_eq!(range.index_of(&10), Some(10)); + assert_eq!(range.from_index(10), Some(10)); + + assert_eq!(range.axis_pixel_range((0, 1000)), 0..1000); + + let mut range = range; + + assert_eq!(range.light_points().len(), 5); + assert_eq!(range.light_points_mut().len(), 5); + assert_eq!(range.bold_points().len(), 3); + assert_eq!(range.bold_points_mut().len(), 3); + } + + #[test] + fn test_with_key_point_method() { + let range = (0..100).with_key_point_func(|_| vec![1, 2, 3]); + assert_eq!(range.map(&3, (0, 1000)), 30); + assert_eq!(range.range(), 0..100); + assert_eq!(range.key_points(BoldPoints(100)), vec![1, 2, 3]); + assert_eq!(range.key_points(LightPoints::new(100, 100)), vec![]); + let range = range.with_light_point_func(|_| (5..10).collect()); + assert_eq!(range.key_points(BoldPoints(10)), vec![1, 2, 3]); + assert_eq!( + range.key_points(LightPoints::new(10, 10)), + (5..10).collect::<Vec<_>>() + ); + + assert_eq!(range.size(), 101); + assert_eq!(range.index_of(&10), Some(10)); + assert_eq!(range.from_index(10), Some(10)); + + assert_eq!(range.axis_pixel_range((0, 1000)), 0..1000); + } +} diff --git a/vendor/plotters/src/coord/ranged1d/combinators/group_by.rs b/vendor/plotters/src/coord/ranged1d/combinators/group_by.rs new file mode 100644 index 000000000..5c0a4e567 --- /dev/null +++ b/vendor/plotters/src/coord/ranged1d/combinators/group_by.rs @@ -0,0 +1,119 @@ +use crate::coord::ranged1d::{ + AsRangedCoord, DiscreteRanged, KeyPointHint, NoDefaultFormatting, Ranged, ValueFormatter, +}; +use std::ops::Range; + +/// Grouping the value in the coordinate specification. +/// +/// This combinator doesn't change the coordinate mapping behavior. But it changes how +/// the key point is generated, this coordinate specification will enforce that only the first value in each group +/// can be emitted as the bold key points. +/// +/// This is useful, for example, when we have an X axis is a integer and denotes days. +/// And we are expecting the tick mark denotes weeks, in this way we can make the range +/// spec grouping by 7 elements. +/// With the help of the GroupBy decorator, this can be archived quite easily: +///```rust +///use plotters::prelude::*; +///let mut buf = vec![0;1024*768*3]; +///let area = BitMapBackend::with_buffer(buf.as_mut(), (1024, 768)).into_drawing_area(); +///let chart = ChartBuilder::on(&area) +/// .build_cartesian_2d((0..100).group_by(7), 0..100) +/// .unwrap(); +///``` +/// +/// To apply this combinator, call [ToGroupByRange::group_by](trait.ToGroupByRange.html#tymethod.group_by) method on any discrete coordinate spec. +#[derive(Clone)] +pub struct GroupBy<T: DiscreteRanged>(T, usize); + +/// The trait that provides method `Self::group_by` function which creates a +/// `GroupBy` decorated ranged value. +pub trait ToGroupByRange: AsRangedCoord + Sized +where + Self::CoordDescType: DiscreteRanged, +{ + /// Make a grouping ranged value, see the documentation for `GroupBy` for details. + /// + /// - `value`: The number of values we want to group it + /// - **return**: The newly created grouping range specification + fn group_by(self, value: usize) -> GroupBy<<Self as AsRangedCoord>::CoordDescType> { + GroupBy(self.into(), value) + } +} + +impl<T: AsRangedCoord + Sized> ToGroupByRange for T where T::CoordDescType: DiscreteRanged {} + +impl<T: DiscreteRanged> DiscreteRanged for GroupBy<T> { + fn size(&self) -> usize { + (self.0.size() + self.1 - 1) / self.1 + } + fn index_of(&self, value: &Self::ValueType) -> Option<usize> { + self.0.index_of(value).map(|idx| idx / self.1) + } + fn from_index(&self, index: usize) -> Option<Self::ValueType> { + self.0.from_index(index * self.1) + } +} + +impl<T, R: DiscreteRanged<ValueType = T> + ValueFormatter<T>> ValueFormatter<T> for GroupBy<R> { + fn format(value: &T) -> String { + R::format(value) + } +} + +impl<T: DiscreteRanged> Ranged for GroupBy<T> { + type FormatOption = NoDefaultFormatting; + type ValueType = T::ValueType; + fn map(&self, value: &T::ValueType, limit: (i32, i32)) -> i32 { + self.0.map(value, limit) + } + fn range(&self) -> Range<T::ValueType> { + self.0.range() + } + // TODO: See issue issue #88 + fn key_points<HintType: KeyPointHint>(&self, hint: HintType) -> Vec<T::ValueType> { + let range = 0..(self.0.size() + self.1) / self.1; + //let logic_range: RangedCoordusize = range.into(); + + let interval = + ((range.end - range.start + hint.bold_points() - 1) / hint.bold_points()).max(1); + let count = (range.end - range.start) / interval; + + let idx_iter = (0..hint.bold_points()).map(|x| x * interval); + + if hint.weight().allow_light_points() && count < hint.bold_points() * 2 { + let outter_ticks = idx_iter; + let outter_tick_size = interval * self.1; + let inner_ticks_per_group = hint.max_num_points() / outter_ticks.len(); + let inner_ticks = + (outter_tick_size + inner_ticks_per_group - 1) / inner_ticks_per_group; + let inner_ticks: Vec<_> = (0..(outter_tick_size / inner_ticks)) + .map(move |x| x * inner_ticks) + .collect(); + let size = self.0.size(); + return outter_ticks + .flat_map(|base| inner_ticks.iter().map(move |&ofs| base * self.1 + ofs)) + .take_while(|&idx| idx < size) + .map(|x| self.0.from_index(x).unwrap()) + .collect(); + } + + idx_iter + .map(|x| self.0.from_index(x * self.1).unwrap()) + .collect() + } +} + +#[cfg(test)] +mod test { + use super::*; + #[test] + fn test_group_by() { + let coord = (0..100).group_by(10); + assert_eq!(coord.size(), 11); + for (idx, val) in (0..).zip(coord.values()) { + assert_eq!(val, idx * 10); + assert_eq!(coord.from_index(idx as usize), Some(val)); + } + } +} diff --git a/vendor/plotters/src/coord/ranged1d/combinators/linspace.rs b/vendor/plotters/src/coord/ranged1d/combinators/linspace.rs new file mode 100644 index 000000000..7f4ac8641 --- /dev/null +++ b/vendor/plotters/src/coord/ranged1d/combinators/linspace.rs @@ -0,0 +1,433 @@ +use crate::coord::ranged1d::types::RangedCoordusize; +use crate::coord::ranged1d::{ + AsRangedCoord, DiscreteRanged, KeyPointHint, NoDefaultFormatting, Ranged, ValueFormatter, +}; +use std::cmp::{Ordering, PartialOrd}; +use std::marker::PhantomData; +use std::ops::{Add, Range, Sub}; + +/// The type marker used to denote the rounding method. +/// Since we are mapping any range to a discrete range thus not all values are +/// perfect mapped to the grid points. In this case, this type marker gives hints +/// for the linspace coord for how to treat the non-grid-point values. +pub trait LinspaceRoundingMethod<V> { + /// Search for the value within the given values array and rounding method + /// + /// - `values`: The values we want to search + /// - `target`: The target value + /// - `returns`: The index if we found the matching item, otherwise none + fn search(values: &[V], target: &V) -> Option<usize>; +} + +/// This type marker means linspace do the exact match for searching +/// which means if there's no value strictly equals to the target, the coord spec +/// reports not found result. +#[derive(Clone)] +pub struct Exact<V>(PhantomData<V>); + +impl<V: PartialOrd> LinspaceRoundingMethod<V> for Exact<V> { + fn search(values: &[V], target: &V) -> Option<usize> { + values.iter().position(|x| target == x) + } +} + +/// This type marker means we round up the value. Which means we try to find a +/// minimal value in the values array that is greater or equal to the target. +#[derive(Clone)] +pub struct Ceil<V>(PhantomData<V>); + +impl<V: PartialOrd> LinspaceRoundingMethod<V> for Ceil<V> { + fn search(values: &[V], target: &V) -> Option<usize> { + let ascending = if values.len() < 2 { + true + } else { + values[0].partial_cmp(&values[1]) == Some(Ordering::Less) + }; + + match values.binary_search_by(|probe| { + if ascending { + probe.partial_cmp(target).unwrap() + } else { + target.partial_cmp(probe).unwrap() + } + }) { + Ok(idx) => Some(idx), + Err(idx) => { + let offset = if ascending { 0 } else { 1 }; + + if idx < offset || idx >= values.len() + offset { + return None; + } + Some(idx - offset) + } + } + } +} + +/// This means we use the round down. Which means we try to find a +/// maximum value in the values array that is less or equal to the target. +#[derive(Clone)] +pub struct Floor<V>(PhantomData<V>); + +impl<V: PartialOrd> LinspaceRoundingMethod<V> for Floor<V> { + fn search(values: &[V], target: &V) -> Option<usize> { + let ascending = if values.len() < 2 { + true + } else { + values[0].partial_cmp(&values[1]) == Some(Ordering::Less) + }; + + match values.binary_search_by(|probe| { + if ascending { + probe.partial_cmp(target).unwrap() + } else { + target.partial_cmp(probe).unwrap() + } + }) { + Ok(idx) => Some(idx), + Err(idx) => { + let offset = if ascending { 1 } else { 0 }; + + if idx < offset || idx >= values.len() + offset { + return None; + } + Some(idx - offset) + } + } + } +} + +/// This means we use the rounding. Which means we try to find the closet +/// value in the array that matches the target +#[derive(Clone)] +pub struct Round<V, S>(PhantomData<(V, S)>); + +impl<V, S> LinspaceRoundingMethod<V> for Round<V, S> +where + V: Add<S, Output = V> + PartialOrd + Sub<V, Output = S> + Clone, + S: PartialOrd + Clone, +{ + fn search(values: &[V], target: &V) -> Option<usize> { + let ascending = if values.len() < 2 { + true + } else { + values[0].partial_cmp(&values[1]) == Some(Ordering::Less) + }; + + match values.binary_search_by(|probe| { + if ascending { + probe.partial_cmp(target).unwrap() + } else { + target.partial_cmp(probe).unwrap() + } + }) { + Ok(idx) => Some(idx), + Err(idx) => { + if idx == 0 { + return Some(0); + } + + if idx == values.len() { + return Some(idx - 1); + } + + let left_delta = if ascending { + target.clone() - values[idx - 1].clone() + } else { + values[idx - 1].clone() - target.clone() + }; + let right_delta = if ascending { + values[idx].clone() - target.clone() + } else { + target.clone() - values[idx].clone() + }; + + if left_delta.partial_cmp(&right_delta) == Some(Ordering::Less) { + Some(idx - 1) + } else { + Some(idx) + } + } + } + } +} + +/// The coordinate combinator that transform a continous coordinate to a discrete coordinate +/// to a discrete coordinate by a giving step. +/// +/// For example, range `0f32..100f32` is a continuous coordinate, thus this prevent us having a +/// histogram on it since Plotters doesn't know how to segment the range into buckets. +/// In this case, to get a histogram, we need to split the original range to a +/// set of discrete buckets (for example, 0.5 per bucket). +/// +/// The linspace decorate abstracting this method. For example, we can have a discrete coordinate: +/// `(0f32..100f32).step(0.5)`. +/// +/// Linspace also supports different types of bucket matching method - This configuration alters the behavior of +/// [DiscreteCoord::index_of](../trait.DiscreteCoord.html#tymethod.index_of) for Linspace coord spec +/// - **Flooring**, the value falls into the nearst bucket smaller than it. See [Linspace::use_floor](struct.Linspace.html#method.use_floor) +/// - **Round**, the value falls into the nearst bucket. See [Linearspace::use_round](struct.Linspace.html#method.use_round) +/// - **Ceiling**, the value falls into the nearst bucket larger than itself. See [Linspace::use_ceil](struct.Linspace.html#method.use_ceil) +/// - **Exact Matchting**, the value must be exactly same as the butcket value. See [Linspace::use_exact](struct.Linspace.html#method.use_exact) +#[derive(Clone)] +pub struct Linspace<T: Ranged, S: Clone, R: LinspaceRoundingMethod<T::ValueType>> +where + T::ValueType: Add<S, Output = T::ValueType> + PartialOrd + Clone, +{ + step: S, + inner: T, + grid_value: Vec<T::ValueType>, + _phatom: PhantomData<R>, +} + +impl<T: Ranged, S: Clone, R: LinspaceRoundingMethod<T::ValueType>> Linspace<T, S, R> +where + T::ValueType: Add<S, Output = T::ValueType> + PartialOrd + Clone, +{ + fn compute_grid_values(&mut self) { + let range = self.inner.range(); + + match ( + range.start.partial_cmp(&range.end), + (range.start.clone() + self.step.clone()).partial_cmp(&range.end), + ) { + (Some(a), Some(b)) if a != b || a == Ordering::Equal || b == Ordering::Equal => (), + (Some(a), Some(_)) => { + let mut current = range.start; + while current.partial_cmp(&range.end) == Some(a) { + self.grid_value.push(current.clone()); + current = current + self.step.clone(); + } + } + _ => (), + } + } + + /// Set the linspace use the round up method for value matching + /// + /// - **returns**: The newly created linspace that uses new matching method + pub fn use_ceil(self) -> Linspace<T, S, Ceil<T::ValueType>> { + Linspace { + step: self.step, + inner: self.inner, + grid_value: self.grid_value, + _phatom: PhantomData, + } + } + + /// Set the linspace use the round down method for value matching + /// + /// - **returns**: The newly created linspace that uses new matching method + pub fn use_floor(self) -> Linspace<T, S, Floor<T::ValueType>> { + Linspace { + step: self.step, + inner: self.inner, + grid_value: self.grid_value, + _phatom: PhantomData, + } + } + + /// Set the linspace use the best match method for value matching + /// + /// - **returns**: The newly created linspace that uses new matching method + pub fn use_round(self) -> Linspace<T, S, Round<T::ValueType, S>> + where + T::ValueType: Sub<T::ValueType, Output = S>, + S: PartialOrd, + { + Linspace { + step: self.step, + inner: self.inner, + grid_value: self.grid_value, + _phatom: PhantomData, + } + } + + /// Set the linspace use the exact match method for value matching + /// + /// - **returns**: The newly created linspace that uses new matching method + pub fn use_exact(self) -> Linspace<T, S, Exact<T::ValueType>> + where + T::ValueType: Sub<T::ValueType, Output = S>, + S: PartialOrd, + { + Linspace { + step: self.step, + inner: self.inner, + grid_value: self.grid_value, + _phatom: PhantomData, + } + } +} + +impl<T, R, S, RM> ValueFormatter<T> for Linspace<R, S, RM> +where + R: Ranged<ValueType = T> + ValueFormatter<T>, + RM: LinspaceRoundingMethod<T>, + T: Add<S, Output = T> + PartialOrd + Clone, + S: Clone, +{ + fn format(value: &T) -> String { + R::format(value) + } +} + +impl<T: Ranged, S: Clone, R: LinspaceRoundingMethod<T::ValueType>> Ranged for Linspace<T, S, R> +where + T::ValueType: Add<S, Output = T::ValueType> + PartialOrd + Clone, +{ + type FormatOption = NoDefaultFormatting; + type ValueType = T::ValueType; + + fn range(&self) -> Range<T::ValueType> { + self.inner.range() + } + + fn map(&self, value: &T::ValueType, limit: (i32, i32)) -> i32 { + self.inner.map(value, limit) + } + + fn key_points<Hint: KeyPointHint>(&self, hint: Hint) -> Vec<T::ValueType> { + if self.grid_value.is_empty() { + return vec![]; + } + let idx_range: RangedCoordusize = (0..(self.grid_value.len() - 1)).into(); + + idx_range + .key_points(hint) + .into_iter() + .map(|x| self.grid_value[x].clone()) + .collect() + } +} + +impl<T: Ranged, S: Clone, R: LinspaceRoundingMethod<T::ValueType>> DiscreteRanged + for Linspace<T, S, R> +where + T::ValueType: Add<S, Output = T::ValueType> + PartialOrd + Clone, +{ + fn size(&self) -> usize { + self.grid_value.len() + } + + fn index_of(&self, value: &T::ValueType) -> Option<usize> { + R::search(self.grid_value.as_ref(), value) + } + + fn from_index(&self, idx: usize) -> Option<T::ValueType> { + self.grid_value.get(idx).map(Clone::clone) + } +} + +/// Makes a linspace coordinate from the ranged coordinates. +pub trait IntoLinspace: AsRangedCoord { + /// Set the step value, make a linspace coordinate from the given range. + /// By default the matching method use the exact match + /// + /// - `val`: The step value + /// - **returns*: The newly created linspace + fn step<S: Clone>(self, val: S) -> Linspace<Self::CoordDescType, S, Exact<Self::Value>> + where + Self::Value: Add<S, Output = Self::Value> + PartialOrd + Clone, + { + let mut ret = Linspace { + step: val, + inner: self.into(), + grid_value: vec![], + _phatom: PhantomData, + }; + + ret.compute_grid_values(); + + ret + } +} + +impl<T: AsRangedCoord> IntoLinspace for T {} + +#[cfg(test)] +mod test { + use super::*; + + #[test] + fn test_float_linspace() { + let coord = (0.0f64..100.0f64).step(0.1); + + assert_eq!(coord.map(&23.12, (0, 10000)), 2312); + assert_eq!(coord.range(), 0.0..100.0); + assert_eq!(coord.key_points(100000).len(), 1001); + assert_eq!(coord.size(), 1001); + assert_eq!(coord.index_of(&coord.from_index(230).unwrap()), Some(230)); + assert!((coord.from_index(230).unwrap() - 23.0).abs() < 1e-5); + } + + #[test] + fn test_rounding_methods() { + let coord = (0.0f64..100.0f64).step(1.0); + + assert_eq!(coord.index_of(&1.0), Some(1)); + assert_eq!(coord.index_of(&1.2), None); + + let coord = coord.use_floor(); + assert_eq!(coord.index_of(&1.0), Some(1)); + assert_eq!(coord.index_of(&1.2), Some(1)); + assert_eq!(coord.index_of(&23.9), Some(23)); + assert_eq!(coord.index_of(&10000.0), Some(99)); + assert_eq!(coord.index_of(&-1.0), None); + + let coord = coord.use_ceil(); + assert_eq!(coord.index_of(&1.0), Some(1)); + assert_eq!(coord.index_of(&1.2), Some(2)); + assert_eq!(coord.index_of(&23.9), Some(24)); + assert_eq!(coord.index_of(&10000.0), None); + assert_eq!(coord.index_of(&-1.0), Some(0)); + + let coord = coord.use_round(); + assert_eq!(coord.index_of(&1.0), Some(1)); + assert_eq!(coord.index_of(&1.2), Some(1)); + assert_eq!(coord.index_of(&1.7), Some(2)); + assert_eq!(coord.index_of(&23.9), Some(24)); + assert_eq!(coord.index_of(&10000.0), Some(99)); + assert_eq!(coord.index_of(&-1.0), Some(0)); + + let coord = (0.0f64..-100.0f64).step(-1.0); + + assert_eq!(coord.index_of(&-1.0), Some(1)); + assert_eq!(coord.index_of(&-1.2), None); + + let coord = coord.use_floor(); + assert_eq!(coord.index_of(&-1.0), Some(1)); + assert_eq!(coord.index_of(&-1.2), Some(2)); + assert_eq!(coord.index_of(&-23.9), Some(24)); + assert_eq!(coord.index_of(&-10000.0), None); + assert_eq!(coord.index_of(&1.0), Some(0)); + + let coord = coord.use_ceil(); + assert_eq!(coord.index_of(&-1.0), Some(1)); + assert_eq!(coord.index_of(&-1.2), Some(1)); + assert_eq!(coord.index_of(&-23.9), Some(23)); + assert_eq!(coord.index_of(&-10000.0), Some(99)); + assert_eq!(coord.index_of(&1.0), None); + + let coord = coord.use_round(); + assert_eq!(coord.index_of(&-1.0), Some(1)); + assert_eq!(coord.index_of(&-1.2), Some(1)); + assert_eq!(coord.index_of(&-1.7), Some(2)); + assert_eq!(coord.index_of(&-23.9), Some(24)); + assert_eq!(coord.index_of(&-10000.0), Some(99)); + assert_eq!(coord.index_of(&1.0), Some(0)); + } + + #[cfg(feature = "chrono")] + #[test] + fn test_duration_linspace() { + use chrono::Duration; + let coord = (Duration::seconds(0)..Duration::seconds(100)).step(Duration::milliseconds(1)); + + assert_eq!(coord.size(), 100_000); + assert_eq!(coord.index_of(&coord.from_index(230).unwrap()), Some(230)); + assert_eq!(coord.key_points(10000000).len(), 100_000); + assert_eq!(coord.range(), Duration::seconds(0)..Duration::seconds(100)); + assert_eq!(coord.map(&Duration::seconds(25), (0, 100_000)), 25000); + } +} diff --git a/vendor/plotters/src/coord/ranged1d/combinators/logarithmic.rs b/vendor/plotters/src/coord/ranged1d/combinators/logarithmic.rs new file mode 100644 index 000000000..fee36f374 --- /dev/null +++ b/vendor/plotters/src/coord/ranged1d/combinators/logarithmic.rs @@ -0,0 +1,284 @@ +use crate::coord::ranged1d::types::RangedCoordf64; +use crate::coord::ranged1d::{AsRangedCoord, DefaultFormatting, KeyPointHint, Ranged}; +use std::marker::PhantomData; +use std::ops::Range; + +/// The trait for the type that is able to be presented in the log scale. +/// This trait is primarily used by [LogRangeExt](struct.LogRangeExt.html). +pub trait LogScalable: Clone { + /// Make the conversion from the type to the floating point number + fn as_f64(&self) -> f64; + /// Convert a floating point number to the scale + fn from_f64(f: f64) -> Self; +} + +macro_rules! impl_log_scalable { + (i, $t:ty) => { + impl LogScalable for $t { + fn as_f64(&self) -> f64 { + if *self != 0 { + return *self as f64; + } + // If this is an integer, we should allow zero point to be shown + // on the chart, thus we can't map the zero point to inf. + // So we just assigning a value smaller than 1 as the alternative + // of the zero point. + return 0.5; + } + fn from_f64(f: f64) -> $t { + f.round() as $t + } + } + }; + (f, $t:ty) => { + impl LogScalable for $t { + fn as_f64(&self) -> f64 { + *self as f64 + } + fn from_f64(f: f64) -> $t { + f as $t + } + } + }; +} + +impl_log_scalable!(i, u8); +impl_log_scalable!(i, u16); +impl_log_scalable!(i, u32); +impl_log_scalable!(i, u64); + +impl_log_scalable!(i, i8); +impl_log_scalable!(i, i16); +impl_log_scalable!(i, i32); +impl_log_scalable!(i, i64); + +impl_log_scalable!(f, f32); +impl_log_scalable!(f, f64); + +/// Convert a range to a log scale coordinate spec +pub trait IntoLogRange { + /// The type of the value + type ValueType: LogScalable; + + /// Make the log scale coordinate + fn log_scale(self) -> LogRangeExt<Self::ValueType>; +} + +impl<T: LogScalable> IntoLogRange for Range<T> { + type ValueType = T; + fn log_scale(self) -> LogRangeExt<T> { + LogRangeExt { + range: self, + zero: 0.0, + base: 10.0, + } + } +} + +/// The logarithmic coodinate decorator. +/// This decorator is used to make the axis rendered as logarithmically. +#[derive(Clone)] +pub struct LogRangeExt<V: LogScalable> { + range: Range<V>, + zero: f64, + base: f64, +} + +impl<V: LogScalable> LogRangeExt<V> { + /// Set the zero point of the log scale coordinate. Zero point is the point where we map -inf + /// of the axis to the coordinate + pub fn zero_point(mut self, value: V) -> Self + where + V: PartialEq, + { + self.zero = if V::from_f64(0.0) == value { + 0.0 + } else { + value.as_f64() + }; + + self + } + + /// Set the base multipler + pub fn base(mut self, base: f64) -> Self { + if self.base > 1.0 { + self.base = base; + } + self + } +} + +impl<V: LogScalable> From<LogRangeExt<V>> for LogCoord<V> { + fn from(spec: LogRangeExt<V>) -> LogCoord<V> { + let zero_point = spec.zero; + let mut start = spec.range.start.as_f64() - zero_point; + let mut end = spec.range.end.as_f64() - zero_point; + let negative = if start < 0.0 || end < 0.0 { + start = -start; + end = -end; + true + } else { + false + }; + + if start < end { + if start == 0.0 { + start = start.max(end * 1e-5); + } + } else if end == 0.0 { + end = end.max(start * 1e-5); + } + + LogCoord { + linear: (start.ln()..end.ln()).into(), + logic: spec.range, + normalized: start..end, + base: spec.base, + zero_point, + negative, + marker: PhantomData, + } + } +} + +impl<V: LogScalable> AsRangedCoord for LogRangeExt<V> { + type CoordDescType = LogCoord<V>; + type Value = V; +} + +/// A log scaled coordinate axis +pub struct LogCoord<V: LogScalable> { + linear: RangedCoordf64, + logic: Range<V>, + normalized: Range<f64>, + base: f64, + zero_point: f64, + negative: bool, + marker: PhantomData<V>, +} + +impl<V: LogScalable> LogCoord<V> { + fn value_to_f64(&self, value: &V) -> f64 { + let fv = value.as_f64() - self.zero_point; + if self.negative { + -fv + } else { + fv + } + } + + fn f64_to_value(&self, fv: f64) -> V { + let fv = if self.negative { -fv } else { fv }; + V::from_f64(fv + self.zero_point) + } + + fn is_inf(&self, fv: f64) -> bool { + let fv = if self.negative { -fv } else { fv }; + let a = V::from_f64(fv + self.zero_point); + let b = V::from_f64(self.zero_point); + + (V::as_f64(&a) - V::as_f64(&b)).abs() < std::f64::EPSILON + } +} + +impl<V: LogScalable> Ranged for LogCoord<V> { + type FormatOption = DefaultFormatting; + type ValueType = V; + + fn map(&self, value: &V, limit: (i32, i32)) -> i32 { + let fv = self.value_to_f64(value); + let value_ln = fv.ln(); + self.linear.map(&value_ln, limit) + } + + fn key_points<Hint: KeyPointHint>(&self, hint: Hint) -> Vec<Self::ValueType> { + let max_points = hint.max_num_points(); + + let base = self.base; + let base_ln = base.ln(); + + let Range { mut start, mut end } = self.normalized; + + if start > end { + std::mem::swap(&mut start, &mut end); + } + + let bold_count = ((end / start).ln().abs() / base_ln).floor().max(1.0) as usize; + + let light_density = if max_points < bold_count { + 0 + } else { + let density = 1 + (max_points - bold_count) / bold_count; + let mut exp = 1; + while exp * 10 <= density { + exp *= 10; + } + exp - 1 + }; + + let mut multiplier = base; + let mut cnt = 1; + while max_points < bold_count / cnt { + multiplier *= base; + cnt += 1; + } + + let mut ret = vec![]; + let mut val = (base).powf((start.ln() / base_ln).ceil()); + + while val <= end { + if !self.is_inf(val) { + ret.push(self.f64_to_value(val)); + } + for i in 1..=light_density { + let v = val + * (1.0 + + multiplier / f64::from(light_density as u32 + 1) * f64::from(i as u32)); + if v > end { + break; + } + if !self.is_inf(val) { + ret.push(self.f64_to_value(v)); + } + } + val *= multiplier; + } + + ret + } + + fn range(&self) -> Range<V> { + self.logic.clone() + } +} + +/// The logarithmic coodinate decorator. +/// This decorator is used to make the axis rendered as logarithmically. +#[deprecated(note = "LogRange is deprecated, use IntoLogRange trait method instead")] +#[derive(Clone)] +pub struct LogRange<V: LogScalable>(pub Range<V>); + +#[allow(deprecated)] +impl<V: LogScalable> AsRangedCoord for LogRange<V> { + type CoordDescType = LogCoord<V>; + type Value = V; +} + +#[allow(deprecated)] +impl<V: LogScalable> From<LogRange<V>> for LogCoord<V> { + fn from(range: LogRange<V>) -> LogCoord<V> { + range.0.log_scale().into() + } +} + +#[cfg(test)] +mod test { + use super::*; + #[test] + fn regression_test_issue_143() { + let range: LogCoord<f64> = (1.0..5.0).log_scale().into(); + + range.key_points(100); + } +} diff --git a/vendor/plotters/src/coord/ranged1d/combinators/mod.rs b/vendor/plotters/src/coord/ranged1d/combinators/mod.rs new file mode 100644 index 000000000..2d5280248 --- /dev/null +++ b/vendor/plotters/src/coord/ranged1d/combinators/mod.rs @@ -0,0 +1,20 @@ +mod ckps; +pub use ckps::{BindKeyPointMethod, BindKeyPoints, WithKeyPointMethod, WithKeyPoints}; + +mod group_by; +pub use group_by::{GroupBy, ToGroupByRange}; + +mod linspace; +pub use linspace::{IntoLinspace, Linspace}; + +mod logarithmic; +pub use logarithmic::{IntoLogRange, LogCoord, LogScalable}; + +#[allow(deprecated)] +pub use logarithmic::LogRange; + +mod nested; +pub use nested::{BuildNestedCoord, NestedRange, NestedValue}; + +mod partial_axis; +pub use partial_axis::{make_partial_axis, IntoPartialAxis}; diff --git a/vendor/plotters/src/coord/ranged1d/combinators/nested.rs b/vendor/plotters/src/coord/ranged1d/combinators/nested.rs new file mode 100644 index 000000000..e4a493ec8 --- /dev/null +++ b/vendor/plotters/src/coord/ranged1d/combinators/nested.rs @@ -0,0 +1,205 @@ +use crate::coord::ranged1d::{ + AsRangedCoord, DiscreteRanged, KeyPointHint, NoDefaultFormatting, Ranged, ValueFormatter, +}; +use std::ops::Range; + +/// Describe a value for a nested coordinate +#[derive(PartialEq, Eq, Clone, Debug)] +pub enum NestedValue<C, V> { + /// Category value + Category(C), + /// One exact nested value + Value(C, V), +} + +impl<C, V> NestedValue<C, V> { + /// Get the category of current nest value + pub fn category(&self) -> &C { + match self { + NestedValue::Category(cat) => cat, + NestedValue::Value(cat, _) => cat, + } + } + /// Get the nested value from this value + pub fn nested_value(&self) -> Option<&V> { + match self { + NestedValue::Category(_) => None, + NestedValue::Value(_, val) => Some(val), + } + } +} + +impl<C, V> From<(C, V)> for NestedValue<C, V> { + fn from((cat, val): (C, V)) -> NestedValue<C, V> { + NestedValue::Value(cat, val) + } +} + +impl<C, V> From<C> for NestedValue<C, V> { + fn from(cat: C) -> NestedValue<C, V> { + NestedValue::Category(cat) + } +} + +/// A nested coordinate spec which is a discrete coordinate on the top level and +/// for each value in discrete value, there is a secondary coordinate system. +/// And the value is defined as a tuple of primary coordinate value and secondary +/// coordinate value +pub struct NestedRange<Primary: DiscreteRanged, Secondary: Ranged> { + primary: Primary, + secondary: Vec<Secondary>, +} + +impl<PT, ST, P, S> ValueFormatter<NestedValue<PT, ST>> for NestedRange<P, S> +where + P: Ranged<ValueType = PT> + DiscreteRanged, + S: Ranged<ValueType = ST>, + P: ValueFormatter<PT>, + S: ValueFormatter<ST>, +{ + fn format(value: &NestedValue<PT, ST>) -> String { + match value { + NestedValue::Category(cat) => P::format(cat), + NestedValue::Value(_, val) => S::format(val), + } + } +} + +impl<P: DiscreteRanged, S: Ranged> Ranged for NestedRange<P, S> { + type FormatOption = NoDefaultFormatting; + type ValueType = NestedValue<P::ValueType, S::ValueType>; + + fn range(&self) -> Range<Self::ValueType> { + let primary_range = self.primary.range(); + + let secondary_left = self.secondary[0].range().start; + let secondary_right = self.secondary[self.primary.size() - 1].range().end; + + NestedValue::Value(primary_range.start, secondary_left) + ..NestedValue::Value(primary_range.end, secondary_right) + } + + fn map(&self, value: &Self::ValueType, limit: (i32, i32)) -> i32 { + let idx = self.primary.index_of(value.category()).unwrap_or(0); + let total = self.primary.size(); + + let bucket_size = (limit.1 - limit.0) / total as i32; + let mut residual = (limit.1 - limit.0) % total as i32; + + if residual < 0 { + residual += total as i32; + } + + let s_left = limit.0 + bucket_size * idx as i32 + residual.min(idx as i32); + let s_right = s_left + bucket_size + if (residual as usize) < idx { 1 } else { 0 }; + + if let Some(secondary_value) = value.nested_value() { + self.secondary[idx].map(secondary_value, (s_left, s_right)) + } else { + (s_left + s_right) / 2 + } + } + + fn key_points<Hint: KeyPointHint>(&self, hint: Hint) -> Vec<Self::ValueType> { + if !hint.weight().allow_light_points() || hint.max_num_points() < self.primary.size() * 2 { + self.primary + .key_points(hint) + .into_iter() + .map(NestedValue::Category) + .collect() + } else { + let secondary_size = + (hint.max_num_points() - self.primary.size()) / self.primary.size(); + self.primary + .values() + .enumerate() + .flat_map(|(idx, val)| { + std::iter::once(NestedValue::Category(val)).chain( + self.secondary[idx] + .key_points(secondary_size) + .into_iter() + .map(move |v| { + NestedValue::Value(self.primary.from_index(idx).unwrap(), v) + }), + ) + }) + .collect() + } + } +} + +impl<P: DiscreteRanged, S: DiscreteRanged> DiscreteRanged for NestedRange<P, S> { + fn size(&self) -> usize { + self.secondary.iter().map(|x| x.size()).sum::<usize>() + } + + fn index_of(&self, value: &Self::ValueType) -> Option<usize> { + let p_idx = self.primary.index_of(value.category())?; + let s_idx = self.secondary[p_idx].index_of(value.nested_value()?)?; + Some( + s_idx + + self.secondary[..p_idx] + .iter() + .map(|x| x.size()) + .sum::<usize>(), + ) + } + + fn from_index(&self, mut index: usize) -> Option<Self::ValueType> { + for (p_idx, snd) in self.secondary.iter().enumerate() { + if snd.size() > index { + return Some(NestedValue::Value( + self.primary.from_index(p_idx).unwrap(), + snd.from_index(index).unwrap(), + )); + } + index -= snd.size(); + } + None + } +} + +/// Used to build a nested coordinate system. +pub trait BuildNestedCoord: AsRangedCoord +where + Self::CoordDescType: DiscreteRanged, +{ + /// Builds a nested coordinate system. + fn nested_coord<S: AsRangedCoord>( + self, + builder: impl Fn(<Self::CoordDescType as Ranged>::ValueType) -> S, + ) -> NestedRange<Self::CoordDescType, S::CoordDescType> { + let primary: Self::CoordDescType = self.into(); + assert!(primary.size() > 0); + + let secondary = primary + .values() + .map(|value| builder(value).into()) + .collect(); + + NestedRange { primary, secondary } + } +} + +impl<T: AsRangedCoord> BuildNestedCoord for T where T::CoordDescType: DiscreteRanged {} + +#[cfg(test)] +mod test { + use super::*; + + #[test] + fn test_nested_coord() { + let coord = (0..10).nested_coord(|x| 0..(x + 1)); + + let range = coord.range(); + + assert_eq!(NestedValue::Value(0, 0)..NestedValue::Value(10, 11), range); + assert_eq!(coord.map(&NestedValue::Category(0), (0, 1100)), 50); + assert_eq!(coord.map(&NestedValue::Value(0, 0), (0, 1100)), 0); + assert_eq!(coord.map(&NestedValue::Value(5, 4), (0, 1100)), 567); + + assert_eq!(coord.size(), (2 + 12) * 11 / 2); + assert_eq!(coord.index_of(&NestedValue::Value(5, 4)), Some(24)); + assert_eq!(coord.from_index(24), Some(NestedValue::Value(5, 4))); + } +} diff --git a/vendor/plotters/src/coord/ranged1d/combinators/partial_axis.rs b/vendor/plotters/src/coord/ranged1d/combinators/partial_axis.rs new file mode 100644 index 000000000..b778ee2c7 --- /dev/null +++ b/vendor/plotters/src/coord/ranged1d/combinators/partial_axis.rs @@ -0,0 +1,113 @@ +use crate::coord::ranged1d::{ + AsRangedCoord, DefaultFormatting, DiscreteRanged, KeyPointHint, Ranged, +}; +use std::ops::Range; + +/// This axis decorator will make the axis partially display on the axis. +/// At some time, we want the axis only covers some part of the value. +/// This decorator will have an additional display range defined. +#[derive(Clone)] +pub struct PartialAxis<R: Ranged>(R, Range<R::ValueType>); + +/// The trait for the types that can be converted into a partial axis +pub trait IntoPartialAxis: AsRangedCoord { + /// Make the partial axis + /// + /// - `axis_range`: The range of the axis to be displayed + /// - **returns**: The converted range specification + fn partial_axis( + self, + axis_range: Range<<Self::CoordDescType as Ranged>::ValueType>, + ) -> PartialAxis<Self::CoordDescType> { + PartialAxis(self.into(), axis_range) + } +} + +impl<R: AsRangedCoord> IntoPartialAxis for R {} + +impl<R: Ranged> Ranged for PartialAxis<R> +where + R::ValueType: Clone, +{ + type FormatOption = DefaultFormatting; + type ValueType = R::ValueType; + + fn map(&self, value: &Self::ValueType, limit: (i32, i32)) -> i32 { + self.0.map(value, limit) + } + + fn key_points<Hint: KeyPointHint>(&self, hint: Hint) -> Vec<Self::ValueType> { + self.0.key_points(hint) + } + + fn range(&self) -> Range<Self::ValueType> { + self.0.range() + } + + fn axis_pixel_range(&self, limit: (i32, i32)) -> Range<i32> { + let left = self.map(&self.1.start, limit); + let right = self.map(&self.1.end, limit); + + left.min(right)..left.max(right) + } +} + +impl<R: DiscreteRanged> DiscreteRanged for PartialAxis<R> +where + R: Ranged, + <R as Ranged>::ValueType: Eq + Clone, +{ + fn size(&self) -> usize { + self.0.size() + } + + fn index_of(&self, value: &R::ValueType) -> Option<usize> { + self.0.index_of(value) + } + + fn from_index(&self, index: usize) -> Option<Self::ValueType> { + self.0.from_index(index) + } +} + +/// Make a partial axis based on the percentage of visible portion. +/// We can use `into_partial_axis` to create a partial axis range specification. +/// But sometimes, we want to directly specify the percentage visible to the user. +/// +/// - `axis_range`: The range specification +/// - `part`: The visible part of the axis. Each value is from [0.0, 1.0] +/// - **returns**: The partial axis created from the input, or `None` when not possible +pub fn make_partial_axis<T>( + axis_range: Range<T>, + part: Range<f64>, +) -> Option<PartialAxis<<Range<T> as AsRangedCoord>::CoordDescType>> +where + Range<T>: AsRangedCoord, + T: num_traits::NumCast + Clone, +{ + let left: f64 = num_traits::cast(axis_range.start.clone())?; + let right: f64 = num_traits::cast(axis_range.end.clone())?; + + let full_range_size = (right - left) / (part.end - part.start); + + let full_left = left - full_range_size * part.start; + let full_right = right + full_range_size * (1.0 - part.end); + + let full_range: Range<T> = num_traits::cast(full_left)?..num_traits::cast(full_right)?; + + let axis_range: <Range<T> as AsRangedCoord>::CoordDescType = axis_range.into(); + + Some(PartialAxis(full_range.into(), axis_range.range())) +} + +#[cfg(test)] +mod test { + use super::*; + #[test] + fn test_make_partial_axis() { + let r = make_partial_axis(20..80, 0.2..0.8).unwrap(); + assert_eq!(r.size(), 101); + assert_eq!(r.range(), 0..100); + assert_eq!(r.axis_pixel_range((0, 100)), 20..80); + } +} diff --git a/vendor/plotters/src/coord/ranged1d/discrete.rs b/vendor/plotters/src/coord/ranged1d/discrete.rs new file mode 100644 index 000000000..074eece81 --- /dev/null +++ b/vendor/plotters/src/coord/ranged1d/discrete.rs @@ -0,0 +1,273 @@ +use crate::coord::ranged1d::{ + AsRangedCoord, KeyPointHint, NoDefaultFormatting, Ranged, ReversibleRanged, ValueFormatter, +}; +use std::ops::Range; + +/// The trait indicates the coordinate is discrete +/// This means we can bidirectionally map the range value to 0 to N +/// in which N is the number of distinct values of the range. +/// +/// This is useful since for a histgoram, this is an abstraction of bucket. +pub trait DiscreteRanged +where + Self: Ranged, +{ + /// Get the number of element in the range + /// Note: we assume that all the ranged discrete coordinate has finite value + /// + /// - **returns** The number of values in the range + fn size(&self) -> usize; + + /// Map a value to the index + /// + /// Note: This function doesn't guareentee return None when the value is out of range. + /// The only way to confirm the value is in the range is to examing the return value isn't + /// larger than self.size. + /// + /// - `value`: The value to map + /// - **returns** The index of the value + fn index_of(&self, value: &Self::ValueType) -> Option<usize>; + + /// Reverse map the index to the value + /// + /// Note: This function doesn't guareentee returning None when the index is out of range. + /// + /// - `value`: The index to map + /// - **returns** The value + // TODO: This doesn't follows rust's naming convention - however, this is a protential breaking + // change, so postpone the fix to the next major release + #[allow(clippy::wrong_self_convention)] + fn from_index(&self, index: usize) -> Option<Self::ValueType>; + + /// Return a iterator that iterates over the all possible values + /// + /// - **returns** The value iterator + fn values(&self) -> DiscreteValueIter<'_, Self> + where + Self: Sized, + { + DiscreteValueIter(self, 0, self.size()) + } + + /// Returns the previous value in this range + /// + /// Normally, it's based on the `from_index` and `index_of` function. But for + /// some of the coord spec, it's possible that we value faster implementation. + /// If this is the case, we can impelemnet the type specific impl for the `previous` + /// and `next`. + /// + /// - `value`: The current value + /// - **returns**: The value piror to current value + fn previous(&self, value: &Self::ValueType) -> Option<Self::ValueType> { + if let Some(idx) = self.index_of(value) { + if idx > 0 { + return self.from_index(idx - 1); + } + } + None + } + + /// Returns the next value in this range + /// + /// Normally, it's based on the `from_index` and `index_of` function. But for + /// some of the coord spec, it's possible that we value faster implementation. + /// If this is the case, we can impelemnet the type specific impl for the `previous` + /// and `next`. + /// + /// - `value`: The current value + /// - **returns**: The value next to current value + fn next(&self, value: &Self::ValueType) -> Option<Self::ValueType> { + if let Some(idx) = self.index_of(value) { + if idx + 1 < self.size() { + return self.from_index(idx + 1); + } + } + None + } +} + +/// A `SegmentedCoord` is a decorator on any discrete coordinate specification. +/// This decorator will convert the discrete coordiante in two ways: +/// - Add an extra dummy element after all the values in origianl discrete coordinate +/// - Logically each value `v` from original coordinate system is mapped into an segment `[v, v+1)` where `v+1` denotes the sucessor of the `v` +/// - Introduce two types of values `SegmentValue::Exact(value)` which denotes the left end of value's segment and `SegmentValue::CenterOf(value)` which refers the center of the segment. +/// This is used in histogram types, which uses a discrete coordinate as the buckets. The segmented coord always emits `CenterOf(value)` key points, thus it allows all the label and tick marks +/// of the coordinate rendered in the middle of each segment. +/// The coresponding trait [IntoSegmentedCoord](trait.IntoSegmentedCoord.html) is used to apply this decorator to coordinates. +#[derive(Clone)] +pub struct SegmentedCoord<D: DiscreteRanged>(D); + +/// The trait for types that can decorated by [SegmentedCoord](struct.SegmentedCoord.html) decorator. +pub trait IntoSegmentedCoord: AsRangedCoord +where + Self::CoordDescType: DiscreteRanged, +{ + /// Convert current ranged value into a segmented coordinate + fn into_segmented(self) -> SegmentedCoord<Self::CoordDescType> { + SegmentedCoord(self.into()) + } +} + +impl<R: AsRangedCoord> IntoSegmentedCoord for R where R::CoordDescType: DiscreteRanged {} + +/// The value that used by the segmented coordinate. +#[derive(Clone, Debug)] +pub enum SegmentValue<T> { + /// Means we are referring the exact position of value `T` + Exact(T), + /// Means we are referring the center of position `T` and the successor of `T` + CenterOf(T), + /// Referring the last dummy element + Last, +} + +impl<T, D: DiscreteRanged + Ranged<ValueType = T>> ValueFormatter<SegmentValue<T>> + for SegmentedCoord<D> +where + D: ValueFormatter<T>, +{ + fn format(value: &SegmentValue<T>) -> String { + match value { + SegmentValue::Exact(ref value) => D::format(value), + SegmentValue::CenterOf(ref value) => D::format(value), + _ => "".to_string(), + } + } +} + +impl<D: DiscreteRanged> Ranged for SegmentedCoord<D> { + type FormatOption = NoDefaultFormatting; + type ValueType = SegmentValue<D::ValueType>; + + fn map(&self, value: &Self::ValueType, limit: (i32, i32)) -> i32 { + let margin = ((limit.1 - limit.0) as f32 / self.0.size() as f32).round() as i32; + + match value { + SegmentValue::Exact(coord) => self.0.map(coord, (limit.0, limit.1 - margin)), + SegmentValue::CenterOf(coord) => { + let left = self.0.map(coord, (limit.0, limit.1 - margin)); + if let Some(idx) = self.0.index_of(coord) { + if idx + 1 < self.0.size() { + let right = self.0.map( + &self.0.from_index(idx + 1).unwrap(), + (limit.0, limit.1 - margin), + ); + return (left + right) / 2; + } + } + left + margin / 2 + } + SegmentValue::Last => limit.1, + } + } + + fn key_points<HintType: KeyPointHint>(&self, hint: HintType) -> Vec<Self::ValueType> { + self.0 + .key_points(hint) + .into_iter() + .map(SegmentValue::CenterOf) + .collect() + } + + fn range(&self) -> Range<Self::ValueType> { + let range = self.0.range(); + SegmentValue::Exact(range.start)..SegmentValue::Exact(range.end) + } +} + +impl<D: DiscreteRanged> DiscreteRanged for SegmentedCoord<D> { + fn size(&self) -> usize { + self.0.size() + 1 + } + + fn index_of(&self, value: &Self::ValueType) -> Option<usize> { + match value { + SegmentValue::Exact(value) => self.0.index_of(value), + SegmentValue::CenterOf(value) => self.0.index_of(value), + SegmentValue::Last => Some(self.0.size()), + } + } + + fn from_index(&self, idx: usize) -> Option<Self::ValueType> { + match idx { + idx if idx < self.0.size() => self.0.from_index(idx).map(SegmentValue::Exact), + idx if idx == self.0.size() => Some(SegmentValue::Last), + _ => None, + } + } +} + +impl<T> From<T> for SegmentValue<T> { + fn from(this: T) -> SegmentValue<T> { + SegmentValue::Exact(this) + } +} + +impl<DC: DiscreteRanged> ReversibleRanged for DC { + fn unmap(&self, input: i32, limit: (i32, i32)) -> Option<Self::ValueType> { + let idx = (f64::from(input - limit.0) * (self.size() as f64) / f64::from(limit.1 - limit.0)) + .floor() as usize; + self.from_index(idx) + } +} + +/// The iterator that can be used to iterate all the values defined by a discrete coordinate +pub struct DiscreteValueIter<'a, T: DiscreteRanged>(&'a T, usize, usize); + +impl<'a, T: DiscreteRanged> Iterator for DiscreteValueIter<'a, T> { + type Item = T::ValueType; + fn next(&mut self) -> Option<T::ValueType> { + if self.1 >= self.2 { + return None; + } + let idx = self.1; + self.1 += 1; + self.0.from_index(idx) + } +} + +#[cfg(test)] +mod test { + use super::*; + #[test] + fn test_value_iter() { + let range: crate::coord::ranged1d::types::RangedCoordi32 = (-10..10).into(); + + let values: Vec<_> = range.values().collect(); + + assert_eq!(21, values.len()); + + for (expected, value) in (-10..=10).zip(values) { + assert_eq!(expected, value); + } + assert_eq!(range.next(&5), Some(6)); + assert_eq!(range.next(&10), None); + assert_eq!(range.previous(&-10), None); + assert_eq!(range.previous(&10), Some(9)); + } + + #[test] + fn test_centric_coord() { + let coord = (0..10).into_segmented(); + + assert_eq!(coord.size(), 12); + for i in 0..=11 { + match coord.from_index(i as usize) { + Some(SegmentValue::Exact(value)) => assert_eq!(i, value), + Some(SegmentValue::Last) => assert_eq!(i, 11), + _ => panic!(), + } + } + + for (kps, idx) in coord.key_points(20).into_iter().zip(0..) { + match kps { + SegmentValue::CenterOf(value) if value <= 10 => assert_eq!(value, idx), + _ => panic!(), + } + } + + assert_eq!(coord.map(&SegmentValue::CenterOf(0), (0, 24)), 1); + assert_eq!(coord.map(&SegmentValue::Exact(0), (0, 24)), 0); + assert_eq!(coord.map(&SegmentValue::Exact(1), (0, 24)), 2); + } +} diff --git a/vendor/plotters/src/coord/ranged1d/mod.rs b/vendor/plotters/src/coord/ranged1d/mod.rs new file mode 100644 index 000000000..97664a2f0 --- /dev/null +++ b/vendor/plotters/src/coord/ranged1d/mod.rs @@ -0,0 +1,243 @@ +/*! + The one-dimensional coordinate system abstraction. + + Plotters build complex coordinate system with a combinator pattern and all the coordinate system is + built from the one dimensional coordinate system. This module defines the fundamental types used by + the one-dimensional coordinate system. + + The key trait for a one dimensional coordinate is [Ranged](trait.Ranged.html). This trait describes a + set of values which served as the 1D coordinate system in Plotters. In order to extend the coordinate system, + the new coordinate spec must implement this trait. + + The following example demonstrate how to make a customized coordinate specification + ``` +use plotters::coord::ranged1d::{Ranged, DefaultFormatting, KeyPointHint}; +use std::ops::Range; + +struct ZeroToOne; + +impl Ranged for ZeroToOne { + type ValueType = f64; + type FormatOption = DefaultFormatting; + + fn map(&self, &v: &f64, pixel_range: (i32, i32)) -> i32 { + let size = pixel_range.1 - pixel_range.0; + let v = v.min(1.0).max(0.0); + ((size as f64) * v).round() as i32 + } + + fn key_points<Hint:KeyPointHint>(&self, hint: Hint) -> Vec<f64> { + if hint.max_num_points() < 3 { + vec![] + } else { + vec![0.0, 0.5, 1.0] + } + } + + fn range(&self) -> Range<f64> { + 0.0..1.0 + } +} + +use plotters::prelude::*; + +let mut buffer = vec![0; 1024 * 768 * 3]; +let root = BitMapBackend::with_buffer(&mut buffer, (1024, 768)).into_drawing_area(); + +let chart = ChartBuilder::on(&root) + .build_cartesian_2d(ZeroToOne, ZeroToOne) + .unwrap(); + + ``` +*/ +use std::fmt::Debug; +use std::ops::Range; + +pub(super) mod combinators; +pub(super) mod types; + +mod discrete; +pub use discrete::{DiscreteRanged, IntoSegmentedCoord, SegmentValue, SegmentedCoord}; + +/// Since stable Rust doesn't have specialization, it's very hard to make our own trait that +/// automatically implemented the value formatter. This trait uses as a marker indicates if we +/// should automatically implement the default value formater based on it's `Debug` trait +pub trait DefaultValueFormatOption {} + +/// This makes the ranged coord uses the default `Debug` based formatting +pub struct DefaultFormatting; +impl DefaultValueFormatOption for DefaultFormatting {} + +/// This markers prevent Plotters to implement the default `Debug` based formatting +pub struct NoDefaultFormatting; +impl DefaultValueFormatOption for NoDefaultFormatting {} + +/// Determine how we can format a value in a coordinate system by default +pub trait ValueFormatter<V> { + /// Format the value + fn format(_value: &V) -> String { + panic!("Unimplemented formatting method"); + } + /// Determine how we can format a value in a coordinate system by default + fn format_ext(&self, value: &V) -> String { + Self::format(value) + } +} + +// By default the value is formatted by the debug trait +impl<R: Ranged<FormatOption = DefaultFormatting>> ValueFormatter<R::ValueType> for R +where + R::ValueType: Debug, +{ + fn format(value: &R::ValueType) -> String { + format!("{:?}", value) + } +} + +/// Specify the weight of key points. +pub enum KeyPointWeight { + /// Allows only bold key points + Bold, + /// Allows any key points + Any, +} + +impl KeyPointWeight { + /// Check if this key point weight setting allows light point + pub fn allow_light_points(&self) -> bool { + match self { + KeyPointWeight::Bold => false, + KeyPointWeight::Any => true, + } + } +} + +/// The trait for a hint provided to the key point algorithm used by the coordinate specs. +/// The most important constraint is the `max_num_points` which means the algorithm could emit no more than specific number of key points +/// `weight` is used to determine if this is used as a bold grid line or light grid line +/// `bold_points` returns the max number of coresponding bold grid lines +pub trait KeyPointHint { + /// Returns the max number of key points + fn max_num_points(&self) -> usize; + /// Returns the weight for this hint + fn weight(&self) -> KeyPointWeight; + /// Returns the point number constraint for the bold points + fn bold_points(&self) -> usize { + self.max_num_points() + } +} + +impl KeyPointHint for usize { + fn max_num_points(&self) -> usize { + *self + } + + fn weight(&self) -> KeyPointWeight { + KeyPointWeight::Any + } +} + +/// The key point hint indicates we only need key point for the bold grid lines +pub struct BoldPoints(pub usize); + +impl KeyPointHint for BoldPoints { + fn max_num_points(&self) -> usize { + self.0 + } + + fn weight(&self) -> KeyPointWeight { + KeyPointWeight::Bold + } +} + +/// The key point hint indicates that we are using the key points for the light grid lines +pub struct LightPoints { + bold_points_num: usize, + light_limit: usize, +} + +impl LightPoints { + /// Create a new light key point hind + pub fn new(bold_count: usize, requested: usize) -> Self { + Self { + bold_points_num: bold_count, + light_limit: requested, + } + } +} + +impl KeyPointHint for LightPoints { + fn max_num_points(&self) -> usize { + self.light_limit + } + + fn bold_points(&self) -> usize { + self.bold_points_num + } + + fn weight(&self) -> KeyPointWeight { + KeyPointWeight::Any + } +} + +/// The trait that indicates we have a ordered and ranged value +/// Which is used to describe any 1D axis. +pub trait Ranged { + /// This marker decides if Plotters default [ValueFormatter](trait.ValueFormatter.html) implementation should be used. + /// This associated type can be one of the following two types: + /// - [DefaultFormatting](struct.DefaultFormatting.html) will allow Plotters to automatically impl + /// the formatter based on `Debug` trait, if `Debug` trait is not impl for the `Self::Value`, + /// [ValueFormatter](trait.ValueFormatter.html) will not impl unless you impl it manually. + /// + /// - [NoDefaultFormatting](struct.NoDefaultFormatting.html) Disable the automatic `Debug` + /// based value formatting. Thus you have to impl the + /// [ValueFormatter](trait.ValueFormatter.html) manually. + /// + type FormatOption: DefaultValueFormatOption; + + /// The type of this value in this range specification + type ValueType; + + /// This function maps the value to i32, which is the drawing coordinate + fn map(&self, value: &Self::ValueType, limit: (i32, i32)) -> i32; + + /// This function gives the key points that we can draw a grid based on this + fn key_points<Hint: KeyPointHint>(&self, hint: Hint) -> Vec<Self::ValueType>; + + /// Get the range of this value + fn range(&self) -> Range<Self::ValueType>; + + /// This function provides the on-axis part of its range + #[allow(clippy::range_plus_one)] + fn axis_pixel_range(&self, limit: (i32, i32)) -> Range<i32> { + if limit.0 < limit.1 { + limit.0..limit.1 + } else { + limit.1..limit.0 + } + } +} + +/// The trait indicates the ranged value can be map reversely, which means +/// an pixel-based coordinate is given, it's possible to figure out the underlying +/// logic value. +pub trait ReversibleRanged: Ranged { + /// Perform the reverse mapping + fn unmap(&self, input: i32, limit: (i32, i32)) -> Option<Self::ValueType>; +} + +/// The trait for the type that can be converted into a ranged coordinate axis +pub trait AsRangedCoord: Sized { + /// Type to describe a coordinate system + type CoordDescType: Ranged<ValueType = Self::Value> + From<Self>; + /// Type for values in the given coordinate system + type Value; +} + +impl<T> AsRangedCoord for T +where + T: Ranged, +{ + type CoordDescType = T; + type Value = T::ValueType; +} diff --git a/vendor/plotters/src/coord/ranged1d/types/datetime.rs b/vendor/plotters/src/coord/ranged1d/types/datetime.rs new file mode 100644 index 000000000..9b12358c0 --- /dev/null +++ b/vendor/plotters/src/coord/ranged1d/types/datetime.rs @@ -0,0 +1,1171 @@ +/// The datetime coordinates +use chrono::{Date, DateTime, Datelike, Duration, NaiveDate, NaiveDateTime, TimeZone, Timelike}; +use std::ops::{Add, Range, Sub}; + +use crate::coord::ranged1d::{ + AsRangedCoord, DefaultFormatting, DiscreteRanged, KeyPointHint, NoDefaultFormatting, Ranged, + ValueFormatter, +}; + +/// The trait that describe some time value. This is the uniformed abstraction that works +/// for both Date, DateTime and Duration, etc. +pub trait TimeValue: Eq { + type DateType: Datelike + PartialOrd; + + /// Returns the date that is no later than the time + fn date_floor(&self) -> Self::DateType; + /// Returns the date that is no earlier than the time + fn date_ceil(&self) -> Self::DateType; + /// Returns the maximum value that is earlier than the given date + fn earliest_after_date(date: Self::DateType) -> Self; + /// Returns the duration between two time value + fn subtract(&self, other: &Self) -> Duration; + /// Instantiate a date type for current time value; + fn ymd(&self, year: i32, month: u32, date: u32) -> Self::DateType; + /// Cast current date type into this type + fn from_date(date: Self::DateType) -> Self; + + /// Map the coord spec + fn map_coord(value: &Self, begin: &Self, end: &Self, limit: (i32, i32)) -> i32 { + let total_span = end.subtract(begin); + let value_span = value.subtract(begin); + + // First, lets try the nanoseconds precision + if let Some(total_ns) = total_span.num_nanoseconds() { + if let Some(value_ns) = value_span.num_nanoseconds() { + return (f64::from(limit.1 - limit.0) * value_ns as f64 / total_ns as f64) as i32 + + limit.0; + } + } + + // Yes, converting them to floating point may lose precision, but this is Ok. + // If it overflows, it means we have a time span nearly 300 years, we are safe to ignore the + // portion less than 1 day. + let total_days = total_span.num_days() as f64; + let value_days = value_span.num_days() as f64; + + (f64::from(limit.1 - limit.0) * value_days / total_days) as i32 + limit.0 + } +} + +impl TimeValue for NaiveDate { + type DateType = NaiveDate; + fn date_floor(&self) -> NaiveDate { + *self + } + fn date_ceil(&self) -> NaiveDate { + *self + } + fn earliest_after_date(date: NaiveDate) -> Self { + date + } + fn subtract(&self, other: &NaiveDate) -> Duration { + *self - *other + } + + fn ymd(&self, year: i32, month: u32, date: u32) -> Self::DateType { + NaiveDate::from_ymd(year, month, date) + } + + fn from_date(date: Self::DateType) -> Self { + date + } +} + +impl<Z: TimeZone> TimeValue for Date<Z> { + type DateType = Date<Z>; + fn date_floor(&self) -> Date<Z> { + self.clone() + } + fn date_ceil(&self) -> Date<Z> { + self.clone() + } + fn earliest_after_date(date: Date<Z>) -> Self { + date + } + fn subtract(&self, other: &Date<Z>) -> Duration { + self.clone() - other.clone() + } + + fn ymd(&self, year: i32, month: u32, date: u32) -> Self::DateType { + self.timezone().ymd(year, month, date) + } + + fn from_date(date: Self::DateType) -> Self { + date + } +} + +impl<Z: TimeZone> TimeValue for DateTime<Z> { + type DateType = Date<Z>; + fn date_floor(&self) -> Date<Z> { + self.date() + } + fn date_ceil(&self) -> Date<Z> { + if self.time().num_seconds_from_midnight() > 0 { + self.date() + Duration::days(1) + } else { + self.date() + } + } + fn earliest_after_date(date: Date<Z>) -> DateTime<Z> { + date.and_hms(0, 0, 0) + } + + fn subtract(&self, other: &DateTime<Z>) -> Duration { + self.clone() - other.clone() + } + + fn ymd(&self, year: i32, month: u32, date: u32) -> Self::DateType { + self.timezone().ymd(year, month, date) + } + + fn from_date(date: Self::DateType) -> Self { + date.and_hms(0, 0, 0) + } +} + +impl TimeValue for NaiveDateTime { + type DateType = NaiveDate; + fn date_floor(&self) -> NaiveDate { + self.date() + } + fn date_ceil(&self) -> NaiveDate { + if self.time().num_seconds_from_midnight() > 0 { + self.date() + Duration::days(1) + } else { + self.date() + } + } + fn earliest_after_date(date: NaiveDate) -> NaiveDateTime { + date.and_hms(0, 0, 0) + } + + fn subtract(&self, other: &NaiveDateTime) -> Duration { + *self - *other + } + + fn ymd(&self, year: i32, month: u32, date: u32) -> Self::DateType { + NaiveDate::from_ymd(year, month, date) + } + + fn from_date(date: Self::DateType) -> Self { + date.and_hms(0, 0, 0) + } +} + +/// The ranged coordinate for date +#[derive(Clone)] +pub struct RangedDate<D: Datelike>(D, D); + +impl<D: Datelike> From<Range<D>> for RangedDate<D> { + fn from(range: Range<D>) -> Self { + Self(range.start, range.end) + } +} + +impl<D> Ranged for RangedDate<D> +where + D: Datelike + TimeValue + Sub<D, Output = Duration> + Add<Duration, Output = D> + Clone, +{ + type FormatOption = DefaultFormatting; + type ValueType = D; + + fn range(&self) -> Range<D> { + self.0.clone()..self.1.clone() + } + + fn map(&self, value: &Self::ValueType, limit: (i32, i32)) -> i32 { + TimeValue::map_coord(value, &self.0, &self.1, limit) + } + + fn key_points<HintType: KeyPointHint>(&self, hint: HintType) -> Vec<Self::ValueType> { + let max_points = hint.max_num_points(); + let mut ret = vec![]; + + let total_days = (self.1.clone() - self.0.clone()).num_days(); + let total_weeks = (self.1.clone() - self.0.clone()).num_weeks(); + + if total_days > 0 && total_days as usize <= max_points { + for day_idx in 0..=total_days { + ret.push(self.0.clone() + Duration::days(day_idx)); + } + return ret; + } + + if total_weeks > 0 && total_weeks as usize <= max_points { + for day_idx in 0..=total_weeks { + ret.push(self.0.clone() + Duration::weeks(day_idx)); + } + return ret; + } + + // When all data is in the same week, just plot properly. + if total_weeks == 0 { + ret.push(self.0.clone()); + return ret; + } + + let week_per_point = ((total_weeks as f64) / (max_points as f64)).ceil() as usize; + + for idx in 0..=(total_weeks as usize / week_per_point) { + ret.push(self.0.clone() + Duration::weeks((idx * week_per_point) as i64)); + } + + ret + } +} + +impl<D> DiscreteRanged for RangedDate<D> +where + D: Datelike + TimeValue + Sub<D, Output = Duration> + Add<Duration, Output = D> + Clone, +{ + fn size(&self) -> usize { + ((self.1.clone() - self.0.clone()).num_days().max(-1) + 1) as usize + } + + fn index_of(&self, value: &D) -> Option<usize> { + let ret = (value.clone() - self.0.clone()).num_days(); + if ret < 0 { + return None; + } + Some(ret as usize) + } + + fn from_index(&self, index: usize) -> Option<D> { + Some(self.0.clone() + Duration::days(index as i64)) + } +} + +impl<Z: TimeZone> AsRangedCoord for Range<Date<Z>> { + type CoordDescType = RangedDate<Date<Z>>; + type Value = Date<Z>; +} + +impl AsRangedCoord for Range<NaiveDate> { + type CoordDescType = RangedDate<NaiveDate>; + type Value = NaiveDate; +} + +/// Indicates the coord has a monthly resolution +/// +/// Note: since month doesn't have a constant duration. +/// We can't use a simple granularity to describe it. Thus we have +/// this axis decorator to make it yield monthly key-points. +#[derive(Clone)] +pub struct Monthly<T: TimeValue>(Range<T>); + +impl<T: TimeValue + Datelike + Clone> ValueFormatter<T> for Monthly<T> { + fn format(value: &T) -> String { + format!("{}-{}", value.year(), value.month()) + } +} + +impl<T: TimeValue + Clone> Monthly<T> { + fn bold_key_points<H: KeyPointHint>(&self, hint: &H) -> Vec<T> { + let max_points = hint.max_num_points(); + let start_date = self.0.start.date_ceil(); + let end_date = self.0.end.date_floor(); + + let mut start_year = start_date.year(); + let mut start_month = start_date.month(); + let start_day = start_date.day(); + + let end_year = end_date.year(); + let end_month = end_date.month(); + + if start_day != 1 { + start_month += 1; + if start_month == 13 { + start_month = 1; + start_year += 1; + } + } + + let total_month = (end_year - start_year) * 12 + end_month as i32 - start_month as i32; + + fn generate_key_points<T: TimeValue>( + mut start_year: i32, + mut start_month: i32, + end_year: i32, + end_month: i32, + step: u32, + builder: &T, + ) -> Vec<T> { + let mut ret = vec![]; + while end_year > start_year || (end_year == start_year && end_month >= start_month) { + ret.push(T::earliest_after_date(builder.ymd( + start_year, + start_month as u32, + 1, + ))); + start_month += step as i32; + + if start_month >= 13 { + start_year += start_month / 12; + start_month %= 12; + } + } + + ret + } + + if total_month as usize <= max_points { + // Monthly + return generate_key_points( + start_year, + start_month as i32, + end_year, + end_month as i32, + 1, + &self.0.start, + ); + } else if total_month as usize <= max_points * 3 { + // Quarterly + return generate_key_points( + start_year, + start_month as i32, + end_year, + end_month as i32, + 3, + &self.0.start, + ); + } else if total_month as usize <= max_points * 6 { + // Biyearly + return generate_key_points( + start_year, + start_month as i32, + end_year, + end_month as i32, + 6, + &self.0.start, + ); + } + + // Otherwise we could generate the yearly keypoints + generate_yearly_keypoints( + max_points, + start_year, + start_month, + end_year, + end_month, + &self.0.start, + ) + } +} + +impl<T: TimeValue + Clone> Ranged for Monthly<T> +where + Range<T>: AsRangedCoord<Value = T>, +{ + type FormatOption = NoDefaultFormatting; + type ValueType = T; + + fn range(&self) -> Range<T> { + self.0.start.clone()..self.0.end.clone() + } + + fn map(&self, value: &Self::ValueType, limit: (i32, i32)) -> i32 { + T::map_coord(value, &self.0.start, &self.0.end, limit) + } + + fn key_points<HintType: KeyPointHint>(&self, hint: HintType) -> Vec<Self::ValueType> { + if hint.weight().allow_light_points() && self.size() <= hint.bold_points() * 2 { + let coord: <Range<T> as AsRangedCoord>::CoordDescType = self.0.clone().into(); + let normal = coord.key_points(hint.max_num_points()); + return normal; + } + self.bold_key_points(&hint) + } +} + +impl<T: TimeValue + Clone> DiscreteRanged for Monthly<T> +where + Range<T>: AsRangedCoord<Value = T>, +{ + fn size(&self) -> usize { + let (start_year, start_month) = { + let ceil = self.0.start.date_ceil(); + (ceil.year(), ceil.month()) + }; + let (end_year, end_month) = { + let floor = self.0.end.date_floor(); + (floor.year(), floor.month()) + }; + ((end_year - start_year).max(0) * 12 + + (1 - start_month as i32) + + (end_month as i32 - 1) + + 1) + .max(0) as usize + } + + fn index_of(&self, value: &T) -> Option<usize> { + let this_year = value.date_floor().year(); + let this_month = value.date_floor().month(); + + let start_year = self.0.start.date_ceil().year(); + let start_month = self.0.start.date_ceil().month(); + + let ret = (this_year - start_year).max(0) * 12 + + (1 - start_month as i32) + + (this_month as i32 - 1); + if ret >= 0 { + return Some(ret as usize); + } + None + } + + fn from_index(&self, index: usize) -> Option<T> { + if index == 0 { + return Some(T::earliest_after_date(self.0.start.date_ceil())); + } + let index_from_start_year = index + (self.0.start.date_ceil().month() - 1) as usize; + let year = self.0.start.date_ceil().year() + index_from_start_year as i32 / 12; + let month = index_from_start_year % 12; + Some(T::earliest_after_date(self.0.start.ymd( + year, + month as u32 + 1, + 1, + ))) + } +} + +/// Indicate the coord has a yearly granularity. +#[derive(Clone)] +pub struct Yearly<T: TimeValue>(Range<T>); + +fn generate_yearly_keypoints<T: TimeValue>( + max_points: usize, + mut start_year: i32, + start_month: u32, + mut end_year: i32, + end_month: u32, + builder: &T, +) -> Vec<T> { + if start_month > end_month { + end_year -= 1; + } + + let mut exp10 = 1; + + while (end_year - start_year + 1) as usize / (exp10 * 10) > max_points { + exp10 *= 10; + } + + let mut freq = exp10; + + for try_freq in &[1, 2, 5, 10] { + freq = *try_freq * exp10; + if (end_year - start_year + 1) as usize / (exp10 * *try_freq) <= max_points { + break; + } + } + + let mut ret = vec![]; + + while start_year <= end_year { + ret.push(T::earliest_after_date(builder.ymd( + start_year, + start_month, + 1, + ))); + start_year += freq as i32; + } + + ret +} + +impl<T: TimeValue + Datelike + Clone> ValueFormatter<T> for Yearly<T> { + fn format(value: &T) -> String { + format!("{}-{}", value.year(), value.month()) + } +} + +impl<T: TimeValue + Clone> Ranged for Yearly<T> +where + Range<T>: AsRangedCoord<Value = T>, +{ + type FormatOption = NoDefaultFormatting; + type ValueType = T; + + fn range(&self) -> Range<T> { + self.0.start.clone()..self.0.end.clone() + } + + fn map(&self, value: &Self::ValueType, limit: (i32, i32)) -> i32 { + T::map_coord(value, &self.0.start, &self.0.end, limit) + } + + fn key_points<HintType: KeyPointHint>(&self, hint: HintType) -> Vec<Self::ValueType> { + if hint.weight().allow_light_points() && self.size() <= hint.bold_points() * 2 { + return Monthly(self.0.clone()).key_points(hint); + } + let max_points = hint.max_num_points(); + let start_date = self.0.start.date_ceil(); + let end_date = self.0.end.date_floor(); + + let mut start_year = start_date.year(); + let mut start_month = start_date.month(); + let start_day = start_date.day(); + + let end_year = end_date.year(); + let end_month = end_date.month(); + + if start_day != 1 { + start_month += 1; + if start_month == 13 { + start_month = 1; + start_year += 1; + } + } + + generate_yearly_keypoints( + max_points, + start_year, + start_month, + end_year, + end_month, + &self.0.start, + ) + } +} + +impl<T: TimeValue + Clone> DiscreteRanged for Yearly<T> +where + Range<T>: AsRangedCoord<Value = T>, +{ + fn size(&self) -> usize { + let year_start = self.0.start.date_ceil().year(); + let year_end = self.0.end.date_floor().year(); + ((year_end - year_start).max(-1) + 1) as usize + } + + fn index_of(&self, value: &T) -> Option<usize> { + let year_start = self.0.start.date_ceil().year(); + let year_value = value.date_floor().year(); + let ret = year_value - year_start; + if ret < 0 { + return None; + } + Some(ret as usize) + } + + fn from_index(&self, index: usize) -> Option<T> { + let year = self.0.start.date_ceil().year() + index as i32; + let ret = T::earliest_after_date(self.0.start.ymd(year, 1, 1)); + if ret.date_ceil() <= self.0.start.date_floor() { + return Some(self.0.start.clone()); + } + Some(ret) + } +} + +/// The trait that converts a normal date coord into a monthly one +pub trait IntoMonthly<T: TimeValue> { + /// Converts a normal date coord into a monthly one + fn monthly(self) -> Monthly<T>; +} + +/// The trait that converts a normal date coord into a yearly one +pub trait IntoYearly<T: TimeValue> { + /// Converts a normal date coord into a yearly one + fn yearly(self) -> Yearly<T>; +} + +impl<T: TimeValue> IntoMonthly<T> for Range<T> { + fn monthly(self) -> Monthly<T> { + Monthly(self) + } +} + +impl<T: TimeValue> IntoYearly<T> for Range<T> { + fn yearly(self) -> Yearly<T> { + Yearly(self) + } +} + +/// The ranged coordinate for the date and time +#[derive(Clone)] +pub struct RangedDateTime<DT: Datelike + Timelike + TimeValue>(DT, DT); + +impl<Z: TimeZone> AsRangedCoord for Range<DateTime<Z>> { + type CoordDescType = RangedDateTime<DateTime<Z>>; + type Value = DateTime<Z>; +} + +impl<Z: TimeZone> From<Range<DateTime<Z>>> for RangedDateTime<DateTime<Z>> { + fn from(range: Range<DateTime<Z>>) -> Self { + Self(range.start, range.end) + } +} + +impl From<Range<NaiveDateTime>> for RangedDateTime<NaiveDateTime> { + fn from(range: Range<NaiveDateTime>) -> Self { + Self(range.start, range.end) + } +} + +impl<DT> Ranged for RangedDateTime<DT> +where + DT: Datelike + Timelike + TimeValue + Clone + PartialOrd, + DT: Add<Duration, Output = DT>, + DT: Sub<DT, Output = Duration>, + RangedDate<DT::DateType>: Ranged<ValueType = DT::DateType>, +{ + type FormatOption = DefaultFormatting; + type ValueType = DT; + + fn range(&self) -> Range<DT> { + self.0.clone()..self.1.clone() + } + + fn map(&self, value: &Self::ValueType, limit: (i32, i32)) -> i32 { + TimeValue::map_coord(value, &self.0, &self.1, limit) + } + + fn key_points<HintType: KeyPointHint>(&self, hint: HintType) -> Vec<Self::ValueType> { + let max_points = hint.max_num_points(); + let total_span = self.1.clone() - self.0.clone(); + + if let Some(total_ns) = total_span.num_nanoseconds() { + if let Some(actual_ns_per_point) = + compute_period_per_point(total_ns as u64, max_points, true) + { + let start_time_ns = u64::from(self.0.num_seconds_from_midnight()) * 1_000_000_000 + + u64::from(self.0.nanosecond()); + + let mut start_time = DT::from_date(self.0.date_floor()) + + Duration::nanoseconds(if start_time_ns % actual_ns_per_point > 0 { + start_time_ns + (actual_ns_per_point - start_time_ns % actual_ns_per_point) + } else { + start_time_ns + } as i64); + + let mut ret = vec![]; + + while start_time < self.1 { + ret.push(start_time.clone()); + start_time = start_time + Duration::nanoseconds(actual_ns_per_point as i64); + } + + return ret; + } + } + + // Otherwise, it actually behaves like a date + let date_range = RangedDate(self.0.date_ceil(), self.1.date_floor()); + + date_range + .key_points(max_points) + .into_iter() + .map(DT::from_date) + .collect() + } +} + +/// The coordinate that for duration of time +#[derive(Clone)] +pub struct RangedDuration(Duration, Duration); + +impl AsRangedCoord for Range<Duration> { + type CoordDescType = RangedDuration; + type Value = Duration; +} + +impl From<Range<Duration>> for RangedDuration { + fn from(range: Range<Duration>) -> Self { + Self(range.start, range.end) + } +} + +impl Ranged for RangedDuration { + type FormatOption = DefaultFormatting; + type ValueType = Duration; + + fn range(&self) -> Range<Duration> { + self.0..self.1 + } + + fn map(&self, value: &Self::ValueType, limit: (i32, i32)) -> i32 { + let total_span = self.1 - self.0; + let value_span = *value - self.0; + + if let Some(total_ns) = total_span.num_nanoseconds() { + if let Some(value_ns) = value_span.num_nanoseconds() { + return limit.0 + + (f64::from(limit.1 - limit.0) * value_ns as f64 / total_ns as f64 + 1e-10) + as i32; + } + return limit.1; + } + + let total_days = total_span.num_days(); + let value_days = value_span.num_days(); + + limit.0 + + (f64::from(limit.1 - limit.0) * value_days as f64 / total_days as f64 + 1e-10) as i32 + } + + fn key_points<HintType: KeyPointHint>(&self, hint: HintType) -> Vec<Self::ValueType> { + let max_points = hint.max_num_points(); + let total_span = self.1 - self.0; + + if let Some(total_ns) = total_span.num_nanoseconds() { + if let Some(period) = compute_period_per_point(total_ns as u64, max_points, false) { + let mut start_ns = self.0.num_nanoseconds().unwrap(); + + if start_ns as u64 % period > 0 { + if start_ns > 0 { + start_ns += period as i64 - (start_ns % period as i64); + } else { + start_ns -= start_ns % period as i64; + } + } + + let mut current = Duration::nanoseconds(start_ns); + let mut ret = vec![]; + + while current < self.1 { + ret.push(current); + current = current + Duration::nanoseconds(period as i64); + } + + return ret; + } + } + + let begin_days = self.0.num_days(); + let end_days = self.1.num_days(); + + let mut days_per_tick = 1; + let mut idx = 0; + const MULTIPLIER: &[i32] = &[1, 2, 5]; + + while (end_days - begin_days) / i64::from(days_per_tick * MULTIPLIER[idx]) + > max_points as i64 + { + idx += 1; + if idx == MULTIPLIER.len() { + idx = 0; + days_per_tick *= 10; + } + } + + days_per_tick *= MULTIPLIER[idx]; + + let mut ret = vec![]; + + let mut current = Duration::days( + self.0.num_days() + + if Duration::days(self.0.num_days()) != self.0 { + 1 + } else { + 0 + }, + ); + + while current < self.1 { + ret.push(current); + current = current + Duration::days(i64::from(days_per_tick)); + } + + ret + } +} + +#[allow(clippy::inconsistent_digit_grouping)] +fn compute_period_per_point(total_ns: u64, max_points: usize, sub_daily: bool) -> Option<u64> { + let min_ns_per_point = total_ns as f64 / max_points as f64; + let actual_ns_per_point: u64 = (10u64).pow((min_ns_per_point as f64).log10().floor() as u32); + + fn determine_actual_ns_per_point( + total_ns: u64, + mut actual_ns_per_point: u64, + units: &[u64], + base: u64, + max_points: usize, + ) -> u64 { + let mut unit_per_point_idx = 0; + while total_ns / actual_ns_per_point > max_points as u64 * units[unit_per_point_idx] { + unit_per_point_idx += 1; + if unit_per_point_idx == units.len() { + unit_per_point_idx = 0; + actual_ns_per_point *= base; + } + } + units[unit_per_point_idx] * actual_ns_per_point + } + + if actual_ns_per_point < 1_000_000_000 { + Some(determine_actual_ns_per_point( + total_ns as u64, + actual_ns_per_point, + &[1, 2, 5], + 10, + max_points, + )) + } else if actual_ns_per_point < 3600_000_000_000 { + Some(determine_actual_ns_per_point( + total_ns as u64, + 1_000_000_000, + &[1, 2, 5, 10, 15, 20, 30], + 60, + max_points, + )) + } else if actual_ns_per_point < 3600_000_000_000 * 24 { + Some(determine_actual_ns_per_point( + total_ns as u64, + 3600_000_000_000, + &[1, 2, 4, 8, 12], + 24, + max_points, + )) + } else if !sub_daily { + if actual_ns_per_point < 3600_000_000_000 * 24 * 10 { + Some(determine_actual_ns_per_point( + total_ns as u64, + 3600_000_000_000 * 24, + &[1, 2, 5, 7], + 10, + max_points, + )) + } else { + Some(determine_actual_ns_per_point( + total_ns as u64, + 3600_000_000_000 * 24 * 10, + &[1, 2, 5], + 10, + max_points, + )) + } + } else { + None + } +} + +#[cfg(test)] +mod test { + use super::*; + use chrono::{TimeZone, Utc}; + + #[test] + fn test_date_range_long() { + let range = Utc.ymd(1000, 1, 1)..Utc.ymd(2999, 1, 1); + + let ranged_coord = Into::<RangedDate<_>>::into(range); + + assert_eq!(ranged_coord.map(&Utc.ymd(1000, 8, 10), (0, 100)), 0); + assert_eq!(ranged_coord.map(&Utc.ymd(2999, 8, 10), (0, 100)), 100); + + let kps = ranged_coord.key_points(23); + + assert!(kps.len() <= 23); + let max = kps + .iter() + .zip(kps.iter().skip(1)) + .map(|(p, n)| (*n - *p).num_days()) + .max() + .unwrap(); + let min = kps + .iter() + .zip(kps.iter().skip(1)) + .map(|(p, n)| (*n - *p).num_days()) + .min() + .unwrap(); + assert_eq!(max, min); + assert_eq!(max % 7, 0); + } + + #[test] + fn test_date_range_short() { + let range = Utc.ymd(2019, 1, 1)..Utc.ymd(2019, 1, 21); + let ranged_coord = Into::<RangedDate<_>>::into(range); + + let kps = ranged_coord.key_points(4); + + assert_eq!(kps.len(), 3); + + let max = kps + .iter() + .zip(kps.iter().skip(1)) + .map(|(p, n)| (*n - *p).num_days()) + .max() + .unwrap(); + let min = kps + .iter() + .zip(kps.iter().skip(1)) + .map(|(p, n)| (*n - *p).num_days()) + .min() + .unwrap(); + assert_eq!(max, min); + assert_eq!(max, 7); + + let kps = ranged_coord.key_points(30); + assert_eq!(kps.len(), 21); + let max = kps + .iter() + .zip(kps.iter().skip(1)) + .map(|(p, n)| (*n - *p).num_days()) + .max() + .unwrap(); + let min = kps + .iter() + .zip(kps.iter().skip(1)) + .map(|(p, n)| (*n - *p).num_days()) + .min() + .unwrap(); + assert_eq!(max, min); + assert_eq!(max, 1); + } + + #[test] + fn test_yearly_date_range() { + use crate::coord::ranged1d::BoldPoints; + let range = Utc.ymd(1000, 8, 5)..Utc.ymd(2999, 1, 1); + let ranged_coord = range.yearly(); + + assert_eq!(ranged_coord.map(&Utc.ymd(1000, 8, 10), (0, 100)), 0); + assert_eq!(ranged_coord.map(&Utc.ymd(2999, 8, 10), (0, 100)), 100); + + let kps = ranged_coord.key_points(23); + + assert!(kps.len() <= 23); + let max = kps + .iter() + .zip(kps.iter().skip(1)) + .map(|(p, n)| (*n - *p).num_days()) + .max() + .unwrap(); + let min = kps + .iter() + .zip(kps.iter().skip(1)) + .map(|(p, n)| (*n - *p).num_days()) + .min() + .unwrap(); + assert!(max != min); + + assert!(kps.into_iter().all(|x| x.month() == 9 && x.day() == 1)); + + let range = Utc.ymd(2019, 8, 5)..Utc.ymd(2020, 1, 1); + let ranged_coord = range.yearly(); + let kps = ranged_coord.key_points(BoldPoints(23)); + assert!(kps.len() == 1); + } + + #[test] + fn test_monthly_date_range() { + let range = Utc.ymd(2019, 8, 5)..Utc.ymd(2020, 9, 1); + let ranged_coord = range.monthly(); + + use crate::coord::ranged1d::BoldPoints; + + let kps = ranged_coord.key_points(BoldPoints(15)); + + assert!(kps.len() <= 15); + assert!(kps.iter().all(|x| x.day() == 1)); + assert!(kps.into_iter().any(|x| x.month() != 9)); + + let kps = ranged_coord.key_points(BoldPoints(5)); + assert!(kps.len() <= 5); + assert!(kps.iter().all(|x| x.day() == 1)); + let kps: Vec<_> = kps.into_iter().map(|x| x.month()).collect(); + assert_eq!(kps, vec![9, 12, 3, 6, 9]); + + // TODO: Investigate why max_point = 1 breaks the contract + let kps = ranged_coord.key_points(3); + assert!(kps.len() == 3); + assert!(kps.iter().all(|x| x.day() == 1)); + let kps: Vec<_> = kps.into_iter().map(|x| x.month()).collect(); + assert_eq!(kps, vec![9, 3, 9]); + } + + #[test] + fn test_datetime_long_range() { + let coord: RangedDateTime<_> = + (Utc.ymd(1000, 1, 1).and_hms(0, 0, 0)..Utc.ymd(3000, 1, 1).and_hms(0, 0, 0)).into(); + + assert_eq!( + coord.map(&Utc.ymd(1000, 1, 1).and_hms(0, 0, 0), (0, 100)), + 0 + ); + assert_eq!( + coord.map(&Utc.ymd(3000, 1, 1).and_hms(0, 0, 0), (0, 100)), + 100 + ); + + let kps = coord.key_points(23); + + assert!(kps.len() <= 23); + let max = kps + .iter() + .zip(kps.iter().skip(1)) + .map(|(p, n)| (*n - *p).num_seconds()) + .max() + .unwrap(); + let min = kps + .iter() + .zip(kps.iter().skip(1)) + .map(|(p, n)| (*n - *p).num_seconds()) + .min() + .unwrap(); + assert!(max == min); + assert!(max % (24 * 3600 * 7) == 0); + } + + #[test] + fn test_datetime_medium_range() { + let coord: RangedDateTime<_> = + (Utc.ymd(2019, 1, 1).and_hms(0, 0, 0)..Utc.ymd(2019, 1, 11).and_hms(0, 0, 0)).into(); + + let kps = coord.key_points(23); + + assert!(kps.len() <= 23); + let max = kps + .iter() + .zip(kps.iter().skip(1)) + .map(|(p, n)| (*n - *p).num_seconds()) + .max() + .unwrap(); + let min = kps + .iter() + .zip(kps.iter().skip(1)) + .map(|(p, n)| (*n - *p).num_seconds()) + .min() + .unwrap(); + assert!(max == min); + assert_eq!(max, 12 * 3600); + } + + #[test] + fn test_datetime_short_range() { + let coord: RangedDateTime<_> = + (Utc.ymd(2019, 1, 1).and_hms(0, 0, 0)..Utc.ymd(2019, 1, 2).and_hms(0, 0, 0)).into(); + + let kps = coord.key_points(50); + + assert!(kps.len() <= 50); + let max = kps + .iter() + .zip(kps.iter().skip(1)) + .map(|(p, n)| (*n - *p).num_seconds()) + .max() + .unwrap(); + let min = kps + .iter() + .zip(kps.iter().skip(1)) + .map(|(p, n)| (*n - *p).num_seconds()) + .min() + .unwrap(); + assert!(max == min); + assert_eq!(max, 1800); + } + + #[test] + fn test_datetime_nano_range() { + let start = Utc.ymd(2019, 1, 1).and_hms(0, 0, 0); + let end = start.clone() + Duration::nanoseconds(100); + let coord: RangedDateTime<_> = (start..end).into(); + + let kps = coord.key_points(50); + + assert!(kps.len() <= 50); + let max = kps + .iter() + .zip(kps.iter().skip(1)) + .map(|(p, n)| (*n - *p).num_nanoseconds().unwrap()) + .max() + .unwrap(); + let min = kps + .iter() + .zip(kps.iter().skip(1)) + .map(|(p, n)| (*n - *p).num_nanoseconds().unwrap()) + .min() + .unwrap(); + assert!(max == min); + assert_eq!(max, 2); + } + + #[test] + fn test_duration_long_range() { + let coord: RangedDuration = (Duration::days(-1000000)..Duration::days(1000000)).into(); + + assert_eq!(coord.map(&Duration::days(-1000000), (0, 100)), 0); + assert_eq!(coord.map(&Duration::days(1000000), (0, 100)), 100); + + let kps = coord.key_points(23); + + assert!(kps.len() <= 23); + let max = kps + .iter() + .zip(kps.iter().skip(1)) + .map(|(p, n)| (*n - *p).num_seconds()) + .max() + .unwrap(); + let min = kps + .iter() + .zip(kps.iter().skip(1)) + .map(|(p, n)| (*n - *p).num_seconds()) + .min() + .unwrap(); + assert!(max == min); + assert!(max % (24 * 3600 * 10000) == 0); + } + + #[test] + fn test_duration_daily_range() { + let coord: RangedDuration = (Duration::days(0)..Duration::hours(25)).into(); + + let kps = coord.key_points(23); + + assert!(kps.len() <= 23); + let max = kps + .iter() + .zip(kps.iter().skip(1)) + .map(|(p, n)| (*n - *p).num_seconds()) + .max() + .unwrap(); + let min = kps + .iter() + .zip(kps.iter().skip(1)) + .map(|(p, n)| (*n - *p).num_seconds()) + .min() + .unwrap(); + assert!(max == min); + assert_eq!(max, 3600 * 2); + } + + #[test] + fn test_date_discrete() { + let coord: RangedDate<Date<_>> = (Utc.ymd(2019, 1, 1)..Utc.ymd(2019, 12, 31)).into(); + assert_eq!(coord.size(), 365); + assert_eq!(coord.index_of(&Utc.ymd(2019, 2, 28)), Some(31 + 28 - 1)); + assert_eq!(coord.from_index(364), Some(Utc.ymd(2019, 12, 31))); + } + + #[test] + fn test_monthly_discrete() { + let coord1 = (Utc.ymd(2019, 1, 10)..Utc.ymd(2019, 12, 31)).monthly(); + let coord2 = (Utc.ymd(2019, 1, 10)..Utc.ymd(2020, 1, 1)).monthly(); + assert_eq!(coord1.size(), 12); + assert_eq!(coord2.size(), 13); + + for i in 1..=12 { + assert_eq!(coord1.from_index(i - 1).unwrap().month(), i as u32); + assert_eq!( + coord1.index_of(&coord1.from_index(i - 1).unwrap()).unwrap(), + i - 1 + ); + } + } + + #[test] + fn test_yearly_discrete() { + let coord1 = (Utc.ymd(2000, 1, 10)..Utc.ymd(2019, 12, 31)).yearly(); + assert_eq!(coord1.size(), 20); + + for i in 0..20 { + assert_eq!(coord1.from_index(i).unwrap().year(), 2000 + i as i32); + assert_eq!(coord1.index_of(&coord1.from_index(i).unwrap()).unwrap(), i); + } + } +} diff --git a/vendor/plotters/src/coord/ranged1d/types/mod.rs b/vendor/plotters/src/coord/ranged1d/types/mod.rs new file mode 100644 index 000000000..5a5ca4831 --- /dev/null +++ b/vendor/plotters/src/coord/ranged1d/types/mod.rs @@ -0,0 +1,15 @@ +#[cfg(feature = "chrono")] +mod datetime; +#[cfg(feature = "chrono")] +pub use datetime::{ + IntoMonthly, IntoYearly, Monthly, RangedDate, RangedDateTime, RangedDuration, Yearly, +}; + +mod numeric; +pub use numeric::{ + RangedCoordf32, RangedCoordf64, RangedCoordi128, RangedCoordi32, RangedCoordi64, + RangedCoordu128, RangedCoordu32, RangedCoordu64, RangedCoordusize, +}; + +mod slice; +pub use slice::RangedSlice; diff --git a/vendor/plotters/src/coord/ranged1d/types/numeric.rs b/vendor/plotters/src/coord/ranged1d/types/numeric.rs new file mode 100644 index 000000000..a4e7b2b61 --- /dev/null +++ b/vendor/plotters/src/coord/ranged1d/types/numeric.rs @@ -0,0 +1,453 @@ +use std::convert::TryFrom; +use std::ops::Range; + +use crate::coord::ranged1d::{ + AsRangedCoord, DefaultFormatting, DiscreteRanged, KeyPointHint, NoDefaultFormatting, Ranged, + ReversibleRanged, ValueFormatter, +}; + +macro_rules! impl_discrete_trait { + ($name:ident) => { + impl DiscreteRanged for $name { + fn size(&self) -> usize { + if &self.1 < &self.0 { + return 0; + } + let values = self.1 - self.0; + (values + 1) as usize + } + + fn index_of(&self, value: &Self::ValueType) -> Option<usize> { + if value < &self.0 { + return None; + } + let ret = value - self.0; + Some(ret as usize) + } + + fn from_index(&self, index: usize) -> Option<Self::ValueType> { + if let Ok(index) = Self::ValueType::try_from(index) { + return Some(self.0 + index); + } + None + } + } + }; +} + +macro_rules! impl_ranged_type_trait { + ($value:ty, $coord:ident) => { + impl AsRangedCoord for Range<$value> { + type CoordDescType = $coord; + type Value = $value; + } + }; +} +macro_rules! impl_reverse_mapping_trait { + ($type:ty, $name: ident) => { + impl ReversibleRanged for $name { + fn unmap(&self, p: i32, (min, max): (i32, i32)) -> Option<$type> { + if p < min.min(max) || p > max.max(min) || min == max { + return None; + } + + let logical_offset = f64::from(p - min) / f64::from(max - min); + + return Some(((self.1 - self.0) as f64 * logical_offset + self.0 as f64) as $type); + } + } + }; +} +macro_rules! make_numeric_coord { + ($type:ty, $name:ident, $key_points:ident, $doc: expr, $fmt: ident) => { + #[doc = $doc] + #[derive(Clone)] + pub struct $name($type, $type); + impl From<Range<$type>> for $name { + fn from(range: Range<$type>) -> Self { + return $name(range.start, range.end); + } + } + impl Ranged for $name { + type FormatOption = $fmt; + type ValueType = $type; + #[allow(clippy::float_cmp)] + fn map(&self, v: &$type, limit: (i32, i32)) -> i32 { + // Corner case: If we have a range that have only one value, + // then we just assign everything to the only point + if self.1 == self.0 { + return (limit.1 - limit.0) / 2; + } + + let logic_length = (*v as f64 - self.0 as f64) / (self.1 as f64 - self.0 as f64); + + let actual_length = limit.1 - limit.0; + + if actual_length == 0 { + return limit.1; + } + + if actual_length > 0 { + return limit.0 + (actual_length as f64 * logic_length + 1e-3).floor() as i32; + } else { + return limit.0 + (actual_length as f64 * logic_length - 1e-3).ceil() as i32; + } + } + fn key_points<Hint: KeyPointHint>(&self, hint: Hint) -> Vec<$type> { + $key_points((self.0, self.1), hint.max_num_points()) + } + fn range(&self) -> Range<$type> { + return self.0..self.1; + } + } + }; + ($type:ty, $name:ident, $key_points:ident, $doc: expr) => { + make_numeric_coord!($type, $name, $key_points, $doc, DefaultFormatting); + }; +} + +macro_rules! gen_key_points_comp { + (float, $name:ident, $type:ty) => { + fn $name(range: ($type, $type), max_points: usize) -> Vec<$type> { + if max_points == 0 { + return vec![]; + } + + let range = (range.0.min(range.1) as f64, range.1.max(range.0) as f64); + + assert!(!(range.0.is_nan() || range.1.is_nan())); + + if (range.0 - range.1).abs() < std::f64::EPSILON { + return vec![range.0 as $type]; + } + + let mut scale = (10f64).powf((range.1 - range.0).log(10.0).floor()); + // The value granularity controls how we round the values. + // To avoid generating key points like 1.00000000001, we round to the nearest multiple of the + // value granularity. + // By default, we make the granularity as the 1/10 of the scale. + let mut value_granularity = scale / 10.0; + fn rem_euclid(a: f64, b: f64) -> f64 { + let ret = if b > 0.0 { + a - (a / b).floor() * b + } else { + a - (a / b).ceil() * b + }; + if (ret - b).abs() < std::f64::EPSILON { + 0.0 + } else { + ret + } + } + + // At this point we need to make sure that the loop invariant: + // The scale must yield number of points than requested + if 1 + ((range.1 - range.0) / scale).floor() as usize > max_points { + scale *= 10.0; + value_granularity *= 10.0; + } + + 'outer: loop { + let old_scale = scale; + for nxt in [2.0, 5.0, 10.0].iter() { + let mut new_left = range.0 - rem_euclid(range.0, old_scale / nxt); + if new_left < range.0 { + new_left += old_scale / nxt; + } + let new_right = range.1 - rem_euclid(range.1, old_scale / nxt); + + let npoints = 1.0 + ((new_right - new_left) / old_scale * nxt); + + if npoints.round() as usize > max_points { + break 'outer; + } + + scale = old_scale / nxt; + } + scale = old_scale / 10.0; + value_granularity /= 10.0; + } + + let mut ret = vec![]; + // In some extreme cases, left might be too big, so that (left + scale) - left == 0 due to + // floating point error. + // In this case, we may loop forever. To avoid this, we need to use two variables to store + // the current left value. So we need keep a left_base and a left_relative. + let left = { + let mut value = range.0 - rem_euclid(range.0, scale); + if value < range.0 { + value += scale; + } + value + }; + let left_base = (left / value_granularity).floor() * value_granularity; + let mut left_relative = left - left_base; + let right = range.1 - rem_euclid(range.1, scale); + while (right - left_relative - left_base) >= -std::f64::EPSILON { + let new_left_relative = + (left_relative / value_granularity).round() * value_granularity; + if new_left_relative < 0.0 { + left_relative += value_granularity; + } + ret.push((left_relative + left_base) as $type); + left_relative += scale; + } + return ret; + } + }; + (integer, $name:ident, $type:ty) => { + fn $name(range: ($type, $type), max_points: usize) -> Vec<$type> { + let mut scale: $type = 1; + let range = (range.0.min(range.1), range.0.max(range.1)); + let range_size = range.1 as f64 - range.0 as f64; + 'outer: while (range_size / scale as f64).ceil() > max_points as f64 { + let next_scale = scale * 10; + for new_scale in [scale * 2, scale * 5, scale * 10].iter() { + scale = *new_scale; + if (range_size / *new_scale as f64).ceil() < max_points as f64 { + break 'outer; + } + } + scale = next_scale; + } + + let (mut left, right) = ( + range.0 + (scale - range.0 % scale) % scale, + range.1 - range.1 % scale, + ); + + let mut ret = vec![]; + while left <= right { + ret.push(left as $type); + if left < right { + left += scale; + } else { + break; + } + } + + return ret; + } + }; +} + +gen_key_points_comp!(float, compute_f32_key_points, f32); +gen_key_points_comp!(float, compute_f64_key_points, f64); +gen_key_points_comp!(integer, compute_i32_key_points, i32); +gen_key_points_comp!(integer, compute_u32_key_points, u32); +gen_key_points_comp!(integer, compute_i64_key_points, i64); +gen_key_points_comp!(integer, compute_u64_key_points, u64); +gen_key_points_comp!(integer, compute_i128_key_points, i128); +gen_key_points_comp!(integer, compute_u128_key_points, u128); +gen_key_points_comp!(integer, compute_isize_key_points, isize); +gen_key_points_comp!(integer, compute_usize_key_points, usize); + +make_numeric_coord!( + f32, + RangedCoordf32, + compute_f32_key_points, + "The ranged coordinate for type f32", + NoDefaultFormatting +); +impl_reverse_mapping_trait!(f32, RangedCoordf32); +impl ValueFormatter<f32> for RangedCoordf32 { + fn format(value: &f32) -> String { + crate::data::float::FloatPrettyPrinter { + allow_scientific: false, + min_decimal: 1, + max_decimal: 5, + } + .print(*value as f64) + } +} +make_numeric_coord!( + f64, + RangedCoordf64, + compute_f64_key_points, + "The ranged coordinate for type f64", + NoDefaultFormatting +); +impl_reverse_mapping_trait!(f64, RangedCoordf64); +impl ValueFormatter<f64> for RangedCoordf64 { + fn format(value: &f64) -> String { + crate::data::float::FloatPrettyPrinter { + allow_scientific: false, + min_decimal: 1, + max_decimal: 5, + } + .print(*value) + } +} +make_numeric_coord!( + u32, + RangedCoordu32, + compute_u32_key_points, + "The ranged coordinate for type u32" +); +make_numeric_coord!( + i32, + RangedCoordi32, + compute_i32_key_points, + "The ranged coordinate for type i32" +); +make_numeric_coord!( + u64, + RangedCoordu64, + compute_u64_key_points, + "The ranged coordinate for type u64" +); +make_numeric_coord!( + i64, + RangedCoordi64, + compute_i64_key_points, + "The ranged coordinate for type i64" +); +make_numeric_coord!( + u128, + RangedCoordu128, + compute_u128_key_points, + "The ranged coordinate for type u128" +); +make_numeric_coord!( + i128, + RangedCoordi128, + compute_i128_key_points, + "The ranged coordinate for type i128" +); +make_numeric_coord!( + usize, + RangedCoordusize, + compute_usize_key_points, + "The ranged coordinate for type usize" +); +make_numeric_coord!( + isize, + RangedCoordisize, + compute_isize_key_points, + "The ranged coordinate for type isize" +); + +impl_discrete_trait!(RangedCoordu32); +impl_discrete_trait!(RangedCoordi32); +impl_discrete_trait!(RangedCoordu64); +impl_discrete_trait!(RangedCoordi64); +impl_discrete_trait!(RangedCoordu128); +impl_discrete_trait!(RangedCoordi128); +impl_discrete_trait!(RangedCoordusize); +impl_discrete_trait!(RangedCoordisize); + +impl_ranged_type_trait!(f32, RangedCoordf32); +impl_ranged_type_trait!(f64, RangedCoordf64); +impl_ranged_type_trait!(i32, RangedCoordi32); +impl_ranged_type_trait!(u32, RangedCoordu32); +impl_ranged_type_trait!(i64, RangedCoordi64); +impl_ranged_type_trait!(u64, RangedCoordu64); +impl_ranged_type_trait!(i128, RangedCoordi128); +impl_ranged_type_trait!(u128, RangedCoordu128); +impl_ranged_type_trait!(isize, RangedCoordisize); +impl_ranged_type_trait!(usize, RangedCoordusize); + +#[cfg(test)] +mod test { + use super::*; + #[test] + fn test_key_points() { + let kp = compute_i32_key_points((0, 999), 28); + + assert!(kp.len() > 0); + assert!(kp.len() <= 28); + + let kp = compute_f64_key_points((-1.2, 1.2), 1); + assert!(kp.len() == 1); + + let kp = compute_f64_key_points((-1.2, 1.2), 0); + assert!(kp.len() == 0); + } + + #[test] + fn test_linear_coord_map() { + let coord: RangedCoordu32 = (0..20).into(); + assert_eq!(coord.key_points(11).len(), 11); + assert_eq!(coord.key_points(11)[0], 0); + assert_eq!(coord.key_points(11)[10], 20); + assert_eq!(coord.map(&5, (0, 100)), 25); + + let coord: RangedCoordf32 = (0f32..20f32).into(); + assert_eq!(coord.map(&5.0, (0, 100)), 25); + } + + #[test] + fn test_linear_coord_system() { + let _coord = + crate::coord::ranged2d::cartesian::Cartesian2d::<RangedCoordu32, RangedCoordu32>::new( + 0..10, + 0..10, + (0..1024, 0..768), + ); + } + + #[test] + fn test_coord_unmap() { + let coord: RangedCoordu32 = (0..20).into(); + let pos = coord.map(&5, (1000, 2000)); + let value = coord.unmap(pos, (1000, 2000)); + assert_eq!(value, Some(5)); + } + + #[test] + fn regression_test_issue_253_zero_sized_coord_not_hang() { + let coord: RangedCoordf32 = (0.0..0.0).into(); + let _points = coord.key_points(10); + } + + #[test] + fn test_small_coord() { + let coord: RangedCoordf64 = (0.0..1e-25).into(); + let points = coord.key_points(10); + assert!(points.len() > 0); + } + + #[test] + fn regression_test_issue_255_reverse_f32_coord_no_hang() { + let coord: RangedCoordf32 = (10.0..0.0).into(); + let _points = coord.key_points(10); + } + + #[test] + fn regession_test_issue_358_key_points_no_hang() { + let coord: RangedCoordf64 = (-200.0..801.0).into(); + let points = coord.key_points(500); + assert!(points.len() <= 500); + } + + #[test] + fn regression_test_issue_358_key_points_no_hang_2() { + let coord: RangedCoordf64 = (10000000000001f64..10000000000002f64).into(); + let points = coord.key_points(500); + assert!(points.len() <= 500); + } + + #[test] + fn test_coord_follows_hint() { + let coord: RangedCoordf64 = (1.0..2.0).into(); + let points = coord.key_points(6); + assert_eq!(points.len(), 6); + assert_eq!(points[0], 1.0); + let coord: RangedCoordf64 = (1.0..125.0).into(); + let points = coord.key_points(12); + assert_eq!(points.len(), 12); + let coord: RangedCoordf64 = (0.9995..1.0005).into(); + let points = coord.key_points(11); + assert_eq!(points.len(), 11); + let coord: RangedCoordf64 = (0.9995..1.0005).into(); + let points = coord.key_points(2); + assert!(points.len() <= 2); + } + + #[test] + fn regression_test_issue_304_intmax_keypoint_no_panic() { + let coord: RangedCoordu32 = (0..u32::MAX).into(); + let p = coord.key_points(10); + assert!(p.len() > 0 && p.len() <= 10); + } +} diff --git a/vendor/plotters/src/coord/ranged1d/types/slice.rs b/vendor/plotters/src/coord/ranged1d/types/slice.rs new file mode 100644 index 000000000..13be3d7f4 --- /dev/null +++ b/vendor/plotters/src/coord/ranged1d/types/slice.rs @@ -0,0 +1,100 @@ +use crate::coord::ranged1d::{ + AsRangedCoord, DefaultFormatting, DiscreteRanged, KeyPointHint, Ranged, +}; +use std::ops::Range; + +/// A range that is defined by a slice of values. +/// +/// Please note: the behavior of constructing an empty range may cause panic +#[derive(Clone)] +pub struct RangedSlice<'a, T: PartialEq>(&'a [T]); + +impl<'a, T: PartialEq> Ranged for RangedSlice<'a, T> { + type FormatOption = DefaultFormatting; + type ValueType = &'a T; + + fn range(&self) -> Range<&'a T> { + // If inner slice is empty, we should always panic + &self.0[0]..&self.0[self.0.len() - 1] + } + + fn map(&self, value: &Self::ValueType, limit: (i32, i32)) -> i32 { + match self.0.iter().position(|x| &x == value) { + Some(pos) => { + let pixel_span = limit.1 - limit.0; + let value_span = self.0.len() - 1; + (f64::from(limit.0) + + f64::from(pixel_span) + * (f64::from(pos as u32) / f64::from(value_span as u32))) + .round() as i32 + } + None => limit.0, + } + } + + fn key_points<Hint: KeyPointHint>(&self, hint: Hint) -> Vec<Self::ValueType> { + let max_points = hint.max_num_points(); + let mut ret = vec![]; + let intervals = (self.0.len() - 1) as f64; + let step = (intervals / max_points as f64 + 1.0) as usize; + for idx in (0..self.0.len()).step_by(step) { + ret.push(&self.0[idx]); + } + ret + } +} + +impl<'a, T: PartialEq> DiscreteRanged for RangedSlice<'a, T> { + fn size(&self) -> usize { + self.0.len() + } + + fn index_of(&self, value: &&'a T) -> Option<usize> { + self.0.iter().position(|x| &x == value) + } + + fn from_index(&self, index: usize) -> Option<&'a T> { + if self.0.len() <= index { + return None; + } + Some(&self.0[index]) + } +} + +impl<'a, T: PartialEq> From<&'a [T]> for RangedSlice<'a, T> { + fn from(range: &'a [T]) -> Self { + RangedSlice(range) + } +} + +impl<'a, T: PartialEq> AsRangedCoord for &'a [T] { + type CoordDescType = RangedSlice<'a, T>; + type Value = &'a T; +} + +#[cfg(test)] +mod test { + use super::*; + #[test] + fn test_slice_range() { + let my_slice = [1, 2, 3, 0, -1, -2]; + let slice_range: RangedSlice<i32> = my_slice[..].into(); + + assert_eq!(slice_range.range(), &1..&-2); + assert_eq!( + slice_range.key_points(6), + my_slice.iter().collect::<Vec<_>>() + ); + assert_eq!(slice_range.map(&&0, (0, 50)), 30); + } + + #[test] + fn test_slice_range_discrete() { + let my_slice = [1, 2, 3, 0, -1, -2]; + let slice_range: RangedSlice<i32> = my_slice[..].into(); + + assert_eq!(slice_range.size(), 6); + assert_eq!(slice_range.index_of(&&3), Some(2)); + assert_eq!(slice_range.from_index(2), Some(&3)); + } +} diff --git a/vendor/plotters/src/coord/ranged2d/cartesian.rs b/vendor/plotters/src/coord/ranged2d/cartesian.rs new file mode 100644 index 000000000..5052a62f1 --- /dev/null +++ b/vendor/plotters/src/coord/ranged2d/cartesian.rs @@ -0,0 +1,154 @@ +/*! + The 2-dimensional cartesian coordinate system. + + This module provides the 2D cartesian coordinate system, which is composed by two independent + ranged 1D coordinate sepcification. + + This types of coordinate system is used by the chart constructed with [ChartBuilder::build_cartesian_2d](../../chart/ChartBuilder.html#method.build_cartesian_2d). +*/ + +use crate::coord::ranged1d::{KeyPointHint, Ranged, ReversibleRanged}; +use crate::coord::{CoordTranslate, ReverseCoordTranslate}; + +use crate::style::ShapeStyle; +use plotters_backend::{BackendCoord, DrawingBackend, DrawingErrorKind}; + +use std::ops::Range; + +/// A 2D Cartesian coordinate system described by two 1D ranged coordinate specs. +#[derive(Clone)] +pub struct Cartesian2d<X: Ranged, Y: Ranged> { + logic_x: X, + logic_y: Y, + back_x: (i32, i32), + back_y: (i32, i32), +} + +impl<X: Ranged, Y: Ranged> Cartesian2d<X, Y> { + /// Create a new 2D cartesian coordinate system + /// - `logic_x` and `logic_y` : The description for the 1D coordinate system + /// - `actual`: The pixel range on the screen for this coordinate system + pub fn new<IntoX: Into<X>, IntoY: Into<Y>>( + logic_x: IntoX, + logic_y: IntoY, + actual: (Range<i32>, Range<i32>), + ) -> Self { + Self { + logic_x: logic_x.into(), + logic_y: logic_y.into(), + back_x: (actual.0.start, actual.0.end), + back_y: (actual.1.start, actual.1.end), + } + } + + /// Draw the mesh for the coordinate system + pub fn draw_mesh< + E, + DrawMesh: FnMut(MeshLine<X, Y>) -> Result<(), E>, + XH: KeyPointHint, + YH: KeyPointHint, + >( + &self, + h_limit: YH, + v_limit: XH, + mut draw_mesh: DrawMesh, + ) -> Result<(), E> { + let (xkp, ykp) = ( + self.logic_x.key_points(v_limit), + self.logic_y.key_points(h_limit), + ); + + for logic_x in xkp { + let x = self.logic_x.map(&logic_x, self.back_x); + draw_mesh(MeshLine::XMesh( + (x, self.back_y.0), + (x, self.back_y.1), + &logic_x, + ))?; + } + + for logic_y in ykp { + let y = self.logic_y.map(&logic_y, self.back_y); + draw_mesh(MeshLine::YMesh( + (self.back_x.0, y), + (self.back_x.1, y), + &logic_y, + ))?; + } + + Ok(()) + } + + /// Get the range of X axis + pub fn get_x_range(&self) -> Range<X::ValueType> { + self.logic_x.range() + } + + /// Get the range of Y axis + pub fn get_y_range(&self) -> Range<Y::ValueType> { + self.logic_y.range() + } + + /// Get the horizental backend coordinate range where X axis should be drawn + pub fn get_x_axis_pixel_range(&self) -> Range<i32> { + self.logic_x.axis_pixel_range(self.back_x) + } + + /// Get the vertical backend coordinate range where Y axis should be drawn + pub fn get_y_axis_pixel_range(&self) -> Range<i32> { + self.logic_y.axis_pixel_range(self.back_y) + } + + /// Get the 1D coordinate spec for X axis + pub fn x_spec(&self) -> &X { + &self.logic_x + } + + /// Get the 1D coordinate spec for Y axis + pub fn y_spec(&self) -> &Y { + &self.logic_y + } +} + +impl<X: Ranged, Y: Ranged> CoordTranslate for Cartesian2d<X, Y> { + type From = (X::ValueType, Y::ValueType); + + fn translate(&self, from: &Self::From) -> BackendCoord { + ( + self.logic_x.map(&from.0, self.back_x), + self.logic_y.map(&from.1, self.back_y), + ) + } +} + +impl<X: ReversibleRanged, Y: ReversibleRanged> ReverseCoordTranslate for Cartesian2d<X, Y> { + fn reverse_translate(&self, input: BackendCoord) -> Option<Self::From> { + Some(( + self.logic_x.unmap(input.0, self.back_x)?, + self.logic_y.unmap(input.1, self.back_y)?, + )) + } +} + +/// Represent a coordinate mesh for the two ranged value coordinate system +pub enum MeshLine<'a, X: Ranged, Y: Ranged> { + /// Used to plot the horizontal lines of the mesh + XMesh(BackendCoord, BackendCoord, &'a X::ValueType), + /// Used to plot the vertical lines of the mesh + YMesh(BackendCoord, BackendCoord, &'a Y::ValueType), +} + +impl<'a, X: Ranged, Y: Ranged> MeshLine<'a, X, Y> { + /// Draw a single mesh line onto the backend + pub fn draw<DB: DrawingBackend>( + &self, + backend: &mut DB, + style: &ShapeStyle, + ) -> Result<(), DrawingErrorKind<DB::ErrorType>> { + let (&left, &right) = match self { + MeshLine::XMesh(a, b, _) => (a, b), + MeshLine::YMesh(a, b, _) => (a, b), + }; + backend.draw_line(left, right, style) + } +} diff --git a/vendor/plotters/src/coord/ranged2d/mod.rs b/vendor/plotters/src/coord/ranged2d/mod.rs new file mode 100644 index 000000000..eae9425c2 --- /dev/null +++ b/vendor/plotters/src/coord/ranged2d/mod.rs @@ -0,0 +1 @@ +pub mod cartesian; diff --git a/vendor/plotters/src/coord/ranged3d/cartesian3d.rs b/vendor/plotters/src/coord/ranged3d/cartesian3d.rs new file mode 100644 index 000000000..8719680c5 --- /dev/null +++ b/vendor/plotters/src/coord/ranged3d/cartesian3d.rs @@ -0,0 +1,131 @@ +use super::{ProjectionMatrix, ProjectionMatrixBuilder}; +use crate::coord::ranged1d::Ranged; +use crate::coord::CoordTranslate; +use plotters_backend::BackendCoord; + +use std::ops::Range; + +/// A 3D cartesian coordinate system +#[derive(Clone)] +pub struct Cartesian3d<X: Ranged, Y: Ranged, Z: Ranged> { + pub(crate) logic_x: X, + pub(crate) logic_y: Y, + pub(crate) logic_z: Z, + coord_size: (i32, i32, i32), + projection: ProjectionMatrix, +} + +impl<X: Ranged, Y: Ranged, Z: Ranged> Cartesian3d<X, Y, Z> { + fn compute_default_size(actual_x: Range<i32>, actual_y: Range<i32>) -> i32 { + (actual_x.end - actual_x.start).min(actual_y.end - actual_y.start) * 4 / 5 + } + fn create_projection<F: FnOnce(ProjectionMatrixBuilder) -> ProjectionMatrix>( + actual_x: Range<i32>, + actual_y: Range<i32>, + coord_size: (i32, i32, i32), + f: F, + ) -> ProjectionMatrix { + let center_3d = (coord_size.0 / 2, coord_size.1 / 2, coord_size.2 / 2); + let center_2d = ( + (actual_x.end + actual_x.start) / 2, + (actual_y.end + actual_y.start) / 2, + ); + let mut pb = ProjectionMatrixBuilder::new(); + pb.set_pivot(center_3d, center_2d); + f(pb) + } + /// Creates a Cartesian3d object with the given projection. + pub fn with_projection< + SX: Into<X>, + SY: Into<Y>, + SZ: Into<Z>, + F: FnOnce(ProjectionMatrixBuilder) -> ProjectionMatrix, + >( + logic_x: SX, + logic_y: SY, + logic_z: SZ, + (actual_x, actual_y): (Range<i32>, Range<i32>), + build_projection_matrix: F, + ) -> Self { + let default_size = Self::compute_default_size(actual_x.clone(), actual_y.clone()); + let coord_size = (default_size, default_size, default_size); + Self { + logic_x: logic_x.into(), + logic_y: logic_y.into(), + logic_z: logic_z.into(), + coord_size, + projection: Self::create_projection( + actual_x, + actual_y, + coord_size, + build_projection_matrix, + ), + } + } + + /// Sets the pixel sizes and projections according to the given ranges. + pub fn set_coord_pixel_range( + &mut self, + actual_x: Range<i32>, + actual_y: Range<i32>, + coord_size: (i32, i32, i32), + ) -> &mut Self { + self.coord_size = coord_size; + self.projection = + Self::create_projection(actual_x, actual_y, coord_size, |pb| pb.into_matrix()); + self + } + + /// Set the projection matrix + pub fn set_projection<F: FnOnce(ProjectionMatrixBuilder) -> ProjectionMatrix>( + &mut self, + actual_x: Range<i32>, + actual_y: Range<i32>, + f: F, + ) -> &mut Self { + self.projection = Self::create_projection(actual_x, actual_y, self.coord_size, f); + self + } + + /// Create a new coordinate + pub fn new<SX: Into<X>, SY: Into<Y>, SZ: Into<Z>>( + logic_x: SX, + logic_y: SY, + logic_z: SZ, + (actual_x, actual_y): (Range<i32>, Range<i32>), + ) -> Self { + Self::with_projection(logic_x, logic_y, logic_z, (actual_x, actual_y), |pb| { + pb.into_matrix() + }) + } + /// Get the projection matrix + pub fn projection(&self) -> &ProjectionMatrix { + &self.projection + } + + /// Do not project, only transform the guest coordinate system + pub fn map_3d(&self, x: &X::ValueType, y: &Y::ValueType, z: &Z::ValueType) -> (i32, i32, i32) { + ( + self.logic_x.map(x, (0, self.coord_size.0)), + self.logic_y.map(y, (0, self.coord_size.1)), + self.logic_z.map(z, (0, self.coord_size.2)), + ) + } + + /// Get the depth of the projection + pub fn projected_depth(&self, x: &X::ValueType, y: &Y::ValueType, z: &Z::ValueType) -> i32 { + self.projection.projected_depth(self.map_3d(x, y, z)) + } +} + +impl<X: Ranged, Y: Ranged, Z: Ranged> CoordTranslate for Cartesian3d<X, Y, Z> { + type From = (X::ValueType, Y::ValueType, Z::ValueType); + fn translate(&self, coord: &Self::From) -> BackendCoord { + let pixel_coord_3d = self.map_3d(&coord.0, &coord.1, &coord.2); + self.projection * pixel_coord_3d + } + + fn depth(&self, coord: &Self::From) -> i32 { + self.projected_depth(&coord.0, &coord.1, &coord.2) + } +} diff --git a/vendor/plotters/src/coord/ranged3d/mod.rs b/vendor/plotters/src/coord/ranged3d/mod.rs new file mode 100644 index 000000000..274a70d8e --- /dev/null +++ b/vendor/plotters/src/coord/ranged3d/mod.rs @@ -0,0 +1,5 @@ +mod projection; +pub use projection::{ProjectionMatrix, ProjectionMatrixBuilder}; + +mod cartesian3d; +pub use cartesian3d::Cartesian3d; diff --git a/vendor/plotters/src/coord/ranged3d/projection.rs b/vendor/plotters/src/coord/ranged3d/projection.rs new file mode 100644 index 000000000..a9c57c1b3 --- /dev/null +++ b/vendor/plotters/src/coord/ranged3d/projection.rs @@ -0,0 +1,209 @@ +use std::f64::consts::PI; +use std::ops::Mul; + +/// The projection matrix which is used to project the 3D space to the 2D display panel +#[derive(Clone, Debug, Copy)] +pub struct ProjectionMatrix([[f64; 4]; 4]); + +impl AsRef<[[f64; 4]; 4]> for ProjectionMatrix { + fn as_ref(&self) -> &[[f64; 4]; 4] { + &self.0 + } +} + +impl AsMut<[[f64; 4]; 4]> for ProjectionMatrix { + fn as_mut(&mut self) -> &mut [[f64; 4]; 4] { + &mut self.0 + } +} + +impl From<[[f64; 4]; 4]> for ProjectionMatrix { + fn from(data: [[f64; 4]; 4]) -> Self { + ProjectionMatrix(data) + } +} + +impl Default for ProjectionMatrix { + fn default() -> Self { + ProjectionMatrix::rotate(PI, 0.0, 0.0) + } +} + +impl Mul<ProjectionMatrix> for ProjectionMatrix { + type Output = ProjectionMatrix; + fn mul(self, other: ProjectionMatrix) -> ProjectionMatrix { + let mut ret = ProjectionMatrix::zero(); + for r in 0..4 { + for c in 0..4 { + for k in 0..4 { + ret.0[r][c] += other.0[r][k] * self.0[k][c]; + } + } + } + ret.normalize(); + ret + } +} + +impl Mul<(i32, i32, i32)> for ProjectionMatrix { + type Output = (i32, i32); + fn mul(self, (x, y, z): (i32, i32, i32)) -> (i32, i32) { + let (x, y, z) = (x as f64, y as f64, z as f64); + let m = self.0; + ( + (x * m[0][0] + y * m[0][1] + z * m[0][2] + m[0][3]) as i32, + (x * m[1][0] + y * m[1][1] + z * m[1][2] + m[1][3]) as i32, + ) + } +} + +impl Mul<(f64, f64, f64)> for ProjectionMatrix { + type Output = (i32, i32); + fn mul(self, (x, y, z): (f64, f64, f64)) -> (i32, i32) { + let m = self.0; + ( + (x * m[0][0] + y * m[0][1] + z * m[0][2] + m[0][3]) as i32, + (x * m[1][0] + y * m[1][1] + z * m[1][2] + m[1][3]) as i32, + ) + } +} + +impl ProjectionMatrix { + /// Returns the identity matrix + pub fn one() -> Self { + ProjectionMatrix([ + [1.0, 0.0, 0.0, 0.0], + [0.0, 1.0, 0.0, 0.0], + [0.0, 0.0, 1.0, 0.0], + [0.0, 0.0, 0.0, 1.0], + ]) + } + /// Returns the zero maxtrix + pub fn zero() -> Self { + ProjectionMatrix([[0.0; 4]; 4]) + } + /// Returns the matrix which shift the coordinate + pub fn shift(x: f64, y: f64, z: f64) -> Self { + ProjectionMatrix([ + [1.0, 0.0, 0.0, x], + [0.0, 1.0, 0.0, y], + [0.0, 0.0, 1.0, z], + [0.0, 0.0, 0.0, 1.0], + ]) + } + /// Returns the matrix which rotates the coordinate + #[allow(clippy::many_single_char_names)] + pub fn rotate(x: f64, y: f64, z: f64) -> Self { + let (c, b, a) = (x, y, z); + ProjectionMatrix([ + [ + a.cos() * b.cos(), + a.cos() * b.sin() * c.sin() - a.sin() * c.cos(), + a.cos() * b.sin() * c.cos() + a.sin() * c.sin(), + 0.0, + ], + [ + a.sin() * b.cos(), + a.sin() * b.sin() * c.sin() + a.cos() * c.cos(), + a.sin() * b.sin() * c.cos() - a.cos() * c.sin(), + 0.0, + ], + [-b.sin(), b.cos() * c.sin(), b.cos() * c.cos(), 0.0], + [0.0, 0.0, 0.0, 1.0], + ]) + } + /// Returns the matrix that applies a scale factor + pub fn scale(factor: f64) -> Self { + ProjectionMatrix([ + [1.0, 0.0, 0.0, 0.0], + [0.0, 1.0, 0.0, 0.0], + [0.0, 0.0, 1.0, 0.0], + [0.0, 0.0, 0.0, 1.0 / factor], + ]) + } + /// Normalize the matrix, this will make the metric unit to 1 + pub fn normalize(&mut self) { + if self.0[3][3] > 1e-20 { + for r in 0..4 { + for c in 0..4 { + self.0[r][c] /= self.0[3][3]; + } + } + } + } + + /// Get the distance of the point in guest coordinate from the screen in pixels + pub fn projected_depth(&self, (x, y, z): (i32, i32, i32)) -> i32 { + let r = &self.0[2]; + (r[0] * x as f64 + r[1] * y as f64 + r[2] * z as f64 + r[3]) as i32 + } +} + +/// The helper struct to build a projection matrix +#[derive(Copy, Clone)] +pub struct ProjectionMatrixBuilder { + /// Specifies the yaw of the 3D coordinate system + pub yaw: f64, + /// Specifies the pitch of the 3D coordinate system + pub pitch: f64, + /// Specifies the scale of the 3D coordinate system + pub scale: f64, + pivot_before: (i32, i32, i32), + pivot_after: (i32, i32), +} + +impl Default for ProjectionMatrixBuilder { + fn default() -> Self { + Self { + yaw: 0.5, + pitch: 0.15, + scale: 1.0, + pivot_after: (0, 0), + pivot_before: (0, 0, 0), + } + } +} + +impl ProjectionMatrixBuilder { + /// Creates a new, default projection matrix builder object. + pub fn new() -> Self { + Self::default() + } + + /// Set the pivot point, which means the 3D coordinate "before" should be mapped into + /// the 2D coordinatet "after" + pub fn set_pivot(&mut self, before: (i32, i32, i32), after: (i32, i32)) -> &mut Self { + self.pivot_before = before; + self.pivot_after = after; + self + } + + /// Build the matrix based on the configuration + pub fn into_matrix(self) -> ProjectionMatrix { + let mut ret = if self.pivot_before == (0, 0, 0) { + ProjectionMatrix::default() + } else { + let (x, y, z) = self.pivot_before; + ProjectionMatrix::shift(-x as f64, -y as f64, -z as f64) * ProjectionMatrix::default() + }; + + if self.yaw.abs() > 1e-20 { + ret = ret * ProjectionMatrix::rotate(0.0, self.yaw, 0.0); + } + + if self.pitch.abs() > 1e-20 { + ret = ret * ProjectionMatrix::rotate(self.pitch, 0.0, 0.0); + } + + if (self.scale - 1.0).abs() > 1e-20 { + ret = ret * ProjectionMatrix::scale(self.scale); + } + + if self.pivot_after != (0, 0) { + let (x, y) = self.pivot_after; + ret = ret * ProjectionMatrix::shift(x as f64, y as f64, 0.0); + } + + ret + } +} diff --git a/vendor/plotters/src/coord/translate.rs b/vendor/plotters/src/coord/translate.rs new file mode 100644 index 000000000..222f948ac --- /dev/null +++ b/vendor/plotters/src/coord/translate.rs @@ -0,0 +1,38 @@ +use plotters_backend::BackendCoord; +use std::ops::Deref; + +/// The trait that translates some customized object to the backend coordinate +pub trait CoordTranslate { + /// Specifies the object to be translated from + type From; + + /// Translate the guest coordinate to the guest coordinate + fn translate(&self, from: &Self::From) -> BackendCoord; + + /// Get the Z-value of current coordinate + fn depth(&self, _from: &Self::From) -> i32 { + 0 + } +} + +impl<C, T> CoordTranslate for T +where + C: CoordTranslate, + T: Deref<Target = C>, +{ + type From = C::From; + fn translate(&self, from: &Self::From) -> BackendCoord { + self.deref().translate(from) + } +} + +/// The trait indicates that the coordinate system supports reverse transform +/// This is useful when we need an interactive plot, thus we need to map the event +/// from the backend coordinate to the logical coordinate +pub trait ReverseCoordTranslate: CoordTranslate { + /// Reverse translate the coordinate from the drawing coordinate to the + /// logic coordinate. + /// Note: the return value is an option, because it's possible that the drawing + /// coordinate isn't able to be represented in te guest coordinate system + fn reverse_translate(&self, input: BackendCoord) -> Option<Self::From>; +} diff --git a/vendor/plotters/src/data/data_range.rs b/vendor/plotters/src/data/data_range.rs new file mode 100644 index 000000000..445260b97 --- /dev/null +++ b/vendor/plotters/src/data/data_range.rs @@ -0,0 +1,42 @@ +use std::cmp::{Ordering, PartialOrd}; +use std::iter::IntoIterator; +use std::ops::Range; + +use num_traits::{One, Zero}; + +/// Build a range that fits the data +/// +/// - `iter`: the iterator over the data +/// - **returns** The resulting range +/// +/// ```rust +/// use plotters::data::fitting_range; +/// +/// let data = [4, 14, -2, 2, 5]; +/// let range = fitting_range(&data); +/// assert_eq!(range, std::ops::Range { start: -2, end: 14 }); +/// ``` +pub fn fitting_range<'a, T: 'a, I: IntoIterator<Item = &'a T>>(iter: I) -> Range<T> +where + T: Zero + One + PartialOrd + Clone, +{ + let (mut lb, mut ub) = (None, None); + + for value in iter.into_iter() { + if let Some(Ordering::Greater) = lb + .as_ref() + .map_or(Some(Ordering::Greater), |lbv: &T| lbv.partial_cmp(value)) + { + lb = Some(value.clone()); + } + + if let Some(Ordering::Less) = ub + .as_ref() + .map_or(Some(Ordering::Less), |ubv: &T| ubv.partial_cmp(value)) + { + ub = Some(value.clone()); + } + } + + lb.unwrap_or_else(Zero::zero)..ub.unwrap_or_else(One::one) +} diff --git a/vendor/plotters/src/data/float.rs b/vendor/plotters/src/data/float.rs new file mode 100644 index 000000000..febd330ea --- /dev/null +++ b/vendor/plotters/src/data/float.rs @@ -0,0 +1,145 @@ +// The code that is related to float number handling +fn find_minimal_repr(n: f64, eps: f64) -> (f64, usize) { + if eps >= 1.0 { + return (n, 0); + } + if n - n.floor() < eps { + (n.floor(), 0) + } else if n.ceil() - n < eps { + (n.ceil(), 0) + } else { + let (rem, pre) = find_minimal_repr((n - n.floor()) * 10.0, eps * 10.0); + (n.floor() + rem / 10.0, pre + 1) + } +} + +#[allow(clippy::never_loop)] +fn float_to_string(n: f64, max_precision: usize, min_decimal: usize) -> String { + let (mut result, mut count) = loop { + let (sign, n) = if n < 0.0 { ("-", -n) } else { ("", n) }; + let int_part = n.floor(); + + let dec_part = + ((n.abs() - int_part.abs()) * (10.0f64).powi(max_precision as i32)).round() as u64; + + if dec_part == 0 || max_precision == 0 { + break (format!("{}{:.0}", sign, int_part), 0); + } + + let mut leading = "".to_string(); + let mut dec_result = format!("{}", dec_part); + + for _ in 0..(max_precision - dec_result.len()) { + leading.push('0'); + } + + while let Some(c) = dec_result.pop() { + if c != '0' { + dec_result.push(c); + break; + } + } + + break ( + format!("{}{:.0}.{}{}", sign, int_part, leading, dec_result), + leading.len() + dec_result.len(), + ); + }; + + if count == 0 && min_decimal > 0 { + result.push('.'); + } + + while count < min_decimal { + result.push('0'); + count += 1; + } + result +} + +/// Handles printing of floating point numbers +pub struct FloatPrettyPrinter { + /// Whether scientific notation is allowed + pub allow_scientific: bool, + /// Minimum allowed number of decimal digits + pub min_decimal: i32, + /// Maximum allowed number of decimal digits + pub max_decimal: i32, +} + +impl FloatPrettyPrinter { + /// Handles printing of floating point numbers + pub fn print(&self, n: f64) -> String { + let (tn, p) = find_minimal_repr(n, (10f64).powi(-self.max_decimal)); + let d_repr = float_to_string(tn, p, self.min_decimal as usize); + if !self.allow_scientific { + d_repr + } else { + if n == 0.0 { + return "0".to_string(); + } + + let mut idx = n.abs().log10().floor(); + let mut exp = (10.0f64).powf(idx); + + if n.abs() / exp + 1e-5 >= 10.0 { + idx += 1.0; + exp *= 10.0; + } + + if idx.abs() < 3.0 { + return d_repr; + } + + let (sn, sp) = find_minimal_repr(n / exp, 1e-5); + let s_repr = format!( + "{}e{}", + float_to_string(sn, sp, self.min_decimal as usize), + float_to_string(idx, 0, 0) + ); + if s_repr.len() + 1 < d_repr.len() || (tn == 0.0 && n != 0.0) { + s_repr + } else { + d_repr + } + } + } +} + +/// The function that pretty prints the floating number +/// Since rust doesn't have anything that can format a float with out appearance, so we just +/// implement a float pretty printing function, which finds the shortest representation of a +/// floating point number within the allowed error range. +/// +/// - `n`: The float number to pretty-print +/// - `allow_sn`: Should we use scientific notation when possible +/// - **returns**: The pretty printed string +pub fn pretty_print_float(n: f64, allow_sn: bool) -> String { + (FloatPrettyPrinter { + allow_scientific: allow_sn, + min_decimal: 0, + max_decimal: 10, + }) + .print(n) +} + +#[cfg(test)] +mod test { + use super::*; + #[test] + fn test_pretty_printing() { + assert_eq!(pretty_print_float(0.99999999999999999999, false), "1"); + assert_eq!(pretty_print_float(0.9999, false), "0.9999"); + assert_eq!( + pretty_print_float(-1e-5 - 0.00000000000000001, true), + "-1e-5" + ); + assert_eq!( + pretty_print_float(-1e-5 - 0.00000000000000001, false), + "-0.00001" + ); + assert_eq!(pretty_print_float(1e100, true), "1e100"); + assert_eq!(pretty_print_float(1234567890f64, true), "1234567890"); + assert_eq!(pretty_print_float(1000000001f64, true), "1e9"); + } +} diff --git a/vendor/plotters/src/data/mod.rs b/vendor/plotters/src/data/mod.rs new file mode 100644 index 000000000..a6b903894 --- /dev/null +++ b/vendor/plotters/src/data/mod.rs @@ -0,0 +1,13 @@ +/*! +The data processing module, which implements algorithms related to visualization of data. +Such as, down-sampling, etc. +*/ + +mod data_range; +pub use data_range::fitting_range; + +mod quartiles; +pub use quartiles::Quartiles; + +/// Handles the printing of floating-point numbers. +pub mod float; diff --git a/vendor/plotters/src/data/quartiles.rs b/vendor/plotters/src/data/quartiles.rs new file mode 100644 index 000000000..054f51d1a --- /dev/null +++ b/vendor/plotters/src/data/quartiles.rs @@ -0,0 +1,127 @@ +/// The quartiles +#[derive(Clone, Debug)] +pub struct Quartiles { + lower_fence: f64, + lower: f64, + median: f64, + upper: f64, + upper_fence: f64, +} + +impl Quartiles { + // Extract a value representing the `pct` percentile of a + // sorted `s`, using linear interpolation. + fn percentile_of_sorted<T: Into<f64> + Copy>(s: &[T], pct: f64) -> f64 { + assert!(!s.is_empty()); + if s.len() == 1 { + return s[0].into(); + } + assert!(0_f64 <= pct); + let hundred = 100_f64; + assert!(pct <= hundred); + if (pct - hundred).abs() < std::f64::EPSILON { + return s[s.len() - 1].into(); + } + let length = (s.len() - 1) as f64; + let rank = (pct / hundred) * length; + let lower_rank = rank.floor(); + let d = rank - lower_rank; + let n = lower_rank as usize; + let lo = s[n].into(); + let hi = s[n + 1].into(); + lo + (hi - lo) * d + } + + /// Create a new quartiles struct with the values calculated from the argument. + /// + /// - `s`: The array of the original values + /// - **returns** The newly created quartiles + /// + /// ```rust + /// use plotters::prelude::*; + /// + /// let quartiles = Quartiles::new(&[7, 15, 36, 39, 40, 41]); + /// assert_eq!(quartiles.median(), 37.5); + /// ``` + pub fn new<T: Into<f64> + Copy + PartialOrd>(s: &[T]) -> Self { + let mut s = s.to_owned(); + s.sort_unstable_by(|a, b| a.partial_cmp(b).unwrap()); + + let lower = Quartiles::percentile_of_sorted(&s, 25_f64); + let median = Quartiles::percentile_of_sorted(&s, 50_f64); + let upper = Quartiles::percentile_of_sorted(&s, 75_f64); + let iqr = upper - lower; + let lower_fence = lower - 1.5 * iqr; + let upper_fence = upper + 1.5 * iqr; + Self { + lower_fence, + lower, + median, + upper, + upper_fence, + } + } + + /// Get the quartiles values. + /// + /// - **returns** The array [lower fence, lower quartile, median, upper quartile, upper fence] + /// + /// ```rust + /// use plotters::prelude::*; + /// + /// let quartiles = Quartiles::new(&[7, 15, 36, 39, 40, 41]); + /// let values = quartiles.values(); + /// assert_eq!(values, [-9.0, 20.25, 37.5, 39.75, 69.0]); + /// ``` + pub fn values(&self) -> [f32; 5] { + [ + self.lower_fence as f32, + self.lower as f32, + self.median as f32, + self.upper as f32, + self.upper_fence as f32, + ] + } + + /// Get the quartiles median. + /// + /// - **returns** The median + /// + /// ```rust + /// use plotters::prelude::*; + /// + /// let quartiles = Quartiles::new(&[7, 15, 36, 39, 40, 41]); + /// assert_eq!(quartiles.median(), 37.5); + /// ``` + pub fn median(&self) -> f64 { + self.median + } +} + +#[cfg(test)] +mod test { + use super::*; + + #[test] + #[should_panic] + fn test_empty_input() { + let empty_array: [i32; 0] = []; + Quartiles::new(&empty_array); + } + + #[test] + fn test_low_inputs() { + assert_eq!( + Quartiles::new(&[15.0]).values(), + [15.0, 15.0, 15.0, 15.0, 15.0] + ); + assert_eq!( + Quartiles::new(&[10, 20]).values(), + [5.0, 12.5, 15.0, 17.5, 25.0] + ); + assert_eq!( + Quartiles::new(&[10, 20, 30]).values(), + [0.0, 15.0, 20.0, 25.0, 40.0] + ); + } +} diff --git a/vendor/plotters/src/drawing/area.rs b/vendor/plotters/src/drawing/area.rs new file mode 100644 index 000000000..2e5c3fe39 --- /dev/null +++ b/vendor/plotters/src/drawing/area.rs @@ -0,0 +1,861 @@ +use crate::coord::cartesian::{Cartesian2d, MeshLine}; +use crate::coord::ranged1d::{KeyPointHint, Ranged}; +use crate::coord::{CoordTranslate, Shift}; +use crate::element::{CoordMapper, Drawable, PointCollection}; +use crate::style::text_anchor::{HPos, Pos, VPos}; +use crate::style::{Color, SizeDesc, TextStyle}; + +/// The abstraction of a drawing area +use plotters_backend::{BackendCoord, DrawingBackend, DrawingErrorKind}; + +use std::borrow::Borrow; +use std::cell::RefCell; +use std::error::Error; +use std::iter::{once, repeat}; +use std::ops::Range; +use std::rc::Rc; + +/// The representation of the rectangle in backend canvas +#[derive(Clone, Debug)] +pub struct Rect { + x0: i32, + y0: i32, + x1: i32, + y1: i32, +} + +impl Rect { + /// Split the rectangle into a few smaller rectangles + fn split<'a, BPI: IntoIterator<Item = &'a i32> + 'a>( + &'a self, + break_points: BPI, + vertical: bool, + ) -> impl Iterator<Item = Rect> + 'a { + let (mut x0, mut y0) = (self.x0, self.y0); + let (full_x, full_y) = (self.x1, self.y1); + break_points + .into_iter() + .chain(once(if vertical { &self.y1 } else { &self.x1 })) + .map(move |&p| { + let x1 = if vertical { full_x } else { p }; + let y1 = if vertical { p } else { full_y }; + let ret = Rect { x0, y0, x1, y1 }; + + if vertical { + y0 = y1 + } else { + x0 = x1; + } + + ret + }) + } + + /// Evenly split the rectangle to a row * col mesh + fn split_evenly(&self, (row, col): (usize, usize)) -> impl Iterator<Item = Rect> + '_ { + fn compute_evenly_split(from: i32, to: i32, n: usize, idx: usize) -> i32 { + let size = (to - from) as usize; + from + idx as i32 * (size / n) as i32 + idx.min(size % n) as i32 + } + (0..row) + .flat_map(move |x| repeat(x).zip(0..col)) + .map(move |(ri, ci)| Self { + y0: compute_evenly_split(self.y0, self.y1, row, ri), + y1: compute_evenly_split(self.y0, self.y1, row, ri + 1), + x0: compute_evenly_split(self.x0, self.x1, col, ci), + x1: compute_evenly_split(self.x0, self.x1, col, ci + 1), + }) + } + + /// Evenly the rectangle into a grid with arbitrary breaks; return a rect iterator. + fn split_grid( + &self, + x_breaks: impl Iterator<Item = i32>, + y_breaks: impl Iterator<Item = i32>, + ) -> impl Iterator<Item = Rect> { + let mut xs = vec![self.x0, self.x1]; + let mut ys = vec![self.y0, self.y1]; + xs.extend(x_breaks.map(|v| v + self.x0)); + ys.extend(y_breaks.map(|v| v + self.y0)); + + xs.sort_unstable(); + ys.sort_unstable(); + + let xsegs: Vec<_> = xs + .iter() + .zip(xs.iter().skip(1)) + .map(|(a, b)| (*a, *b)) + .collect(); + + // Justify: this is actually needed. Because we need to return a iterator that have + // static life time, thus we need to copy the value to a buffer and then turn the buffer + // into a iterator. + #[allow(clippy::needless_collect)] + let ysegs: Vec<_> = ys + .iter() + .zip(ys.iter().skip(1)) + .map(|(a, b)| (*a, *b)) + .collect(); + + ysegs + .into_iter() + .flat_map(move |(y0, y1)| { + xsegs + .clone() + .into_iter() + .map(move |(x0, x1)| Self { x0, y0, x1, y1 }) + }) + } + + /// Make the coordinate in the range of the rectangle + pub fn truncate(&self, p: (i32, i32)) -> (i32, i32) { + (p.0.min(self.x1).max(self.x0), p.1.min(self.y1).max(self.y0)) + } +} + +/// The abstraction of a drawing area. Plotters uses drawing area as the fundamental abstraction for the +/// high level drawing API. The major functionality provided by the drawing area is +/// 1. Layout specification - Split the parent drawing area into sub-drawing-areas +/// 2. Coordinate Translation - Allows guest coordinate system attached and used for drawing. +/// 3. Element based drawing - drawing area provides the environment the element can be drawn onto it. +pub struct DrawingArea<DB: DrawingBackend, CT: CoordTranslate> { + backend: Rc<RefCell<DB>>, + rect: Rect, + coord: CT, +} + +impl<DB: DrawingBackend, CT: CoordTranslate + Clone> Clone for DrawingArea<DB, CT> { + fn clone(&self) -> Self { + Self { + backend: self.backend.clone(), + rect: self.rect.clone(), + coord: self.coord.clone(), + } + } +} + +/// The error description of any drawing area API +#[derive(Debug)] +pub enum DrawingAreaErrorKind<E: Error + Send + Sync> { + /// The error is due to drawing backend failure + BackendError(DrawingErrorKind<E>), + /// We are not able to get the mutable reference of the backend, + /// which indicates the drawing backend is current used by other + /// drawing operation + SharingError, + /// The error caused by invalid layout + LayoutError, +} + +impl<E: Error + Send + Sync> std::fmt::Display for DrawingAreaErrorKind<E> { + fn fmt(&self, fmt: &mut std::fmt::Formatter) -> Result<(), std::fmt::Error> { + match self { + DrawingAreaErrorKind::BackendError(e) => write!(fmt, "backend error: {}", e), + DrawingAreaErrorKind::SharingError => { + write!(fmt, "Multiple backend operation in progress") + } + DrawingAreaErrorKind::LayoutError => write!(fmt, "Bad layout"), + } + } +} + +impl<E: Error + Send + Sync> Error for DrawingAreaErrorKind<E> {} + +#[allow(type_alias_bounds)] +type DrawingAreaError<T: DrawingBackend> = DrawingAreaErrorKind<T::ErrorType>; + +impl<DB: DrawingBackend> From<DB> for DrawingArea<DB, Shift> { + fn from(backend: DB) -> Self { + Self::with_rc_cell(Rc::new(RefCell::new(backend))) + } +} + +impl<'a, DB: DrawingBackend> From<&'a Rc<RefCell<DB>>> for DrawingArea<DB, Shift> { + fn from(backend: &'a Rc<RefCell<DB>>) -> Self { + Self::with_rc_cell(backend.clone()) + } +} + +/// A type which can be converted into a root drawing area +pub trait IntoDrawingArea: DrawingBackend + Sized { + /// Convert the type into a root drawing area + fn into_drawing_area(self) -> DrawingArea<Self, Shift>; +} + +impl<T: DrawingBackend> IntoDrawingArea for T { + fn into_drawing_area(self) -> DrawingArea<T, Shift> { + self.into() + } +} + +impl<DB: DrawingBackend, X: Ranged, Y: Ranged> DrawingArea<DB, Cartesian2d<X, Y>> { + /// Draw the mesh on a area + pub fn draw_mesh<DrawFunc, YH: KeyPointHint, XH: KeyPointHint>( + &self, + mut draw_func: DrawFunc, + y_count_max: YH, + x_count_max: XH, + ) -> Result<(), DrawingAreaErrorKind<DB::ErrorType>> + where + DrawFunc: FnMut(&mut DB, MeshLine<X, Y>) -> Result<(), DrawingErrorKind<DB::ErrorType>>, + { + self.backend_ops(move |b| { + self.coord + .draw_mesh(y_count_max, x_count_max, |line| draw_func(b, line)) + }) + } + + /// Get the range of X of the guest coordinate for current drawing area + pub fn get_x_range(&self) -> Range<X::ValueType> { + self.coord.get_x_range() + } + + /// Get the range of Y of the guest coordinate for current drawing area + pub fn get_y_range(&self) -> Range<Y::ValueType> { + self.coord.get_y_range() + } + + /// Get the range of X of the backend coordinate for current drawing area + pub fn get_x_axis_pixel_range(&self) -> Range<i32> { + self.coord.get_x_axis_pixel_range() + } + + /// Get the range of Y of the backend coordinate for current drawing area + pub fn get_y_axis_pixel_range(&self) -> Range<i32> { + self.coord.get_y_axis_pixel_range() + } +} + +impl<DB: DrawingBackend, CT: CoordTranslate> DrawingArea<DB, CT> { + /// Get the left upper conner of this area in the drawing backend + pub fn get_base_pixel(&self) -> BackendCoord { + (self.rect.x0, self.rect.y0) + } + + /// Strip the applied coordinate specification and returns a shift-based drawing area + pub fn strip_coord_spec(&self) -> DrawingArea<DB, Shift> { + DrawingArea { + rect: self.rect.clone(), + backend: self.backend.clone(), + coord: Shift((self.rect.x0, self.rect.y0)), + } + } + + /// Strip the applied coordinate specification and returns a drawing area + pub fn use_screen_coord(&self) -> DrawingArea<DB, Shift> { + DrawingArea { + rect: self.rect.clone(), + backend: self.backend.clone(), + coord: Shift((0, 0)), + } + } + + /// Get the area dimension in pixel + pub fn dim_in_pixel(&self) -> (u32, u32) { + ( + (self.rect.x1 - self.rect.x0) as u32, + (self.rect.y1 - self.rect.y0) as u32, + ) + } + + /// Compute the relative size based on the drawing area's height + pub fn relative_to_height(&self, p: f64) -> f64 { + f64::from((self.rect.y1 - self.rect.y0).max(0)) * (p.min(1.0).max(0.0)) + } + + /// Compute the relative size based on the drawing area's width + pub fn relative_to_width(&self, p: f64) -> f64 { + f64::from((self.rect.x1 - self.rect.x0).max(0)) * (p.min(1.0).max(0.0)) + } + + /// Get the pixel range of this area + pub fn get_pixel_range(&self) -> (Range<i32>, Range<i32>) { + (self.rect.x0..self.rect.x1, self.rect.y0..self.rect.y1) + } + + /// Perform operation on the drawing backend + fn backend_ops<R, O: FnOnce(&mut DB) -> Result<R, DrawingErrorKind<DB::ErrorType>>>( + &self, + ops: O, + ) -> Result<R, DrawingAreaError<DB>> { + if let Ok(mut db) = self.backend.try_borrow_mut() { + db.ensure_prepared() + .map_err(DrawingAreaErrorKind::BackendError)?; + ops(&mut db).map_err(DrawingAreaErrorKind::BackendError) + } else { + Err(DrawingAreaErrorKind::SharingError) + } + } + + /// Fill the entire drawing area with a color + pub fn fill<ColorType: Color>(&self, color: &ColorType) -> Result<(), DrawingAreaError<DB>> { + self.backend_ops(|backend| { + backend.draw_rect( + (self.rect.x0, self.rect.y0), + (self.rect.x1, self.rect.y1), + &color.to_backend_color(), + true, + ) + }) + } + + /// Draw a single pixel + pub fn draw_pixel<ColorType: Color>( + &self, + pos: CT::From, + color: &ColorType, + ) -> Result<(), DrawingAreaError<DB>> { + let pos = self.coord.translate(&pos); + self.backend_ops(|b| b.draw_pixel(pos, color.to_backend_color())) + } + + /// Present all the pending changes to the backend + pub fn present(&self) -> Result<(), DrawingAreaError<DB>> { + self.backend_ops(|b| b.present()) + } + + /// Draw an high-level element + pub fn draw<'a, E, B>(&self, element: &'a E) -> Result<(), DrawingAreaError<DB>> + where + B: CoordMapper, + &'a E: PointCollection<'a, CT::From, B>, + E: Drawable<DB, B>, + { + let backend_coords = element.point_iter().into_iter().map(|p| { + let b = p.borrow(); + B::map(&self.coord, b, &self.rect) + }); + self.backend_ops(move |b| element.draw(backend_coords, b, self.dim_in_pixel())) + } + + /// Map coordinate to the backend coordinate + pub fn map_coordinate(&self, coord: &CT::From) -> BackendCoord { + self.coord.translate(coord) + } + + /// Estimate the dimension of the text if drawn on this drawing area. + /// We can't get this directly from the font, since the drawing backend may or may not + /// follows the font configuration. In terminal, the font family will be dropped. + /// So the size of the text is drawing area related. + /// + /// - `text`: The text we want to estimate + /// - `font`: The font spec in which we want to draw the text + /// - **return**: The size of the text if drawn on this area + pub fn estimate_text_size( + &self, + text: &str, + style: &TextStyle, + ) -> Result<(u32, u32), DrawingAreaError<DB>> { + self.backend_ops(move |b| b.estimate_text_size(text, style)) + } +} + +impl<DB: DrawingBackend> DrawingArea<DB, Shift> { + fn with_rc_cell(backend: Rc<RefCell<DB>>) -> Self { + let (x1, y1) = RefCell::borrow(backend.borrow()).get_size(); + Self { + rect: Rect { + x0: 0, + y0: 0, + x1: x1 as i32, + y1: y1 as i32, + }, + backend, + coord: Shift((0, 0)), + } + } + + /// Shrink the region, note all the locations are in guest coordinate + pub fn shrink<A: SizeDesc, B: SizeDesc, C: SizeDesc, D: SizeDesc>( + mut self, + left_upper: (A, B), + dimension: (C, D), + ) -> DrawingArea<DB, Shift> { + let left_upper = (left_upper.0.in_pixels(&self), left_upper.1.in_pixels(&self)); + let dimension = (dimension.0.in_pixels(&self), dimension.1.in_pixels(&self)); + self.rect.x0 = self.rect.x1.min(self.rect.x0 + left_upper.0); + self.rect.y0 = self.rect.y1.min(self.rect.y0 + left_upper.1); + + self.rect.x1 = self.rect.x0.max(self.rect.x0 + dimension.0); + self.rect.y1 = self.rect.y0.max(self.rect.y0 + dimension.1); + + self.coord = Shift((self.rect.x0, self.rect.y0)); + + self + } + + /// Apply a new coord transformation object and returns a new drawing area + pub fn apply_coord_spec<CT: CoordTranslate>(&self, coord_spec: CT) -> DrawingArea<DB, CT> { + DrawingArea { + rect: self.rect.clone(), + backend: self.backend.clone(), + coord: coord_spec, + } + } + + /// Create a margin for the given drawing area and returns the new drawing area + pub fn margin<ST: SizeDesc, SB: SizeDesc, SL: SizeDesc, SR: SizeDesc>( + &self, + top: ST, + bottom: SB, + left: SL, + right: SR, + ) -> DrawingArea<DB, Shift> { + let left = left.in_pixels(self); + let right = right.in_pixels(self); + let top = top.in_pixels(self); + let bottom = bottom.in_pixels(self); + DrawingArea { + rect: Rect { + x0: self.rect.x0 + left, + y0: self.rect.y0 + top, + x1: self.rect.x1 - right, + y1: self.rect.y1 - bottom, + }, + backend: self.backend.clone(), + coord: Shift((self.rect.x0 + left, self.rect.y0 + top)), + } + } + + /// Split the drawing area vertically + pub fn split_vertically<S: SizeDesc>(&self, y: S) -> (Self, Self) { + let y = y.in_pixels(self); + let split_point = [y + self.rect.y0]; + let mut ret = self.rect.split(split_point.iter(), true).map(|rect| Self { + rect: rect.clone(), + backend: self.backend.clone(), + coord: Shift((rect.x0, rect.y0)), + }); + + (ret.next().unwrap(), ret.next().unwrap()) + } + + /// Split the drawing area horizontally + pub fn split_horizontally<S: SizeDesc>(&self, x: S) -> (Self, Self) { + let x = x.in_pixels(self); + let split_point = [x + self.rect.x0]; + let mut ret = self.rect.split(split_point.iter(), false).map(|rect| Self { + rect: rect.clone(), + backend: self.backend.clone(), + coord: Shift((rect.x0, rect.y0)), + }); + + (ret.next().unwrap(), ret.next().unwrap()) + } + + /// Split the drawing area evenly + pub fn split_evenly(&self, (row, col): (usize, usize)) -> Vec<Self> { + self.rect + .split_evenly((row, col)) + .map(|rect| Self { + rect: rect.clone(), + backend: self.backend.clone(), + coord: Shift((rect.x0, rect.y0)), + }) + .collect() + } + + /// Split the drawing area into a grid with specified breakpoints on both X axis and Y axis + pub fn split_by_breakpoints< + XSize: SizeDesc, + YSize: SizeDesc, + XS: AsRef<[XSize]>, + YS: AsRef<[YSize]>, + >( + &self, + xs: XS, + ys: YS, + ) -> Vec<Self> { + self.rect + .split_grid( + xs.as_ref().iter().map(|x| x.in_pixels(self)), + ys.as_ref().iter().map(|x| x.in_pixels(self)), + ) + .map(|rect| Self { + rect: rect.clone(), + backend: self.backend.clone(), + coord: Shift((rect.x0, rect.y0)), + }) + .collect() + } + + /// Draw a title of the drawing area and return the remaining drawing area + pub fn titled<'a, S: Into<TextStyle<'a>>>( + &self, + text: &str, + style: S, + ) -> Result<Self, DrawingAreaError<DB>> { + let style = style.into(); + + let x_padding = (self.rect.x1 - self.rect.x0) / 2; + + let (_, text_h) = self.estimate_text_size(text, &style)?; + let y_padding = (text_h / 2).min(5) as i32; + + let style = &style.pos(Pos::new(HPos::Center, VPos::Top)); + + self.backend_ops(|b| { + b.draw_text( + text, + style, + (self.rect.x0 + x_padding, self.rect.y0 + y_padding), + ) + })?; + + Ok(Self { + rect: Rect { + x0: self.rect.x0, + y0: self.rect.y0 + y_padding * 2 + text_h as i32, + x1: self.rect.x1, + y1: self.rect.y1, + }, + backend: self.backend.clone(), + coord: Shift((self.rect.x0, self.rect.y0 + y_padding * 2 + text_h as i32)), + }) + } + + /// Draw text on the drawing area + pub fn draw_text( + &self, + text: &str, + style: &TextStyle, + pos: BackendCoord, + ) -> Result<(), DrawingAreaError<DB>> { + self.backend_ops(|b| b.draw_text(text, style, (pos.0 + self.rect.x0, pos.1 + self.rect.y0))) + } +} + +impl<DB: DrawingBackend, CT: CoordTranslate> DrawingArea<DB, CT> { + /// Returns the coordinates by value + pub fn into_coord_spec(self) -> CT { + self.coord + } + + /// Returns the coordinates by reference + pub fn as_coord_spec(&self) -> &CT { + &self.coord + } + + /// Returns the coordinates by mutable reference + pub fn as_coord_spec_mut(&mut self) -> &mut CT { + &mut self.coord + } +} + +#[cfg(test)] +mod drawing_area_tests { + use crate::{create_mocked_drawing_area, prelude::*}; + #[test] + fn test_filling() { + let drawing_area = create_mocked_drawing_area(1024, 768, |m| { + m.check_draw_rect(|c, _, f, u, d| { + assert_eq!(c, WHITE.to_rgba()); + assert_eq!(f, true); + assert_eq!(u, (0, 0)); + assert_eq!(d, (1024, 768)); + }); + + m.drop_check(|b| { + assert_eq!(b.num_draw_rect_call, 1); + assert_eq!(b.draw_count, 1); + }); + }); + + drawing_area.fill(&WHITE).expect("Drawing Failure"); + } + + #[test] + fn test_split_evenly() { + let colors = vec![ + &RED, &BLUE, &YELLOW, &WHITE, &BLACK, &MAGENTA, &CYAN, &BLUE, &RED, + ]; + let drawing_area = create_mocked_drawing_area(902, 900, |m| { + for col in 0..3 { + for row in 0..3 { + let colors = colors.clone(); + m.check_draw_rect(move |c, _, f, u, d| { + assert_eq!(c, colors[col * 3 + row].to_rgba()); + assert_eq!(f, true); + assert_eq!(u, (300 * row as i32 + 2.min(row) as i32, 300 * col as i32)); + assert_eq!( + d, + ( + 300 + 300 * row as i32 + 2.min(row + 1) as i32, + 300 + 300 * col as i32 + ) + ); + }); + } + } + m.drop_check(|b| { + assert_eq!(b.num_draw_rect_call, 9); + assert_eq!(b.draw_count, 9); + }); + }); + + drawing_area + .split_evenly((3, 3)) + .iter_mut() + .zip(colors.iter()) + .for_each(|(d, c)| { + d.fill(*c).expect("Drawing Failure"); + }); + } + + #[test] + fn test_split_horizontally() { + let drawing_area = create_mocked_drawing_area(1024, 768, |m| { + m.check_draw_rect(|c, _, f, u, d| { + assert_eq!(c, RED.to_rgba()); + assert_eq!(f, true); + assert_eq!(u, (0, 0)); + assert_eq!(d, (345, 768)); + }); + + m.check_draw_rect(|c, _, f, u, d| { + assert_eq!(c, BLUE.to_rgba()); + assert_eq!(f, true); + assert_eq!(u, (345, 0)); + assert_eq!(d, (1024, 768)); + }); + + m.drop_check(|b| { + assert_eq!(b.num_draw_rect_call, 2); + assert_eq!(b.draw_count, 2); + }); + }); + + let (left, right) = drawing_area.split_horizontally(345); + left.fill(&RED).expect("Drawing Error"); + right.fill(&BLUE).expect("Drawing Error"); + } + + #[test] + fn test_split_vertically() { + let drawing_area = create_mocked_drawing_area(1024, 768, |m| { + m.check_draw_rect(|c, _, f, u, d| { + assert_eq!(c, RED.to_rgba()); + assert_eq!(f, true); + assert_eq!(u, (0, 0)); + assert_eq!(d, (1024, 345)); + }); + + m.check_draw_rect(|c, _, f, u, d| { + assert_eq!(c, BLUE.to_rgba()); + assert_eq!(f, true); + assert_eq!(u, (0, 345)); + assert_eq!(d, (1024, 768)); + }); + + m.drop_check(|b| { + assert_eq!(b.num_draw_rect_call, 2); + assert_eq!(b.draw_count, 2); + }); + }); + + let (left, right) = drawing_area.split_vertically(345); + left.fill(&RED).expect("Drawing Error"); + right.fill(&BLUE).expect("Drawing Error"); + } + + #[test] + fn test_split_grid() { + let colors = vec![ + &RED, &BLUE, &YELLOW, &WHITE, &BLACK, &MAGENTA, &CYAN, &BLUE, &RED, + ]; + let breaks: [i32; 5] = [100, 200, 300, 400, 500]; + + for nxb in 0..=5 { + for nyb in 0..=5 { + let drawing_area = create_mocked_drawing_area(1024, 768, |m| { + for row in 0..=nyb { + for col in 0..=nxb { + let get_bp = |full, limit, id| { + (if id == 0 { + 0 + } else if id > limit { + full + } else { + breaks[id as usize - 1] + }) as i32 + }; + + let expected_u = (get_bp(1024, nxb, col), get_bp(768, nyb, row)); + let expected_d = + (get_bp(1024, nxb, col + 1), get_bp(768, nyb, row + 1)); + let expected_color = + colors[(row * (nxb + 1) + col) as usize % colors.len()]; + + m.check_draw_rect(move |c, _, f, u, d| { + assert_eq!(c, expected_color.to_rgba()); + assert_eq!(f, true); + assert_eq!(u, expected_u); + assert_eq!(d, expected_d); + }); + } + } + + m.drop_check(move |b| { + assert_eq!(b.num_draw_rect_call, ((nxb + 1) * (nyb + 1)) as u32); + assert_eq!(b.draw_count, ((nyb + 1) * (nxb + 1)) as u32); + }); + }); + + let result = drawing_area + .split_by_breakpoints(&breaks[0..nxb as usize], &breaks[0..nyb as usize]); + for i in 0..result.len() { + result[i] + .fill(colors[i % colors.len()]) + .expect("Drawing Error"); + } + } + } + } + #[test] + fn test_titled() { + let drawing_area = create_mocked_drawing_area(1024, 768, |m| { + m.check_draw_text(|c, font, size, _pos, text| { + assert_eq!(c, BLACK.to_rgba()); + assert_eq!(font, "serif"); + assert_eq!(size, 30.0); + assert_eq!("This is the title", text); + }); + m.check_draw_rect(|c, _, f, u, d| { + assert_eq!(c, WHITE.to_rgba()); + assert_eq!(f, true); + assert_eq!(u.0, 0); + assert!(u.1 > 0); + assert_eq!(d, (1024, 768)); + }); + m.drop_check(|b| { + assert_eq!(b.num_draw_text_call, 1); + assert_eq!(b.num_draw_rect_call, 1); + assert_eq!(b.draw_count, 2); + }); + }); + + drawing_area + .titled("This is the title", ("serif", 30)) + .unwrap() + .fill(&WHITE) + .unwrap(); + } + + #[test] + fn test_margin() { + let drawing_area = create_mocked_drawing_area(1024, 768, |m| { + m.check_draw_rect(|c, _, f, u, d| { + assert_eq!(c, WHITE.to_rgba()); + assert_eq!(f, true); + assert_eq!(u, (3, 1)); + assert_eq!(d, (1024 - 4, 768 - 2)); + }); + + m.drop_check(|b| { + assert_eq!(b.num_draw_rect_call, 1); + assert_eq!(b.draw_count, 1); + }); + }); + + drawing_area + .margin(1, 2, 3, 4) + .fill(&WHITE) + .expect("Drawing Failure"); + } + + #[test] + fn test_ranges() { + let drawing_area = create_mocked_drawing_area(1024, 768, |_m| {}) + .apply_coord_spec(Cartesian2d::< + crate::coord::types::RangedCoordi32, + crate::coord::types::RangedCoordu32, + >::new(-100..100, 0..200, (0..1024, 0..768))); + + let x_range = drawing_area.get_x_range(); + assert_eq!(x_range, -100..100); + + let y_range = drawing_area.get_y_range(); + assert_eq!(y_range, 0..200); + } + + #[test] + fn test_relative_size() { + let drawing_area = create_mocked_drawing_area(1024, 768, |_m| {}); + + assert_eq!(102.4, drawing_area.relative_to_width(0.1)); + assert_eq!(384.0, drawing_area.relative_to_height(0.5)); + + assert_eq!(1024.0, drawing_area.relative_to_width(1.3)); + assert_eq!(768.0, drawing_area.relative_to_height(1.5)); + + assert_eq!(0.0, drawing_area.relative_to_width(-0.2)); + assert_eq!(0.0, drawing_area.relative_to_height(-0.5)); + } + + #[test] + fn test_relative_split() { + let drawing_area = create_mocked_drawing_area(1000, 1200, |m| { + let mut counter = 0; + m.check_draw_rect(move |c, _, f, u, d| { + assert_eq!(f, true); + + match counter { + 0 => { + assert_eq!(c, RED.to_rgba()); + assert_eq!(u, (0, 0)); + assert_eq!(d, (300, 600)); + } + 1 => { + assert_eq!(c, BLUE.to_rgba()); + assert_eq!(u, (300, 0)); + assert_eq!(d, (1000, 600)); + } + 2 => { + assert_eq!(c, GREEN.to_rgba()); + assert_eq!(u, (0, 600)); + assert_eq!(d, (300, 1200)); + } + 3 => { + assert_eq!(c, WHITE.to_rgba()); + assert_eq!(u, (300, 600)); + assert_eq!(d, (1000, 1200)); + } + _ => panic!("Too many draw rect"), + } + + counter += 1; + }); + + m.drop_check(|b| { + assert_eq!(b.num_draw_rect_call, 4); + assert_eq!(b.draw_count, 4); + }); + }); + + let split = + drawing_area.split_by_breakpoints([(30).percent_width()], [(50).percent_height()]); + + split[0].fill(&RED).unwrap(); + split[1].fill(&BLUE).unwrap(); + split[2].fill(&GREEN).unwrap(); + split[3].fill(&WHITE).unwrap(); + } + + #[test] + fn test_relative_shrink() { + let drawing_area = create_mocked_drawing_area(1000, 1200, |m| { + m.check_draw_rect(move |_, _, _, u, d| { + assert_eq!((100, 100), u); + assert_eq!((300, 700), d); + }); + + m.drop_check(|b| { + assert_eq!(b.num_draw_rect_call, 1); + assert_eq!(b.draw_count, 1); + }); + }) + .shrink(((10).percent_width(), 100), (200, (50).percent_height())); + + drawing_area.fill(&RED).unwrap(); + } +} diff --git a/vendor/plotters/src/drawing/backend_impl/mocked.rs b/vendor/plotters/src/drawing/backend_impl/mocked.rs new file mode 100644 index 000000000..7569e7322 --- /dev/null +++ b/vendor/plotters/src/drawing/backend_impl/mocked.rs @@ -0,0 +1,296 @@ +use crate::coord::Shift; +use crate::drawing::area::IntoDrawingArea; +use crate::drawing::DrawingArea; +use crate::style::RGBAColor; +use plotters_backend::{ + BackendColor, BackendCoord, BackendStyle, BackendTextStyle, DrawingBackend, DrawingErrorKind, +}; + +use std::collections::VecDeque; + +pub fn check_color(left: BackendColor, right: RGBAColor) { + assert_eq!( + RGBAColor(left.rgb.0, left.rgb.1, left.rgb.2, left.alpha), + right + ); +} + +pub struct MockedBackend { + height: u32, + width: u32, + init_count: u32, + pub draw_count: u32, + pub num_draw_pixel_call: u32, + pub num_draw_line_call: u32, + pub num_draw_rect_call: u32, + pub num_draw_circle_call: u32, + pub num_draw_text_call: u32, + pub num_draw_path_call: u32, + pub num_fill_polygon_call: u32, + check_draw_pixel: VecDeque<Box<dyn FnMut(RGBAColor, BackendCoord)>>, + check_draw_line: VecDeque<Box<dyn FnMut(RGBAColor, u32, BackendCoord, BackendCoord)>>, + check_draw_rect: VecDeque<Box<dyn FnMut(RGBAColor, u32, bool, BackendCoord, BackendCoord)>>, + check_draw_path: VecDeque<Box<dyn FnMut(RGBAColor, u32, Vec<BackendCoord>)>>, + check_draw_circle: VecDeque<Box<dyn FnMut(RGBAColor, u32, bool, BackendCoord, u32)>>, + check_draw_text: VecDeque<Box<dyn FnMut(RGBAColor, &str, f64, BackendCoord, &str)>>, + check_fill_polygon: VecDeque<Box<dyn FnMut(RGBAColor, Vec<BackendCoord>)>>, + drop_check: Option<Box<dyn FnMut(&Self)>>, +} + +macro_rules! def_set_checker_func { + (drop_check, $($param:ty),*) => { + pub fn drop_check<T: FnMut($($param,)*) + 'static>(&mut self, check:T) -> &mut Self { + self.drop_check = Some(Box::new(check)); + self + } + }; + ($name:ident, $($param:ty),*) => { + pub fn $name<T: FnMut($($param,)*) + 'static>(&mut self, check:T) -> &mut Self { + self.$name.push_back(Box::new(check)); + self + } + } +} + +impl MockedBackend { + pub fn new(width: u32, height: u32) -> Self { + MockedBackend { + height, + width, + init_count: 0, + draw_count: 0, + num_draw_pixel_call: 0, + num_draw_line_call: 0, + num_draw_rect_call: 0, + num_draw_circle_call: 0, + num_draw_text_call: 0, + num_draw_path_call: 0, + num_fill_polygon_call: 0, + check_draw_pixel: vec![].into(), + check_draw_line: vec![].into(), + check_draw_rect: vec![].into(), + check_draw_path: vec![].into(), + check_draw_circle: vec![].into(), + check_draw_text: vec![].into(), + check_fill_polygon: vec![].into(), + drop_check: None, + } + } + + def_set_checker_func!(check_draw_pixel, RGBAColor, BackendCoord); + def_set_checker_func!(check_draw_line, RGBAColor, u32, BackendCoord, BackendCoord); + def_set_checker_func!( + check_draw_rect, + RGBAColor, + u32, + bool, + BackendCoord, + BackendCoord + ); + def_set_checker_func!(check_draw_path, RGBAColor, u32, Vec<BackendCoord>); + def_set_checker_func!(check_draw_circle, RGBAColor, u32, bool, BackendCoord, u32); + def_set_checker_func!(check_draw_text, RGBAColor, &str, f64, BackendCoord, &str); + def_set_checker_func!(drop_check, &Self); + def_set_checker_func!(check_fill_polygon, RGBAColor, Vec<BackendCoord>); + + fn check_before_draw(&mut self) { + self.draw_count += 1; + //assert_eq!(self.init_count, self.draw_count); + } +} + +#[derive(Debug)] +pub struct MockedError; + +impl std::fmt::Display for MockedError { + fn fmt(&self, fmt: &mut std::fmt::Formatter) -> std::fmt::Result { + write!(fmt, "MockedError") + } +} + +impl std::error::Error for MockedError {} + +impl DrawingBackend for MockedBackend { + type ErrorType = MockedError; + + fn get_size(&self) -> (u32, u32) { + (self.width, self.height) + } + + fn ensure_prepared(&mut self) -> Result<(), DrawingErrorKind<MockedError>> { + self.init_count += 1; + Ok(()) + } + + fn present(&mut self) -> Result<(), DrawingErrorKind<MockedError>> { + self.init_count = 0; + self.draw_count = 0; + Ok(()) + } + + fn draw_pixel( + &mut self, + point: BackendCoord, + color: BackendColor, + ) -> Result<(), DrawingErrorKind<Self::ErrorType>> { + self.check_before_draw(); + self.num_draw_pixel_call += 1; + let color = RGBAColor(color.rgb.0, color.rgb.1, color.rgb.2, color.alpha); + if let Some(mut checker) = self.check_draw_pixel.pop_front() { + checker(color, point); + + if self.check_draw_pixel.is_empty() { + self.check_draw_pixel.push_back(checker); + } + } + Ok(()) + } + + fn draw_line<S: BackendStyle>( + &mut self, + from: BackendCoord, + to: BackendCoord, + style: &S, + ) -> Result<(), DrawingErrorKind<Self::ErrorType>> { + self.check_before_draw(); + self.num_draw_line_call += 1; + let color = style.color(); + let color = RGBAColor(color.rgb.0, color.rgb.1, color.rgb.2, color.alpha); + if let Some(mut checker) = self.check_draw_line.pop_front() { + checker(color, style.stroke_width(), from, to); + + if self.check_draw_line.is_empty() { + self.check_draw_line.push_back(checker); + } + } + Ok(()) + } + + fn draw_rect<S: BackendStyle>( + &mut self, + upper_left: BackendCoord, + bottom_right: BackendCoord, + style: &S, + fill: bool, + ) -> Result<(), DrawingErrorKind<Self::ErrorType>> { + self.check_before_draw(); + self.num_draw_rect_call += 1; + let color = style.color(); + let color = RGBAColor(color.rgb.0, color.rgb.1, color.rgb.2, color.alpha); + if let Some(mut checker) = self.check_draw_rect.pop_front() { + checker(color, style.stroke_width(), fill, upper_left, bottom_right); + + if self.check_draw_rect.is_empty() { + self.check_draw_rect.push_back(checker); + } + } + Ok(()) + } + + fn draw_path<S: BackendStyle, I: IntoIterator<Item = BackendCoord>>( + &mut self, + path: I, + style: &S, + ) -> Result<(), DrawingErrorKind<Self::ErrorType>> { + self.check_before_draw(); + self.num_draw_path_call += 1; + let color = style.color(); + let color = RGBAColor(color.rgb.0, color.rgb.1, color.rgb.2, color.alpha); + if let Some(mut checker) = self.check_draw_path.pop_front() { + checker(color, style.stroke_width(), path.into_iter().collect()); + + if self.check_draw_path.is_empty() { + self.check_draw_path.push_back(checker); + } + } + Ok(()) + } + + fn draw_circle<S: BackendStyle>( + &mut self, + center: BackendCoord, + radius: u32, + style: &S, + fill: bool, + ) -> Result<(), DrawingErrorKind<Self::ErrorType>> { + self.check_before_draw(); + self.num_draw_circle_call += 1; + let color = style.color(); + let color = RGBAColor(color.rgb.0, color.rgb.1, color.rgb.2, color.alpha); + if let Some(mut checker) = self.check_draw_circle.pop_front() { + checker(color, style.stroke_width(), fill, center, radius); + + if self.check_draw_circle.is_empty() { + self.check_draw_circle.push_back(checker); + } + } + Ok(()) + } + + fn fill_polygon<S: BackendStyle, I: IntoIterator<Item = BackendCoord>>( + &mut self, + path: I, + style: &S, + ) -> Result<(), DrawingErrorKind<Self::ErrorType>> { + self.check_before_draw(); + self.num_fill_polygon_call += 1; + let color = style.color(); + let color = RGBAColor(color.rgb.0, color.rgb.1, color.rgb.2, color.alpha); + if let Some(mut checker) = self.check_fill_polygon.pop_front() { + checker(color, path.into_iter().collect()); + + if self.check_fill_polygon.is_empty() { + self.check_fill_polygon.push_back(checker); + } + } + Ok(()) + } + + fn draw_text<S: BackendTextStyle>( + &mut self, + text: &str, + style: &S, + pos: BackendCoord, + ) -> Result<(), DrawingErrorKind<Self::ErrorType>> { + let color = style.color(); + let color = RGBAColor(color.rgb.0, color.rgb.1, color.rgb.2, color.alpha); + self.check_before_draw(); + self.num_draw_text_call += 1; + if let Some(mut checker) = self.check_draw_text.pop_front() { + checker(color, style.family().as_str(), style.size(), pos, text); + + if self.check_draw_text.is_empty() { + self.check_draw_text.push_back(checker); + } + } + Ok(()) + } +} + +impl Drop for MockedBackend { + fn drop(&mut self) { + // `self.drop_check` is typically a testing function; it can panic. + // The current `drop` call may be a part of stack unwinding caused + // by another panic. If so, we should never call it. + if std::thread::panicking() { + return; + } + + let mut temp = None; + std::mem::swap(&mut temp, &mut self.drop_check); + + if let Some(mut checker) = temp { + checker(self); + } + } +} + +pub fn create_mocked_drawing_area<F: FnOnce(&mut MockedBackend)>( + width: u32, + height: u32, + setup: F, +) -> DrawingArea<MockedBackend, Shift> { + let mut backend = MockedBackend::new(width, height); + setup(&mut backend); + backend.into_drawing_area() +} diff --git a/vendor/plotters/src/drawing/backend_impl/mod.rs b/vendor/plotters/src/drawing/backend_impl/mod.rs new file mode 100644 index 000000000..59daa8d6c --- /dev/null +++ b/vendor/plotters/src/drawing/backend_impl/mod.rs @@ -0,0 +1,16 @@ +#[cfg(test)] +mod mocked; +#[cfg(test)] +pub use mocked::{check_color, create_mocked_drawing_area, MockedBackend}; + +/// This is the dummy backend placeholder for the backend that never fails +#[derive(Debug)] +pub struct DummyBackendError; + +impl std::fmt::Display for DummyBackendError { + fn fmt(&self, fmt: &mut std::fmt::Formatter) -> std::fmt::Result { + write!(fmt, "{:?}", self) + } +} + +impl std::error::Error for DummyBackendError {} diff --git a/vendor/plotters/src/drawing/mod.rs b/vendor/plotters/src/drawing/mod.rs new file mode 100644 index 000000000..9e32d9132 --- /dev/null +++ b/vendor/plotters/src/drawing/mod.rs @@ -0,0 +1,18 @@ +/*! +The drawing utils for Plotters. In Plotters, we have two set of drawing APIs: low-level API and +high-level API. + +The low-level drawing abstraction, the module defines the `DrawingBackend` trait from the `plotters-backend` create. +It exposes a set of functions which allows basic shape, such as pixels, lines, rectangles, circles, to be drawn on the screen. +The low-level API uses the pixel based coordinate. + +The high-level API is built on the top of high-level API. The `DrawingArea` type exposes the high-level drawing API to the remianing part +of Plotters. The basic drawing blocks are composable elements, which can be defined in logic coordinate. To learn more details +about the [coordinate abstraction](../coord/index.html) and [element system](../element/index.html). +*/ +mod area; +mod backend_impl; + +pub use area::{DrawingArea, DrawingAreaErrorKind, IntoDrawingArea, Rect}; + +pub use backend_impl::*; diff --git a/vendor/plotters/src/element/basic_shapes.rs b/vendor/plotters/src/element/basic_shapes.rs new file mode 100644 index 000000000..7c0b9d4f5 --- /dev/null +++ b/vendor/plotters/src/element/basic_shapes.rs @@ -0,0 +1,358 @@ +use super::{Drawable, PointCollection}; +use crate::style::{Color, ShapeStyle, SizeDesc}; +use plotters_backend::{BackendCoord, DrawingBackend, DrawingErrorKind}; + +/** +An element representing a single pixel. + +See [`crate::element::EmptyElement`] for more information and examples. +*/ +pub struct Pixel<Coord> { + pos: Coord, + style: ShapeStyle, +} + +impl<Coord> Pixel<Coord> { + /** + Creates a new pixel. + + See [`crate::element::EmptyElement`] for more information and examples. + */ + pub fn new<P: Into<Coord>, S: Into<ShapeStyle>>(pos: P, style: S) -> Self { + Self { + pos: pos.into(), + style: style.into(), + } + } +} + +impl<'a, Coord> PointCollection<'a, Coord> for &'a Pixel<Coord> { + type Point = &'a Coord; + type IntoIter = std::iter::Once<&'a Coord>; + fn point_iter(self) -> Self::IntoIter { + std::iter::once(&self.pos) + } +} + +impl<Coord, DB: DrawingBackend> Drawable<DB> for Pixel<Coord> { + fn draw<I: Iterator<Item = BackendCoord>>( + &self, + mut points: I, + backend: &mut DB, + _: (u32, u32), + ) -> Result<(), DrawingErrorKind<DB::ErrorType>> { + if let Some((x, y)) = points.next() { + return backend.draw_pixel((x, y), self.style.color.to_backend_color()); + } + Ok(()) + } +} + +#[cfg(test)] +#[test] +fn test_pixel_element() { + use crate::prelude::*; + let da = crate::create_mocked_drawing_area(300, 300, |m| { + m.check_draw_pixel(|c, (x, y)| { + assert_eq!(x, 150); + assert_eq!(y, 152); + assert_eq!(c, RED.to_rgba()); + }); + + m.drop_check(|b| { + assert_eq!(b.num_draw_pixel_call, 1); + assert_eq!(b.draw_count, 1); + }); + }); + da.draw(&Pixel::new((150, 152), &RED)) + .expect("Drawing Failure"); +} + +/// This is a deprecated type. Please use new name [`PathElement`] instead. +#[deprecated(note = "Use new name PathElement instead")] +pub type Path<Coord> = PathElement<Coord>; + +/// An element of a series of connected lines +pub struct PathElement<Coord> { + points: Vec<Coord>, + style: ShapeStyle, +} +impl<Coord> PathElement<Coord> { + /// Create a new path + /// - `points`: The iterator of the points + /// - `style`: The shape style + /// - returns the created element + pub fn new<P: Into<Vec<Coord>>, S: Into<ShapeStyle>>(points: P, style: S) -> Self { + Self { + points: points.into(), + style: style.into(), + } + } +} + +impl<'a, Coord> PointCollection<'a, Coord> for &'a PathElement<Coord> { + type Point = &'a Coord; + type IntoIter = &'a [Coord]; + fn point_iter(self) -> &'a [Coord] { + &self.points + } +} + +impl<Coord, DB: DrawingBackend> Drawable<DB> for PathElement<Coord> { + fn draw<I: Iterator<Item = BackendCoord>>( + &self, + points: I, + backend: &mut DB, + _: (u32, u32), + ) -> Result<(), DrawingErrorKind<DB::ErrorType>> { + backend.draw_path(points, &self.style) + } +} + +#[cfg(test)] +#[test] +fn test_path_element() { + use crate::prelude::*; + let da = crate::create_mocked_drawing_area(300, 300, |m| { + m.check_draw_path(|c, s, path| { + assert_eq!(c, BLUE.to_rgba()); + assert_eq!(s, 5); + assert_eq!(path, vec![(100, 101), (105, 107), (150, 157)]); + }); + m.drop_check(|b| { + assert_eq!(b.num_draw_path_call, 1); + assert_eq!(b.draw_count, 1); + }); + }); + da.draw(&PathElement::new( + vec![(100, 101), (105, 107), (150, 157)], + Into::<ShapeStyle>::into(&BLUE).stroke_width(5), + )) + .expect("Drawing Failure"); +} + +/// A rectangle element +pub struct Rectangle<Coord> { + points: [Coord; 2], + style: ShapeStyle, + margin: (u32, u32, u32, u32), +} + +impl<Coord> Rectangle<Coord> { + /// Create a new path + /// - `points`: The left upper and right lower corner of the rectangle + /// - `style`: The shape style + /// - returns the created element + pub fn new<S: Into<ShapeStyle>>(points: [Coord; 2], style: S) -> Self { + Self { + points, + style: style.into(), + margin: (0, 0, 0, 0), + } + } + + /// Set the margin of the rectangle + /// - `t`: The top margin + /// - `b`: The bottom margin + /// - `l`: The left margin + /// - `r`: The right margin + pub fn set_margin(&mut self, t: u32, b: u32, l: u32, r: u32) -> &mut Self { + self.margin = (t, b, l, r); + self + } +} + +impl<'a, Coord> PointCollection<'a, Coord> for &'a Rectangle<Coord> { + type Point = &'a Coord; + type IntoIter = &'a [Coord]; + fn point_iter(self) -> &'a [Coord] { + &self.points + } +} + +impl<Coord, DB: DrawingBackend> Drawable<DB> for Rectangle<Coord> { + fn draw<I: Iterator<Item = BackendCoord>>( + &self, + mut points: I, + backend: &mut DB, + _: (u32, u32), + ) -> Result<(), DrawingErrorKind<DB::ErrorType>> { + match (points.next(), points.next()) { + (Some(a), Some(b)) => { + let (mut a, mut b) = ((a.0.min(b.0), a.1.min(b.1)), (a.0.max(b.0), a.1.max(b.1))); + a.1 += self.margin.0 as i32; + b.1 -= self.margin.1 as i32; + a.0 += self.margin.2 as i32; + b.0 -= self.margin.3 as i32; + backend.draw_rect(a, b, &self.style, self.style.filled) + } + _ => Ok(()), + } + } +} + +#[cfg(test)] +#[test] +fn test_rect_element() { + use crate::prelude::*; + { + let da = crate::create_mocked_drawing_area(300, 300, |m| { + m.check_draw_rect(|c, s, f, u, d| { + assert_eq!(c, BLUE.to_rgba()); + assert_eq!(f, false); + assert_eq!(s, 5); + assert_eq!([u, d], [(100, 101), (105, 107)]); + }); + m.drop_check(|b| { + assert_eq!(b.num_draw_rect_call, 1); + assert_eq!(b.draw_count, 1); + }); + }); + da.draw(&Rectangle::new( + [(100, 101), (105, 107)], + Color::stroke_width(&BLUE, 5), + )) + .expect("Drawing Failure"); + } + + { + let da = crate::create_mocked_drawing_area(300, 300, |m| { + m.check_draw_rect(|c, _, f, u, d| { + assert_eq!(c, BLUE.to_rgba()); + assert_eq!(f, true); + assert_eq!([u, d], [(100, 101), (105, 107)]); + }); + m.drop_check(|b| { + assert_eq!(b.num_draw_rect_call, 1); + assert_eq!(b.draw_count, 1); + }); + }); + da.draw(&Rectangle::new([(100, 101), (105, 107)], BLUE.filled())) + .expect("Drawing Failure"); + } +} + +/// A circle element +pub struct Circle<Coord, Size: SizeDesc> { + center: Coord, + size: Size, + style: ShapeStyle, +} + +impl<Coord, Size: SizeDesc> Circle<Coord, Size> { + /// Create a new circle element + /// - `coord` The center of the circle + /// - `size` The radius of the circle + /// - `style` The style of the circle + /// - Return: The newly created circle element + pub fn new<S: Into<ShapeStyle>>(coord: Coord, size: Size, style: S) -> Self { + Self { + center: coord, + size, + style: style.into(), + } + } +} + +impl<'a, Coord, Size: SizeDesc> PointCollection<'a, Coord> for &'a Circle<Coord, Size> { + type Point = &'a Coord; + type IntoIter = std::iter::Once<&'a Coord>; + fn point_iter(self) -> std::iter::Once<&'a Coord> { + std::iter::once(&self.center) + } +} + +impl<Coord, DB: DrawingBackend, Size: SizeDesc> Drawable<DB> for Circle<Coord, Size> { + fn draw<I: Iterator<Item = BackendCoord>>( + &self, + mut points: I, + backend: &mut DB, + ps: (u32, u32), + ) -> Result<(), DrawingErrorKind<DB::ErrorType>> { + if let Some((x, y)) = points.next() { + let size = self.size.in_pixels(&ps).max(0) as u32; + return backend.draw_circle((x, y), size, &self.style, self.style.filled); + } + Ok(()) + } +} + +#[cfg(test)] +#[test] +fn test_circle_element() { + use crate::prelude::*; + let da = crate::create_mocked_drawing_area(300, 300, |m| { + m.check_draw_circle(|c, _, f, s, r| { + assert_eq!(c, BLUE.to_rgba()); + assert_eq!(f, false); + assert_eq!(s, (150, 151)); + assert_eq!(r, 20); + }); + m.drop_check(|b| { + assert_eq!(b.num_draw_circle_call, 1); + assert_eq!(b.draw_count, 1); + }); + }); + da.draw(&Circle::new((150, 151), 20, &BLUE)) + .expect("Drawing Failure"); +} + +/// An element of a filled polygon +pub struct Polygon<Coord> { + points: Vec<Coord>, + style: ShapeStyle, +} +impl<Coord> Polygon<Coord> { + /// Create a new polygon + /// - `points`: The iterator of the points + /// - `style`: The shape style + /// - returns the created element + pub fn new<P: Into<Vec<Coord>>, S: Into<ShapeStyle>>(points: P, style: S) -> Self { + Self { + points: points.into(), + style: style.into(), + } + } +} + +impl<'a, Coord> PointCollection<'a, Coord> for &'a Polygon<Coord> { + type Point = &'a Coord; + type IntoIter = &'a [Coord]; + fn point_iter(self) -> &'a [Coord] { + &self.points + } +} + +impl<Coord, DB: DrawingBackend> Drawable<DB> for Polygon<Coord> { + fn draw<I: Iterator<Item = BackendCoord>>( + &self, + points: I, + backend: &mut DB, + _: (u32, u32), + ) -> Result<(), DrawingErrorKind<DB::ErrorType>> { + backend.fill_polygon(points, &self.style.color.to_backend_color()) + } +} + +#[cfg(test)] +#[test] +fn test_polygon_element() { + use crate::prelude::*; + let points = vec![(100, 100), (50, 500), (300, 400), (200, 300), (550, 200)]; + let expected_points = points.clone(); + + let da = crate::create_mocked_drawing_area(800, 800, |m| { + m.check_fill_polygon(move |c, p| { + assert_eq!(c, BLUE.to_rgba()); + assert_eq!(expected_points.len(), p.len()); + assert_eq!(expected_points, p); + }); + m.drop_check(|b| { + assert_eq!(b.num_fill_polygon_call, 1); + assert_eq!(b.draw_count, 1); + }); + }); + + da.draw(&Polygon::new(points.clone(), &BLUE)) + .expect("Drawing Failure"); +} diff --git a/vendor/plotters/src/element/basic_shapes_3d.rs b/vendor/plotters/src/element/basic_shapes_3d.rs new file mode 100644 index 000000000..97b15e62d --- /dev/null +++ b/vendor/plotters/src/element/basic_shapes_3d.rs @@ -0,0 +1,108 @@ +use super::{BackendCoordAndZ, Drawable, PointCollection}; +use crate::style::ShapeStyle; +use plotters_backend::{BackendCoord, DrawingBackend, DrawingErrorKind}; + +/** +Represents a cuboid, a six-faced solid. + +# Examples + +``` +use plotters::prelude::*; +let drawing_area = SVGBackend::new("cuboid.svg", (300, 200)).into_drawing_area(); +drawing_area.fill(&WHITE).unwrap(); +let mut chart_builder = ChartBuilder::on(&drawing_area); +let mut chart_context = chart_builder.margin(20).build_cartesian_3d(0.0..3.5, 0.0..2.5, 0.0..1.5).unwrap(); +chart_context.configure_axes().x_labels(4).y_labels(3).z_labels(2).draw().unwrap(); +let cubiod = Cubiod::new([(0.,0.,0.), (3.,2.,1.)], BLUE.mix(0.2), BLUE); +chart_context.draw_series(std::iter::once(cubiod)).unwrap(); +``` + +The result is a semi-transparent cuboid with blue edges: + + +*/ +pub struct Cubiod<X, Y, Z> { + face_style: ShapeStyle, + edge_style: ShapeStyle, + vert: [(X, Y, Z); 8], +} + +impl<X: Clone, Y: Clone, Z: Clone> Cubiod<X, Y, Z> { + /** + Creates a cuboid. + + See [`Cubiod`] for more information and examples. + */ + #[allow(clippy::redundant_clone)] + pub fn new<FS: Into<ShapeStyle>, ES: Into<ShapeStyle>>( + [(x0, y0, z0), (x1, y1, z1)]: [(X, Y, Z); 2], + face_style: FS, + edge_style: ES, + ) -> Self { + Self { + face_style: face_style.into(), + edge_style: edge_style.into(), + vert: [ + (x0.clone(), y0.clone(), z0.clone()), + (x0.clone(), y0.clone(), z1.clone()), + (x0.clone(), y1.clone(), z0.clone()), + (x0.clone(), y1.clone(), z1.clone()), + (x1.clone(), y0.clone(), z0.clone()), + (x1.clone(), y0.clone(), z1.clone()), + (x1.clone(), y1.clone(), z0.clone()), + (x1.clone(), y1.clone(), z1.clone()), + ], + } + } +} + +impl<'a, X: 'a, Y: 'a, Z: 'a> PointCollection<'a, (X, Y, Z), BackendCoordAndZ> + for &'a Cubiod<X, Y, Z> +{ + type Point = &'a (X, Y, Z); + type IntoIter = &'a [(X, Y, Z)]; + fn point_iter(self) -> Self::IntoIter { + &self.vert + } +} + +impl<X, Y, Z, DB: DrawingBackend> Drawable<DB, BackendCoordAndZ> for Cubiod<X, Y, Z> { + fn draw<I: Iterator<Item = (BackendCoord, i32)>>( + &self, + points: I, + backend: &mut DB, + _: (u32, u32), + ) -> Result<(), DrawingErrorKind<DB::ErrorType>> { + let vert: Vec<_> = points.collect(); + let mut polygon = vec![]; + for mask in [1, 2, 4].iter().cloned() { + let mask_a = if mask == 4 { 1 } else { mask * 2 }; + let mask_b = if mask == 1 { 4 } else { mask / 2 }; + let a = 0; + let b = a | mask_a; + let c = a | mask_a | mask_b; + let d = a | mask_b; + polygon.push([vert[a], vert[b], vert[c], vert[d]]); + polygon.push([ + vert[a | mask], + vert[b | mask], + vert[c | mask], + vert[d | mask], + ]); + } + polygon.sort_by_cached_key(|t| std::cmp::Reverse(t[0].1 + t[1].1 + t[2].1 + t[3].1)); + + for p in polygon { + backend.fill_polygon(p.iter().map(|(coord, _)| *coord), &self.face_style)?; + backend.draw_path( + p.iter() + .map(|(coord, _)| *coord) + .chain(std::iter::once(p[0].0)), + &self.edge_style, + )?; + } + + Ok(()) + } +} diff --git a/vendor/plotters/src/element/boxplot.rs b/vendor/plotters/src/element/boxplot.rs new file mode 100644 index 000000000..2de2bd062 --- /dev/null +++ b/vendor/plotters/src/element/boxplot.rs @@ -0,0 +1,288 @@ +use std::marker::PhantomData; + +use crate::data::Quartiles; +use crate::element::{Drawable, PointCollection}; +use crate::style::{Color, ShapeStyle, BLACK}; +use plotters_backend::{BackendCoord, DrawingBackend, DrawingErrorKind}; + +/// The boxplot orientation trait +pub trait BoxplotOrient<K, V> { + type XType; + type YType; + + fn make_coord(key: K, val: V) -> (Self::XType, Self::YType); + fn with_offset(coord: BackendCoord, offset: f64) -> BackendCoord; +} + +/// The vertical boxplot phantom +pub struct BoxplotOrientV<K, V>(PhantomData<(K, V)>); + +/// The horizontal boxplot phantom +pub struct BoxplotOrientH<K, V>(PhantomData<(K, V)>); + +impl<K, V> BoxplotOrient<K, V> for BoxplotOrientV<K, V> { + type XType = K; + type YType = V; + + fn make_coord(key: K, val: V) -> (K, V) { + (key, val) + } + + fn with_offset(coord: BackendCoord, offset: f64) -> BackendCoord { + (coord.0 + offset as i32, coord.1) + } +} + +impl<K, V> BoxplotOrient<K, V> for BoxplotOrientH<K, V> { + type XType = V; + type YType = K; + + fn make_coord(key: K, val: V) -> (V, K) { + (val, key) + } + + fn with_offset(coord: BackendCoord, offset: f64) -> BackendCoord { + (coord.0, coord.1 + offset as i32) + } +} + +const DEFAULT_WIDTH: u32 = 10; + +/// The boxplot element +pub struct Boxplot<K, O: BoxplotOrient<K, f32>> { + style: ShapeStyle, + width: u32, + whisker_width: f64, + offset: f64, + key: K, + values: [f32; 5], + _p: PhantomData<O>, +} + +impl<K: Clone> Boxplot<K, BoxplotOrientV<K, f32>> { + /// Create a new vertical boxplot element. + /// + /// - `key`: The key (the X axis value) + /// - `quartiles`: The quartiles values for the Y axis + /// - **returns** The newly created boxplot element + /// + /// ```rust + /// use plotters::prelude::*; + /// + /// let quartiles = Quartiles::new(&[7, 15, 36, 39, 40, 41]); + /// let plot = Boxplot::new_vertical("group", &quartiles); + /// ``` + pub fn new_vertical(key: K, quartiles: &Quartiles) -> Self { + Self { + style: Into::<ShapeStyle>::into(&BLACK), + width: DEFAULT_WIDTH, + whisker_width: 1.0, + offset: 0.0, + key, + values: quartiles.values(), + _p: PhantomData, + } + } +} + +impl<K: Clone> Boxplot<K, BoxplotOrientH<K, f32>> { + /// Create a new horizontal boxplot element. + /// + /// - `key`: The key (the Y axis value) + /// - `quartiles`: The quartiles values for the X axis + /// - **returns** The newly created boxplot element + /// + /// ```rust + /// use plotters::prelude::*; + /// + /// let quartiles = Quartiles::new(&[7, 15, 36, 39, 40, 41]); + /// let plot = Boxplot::new_horizontal("group", &quartiles); + /// ``` + pub fn new_horizontal(key: K, quartiles: &Quartiles) -> Self { + Self { + style: Into::<ShapeStyle>::into(&BLACK), + width: DEFAULT_WIDTH, + whisker_width: 1.0, + offset: 0.0, + key, + values: quartiles.values(), + _p: PhantomData, + } + } +} + +impl<K, O: BoxplotOrient<K, f32>> Boxplot<K, O> { + /// Set the style of the boxplot. + /// + /// - `S`: The required style + /// - **returns** The up-to-dated boxplot element + /// + /// ```rust + /// use plotters::prelude::*; + /// + /// let quartiles = Quartiles::new(&[7, 15, 36, 39, 40, 41]); + /// let plot = Boxplot::new_horizontal("group", &quartiles).style(&BLUE); + /// ``` + pub fn style<S: Into<ShapeStyle>>(mut self, style: S) -> Self { + self.style = style.into(); + self + } + + /// Set the bar width. + /// + /// - `width`: The required width + /// - **returns** The up-to-dated boxplot element + /// + /// ```rust + /// use plotters::prelude::*; + /// + /// let quartiles = Quartiles::new(&[7, 15, 36, 39, 40, 41]); + /// let plot = Boxplot::new_horizontal("group", &quartiles).width(10); + /// ``` + pub fn width(mut self, width: u32) -> Self { + self.width = width; + self + } + + /// Set the width of the whiskers as a fraction of the bar width. + /// + /// - `whisker_width`: The required fraction + /// - **returns** The up-to-dated boxplot element + /// + /// ```rust + /// use plotters::prelude::*; + /// + /// let quartiles = Quartiles::new(&[7, 15, 36, 39, 40, 41]); + /// let plot = Boxplot::new_horizontal("group", &quartiles).whisker_width(0.5); + /// ``` + pub fn whisker_width(mut self, whisker_width: f64) -> Self { + self.whisker_width = whisker_width; + self + } + + /// Set the element offset on the key axis. + /// + /// - `offset`: The required offset (on the X axis for vertical, on the Y axis for horizontal) + /// - **returns** The up-to-dated boxplot element + /// + /// ```rust + /// use plotters::prelude::*; + /// + /// let quartiles = Quartiles::new(&[7, 15, 36, 39, 40, 41]); + /// let plot = Boxplot::new_horizontal("group", &quartiles).offset(-5); + /// ``` + pub fn offset<T: Into<f64> + Copy>(mut self, offset: T) -> Self { + self.offset = offset.into(); + self + } +} + +impl<'a, K: Clone, O: BoxplotOrient<K, f32>> PointCollection<'a, (O::XType, O::YType)> + for &'a Boxplot<K, O> +{ + type Point = (O::XType, O::YType); + type IntoIter = Vec<Self::Point>; + fn point_iter(self) -> Self::IntoIter { + self.values + .iter() + .map(|v| O::make_coord(self.key.clone(), *v)) + .collect() + } +} + +impl<K, DB: DrawingBackend, O: BoxplotOrient<K, f32>> Drawable<DB> for Boxplot<K, O> { + fn draw<I: Iterator<Item = BackendCoord>>( + &self, + points: I, + backend: &mut DB, + _: (u32, u32), + ) -> Result<(), DrawingErrorKind<DB::ErrorType>> { + let points: Vec<_> = points.take(5).collect(); + if points.len() == 5 { + let width = f64::from(self.width); + let moved = |coord| O::with_offset(coord, self.offset); + let start_bar = |coord| O::with_offset(moved(coord), -width / 2.0); + let end_bar = |coord| O::with_offset(moved(coord), width / 2.0); + let start_whisker = + |coord| O::with_offset(moved(coord), -width * self.whisker_width / 2.0); + let end_whisker = + |coord| O::with_offset(moved(coord), width * self.whisker_width / 2.0); + + // |---[ | ]----| + // ^________________ + backend.draw_line( + start_whisker(points[0]), + end_whisker(points[0]), + &self.style, + )?; + + // |---[ | ]----| + // _^^^_____________ + + backend.draw_line( + moved(points[0]), + moved(points[1]), + &self.style.color.to_backend_color(), + )?; + + // |---[ | ]----| + // ____^______^_____ + let corner1 = start_bar(points[3]); + let corner2 = end_bar(points[1]); + let upper_left = (corner1.0.min(corner2.0), corner1.1.min(corner2.1)); + let bottom_right = (corner1.0.max(corner2.0), corner1.1.max(corner2.1)); + backend.draw_rect(upper_left, bottom_right, &self.style, false)?; + + // |---[ | ]----| + // ________^________ + backend.draw_line(start_bar(points[2]), end_bar(points[2]), &self.style)?; + + // |---[ | ]----| + // ____________^^^^_ + backend.draw_line(moved(points[3]), moved(points[4]), &self.style)?; + + // |---[ | ]----| + // ________________^ + backend.draw_line( + start_whisker(points[4]), + end_whisker(points[4]), + &self.style, + )?; + } + Ok(()) + } +} + +#[cfg(test)] +mod test { + use super::*; + use crate::prelude::*; + + #[test] + fn test_draw_v() { + let root = MockedBackend::new(1024, 768).into_drawing_area(); + let chart = ChartBuilder::on(&root) + .build_cartesian_2d(0..2, 0f32..100f32) + .unwrap(); + + let values = Quartiles::new(&[6]); + assert!(chart + .plotting_area() + .draw(&Boxplot::new_vertical(1, &values)) + .is_ok()); + } + + #[test] + fn test_draw_h() { + let root = MockedBackend::new(1024, 768).into_drawing_area(); + let chart = ChartBuilder::on(&root) + .build_cartesian_2d(0f32..100f32, 0..2) + .unwrap(); + + let values = Quartiles::new(&[6]); + assert!(chart + .plotting_area() + .draw(&Boxplot::new_horizontal(1, &values)) + .is_ok()); + } +} diff --git a/vendor/plotters/src/element/candlestick.rs b/vendor/plotters/src/element/candlestick.rs new file mode 100644 index 000000000..e28645431 --- /dev/null +++ b/vendor/plotters/src/element/candlestick.rs @@ -0,0 +1,100 @@ +/*! + The candlestick element, which showing the high/low/open/close price +*/ + +use std::cmp::Ordering; + +use crate::element::{Drawable, PointCollection}; +use crate::style::ShapeStyle; +use plotters_backend::{BackendCoord, DrawingBackend, DrawingErrorKind}; + +/// The candlestick data point element +pub struct CandleStick<X, Y: PartialOrd> { + style: ShapeStyle, + width: u32, + points: [(X, Y); 4], +} + +impl<X: Clone, Y: PartialOrd> CandleStick<X, Y> { + /// Create a new candlestick element, which requires the Y coordinate can be compared + /// + /// - `x`: The x coordinate + /// - `open`: The open value + /// - `high`: The high value + /// - `low`: The low value + /// - `close`: The close value + /// - `gain_style`: The style for gain + /// - `loss_style`: The style for loss + /// - `width`: The width + /// - **returns** The newly created candlestick element + /// + /// ```rust + /// use chrono::prelude::*; + /// use plotters::prelude::*; + /// + /// let candlestick = CandleStick::new(Local::now(), 130.0600, 131.3700, 128.8300, 129.1500, &GREEN, &RED, 15); + /// ``` + #[allow(clippy::too_many_arguments)] + pub fn new<GS: Into<ShapeStyle>, LS: Into<ShapeStyle>>( + x: X, + open: Y, + high: Y, + low: Y, + close: Y, + gain_style: GS, + loss_style: LS, + width: u32, + ) -> Self { + Self { + style: match open.partial_cmp(&close) { + Some(Ordering::Less) => gain_style.into(), + _ => loss_style.into(), + }, + width, + points: [ + (x.clone(), open), + (x.clone(), high), + (x.clone(), low), + (x, close), + ], + } + } +} + +impl<'a, X: 'a, Y: PartialOrd + 'a> PointCollection<'a, (X, Y)> for &'a CandleStick<X, Y> { + type Point = &'a (X, Y); + type IntoIter = &'a [(X, Y)]; + fn point_iter(self) -> &'a [(X, Y)] { + &self.points + } +} + +impl<X, Y: PartialOrd, DB: DrawingBackend> Drawable<DB> for CandleStick<X, Y> { + fn draw<I: Iterator<Item = BackendCoord>>( + &self, + points: I, + backend: &mut DB, + _: (u32, u32), + ) -> Result<(), DrawingErrorKind<DB::ErrorType>> { + let mut points: Vec<_> = points.take(4).collect(); + if points.len() == 4 { + let fill = self.style.filled; + if points[0].1 > points[3].1 { + points.swap(0, 3); + } + let (l, r) = ( + self.width as i32 / 2, + self.width as i32 - self.width as i32 / 2, + ); + + backend.draw_line(points[0], points[1], &self.style)?; + backend.draw_line(points[2], points[3], &self.style)?; + + points[0].0 -= l; + points[3].0 += r; + + backend.draw_rect(points[0], points[3], &self.style, fill)?; + } + Ok(()) + } +} diff --git a/vendor/plotters/src/element/composable.rs b/vendor/plotters/src/element/composable.rs new file mode 100644 index 000000000..d79c505c8 --- /dev/null +++ b/vendor/plotters/src/element/composable.rs @@ -0,0 +1,242 @@ +use super::*; +use plotters_backend::DrawingBackend; +use std::borrow::Borrow; +use std::iter::{once, Once}; +use std::marker::PhantomData; +use std::ops::Add; + +/** +An empty composable element. This is the starting point of a composed element. + +# Example + +``` +use plotters::prelude::*; +let data = [(1.0, 3.3), (2., 2.1), (3., 1.5), (4., 1.9), (5., 1.0)]; +let drawing_area = SVGBackend::new("composable.svg", (300, 200)).into_drawing_area(); +drawing_area.fill(&WHITE).unwrap(); +let mut chart_builder = ChartBuilder::on(&drawing_area); +chart_builder.margin(7).set_left_and_bottom_label_area_size(20); +let mut chart_context = chart_builder.build_cartesian_2d(0.0..5.5, 0.0..5.5).unwrap(); +chart_context.configure_mesh().draw().unwrap(); +chart_context.draw_series(data.map(|(x, y)| { + EmptyElement::at((x, y)) // Use the guest coordinate system with EmptyElement + + Circle::new((0, 0), 10, BLUE) // Use backend coordinates with the rest + + Cross::new((4, 4), 3, RED) + + Pixel::new((4, -4), RED) + + TriangleMarker::new((-4, -4), 4, RED) +})).unwrap(); +``` + +The result is a data series where each point consists of a circle, a cross, a pixel, and a triangle: + + + +*/ +pub struct EmptyElement<Coord, DB: DrawingBackend> { + coord: Coord, + phantom: PhantomData<DB>, +} + +impl<Coord, DB: DrawingBackend> EmptyElement<Coord, DB> { + /** + An empty composable element. This is the starting point of a composed element. + + See [`EmptyElement`] for more information and examples. + */ + pub fn at(coord: Coord) -> Self { + Self { + coord, + phantom: PhantomData, + } + } +} + +impl<Coord, Other, DB: DrawingBackend> Add<Other> for EmptyElement<Coord, DB> +where + Other: Drawable<DB>, + for<'a> &'a Other: PointCollection<'a, BackendCoord>, +{ + type Output = BoxedElement<Coord, DB, Other>; + fn add(self, other: Other) -> Self::Output { + BoxedElement { + offset: self.coord, + inner: other, + phantom: PhantomData, + } + } +} + +impl<'a, Coord, DB: DrawingBackend> PointCollection<'a, Coord> for &'a EmptyElement<Coord, DB> { + type Point = &'a Coord; + type IntoIter = Once<&'a Coord>; + fn point_iter(self) -> Self::IntoIter { + once(&self.coord) + } +} + +impl<Coord, DB: DrawingBackend> Drawable<DB> for EmptyElement<Coord, DB> { + fn draw<I: Iterator<Item = BackendCoord>>( + &self, + _pos: I, + _backend: &mut DB, + _: (u32, u32), + ) -> Result<(), DrawingErrorKind<DB::ErrorType>> { + Ok(()) + } +} + +/** +A container for one drawable element, used for composition. + +This is used internally by Plotters and should probably not be included in user code. +See [`EmptyElement`] for more information and examples. +*/ +pub struct BoxedElement<Coord, DB: DrawingBackend, A: Drawable<DB>> { + inner: A, + offset: Coord, + phantom: PhantomData<DB>, +} + +impl<'b, Coord, DB: DrawingBackend, A: Drawable<DB>> PointCollection<'b, Coord> + for &'b BoxedElement<Coord, DB, A> +{ + type Point = &'b Coord; + type IntoIter = Once<&'b Coord>; + fn point_iter(self) -> Self::IntoIter { + once(&self.offset) + } +} + +impl<Coord, DB: DrawingBackend, A> Drawable<DB> for BoxedElement<Coord, DB, A> +where + for<'a> &'a A: PointCollection<'a, BackendCoord>, + A: Drawable<DB>, +{ + fn draw<I: Iterator<Item = BackendCoord>>( + &self, + mut pos: I, + backend: &mut DB, + ps: (u32, u32), + ) -> Result<(), DrawingErrorKind<DB::ErrorType>> { + if let Some((x0, y0)) = pos.next() { + self.inner.draw( + self.inner.point_iter().into_iter().map(|p| { + let p = p.borrow(); + (p.0 + x0, p.1 + y0) + }), + backend, + ps, + )?; + } + Ok(()) + } +} + +impl<Coord, DB: DrawingBackend, My, Yours> Add<Yours> for BoxedElement<Coord, DB, My> +where + My: Drawable<DB>, + for<'a> &'a My: PointCollection<'a, BackendCoord>, + Yours: Drawable<DB>, + for<'a> &'a Yours: PointCollection<'a, BackendCoord>, +{ + type Output = ComposedElement<Coord, DB, My, Yours>; + fn add(self, yours: Yours) -> Self::Output { + ComposedElement { + offset: self.offset, + first: self.inner, + second: yours, + phantom: PhantomData, + } + } +} + +/** +A container for two drawable elements, used for composition. + +This is used internally by Plotters and should probably not be included in user code. +See [`EmptyElement`] for more information and examples. +*/ +pub struct ComposedElement<Coord, DB: DrawingBackend, A, B> +where + A: Drawable<DB>, + B: Drawable<DB>, +{ + first: A, + second: B, + offset: Coord, + phantom: PhantomData<DB>, +} + +impl<'b, Coord, DB: DrawingBackend, A, B> PointCollection<'b, Coord> + for &'b ComposedElement<Coord, DB, A, B> +where + A: Drawable<DB>, + B: Drawable<DB>, +{ + type Point = &'b Coord; + type IntoIter = Once<&'b Coord>; + fn point_iter(self) -> Self::IntoIter { + once(&self.offset) + } +} + +impl<Coord, DB: DrawingBackend, A, B> Drawable<DB> for ComposedElement<Coord, DB, A, B> +where + for<'a> &'a A: PointCollection<'a, BackendCoord>, + for<'b> &'b B: PointCollection<'b, BackendCoord>, + A: Drawable<DB>, + B: Drawable<DB>, +{ + fn draw<I: Iterator<Item = BackendCoord>>( + &self, + mut pos: I, + backend: &mut DB, + ps: (u32, u32), + ) -> Result<(), DrawingErrorKind<DB::ErrorType>> { + if let Some((x0, y0)) = pos.next() { + self.first.draw( + self.first.point_iter().into_iter().map(|p| { + let p = p.borrow(); + (p.0 + x0, p.1 + y0) + }), + backend, + ps, + )?; + self.second.draw( + self.second.point_iter().into_iter().map(|p| { + let p = p.borrow(); + (p.0 + x0, p.1 + y0) + }), + backend, + ps, + )?; + } + Ok(()) + } +} + +impl<Coord, DB: DrawingBackend, A, B, C> Add<C> for ComposedElement<Coord, DB, A, B> +where + A: Drawable<DB>, + for<'a> &'a A: PointCollection<'a, BackendCoord>, + B: Drawable<DB>, + for<'a> &'a B: PointCollection<'a, BackendCoord>, + C: Drawable<DB>, + for<'a> &'a C: PointCollection<'a, BackendCoord>, +{ + type Output = ComposedElement<Coord, DB, A, ComposedElement<BackendCoord, DB, B, C>>; + fn add(self, rhs: C) -> Self::Output { + ComposedElement { + offset: self.offset, + first: self.first, + second: ComposedElement { + offset: (0, 0), + first: self.second, + second: rhs, + phantom: PhantomData, + }, + phantom: PhantomData, + } + } +} diff --git a/vendor/plotters/src/element/dynelem.rs b/vendor/plotters/src/element/dynelem.rs new file mode 100644 index 000000000..b2bd178ed --- /dev/null +++ b/vendor/plotters/src/element/dynelem.rs @@ -0,0 +1,84 @@ +use super::{Drawable, PointCollection}; +use plotters_backend::{BackendCoord, DrawingBackend, DrawingErrorKind}; + +use std::borrow::Borrow; + +trait DynDrawable<DB: DrawingBackend> { + fn draw_dyn( + &self, + points: &mut dyn Iterator<Item = BackendCoord>, + backend: &mut DB, + parent_dim: (u32, u32), + ) -> Result<(), DrawingErrorKind<DB::ErrorType>>; +} + +impl<DB: DrawingBackend, T: Drawable<DB>> DynDrawable<DB> for T { + fn draw_dyn( + &self, + points: &mut dyn Iterator<Item = BackendCoord>, + backend: &mut DB, + parent_dim: (u32, u32), + ) -> Result<(), DrawingErrorKind<DB::ErrorType>> { + T::draw(self, points, backend, parent_dim) + } +} + +/// The container for a dynamically dispatched element +pub struct DynElement<'a, DB, Coord> +where + DB: DrawingBackend, + Coord: Clone, +{ + points: Vec<Coord>, + drawable: Box<dyn DynDrawable<DB> + 'a>, +} + +impl<'a, 'b: 'a, DB: DrawingBackend, Coord: Clone> PointCollection<'a, Coord> + for &'a DynElement<'b, DB, Coord> +{ + type Point = &'a Coord; + type IntoIter = &'a Vec<Coord>; + fn point_iter(self) -> Self::IntoIter { + &self.points + } +} + +impl<'a, DB: DrawingBackend, Coord: Clone> Drawable<DB> for DynElement<'a, DB, Coord> { + fn draw<I: Iterator<Item = BackendCoord>>( + &self, + mut pos: I, + backend: &mut DB, + parent_dim: (u32, u32), + ) -> Result<(), DrawingErrorKind<DB::ErrorType>> { + self.drawable.draw_dyn(&mut pos, backend, parent_dim) + } +} + +/// The trait that makes the conversion from the statically dispatched element +/// to the dynamically dispatched element +pub trait IntoDynElement<'a, DB: DrawingBackend, Coord: Clone> +where + Self: 'a, +{ + /// Make the conversion + fn into_dyn(self) -> DynElement<'a, DB, Coord>; +} + +impl<'b, T, DB, Coord> IntoDynElement<'b, DB, Coord> for T +where + T: Drawable<DB> + 'b, + for<'a> &'a T: PointCollection<'a, Coord>, + Coord: Clone, + DB: DrawingBackend, +{ + fn into_dyn(self) -> DynElement<'b, DB, Coord> { + DynElement { + points: self + .point_iter() + .into_iter() + .map(|x| x.borrow().clone()) + .collect(), + drawable: Box::new(self), + } + } +} diff --git a/vendor/plotters/src/element/errorbar.rs b/vendor/plotters/src/element/errorbar.rs new file mode 100644 index 000000000..4e0acf78d --- /dev/null +++ b/vendor/plotters/src/element/errorbar.rs @@ -0,0 +1,223 @@ +use std::marker::PhantomData; + +use crate::element::{Drawable, PointCollection}; +use crate::style::ShapeStyle; +use plotters_backend::{BackendCoord, DrawingBackend, DrawingErrorKind}; + +/** +Used to reuse code between horizontal and vertical error bars. + +This is used internally by Plotters and should probably not be included in user code. +See [`ErrorBar`] for more information and examples. +*/ +pub trait ErrorBarOrient<K, V> { + type XType; + type YType; + + fn make_coord(key: K, val: V) -> (Self::XType, Self::YType); + fn ending_coord(coord: BackendCoord, w: u32) -> (BackendCoord, BackendCoord); +} + +/** +Used for the production of horizontal error bars. + +This is used internally by Plotters and should probably not be included in user code. +See [`ErrorBar`] for more information and examples. +*/ +pub struct ErrorBarOrientH<K, V>(PhantomData<(K, V)>); + +/** +Used for the production of vertical error bars. + +This is used internally by Plotters and should probably not be included in user code. +See [`ErrorBar`] for more information and examples. +*/ +pub struct ErrorBarOrientV<K, V>(PhantomData<(K, V)>); + +impl<K, V> ErrorBarOrient<K, V> for ErrorBarOrientH<K, V> { + type XType = V; + type YType = K; + + fn make_coord(key: K, val: V) -> (V, K) { + (val, key) + } + + fn ending_coord(coord: BackendCoord, w: u32) -> (BackendCoord, BackendCoord) { + ( + (coord.0, coord.1 - w as i32 / 2), + (coord.0, coord.1 + w as i32 / 2), + ) + } +} + +impl<K, V> ErrorBarOrient<K, V> for ErrorBarOrientV<K, V> { + type XType = K; + type YType = V; + + fn make_coord(key: K, val: V) -> (K, V) { + (key, val) + } + + fn ending_coord(coord: BackendCoord, w: u32) -> (BackendCoord, BackendCoord) { + ( + (coord.0 - w as i32 / 2, coord.1), + (coord.0 + w as i32 / 2, coord.1), + ) + } +} + +/** +An error bar, which visualizes the minimum, average, and maximum of a dataset. + +Unlike [`crate::series::Histogram`], the `ErrorBar` code does not classify or aggregate data. +These operations must be done before building error bars. + +# Examples + +``` +use plotters::prelude::*; +let data = [(1.0, 3.3), (2., 2.1), (3., 1.5), (4., 1.9), (5., 1.0)]; +let drawing_area = SVGBackend::new("error_bars_vertical.svg", (300, 200)).into_drawing_area(); +drawing_area.fill(&WHITE).unwrap(); +let mut chart_builder = ChartBuilder::on(&drawing_area); +chart_builder.margin(10).set_left_and_bottom_label_area_size(20); +let mut chart_context = chart_builder.build_cartesian_2d(0.0..6.0, 0.0..6.0).unwrap(); +chart_context.configure_mesh().draw().unwrap(); +chart_context.draw_series(data.map(|(x, y)| { + ErrorBar::new_vertical(x, y - 0.4, y, y + 0.3, BLUE.filled(), 10) +})).unwrap(); +chart_context.draw_series(data.map(|(x, y)| { + ErrorBar::new_vertical(x, y + 1.0, y + 1.9, y + 2.4, RED, 10) +})).unwrap(); +``` + +This code produces two series of five error bars each, showing minima, maxima, and average values: + + + +[`ErrorBar::new_vertical()`] is used to create vertical error bars. Here is an example using +[`ErrorBar::new_horizontal()`] instead: + + +*/ +pub struct ErrorBar<K, V, O: ErrorBarOrient<K, V>> { + style: ShapeStyle, + width: u32, + key: K, + values: [V; 3], + _p: PhantomData<O>, +} + +impl<K, V> ErrorBar<K, V, ErrorBarOrientV<K, V>> { + /** + Creates a vertical error bar. + ` + - `key`: Horizontal position of the bar + - `min`: Minimum of the data + - `avg`: Average of the data + - `max`: Maximum of the data + - `style`: Color, transparency, and fill of the error bar. See [`ShapeStyle`] for more information and examples. + - `width`: Width of the error marks in backend coordinates. + + See [`ErrorBar`] for more information and examples. + */ + pub fn new_vertical<S: Into<ShapeStyle>>( + key: K, + min: V, + avg: V, + max: V, + style: S, + width: u32, + ) -> Self { + Self { + style: style.into(), + width, + key, + values: [min, avg, max], + _p: PhantomData, + } + } +} + +impl<K, V> ErrorBar<K, V, ErrorBarOrientH<K, V>> { + /** + Creates a horizontal error bar. + + - `key`: Vertical position of the bar + - `min`: Minimum of the data + - `avg`: Average of the data + - `max`: Maximum of the data + - `style`: Color, transparency, and fill of the error bar. See [`ShapeStyle`] for more information and examples. + - `width`: Width of the error marks in backend coordinates. + + See [`ErrorBar`] for more information and examples. + */ + pub fn new_horizontal<S: Into<ShapeStyle>>( + key: K, + min: V, + avg: V, + max: V, + style: S, + width: u32, + ) -> Self { + Self { + style: style.into(), + width, + key, + values: [min, avg, max], + _p: PhantomData, + } + } +} + +impl<'a, K: Clone, V: Clone, O: ErrorBarOrient<K, V>> PointCollection<'a, (O::XType, O::YType)> + for &'a ErrorBar<K, V, O> +{ + type Point = (O::XType, O::YType); + type IntoIter = Vec<Self::Point>; + fn point_iter(self) -> Self::IntoIter { + self.values + .iter() + .map(|v| O::make_coord(self.key.clone(), v.clone())) + .collect() + } +} + +impl<K, V, O: ErrorBarOrient<K, V>, DB: DrawingBackend> Drawable<DB> for ErrorBar<K, V, O> { + fn draw<I: Iterator<Item = BackendCoord>>( + &self, + points: I, + backend: &mut DB, + _: (u32, u32), + ) -> Result<(), DrawingErrorKind<DB::ErrorType>> { + let points: Vec<_> = points.take(3).collect(); + + let (from, to) = O::ending_coord(points[0], self.width); + backend.draw_line(from, to, &self.style)?; + + let (from, to) = O::ending_coord(points[2], self.width); + backend.draw_line(from, to, &self.style)?; + + backend.draw_line(points[0], points[2], &self.style)?; + + backend.draw_circle(points[1], self.width / 2, &self.style, self.style.filled)?; + + Ok(()) + } +} + +#[cfg(test)] +#[test] +fn test_preserve_stroke_width() { + let v = ErrorBar::new_vertical(100, 20, 50, 70, WHITE.filled().stroke_width(5), 3); + let h = ErrorBar::new_horizontal(100, 20, 50, 70, WHITE.filled().stroke_width(5), 3); + + use crate::prelude::*; + let da = crate::create_mocked_drawing_area(300, 300, |m| { + m.check_draw_line(|_, w, _, _| { + assert_eq!(w, 5); + }); + }); + da.draw(&h).expect("Drawing Failure"); + da.draw(&v).expect("Drawing Failure"); +} diff --git a/vendor/plotters/src/element/image.rs b/vendor/plotters/src/element/image.rs new file mode 100644 index 000000000..f50ce77bc --- /dev/null +++ b/vendor/plotters/src/element/image.rs @@ -0,0 +1,228 @@ +#[cfg(all( + not(all(target_arch = "wasm32", not(target_os = "wasi"))), + feature = "image" +))] +use image::{DynamicImage, GenericImageView}; + +use super::{Drawable, PointCollection}; +use plotters_backend::{BackendCoord, DrawingBackend, DrawingErrorKind}; + +use plotters_bitmap::bitmap_pixel::{PixelFormat, RGBPixel}; + +#[cfg(all( + not(all(target_arch = "wasm32", not(target_os = "wasi"))), + feature = "image" +))] +use plotters_bitmap::bitmap_pixel::BGRXPixel; + +use plotters_bitmap::BitMapBackend; + +use std::borrow::Borrow; +use std::marker::PhantomData; + +enum Buffer<'a> { + Owned(Vec<u8>), + Borrowed(&'a [u8]), + BorrowedMut(&'a mut [u8]), +} + +impl<'a> Borrow<[u8]> for Buffer<'a> { + fn borrow(&self) -> &[u8] { + self.as_ref() + } +} + +impl AsRef<[u8]> for Buffer<'_> { + fn as_ref(&self) -> &[u8] { + match self { + Buffer::Owned(owned) => owned.as_ref(), + Buffer::Borrowed(target) => target, + Buffer::BorrowedMut(target) => target, + } + } +} + +impl<'a> Buffer<'a> { + fn to_mut(&mut self) -> &mut [u8] { + let owned = match self { + Buffer::Owned(owned) => return &mut owned[..], + Buffer::BorrowedMut(target) => return target, + Buffer::Borrowed(target) => { + let mut value = vec![]; + value.extend_from_slice(target); + value + } + }; + + *self = Buffer::Owned(owned); + self.to_mut() + } +} + +/// The element that contains a bitmap on it +pub struct BitMapElement<'a, Coord, P: PixelFormat = RGBPixel> { + image: Buffer<'a>, + size: (u32, u32), + pos: Coord, + phantom: PhantomData<P>, +} + +impl<'a, Coord, P: PixelFormat> BitMapElement<'a, Coord, P> { + /// Create a new empty bitmap element. This can be use as + /// the draw and blit pattern. + /// + /// - `pos`: The left upper coordinate for the element + /// - `size`: The size of the bitmap + pub fn new(pos: Coord, size: (u32, u32)) -> Self { + Self { + image: Buffer::Owned(vec![0; (size.0 * size.1) as usize * P::PIXEL_SIZE]), + size, + pos, + phantom: PhantomData, + } + } + + /// Create a new bitmap element with an pre-allocated owned buffer, this function will + /// take the ownership of the buffer. + /// + /// - `pos`: The left upper coordinate of the elelent + /// - `size`: The size of the bitmap + /// - `buf`: The buffer to use + /// - **returns**: The newly created image element, if the buffer isn't fit the image + /// dimension, this will returns an `None`. + pub fn with_owned_buffer(pos: Coord, size: (u32, u32), buf: Vec<u8>) -> Option<Self> { + if buf.len() < (size.0 * size.1) as usize * P::PIXEL_SIZE { + return None; + } + + Some(Self { + image: Buffer::Owned(buf), + size, + pos, + phantom: PhantomData, + }) + } + + /// Create a new bitmap element with a mut borrow to an existing buffer + /// + /// - `pos`: The left upper coordinate of the elelent + /// - `size`: The size of the bitmap + /// - `buf`: The buffer to use + /// - **returns**: The newly created image element, if the buffer isn't fit the image + /// dimension, this will returns an `None`. + pub fn with_mut(pos: Coord, size: (u32, u32), buf: &'a mut [u8]) -> Option<Self> { + if buf.len() < (size.0 * size.1) as usize * P::PIXEL_SIZE { + return None; + } + + Some(Self { + image: Buffer::BorrowedMut(buf), + size, + pos, + phantom: PhantomData, + }) + } + + /// Create a new bitmap element with a shared borrowed buffer. This means if we want to modifiy + /// the content of the image, the buffer is automatically copied + /// + /// - `pos`: The left upper coordinate of the elelent + /// - `size`: The size of the bitmap + /// - `buf`: The buffer to use + /// - **returns**: The newly created image element, if the buffer isn't fit the image + /// dimension, this will returns an `None`. + pub fn with_ref(pos: Coord, size: (u32, u32), buf: &'a [u8]) -> Option<Self> { + if buf.len() < (size.0 * size.1) as usize * P::PIXEL_SIZE { + return None; + } + + Some(Self { + image: Buffer::Borrowed(buf), + size, + pos, + phantom: PhantomData, + }) + } + + /// Copy the existing bitmap element to another location + /// + /// - `pos`: The new location to copy + pub fn copy_to<Coord2>(&self, pos: Coord2) -> BitMapElement<Coord2, P> { + BitMapElement { + image: Buffer::Borrowed(self.image.borrow()), + size: self.size, + pos, + phantom: PhantomData, + } + } + + /// Move the existing bitmap element to a new position + /// + /// - `pos`: The new position + pub fn move_to(&mut self, pos: Coord) { + self.pos = pos; + } + + /// Make the bitmap element as a bitmap backend, so that we can use + /// plotters drawing functionality on the bitmap element + pub fn as_bitmap_backend(&mut self) -> BitMapBackend<P> { + BitMapBackend::with_buffer_and_format(self.image.to_mut(), self.size).unwrap() + } +} + +#[cfg(all( + not(all(target_arch = "wasm32", not(target_os = "wasi"))), + feature = "image" +))] +impl<'a, Coord> From<(Coord, DynamicImage)> for BitMapElement<'a, Coord, RGBPixel> { + fn from((pos, image): (Coord, DynamicImage)) -> Self { + let (w, h) = image.dimensions(); + let rgb_image = image.to_rgb8().into_raw(); + Self { + pos, + image: Buffer::Owned(rgb_image), + size: (w, h), + phantom: PhantomData, + } + } +} + +#[cfg(all( + not(all(target_arch = "wasm32", not(target_os = "wasi"))), + feature = "image" +))] +impl<'a, Coord> From<(Coord, DynamicImage)> for BitMapElement<'a, Coord, BGRXPixel> { + fn from((pos, image): (Coord, DynamicImage)) -> Self { + let (w, h) = image.dimensions(); + let rgb_image = image.to_rgb8().into_raw(); + Self { + pos, + image: Buffer::Owned(rgb_image), + size: (w, h), + phantom: PhantomData, + } + } +} + +impl<'a, 'b, Coord> PointCollection<'a, Coord> for &'a BitMapElement<'b, Coord> { + type Point = &'a Coord; + type IntoIter = std::iter::Once<&'a Coord>; + fn point_iter(self) -> Self::IntoIter { + std::iter::once(&self.pos) + } +} + +impl<'a, Coord, DB: DrawingBackend> Drawable<DB> for BitMapElement<'a, Coord> { + fn draw<I: Iterator<Item = BackendCoord>>( + &self, + mut points: I, + backend: &mut DB, + _: (u32, u32), + ) -> Result<(), DrawingErrorKind<DB::ErrorType>> { + if let Some((x, y)) = points.next() { + // TODO: convert the pixel format when needed + return backend.blit_bitmap((x, y), self.size, self.image.as_ref()); + } + Ok(()) + } +} diff --git a/vendor/plotters/src/element/mod.rs b/vendor/plotters/src/element/mod.rs new file mode 100644 index 000000000..e2790051f --- /dev/null +++ b/vendor/plotters/src/element/mod.rs @@ -0,0 +1,290 @@ +/*! + Defines the drawing elements, the high-level drawing unit in Plotters drawing system + + ## Introduction + An element is the drawing unit for Plotter's high-level drawing API. + Different from low-level drawing API, an element is a logic unit of component in the image. + There are few built-in elements, including `Circle`, `Pixel`, `Rectangle`, `Path`, `Text`, etc. + + All element can be drawn onto the drawing area using API `DrawingArea::draw(...)`. + Plotters use "iterator of elements" as the abstraction of any type of plot. + + ## Implementing your own element + You can also define your own element, `CandleStick` is a good sample of implementing complex + element. There are two trait required for an element: + + - `PointCollection` - the struct should be able to return an iterator of key-points under guest coordinate + - `Drawable` - the struct is a pending drawing operation on a drawing backend with pixel-based coordinate + + An example of element that draws a red "X" in a red rectangle onto the backend: + + ```rust + use std::iter::{Once, once}; + use plotters::element::{PointCollection, Drawable}; + use plotters_backend::{BackendCoord, DrawingErrorKind, BackendStyle}; + use plotters::style::IntoTextStyle; + use plotters::prelude::*; + + // Any example drawing a red X + struct RedBoxedX((i32, i32)); + + // For any reference to RedX, we can convert it into an iterator of points + impl <'a> PointCollection<'a, (i32, i32)> for &'a RedBoxedX { + type Point = &'a (i32, i32); + type IntoIter = Once<&'a (i32, i32)>; + fn point_iter(self) -> Self::IntoIter { + once(&self.0) + } + } + + // How to actually draw this element + impl <DB:DrawingBackend> Drawable<DB> for RedBoxedX { + fn draw<I:Iterator<Item = BackendCoord>>( + &self, + mut pos: I, + backend: &mut DB, + _: (u32, u32), + ) -> Result<(), DrawingErrorKind<DB::ErrorType>> { + let pos = pos.next().unwrap(); + backend.draw_rect(pos, (pos.0 + 10, pos.1 + 12), &RED, false)?; + let text_style = &("sans-serif", 20).into_text_style(&backend.get_size()).color(&RED); + backend.draw_text("X", text_style, pos) + } + } + + fn main() -> Result<(), Box<dyn std::error::Error>> { + let root = BitMapBackend::new( + "plotters-doc-data/element-0.png", + (640, 480) + ).into_drawing_area(); + root.draw(&RedBoxedX((200, 200)))?; + Ok(()) + } + ``` +  + + ## Composable Elements + You also have an convenient way to build an element that isn't built into the Plotters library by + combining existing elements into a logic group. To build an composable element, you need to use an + logic empty element that draws nothing to the backend but denotes the relative zero point of the logical + group. Any element defined with pixel based offset coordinate can be added into the group later using + the `+` operator. + + For example, the red boxed X element can be implemented with Composable element in the following way: + ```rust + use plotters::prelude::*; + fn main() -> Result<(), Box<dyn std::error::Error>> { + let root = BitMapBackend::new( + "plotters-doc-data/element-1.png", + (640, 480) + ).into_drawing_area(); + let font:FontDesc = ("sans-serif", 20).into(); + root.draw(&(EmptyElement::at((200, 200)) + + Text::new("X", (0, 0), &"sans-serif".into_font().resize(20.0).color(&RED)) + + Rectangle::new([(0,0), (10, 12)], &RED) + ))?; + Ok(()) + } + ``` +  + + ## Dynamic Elements + By default, Plotters uses static dispatch for all the elements and series. For example, + the `ChartContext::draw_series` method accepts an iterator of `T` where type `T` implements + all the traits a element should implement. Although, we can use the series of composable element + for complex series drawing. But sometimes, we still want to make the series heterogynous, which means + the iterator should be able to holds elements in different type. + For example, a point series with cross and circle. This requires the dynamically dispatched elements. + In plotters, all the elements can be converted into `DynElement`, the dynamic dispatch container for + all elements (include external implemented ones). + Plotters automatically implements `IntoDynElement` for all elements, by doing so, any dynamic element should have + `into_dyn` function which would wrap the element into a dynamic element wrapper. + + For example, the following code counts the number of factors of integer and mark all prime numbers in cross. + ```rust + use plotters::prelude::*; + fn num_of_factor(n: i32) -> i32 { + let mut ret = 2; + for i in 2..n { + if i * i > n { + break; + } + + if n % i == 0 { + if i * i != n { + ret += 2; + } else { + ret += 1; + } + } + } + return ret; + } + fn main() -> Result<(), Box<dyn std::error::Error>> { + let root = + BitMapBackend::new("plotters-doc-data/element-3.png", (640, 480)) + .into_drawing_area(); + root.fill(&WHITE)?; + let mut chart = ChartBuilder::on(&root) + .x_label_area_size(40) + .y_label_area_size(40) + .margin(5) + .build_cartesian_2d(0..50, 0..10)?; + + chart + .configure_mesh() + .disable_x_mesh() + .disable_y_mesh() + .draw()?; + + chart.draw_series((0..50).map(|x| { + let center = (x, num_of_factor(x)); + // Although the arms of if statement has different types, + // but they can be placed into a dynamic element wrapper, + // by doing so, the type is unified. + if center.1 == 2 { + Cross::new(center, 4, Into::<ShapeStyle>::into(&RED).filled()).into_dyn() + } else { + Circle::new(center, 4, Into::<ShapeStyle>::into(&GREEN).filled()).into_dyn() + } + }))?; + + Ok(()) + } + ``` + 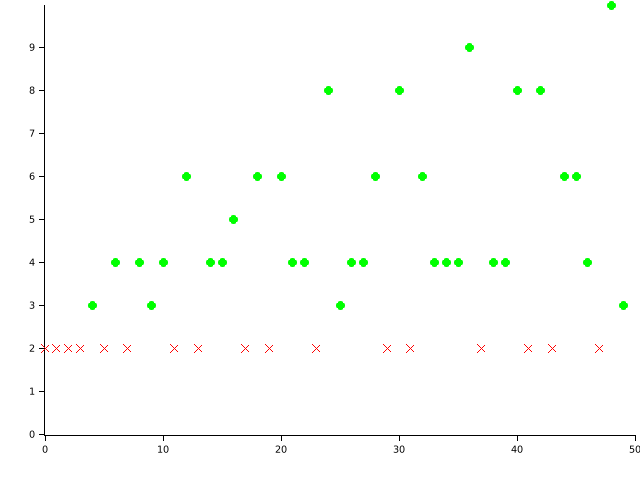 +*/ +use plotters_backend::{BackendCoord, DrawingBackend, DrawingErrorKind}; +use std::borrow::Borrow; + +mod basic_shapes; +pub use basic_shapes::*; + +mod basic_shapes_3d; +pub use basic_shapes_3d::*; + +mod text; +pub use text::*; + +mod points; +pub use points::*; + +mod composable; +pub use composable::{ComposedElement, EmptyElement}; + +#[cfg(feature = "candlestick")] +mod candlestick; +#[cfg(feature = "candlestick")] +pub use candlestick::CandleStick; + +#[cfg(feature = "errorbar")] +mod errorbar; +#[cfg(feature = "errorbar")] +pub use errorbar::{ErrorBar, ErrorBarOrientH, ErrorBarOrientV}; + +#[cfg(feature = "boxplot")] +mod boxplot; +#[cfg(feature = "boxplot")] +pub use boxplot::Boxplot; + +#[cfg(feature = "bitmap_backend")] +mod image; +#[cfg(feature = "bitmap_backend")] +pub use self::image::BitMapElement; + +mod dynelem; +pub use dynelem::{DynElement, IntoDynElement}; + +mod pie; +pub use pie::Pie; + +use crate::coord::CoordTranslate; +use crate::drawing::Rect; + +/// A type which is logically a collection of points, under any given coordinate system. +/// Note: Ideally, a point collection trait should be any type of which coordinate elements can be +/// iterated. This is similar to `iter` method of many collection types in std. +/// +/// ```ignore +/// trait PointCollection<Coord> { +/// type PointIter<'a> : Iterator<Item = &'a Coord>; +/// fn iter(&self) -> PointIter<'a>; +/// } +/// ``` +/// +/// However, +/// [Generic Associated Types](https://github.com/rust-lang/rfcs/blob/master/text/1598-generic_associated_types.md) +/// is far away from stablize. +/// So currently we have the following workaround: +/// +/// Instead of implement the PointCollection trait on the element type itself, it implements on the +/// reference to the element. By doing so, we now have a well-defined lifetime for the iterator. +/// +/// In addition, for some element, the coordinate is computed on the fly, thus we can't hard-code +/// the iterator's return type is `&'a Coord`. +/// `Borrow` trait seems to strict in this case, since we don't need the order and hash +/// preservation properties at this point. However, `AsRef` doesn't work with `Coord` +/// +/// This workaround also leads overly strict lifetime bound on `ChartContext::draw_series`. +/// +/// TODO: Once GAT is ready on stable Rust, we should simplify the design. +/// +pub trait PointCollection<'a, Coord, CM = BackendCoordOnly> { + /// The item in point iterator + type Point: Borrow<Coord> + 'a; + + /// The point iterator + type IntoIter: IntoIterator<Item = Self::Point>; + + /// framework to do the coordinate mapping + fn point_iter(self) -> Self::IntoIter; +} +/// The trait indicates we are able to draw it on a drawing area +pub trait Drawable<DB: DrawingBackend, CM: CoordMapper = BackendCoordOnly> { + /// Actually draws the element. The key points is already translated into the + /// image coordinate and can be used by DC directly + fn draw<I: Iterator<Item = CM::Output>>( + &self, + pos: I, + backend: &mut DB, + parent_dim: (u32, u32), + ) -> Result<(), DrawingErrorKind<DB::ErrorType>>; +} + +/// Useful to translate from guest coordinates to backend coordinates +pub trait CoordMapper { + /// Specifies the output data from the translation + type Output; + /// Performs the translation from guest coordinates to backend coordinates + fn map<CT: CoordTranslate>(coord_trans: &CT, from: &CT::From, rect: &Rect) -> Self::Output; +} + +/// Used for 2d coordinate transformations. +pub struct BackendCoordOnly; + +impl CoordMapper for BackendCoordOnly { + type Output = BackendCoord; + fn map<CT: CoordTranslate>(coord_trans: &CT, from: &CT::From, rect: &Rect) -> BackendCoord { + rect.truncate(coord_trans.translate(from)) + } +} + +/** +Used for 3d coordinate transformations. + +See [`Cubiod`] for more information and an example. +*/ +pub struct BackendCoordAndZ; + +impl CoordMapper for BackendCoordAndZ { + type Output = (BackendCoord, i32); + fn map<CT: CoordTranslate>( + coord_trans: &CT, + from: &CT::From, + rect: &Rect, + ) -> (BackendCoord, i32) { + let coord = rect.truncate(coord_trans.translate(from)); + let z = coord_trans.depth(from); + (coord, z) + } +} diff --git a/vendor/plotters/src/element/pie.rs b/vendor/plotters/src/element/pie.rs new file mode 100644 index 000000000..95298345a --- /dev/null +++ b/vendor/plotters/src/element/pie.rs @@ -0,0 +1,240 @@ +use crate::{ + element::{Drawable, PointCollection}, + style::{IntoFont, RGBColor, TextStyle, BLACK}, +}; +use plotters_backend::{BackendCoord, DrawingBackend, DrawingErrorKind}; +use std::{error::Error, f64::consts::PI, fmt::Display}; + +#[derive(Debug)] +enum PieError { + LengthMismatch, +} +impl Display for PieError { + fn fmt(&self, f: &mut std::fmt::Formatter<'_>) -> std::fmt::Result { + match self { + &PieError::LengthMismatch => write!(f, "Length Mismatch"), + } + } +} + +impl Error for PieError {} + +/// A Pie Graph +pub struct Pie<'a, Coord, Label: Display> { + center: &'a Coord, // cartesian coord + radius: &'a f64, + sizes: &'a [f64], + colors: &'a [RGBColor], + labels: &'a [Label], + total: f64, + start_radian: f64, + label_style: TextStyle<'a>, + label_offset: f64, + percentage_style: Option<TextStyle<'a>>, +} + +impl<'a, Label: Display> Pie<'a, (i32, i32), Label> { + /// Build a Pie object. + /// Assumes a start angle at 0.0, which is aligned to the horizontal axis. + pub fn new( + center: &'a (i32, i32), + radius: &'a f64, + sizes: &'a [f64], + colors: &'a [RGBColor], + labels: &'a [Label], + ) -> Self { + // fold iterator to pre-calculate total from given slice sizes + let total = sizes.iter().sum(); + + // default label style and offset as 5% of the radius + let radius_5pct = radius * 0.05; + + // strong assumption that the background is white for legibility. + let label_style = TextStyle::from(("sans-serif", radius_5pct).into_font()).color(&BLACK); + Self { + center, + radius, + sizes, + colors, + labels, + total, + start_radian: 0.0, + label_style, + label_offset: radius_5pct, + percentage_style: None, + } + } + + /// Pass an angle in degrees to change the default. + /// Default is set to start at 0, which is aligned on the x axis. + /// ``` + /// use plotters::prelude::*; + /// let mut pie = Pie::new(&(50,50), &10.0, &[50.0, 25.25, 20.0, 5.5], &[RED, BLUE, GREEN, WHITE], &["Red", "Blue", "Green", "White"]); + /// pie.start_angle(-90.0); // retract to a right angle, so it starts aligned to a vertical Y axis. + /// ``` + pub fn start_angle(&mut self, start_angle: f64) { + // angle is more intuitive in degrees as an API, but we use it as radian offset internally. + self.start_radian = start_angle.to_radians(); + } + + /// + pub fn label_style<T: Into<TextStyle<'a>>>(&mut self, label_style: T) { + self.label_style = label_style.into(); + } + + /// Sets the offset to labels, to distanciate them further/closer from the center. + pub fn label_offset(&mut self, offset_to_radius: f64) { + self.label_offset = offset_to_radius + } + + /// enables drawing the wedge's percentage in the middle of the wedge, with the given style + pub fn percentages<T: Into<TextStyle<'a>>>(&mut self, label_style: T) { + self.percentage_style = Some(label_style.into()); + } +} + +impl<'a, DB: DrawingBackend, Label: Display> Drawable<DB> for Pie<'a, (i32, i32), Label> { + fn draw<I: Iterator<Item = BackendCoord>>( + &self, + _pos: I, + backend: &mut DB, + _parent_dim: (u32, u32), + ) -> Result<(), DrawingErrorKind<DB::ErrorType>> { + let mut offset_theta = self.start_radian; + + // const reused for every radian calculation + // the bigger the radius, the more fine-grained it should calculate + // to avoid being aliasing from being too noticeable. + // this all could be avoided if backend could draw a curve/bezier line as part of a polygon. + let radian_increment = PI / 180.0 / self.radius.sqrt() * 2.0; + let mut perc_labels = Vec::new(); + for (index, slice) in self.sizes.iter().enumerate() { + let slice_style = + self.colors + .get(index) + .ok_or_else(|| DrawingErrorKind::FontError(Box::new( + PieError::LengthMismatch, + )))?; + let label = self + .labels + .get(index) + .ok_or_else(|| DrawingErrorKind::FontError(Box::new( + PieError::LengthMismatch, + )))?; + // start building wedge line against the previous edge + let mut points = vec![*self.center]; + let ratio = slice / self.total; + let theta_final = ratio * 2.0 * PI + offset_theta; // end radian for the wedge + + // calculate middle for labels before mutating offset + let middle_theta = ratio * PI + offset_theta; + + // calculate every fraction of radian for the wedge, offsetting for every iteration, clockwise + // + // a custom Range such as `for theta in offset_theta..=theta_final` would be more elegant + // but f64 doesn't implement the Range trait, and it would requires the Step trait (increment by 1.0 or 0.0001?) + // which is unstable therefore cannot be implemented outside of std, even as a newtype for radians. + while offset_theta <= theta_final { + let coord = theta_to_ordinal_coord(*self.radius, offset_theta, self.center); + points.push(coord); + offset_theta += radian_increment; + } + // final point of the wedge may not fall exactly on a radian, so add it extra + let final_coord = theta_to_ordinal_coord(*self.radius, theta_final, self.center); + points.push(final_coord); + // next wedge calculation will start from previous wedges's last radian + offset_theta = theta_final; + + // draw wedge + // TODO: Currently the backend doesn't have API to draw an arc. We need add that in the + // future + backend.fill_polygon(points, slice_style)?; + + // label coords from the middle + let mut mid_coord = + theta_to_ordinal_coord(self.radius + self.label_offset, middle_theta, self.center); + + // ensure label's doesn't fall in the circle + let label_size = backend.estimate_text_size(&label.to_string(), &self.label_style)?; + // if on the left hand side of the pie, offset whole label to the left + if mid_coord.0 <= self.center.0 { + mid_coord.0 -= label_size.0 as i32; + } + // put label + backend.draw_text(&label.to_string(), &self.label_style, mid_coord)?; + if let Some(percentage_style) = &self.percentage_style { + let perc_label = format!("{:.1}%", (ratio * 100.0)); + let label_size = backend.estimate_text_size(&perc_label, percentage_style)?; + let text_x_mid = (label_size.0 as f64 / 2.0).round() as i32; + let text_y_mid = (label_size.1 as f64 / 2.0).round() as i32; + let perc_coord = theta_to_ordinal_coord( + self.radius / 2.0, + middle_theta, + &(self.center.0 - text_x_mid, self.center.1 - text_y_mid), + ); + // perc_coord.0 -= middle_label_size.0.round() as i32; + perc_labels.push((perc_label, perc_coord)); + } + } + // while percentages are generated during the first main iterations, + // they have to go on top of the already drawn wedges, so require a new iteration. + for (label, coord) in perc_labels { + let style = self.percentage_style.as_ref().unwrap(); + backend.draw_text(&label, style, coord)?; + } + Ok(()) + } +} + +impl<'a, Label: Display> PointCollection<'a, (i32, i32)> for &'a Pie<'a, (i32, i32), Label> { + type Point = &'a (i32, i32); + type IntoIter = std::iter::Once<&'a (i32, i32)>; + fn point_iter(self) -> std::iter::Once<&'a (i32, i32)> { + std::iter::once(self.center) + } +} + +fn theta_to_ordinal_coord(radius: f64, theta: f64, ordinal_offset: &(i32, i32)) -> (i32, i32) { + // polar coordinates are (r, theta) + // convert to (x, y) coord, with center as offset + + let (sin, cos) = theta.sin_cos(); + ( + // casting f64 to discrete i32 pixels coordinates is inevitably going to lose precision + // if plotters can support float coordinates, this place would surely benefit, especially for small sizes. + // so far, the result isn't so bad though + (radius * cos + ordinal_offset.0 as f64).round() as i32, // x + (radius * sin + ordinal_offset.1 as f64).round() as i32, // y + ) +} +#[cfg(test)] +mod test { + use super::*; + // use crate::prelude::*; + + #[test] + fn polar_coord_to_cartestian_coord() { + let coord = theta_to_ordinal_coord(800.0, 1.5_f64.to_radians(), &(5, 5)); + // rounded tends to be more accurate. this gets truncated to (804, 25) without rounding. + assert_eq!(coord, (805, 26)); //coord calculated from theta + } + #[test] + fn pie_calculations() { + let mut center = (5, 5); + let mut radius = 800.0; + + let sizes = vec![50.0, 25.0]; + // length isn't validated in new() + let colors = vec![]; + let labels: Vec<&str> = vec![]; + let pie = Pie::new(¢er, &radius, &sizes, &colors, &labels); + assert_eq!(pie.total, 75.0); // total calculated from sizes + + // not ownership greedy + center.1 += 1; + radius += 1.0; + assert!(colors.get(0).is_none()); + assert!(labels.get(0).is_none()); + assert_eq!(radius, 801.0); + } +} diff --git a/vendor/plotters/src/element/points.rs b/vendor/plotters/src/element/points.rs new file mode 100644 index 000000000..423625b08 --- /dev/null +++ b/vendor/plotters/src/element/points.rs @@ -0,0 +1,154 @@ +use super::*; +use super::{Drawable, PointCollection}; +use crate::style::{Color, ShapeStyle, SizeDesc}; +use plotters_backend::{BackendCoord, DrawingBackend, DrawingErrorKind}; + +/** +A common trait for elements that can be interpreted as points: A cross, a circle, a triangle marker... + +This is used internally by Plotters and should probably not be included in user code. +See [`EmptyElement`] for more information and examples. +*/ +pub trait PointElement<Coord, Size: SizeDesc> { + /** + Point creator. + + This is used internally by Plotters and should probably not be included in user code. + See [`EmptyElement`] for more information and examples. + */ + fn make_point(pos: Coord, size: Size, style: ShapeStyle) -> Self; +} + +/** +A cross marker for visualizing data series. + +See [`EmptyElement`] for more information and examples. +*/ +pub struct Cross<Coord, Size: SizeDesc> { + center: Coord, + size: Size, + style: ShapeStyle, +} + +impl<Coord, Size: SizeDesc> Cross<Coord, Size> { + /** + Creates a cross marker. + + See [`EmptyElement`] for more information and examples. + */ + pub fn new<T: Into<ShapeStyle>>(coord: Coord, size: Size, style: T) -> Self { + Self { + center: coord, + size, + style: style.into(), + } + } +} + +impl<'a, Coord: 'a, Size: SizeDesc> PointCollection<'a, Coord> for &'a Cross<Coord, Size> { + type Point = &'a Coord; + type IntoIter = std::iter::Once<&'a Coord>; + fn point_iter(self) -> std::iter::Once<&'a Coord> { + std::iter::once(&self.center) + } +} + +impl<Coord, DB: DrawingBackend, Size: SizeDesc> Drawable<DB> for Cross<Coord, Size> { + fn draw<I: Iterator<Item = BackendCoord>>( + &self, + mut points: I, + backend: &mut DB, + ps: (u32, u32), + ) -> Result<(), DrawingErrorKind<DB::ErrorType>> { + if let Some((x, y)) = points.next() { + let size = self.size.in_pixels(&ps); + let (x0, y0) = (x - size, y - size); + let (x1, y1) = (x + size, y + size); + backend.draw_line((x0, y0), (x1, y1), &self.style)?; + backend.draw_line((x0, y1), (x1, y0), &self.style)?; + } + Ok(()) + } +} + +/** +A triangle marker for visualizing data series. + +See [`EmptyElement`] for more information and examples. +*/ +pub struct TriangleMarker<Coord, Size: SizeDesc> { + center: Coord, + size: Size, + style: ShapeStyle, +} + +impl<Coord, Size: SizeDesc> TriangleMarker<Coord, Size> { + /** + Creates a triangle marker. + + See [`EmptyElement`] for more information and examples. + */ + pub fn new<T: Into<ShapeStyle>>(coord: Coord, size: Size, style: T) -> Self { + Self { + center: coord, + size, + style: style.into(), + } + } +} + +impl<'a, Coord: 'a, Size: SizeDesc> PointCollection<'a, Coord> for &'a TriangleMarker<Coord, Size> { + type Point = &'a Coord; + type IntoIter = std::iter::Once<&'a Coord>; + fn point_iter(self) -> std::iter::Once<&'a Coord> { + std::iter::once(&self.center) + } +} + +impl<Coord, DB: DrawingBackend, Size: SizeDesc> Drawable<DB> for TriangleMarker<Coord, Size> { + fn draw<I: Iterator<Item = BackendCoord>>( + &self, + mut points: I, + backend: &mut DB, + ps: (u32, u32), + ) -> Result<(), DrawingErrorKind<DB::ErrorType>> { + if let Some((x, y)) = points.next() { + let size = self.size.in_pixels(&ps); + let points = [-90, -210, -330] + .iter() + .map(|deg| f64::from(*deg) * std::f64::consts::PI / 180.0) + .map(|rad| { + ( + (rad.cos() * f64::from(size) + f64::from(x)).ceil() as i32, + (rad.sin() * f64::from(size) + f64::from(y)).ceil() as i32, + ) + }); + backend.fill_polygon(points, &self.style.color.to_backend_color())?; + } + Ok(()) + } +} + +impl<Coord, Size: SizeDesc> PointElement<Coord, Size> for Cross<Coord, Size> { + fn make_point(pos: Coord, size: Size, style: ShapeStyle) -> Self { + Self::new(pos, size, style) + } +} + +impl<Coord, Size: SizeDesc> PointElement<Coord, Size> for TriangleMarker<Coord, Size> { + fn make_point(pos: Coord, size: Size, style: ShapeStyle) -> Self { + Self::new(pos, size, style) + } +} + +impl<Coord, Size: SizeDesc> PointElement<Coord, Size> for Circle<Coord, Size> { + fn make_point(pos: Coord, size: Size, style: ShapeStyle) -> Self { + Self::new(pos, size, style) + } +} + +impl<Coord, Size: SizeDesc> PointElement<Coord, Size> for Pixel<Coord> { + fn make_point(pos: Coord, _: Size, style: ShapeStyle) -> Self { + Self::new(pos, style) + } +} diff --git a/vendor/plotters/src/element/text.rs b/vendor/plotters/src/element/text.rs new file mode 100644 index 000000000..ca813c7c9 --- /dev/null +++ b/vendor/plotters/src/element/text.rs @@ -0,0 +1,242 @@ +use std::borrow::Borrow; +use std::i32; + +use super::{Drawable, PointCollection}; +use crate::style::{FontDesc, FontResult, LayoutBox, TextStyle}; +use plotters_backend::{BackendCoord, DrawingBackend, DrawingErrorKind}; + +/// A single line text element. This can be owned or borrowed string, dependents on +/// `String` or `str` moved into. +pub struct Text<'a, Coord, T: Borrow<str>> { + text: T, + coord: Coord, + style: TextStyle<'a>, +} + +impl<'a, Coord, T: Borrow<str>> Text<'a, Coord, T> { + /// Create a new text element + /// - `text`: The text for the element + /// - `points`: The upper left conner for the text element + /// - `style`: The text style + /// - Return the newly created text element + pub fn new<S: Into<TextStyle<'a>>>(text: T, points: Coord, style: S) -> Self { + Self { + text, + coord: points, + style: style.into(), + } + } +} + +impl<'b, 'a, Coord: 'a, T: Borrow<str> + 'a> PointCollection<'a, Coord> for &'a Text<'b, Coord, T> { + type Point = &'a Coord; + type IntoIter = std::iter::Once<&'a Coord>; + fn point_iter(self) -> Self::IntoIter { + std::iter::once(&self.coord) + } +} + +impl<'a, Coord: 'a, DB: DrawingBackend, T: Borrow<str>> Drawable<DB> for Text<'a, Coord, T> { + fn draw<I: Iterator<Item = BackendCoord>>( + &self, + mut points: I, + backend: &mut DB, + _: (u32, u32), + ) -> Result<(), DrawingErrorKind<DB::ErrorType>> { + if let Some(a) = points.next() { + return backend.draw_text(self.text.borrow(), &self.style, a); + } + Ok(()) + } +} + +/// An multi-line text element. The `Text` element allows only single line text +/// and the `MultiLineText` supports drawing multiple lines +pub struct MultiLineText<'a, Coord, T: Borrow<str>> { + lines: Vec<T>, + coord: Coord, + style: TextStyle<'a>, + line_height: f64, +} + +impl<'a, Coord, T: Borrow<str>> MultiLineText<'a, Coord, T> { + /// Create an empty multi-line text element. + /// Lines can be append to the empty multi-line by calling `push_line` method + /// + /// `pos`: The upper left corner + /// `style`: The style of the text + pub fn new<S: Into<TextStyle<'a>>>(pos: Coord, style: S) -> Self { + MultiLineText { + lines: vec![], + coord: pos, + style: style.into(), + line_height: 1.25, + } + } + + /// Set the line height of the multi-line text element + pub fn set_line_height(&mut self, value: f64) -> &mut Self { + self.line_height = value; + self + } + + /// Push a new line into the given multi-line text + /// `line`: The line to be pushed + pub fn push_line<L: Into<T>>(&mut self, line: L) { + self.lines.push(line.into()); + } + + /// Estimate the multi-line text element's dimension + pub fn estimate_dimension(&self) -> FontResult<(i32, i32)> { + let (mut mx, mut my) = (0, 0); + + for ((x, y), t) in self.layout_lines((0, 0)).zip(self.lines.iter()) { + let (dx, dy) = self.style.font.box_size(t.borrow())?; + mx = mx.max(x + dx as i32); + my = my.max(y + dy as i32); + } + + Ok((mx, my)) + } + + /// Move the location to the specified location + pub fn relocate(&mut self, coord: Coord) { + self.coord = coord + } + + fn layout_lines(&self, (x0, y0): BackendCoord) -> impl Iterator<Item = BackendCoord> { + let font_height = self.style.font.get_size(); + let actual_line_height = font_height * self.line_height; + (0..self.lines.len() as u32).map(move |idx| { + let y = f64::from(y0) + f64::from(idx) * actual_line_height; + // TODO: Support text alignment as well, currently everything is left aligned + let x = f64::from(x0); + (x.round() as i32, y.round() as i32) + }) + } +} + +fn layout_multiline_text<'a, F: FnMut(&'a str)>( + text: &'a str, + max_width: u32, + font: FontDesc<'a>, + mut func: F, +) { + for line in text.lines() { + if max_width == 0 || line.is_empty() { + func(line); + } else { + let mut remaining = &line[0..]; + + while !remaining.is_empty() { + let mut left = 0; + while left < remaining.len() { + let width = font.box_size(&remaining[0..=left]).unwrap_or((0, 0)).0 as i32; + + if width > max_width as i32 { + break; + } + left += 1; + } + + if left == 0 { + left += 1; + } + + let cur_line = &remaining[..left]; + remaining = &remaining[left..]; + + func(cur_line); + } + } + } +} + +impl<'a, T: Borrow<str>> MultiLineText<'a, BackendCoord, T> { + /// Compute the line layout + pub fn compute_line_layout(&self) -> FontResult<Vec<LayoutBox>> { + let mut ret = vec![]; + for ((x, y), t) in self.layout_lines(self.coord).zip(self.lines.iter()) { + let (dx, dy) = self.style.font.box_size(t.borrow())?; + ret.push(((x, y), (x + dx as i32, y + dy as i32))); + } + Ok(ret) + } +} + +impl<'a, Coord> MultiLineText<'a, Coord, &'a str> { + /// Parse a multi-line text into an multi-line element. + /// + /// `text`: The text that is parsed + /// `pos`: The position of the text + /// `style`: The style for this text + /// `max_width`: The width of the multi-line text element, the line will break + /// into two lines if the line is wider than the max_width. If 0 is given, do not + /// do any line wrapping + pub fn from_str<ST: Into<&'a str>, S: Into<TextStyle<'a>>>( + text: ST, + pos: Coord, + style: S, + max_width: u32, + ) -> Self { + let text = text.into(); + let mut ret = MultiLineText::new(pos, style); + + layout_multiline_text(text, max_width, ret.style.font.clone(), |l| { + ret.push_line(l) + }); + ret + } +} + +impl<'a, Coord> MultiLineText<'a, Coord, String> { + /// Parse a multi-line text into an multi-line element. + /// + /// `text`: The text that is parsed + /// `pos`: The position of the text + /// `style`: The style for this text + /// `max_width`: The width of the multi-line text element, the line will break + /// into two lines if the line is wider than the max_width. If 0 is given, do not + /// do any line wrapping + pub fn from_string<S: Into<TextStyle<'a>>>( + text: String, + pos: Coord, + style: S, + max_width: u32, + ) -> Self { + let mut ret = MultiLineText::new(pos, style); + + layout_multiline_text(text.as_str(), max_width, ret.style.font.clone(), |l| { + ret.push_line(l.to_string()) + }); + ret + } +} + +impl<'b, 'a, Coord: 'a, T: Borrow<str> + 'a> PointCollection<'a, Coord> + for &'a MultiLineText<'b, Coord, T> +{ + type Point = &'a Coord; + type IntoIter = std::iter::Once<&'a Coord>; + fn point_iter(self) -> Self::IntoIter { + std::iter::once(&self.coord) + } +} + +impl<'a, Coord: 'a, DB: DrawingBackend, T: Borrow<str>> Drawable<DB> + for MultiLineText<'a, Coord, T> +{ + fn draw<I: Iterator<Item = BackendCoord>>( + &self, + mut points: I, + backend: &mut DB, + _: (u32, u32), + ) -> Result<(), DrawingErrorKind<DB::ErrorType>> { + if let Some(a) = points.next() { + for (point, text) in self.layout_lines(a).zip(self.lines.iter()) { + backend.draw_text(text.borrow(), &self.style, point)?; + } + } + Ok(()) + } +} diff --git a/vendor/plotters/src/evcxr.rs b/vendor/plotters/src/evcxr.rs new file mode 100644 index 000000000..8117d35f1 --- /dev/null +++ b/vendor/plotters/src/evcxr.rs @@ -0,0 +1,69 @@ +use crate::coord::Shift; +use crate::drawing::{DrawingArea, IntoDrawingArea}; +use plotters_backend::DrawingBackend; +use plotters_svg::SVGBackend; + +#[cfg(feature = "evcxr_bitmap")] +use plotters_bitmap::BitMapBackend; + +/// The wrapper for the generated SVG +pub struct SVGWrapper(String, String); + +impl SVGWrapper { + /// Displays the contents of the `SVGWrapper` struct. + pub fn evcxr_display(&self) { + println!("{:?}", self); + } + /// Sets the style of the `SVGWrapper` struct. + pub fn style<S: Into<String>>(mut self, style: S) -> Self { + self.1 = style.into(); + self + } +} + +impl std::fmt::Debug for SVGWrapper { + fn fmt(&self, formatter: &mut std::fmt::Formatter) -> std::fmt::Result { + let svg = self.0.as_str(); + write!( + formatter, + "EVCXR_BEGIN_CONTENT text/html\n<div style=\"{}\">{}</div>\nEVCXR_END_CONTENT", + self.1, svg + ) + } +} + +/// Start drawing an evcxr figure +pub fn evcxr_figure< + Draw: FnOnce(DrawingArea<SVGBackend, Shift>) -> Result<(), Box<dyn std::error::Error>>, +>( + size: (u32, u32), + draw: Draw, +) -> SVGWrapper { + let mut buffer = "".to_string(); + let root = SVGBackend::with_string(&mut buffer, size).into_drawing_area(); + draw(root).expect("Drawing failure"); + SVGWrapper(buffer, "".to_string()) +} + +/// Start drawing an evcxr figure +#[cfg(feature = "evcxr_bitmap")] +pub fn evcxr_bitmap_figure< + Draw: FnOnce(DrawingArea<BitMapBackend, Shift>) -> Result<(), Box<dyn std::error::Error>>, +>( + size: (u32, u32), + draw: Draw, +) -> SVGWrapper { + const PIXEL_SIZE : usize = 3; + let mut buf = Vec::new(); + buf.resize((size.0 as usize) * (size.1 as usize) * PIXEL_SIZE, 0); + let root = BitMapBackend::with_buffer(&mut buf, size).into_drawing_area(); + draw(root).expect("Drawing failure"); + let mut buffer = "".to_string(); + { + let mut svg_root = SVGBackend::with_string(&mut buffer, size); + svg_root + .blit_bitmap((0, 0), size, &buf) + .expect("Failure converting to SVG"); + } + SVGWrapper(buffer, "".to_string()) +} diff --git a/vendor/plotters/src/lib.rs b/vendor/plotters/src/lib.rs new file mode 100644 index 000000000..873288b2b --- /dev/null +++ b/vendor/plotters/src/lib.rs @@ -0,0 +1,889 @@ +#![warn(missing_docs)] +/*! + +# Plotters - A Rust drawing library focus on data plotting for both WASM and native applications 🦀📈🚀 + +<a href="https://crates.io/crates/plotters"> + <img style="display: inline!important" src="https://img.shields.io/crates/v/plotters.svg"></img> +</a> +<a href="https://docs.rs/plotters"> + <img style="display: inline!important" src="https://docs.rs/plotters/badge.svg"></img> +</a> +<a href="https://docs.rs/plotters"> + <img style="display: inline!important" src="https://img.shields.io/crates/d/plotters"></img> +</a> +<a href="https://plotters-rs.github.io/rustdoc/plotters/"> + <img style="display: inline! important" src="https://img.shields.io/badge/docs-development-lightgrey.svg"></img> +</a> + +Plotters is drawing library designed for rendering figures, plots, and charts, in pure rust. Plotters supports various types of back-ends, +including bitmap, vector graph, piston window, GTK/Cairo and WebAssembly. + +- A new Plotters Developer's Guide is working in progress. The preview version is available at [here](https://plotters-rs.github.io/book). +- To try Plotters with interactive Jupyter notebook, or view [here](https://plotters-rs.github.io/plotters-doc-data/evcxr-jupyter-integration.html) for the static HTML version. +- To view the WASM example, go to this [link](https://plotters-rs.github.io/wasm-demo/www/index.html) +- Currently we have all the internal code ready for console plotting, but a console based backend is still not ready. See [this example](https://github.com/38/plotters/blob/master/examples/console.rs) for how to plotting on Console with a customized backend. +- Plotters now moved all backend code to sperate repositories, check [FAQ list](#faq-list) for details +- Some interesting [demo projects](#demo-projects) are available, feel free to try them out. + +## Gallery + +<div class="galleryItem"> + <a href="https://plotters-rs.github.io/plotters-doc-data/sample.png"> + <img src="https://plotters-rs.github.io/plotters-doc-data/sample.png" class="galleryItem"></img> + </a> + <div class="galleryText"> + Multiple Plot + <a href="https://github.com/38/plotters/blob/master/plotters/examples/chart.rs">[code]</a> + </div> +</div> + +<div class="galleryItem"> + <a href="https://plotters-rs.github.io/plotters-doc-data/stock.png"> + <img src="https://plotters-rs.github.io/plotters-doc-data/stock.png" class="galleryItem"></img> + </a> + <div class="galleryText"> + Candlestick Plot + <a href="https://github.com/38/plotters/blob/master/plotters/examples/stock.rs">[code]</a> + </div> +</div> + +<div class="galleryItem"> + <a href="https://plotters-rs.github.io/plotters-doc-data/histogram.png"> + <img src="https://plotters-rs.github.io/plotters-doc-data/histogram.png" class="galleryItem"></img> + </a> + <div class="galleryText"> + Histogram + <a href="https://github.com/38/plotters/blob/master/plotters/examples/histogram.rs">[code]</a> + </div> +</div> + +<div class="galleryItem"> + <a href="https://plotters-rs.github.io/plotters-doc-data/0.png"> + <img src="https://plotters-rs.github.io/plotters-doc-data/0.png" class="galleryItem"></img> + </a> + <div class="galleryText"> + Simple Chart + </div> +</div> + +<div class="galleryItem"> + <a href="https://plotters-rs.github.io/plotters-doc-data/console-2.png"> + <img src="https://plotters-rs.github.io/plotters-doc-data/console-2.png" class="galleryItem"></img> + </a> + <div class="galleryText"> + Plotting the Console + </div> +</div> + +<div class="galleryItem"> + <a href="https://plotters-rs.github.io/plotters-doc-data/mandelbrot.png"> + <img src="https://plotters-rs.github.io/plotters-doc-data/mandelbrot.png" class="galleryItem"></img> + </a> + <div class="galleryText"> + Mandelbrot set + <a href="https://github.com/38/plotters/blob/master/plotters/examples/mandelbrot.rs">[code]</a> + </div> +</div> + + +<div class="galleryItem"> + <a href="https://plotters-rs.github.io/plotters-doc-data/evcxr_animation.gif"> + <img src="https://plotters-rs.github.io/plotters-doc-data/evcxr_animation.gif" class="galleryItem"></img> + </a> + <div class="galleryText"> + Jupyter Support + </div> +</div> + +<div class="galleryItem"> + <a href="https://plotters-rs.github.io/plotters-doc-data/plotters-piston.gif"> + <img src="https://plotters-rs.github.io/plotters-doc-data/plotters-piston.gif" class="galleryItem"></img> + </a> + <div class="galleryText"> + Real-time Rendering + <a href="https://github.com/plotters-rs/plotters-piston/blob/master/examples/cpustat.rs">[code]</a> + </div> +</div> + +<div class="galleryItem"> + <a href="https://plotters-rs.github.io/plotters-doc-data/normal-dist.png"> + <img src="https://plotters-rs.github.io/plotters-doc-data/normal-dist.png" class="galleryItem"></img> + </a> + <div class="galleryText"> + Histogram with Scatter + <a href="https://github.com/38/plotters/blob/master/plotters/examples/normal-dist.rs">[code]</a> + </div> +</div> + +<div class="galleryItem"> + <a href="https://plotters-rs.github.io/plotters-doc-data/twoscale.png"> + <img src="https://plotters-rs.github.io/plotters-doc-data/twoscale.png" class="galleryItem"></img> + </a> + <div class="galleryText"> + Dual Y-Axis Example + <a href="https://github.com/38/plotters/blob/master/plotters/examples/two-scales.rs">[code]</a> + </div> +</div> + +<div class="galleryItem"> + <a href="https://plotters-rs.github.io/plotters-doc-data/matshow.png"> + <img src="https://plotters-rs.github.io/plotters-doc-data/matshow.png" class="galleryItem"></img> + </a> + <div class="galleryText"> + The Matplotlib Matshow Example + <a href="https://github.com/38/plotters/blob/master/plotters/examples/matshow.rs">[code]</a> + </div> +</div> + +<div class="galleryItem"> + <a href="https://plotters-rs.github.io/plotters-doc-data/sierpinski.png"> + <img src="https://plotters-rs.github.io/plotters-doc-data/sierpinski.png" class="galleryItem"></img> + </a> + <div class="galleryText"> + The Sierpinski Carpet + <a href="https://github.com/38/plotters/blob/master/plotters/examples/sierpinski.rs">[code]</a> + </div> +</div> + +<div class="galleryItem"> + <a href="https://plotters-rs.github.io/plotters-doc-data/normal-dist2.png"> + <img src="https://plotters-rs.github.io/plotters-doc-data/normal-dist2.png" class="galleryItem"></img> + </a> + <div class="galleryText"> + The 1D Gaussian Distribution + <a href="https://github.com/38/plotters/blob/master/plotters/examples/nomal-dist2.rs">[code]</a> + </div> +</div> + +<div class="galleryItem"> + <a href="https://plotters-rs.github.io/plotters-doc-data/errorbar.png"> + <img src="https://plotters-rs.github.io/plotters-doc-data/errorbar.png" class="galleryItem"></img> + </a> + <div class="galleryText"> + The 1D Gaussian Distribution + <a href="https://github.com/38/plotters/blob/master/plotters/examples/errorbar.rs">[code]</a> + </div> +</div> + +<div class="galleryItem"> + <a href="https://plotters-rs.github.io/plotters-doc-data/slc-temp.png"> + <img src="https://plotters-rs.github.io/plotters-doc-data/slc-temp.png" class="galleryItem"></img> + </a> + <div class="galleryText"> + Monthly Time Coordinate + <a href="https://github.com/38/plotters/blob/master/plotters/examples/slc-temp.rs">[code]</a> + </div> +</div> + +<div class="galleryItem"> + <a href="https://plotters-rs.github.io/plotters-doc-data/area-chart.png"> + <img src="https://plotters-rs.github.io/plotters-doc-data/area-chart.png" class="galleryItem"></img> + </a> + <div class="galleryText"> + Monthly Time Coordinate + <a href="https://github.com/38/plotters/blob/master/plotters/examples/area-chart.rs">[code]</a> + </div> +</div> + +<div class="galleryItem"> + <a href="https://plotters-rs.github.io/plotters-doc-data/snowflake.png"> + <img src="https://plotters-rs.github.io/plotters-doc-data/snowflake.png" class="galleryItem"></img> + </a> + <div class="galleryText"> + Koch Snowflake + <a href="https://github.com/38/plotters/blob/master/plotters/examples/snowflake.rs">[code]</a> + </div> +</div> + + +<div class="galleryItem"> + <a href="https://plotters-rs.github.io/plotters-doc-data/animation.gif"> + <img src="https://plotters-rs.github.io/plotters-doc-data/animation.gif" class="galleryItem"></img> + </a> + <div class="galleryText"> + Koch Snowflake Animation + <a href="https://github.com/38/plotters/blob/master/plotters/examples/animation.rs">[code]</a> + </div> +</div> + + +<div class="galleryItem"> + <a href="https://plotters-rs.github.io/plotters-doc-data/console.png"> + <img src="https://plotters-rs.github.io/plotters-doc-data/console.png" class="galleryItem"></img> + </a> + <div class="galleryText"> + Drawing on a Console + <a href="https://github.com/38/plotters/blob/master/plotters/examples/console.rs">[code]</a> + </div> +</div> + +<div class="galleryItem"> + <a href="https://plotters-rs.github.io/plotters-doc-data/blit-bitmap.png"> + <img src="https://plotters-rs.github.io/plotters-doc-data/blit-bitmap.png" class="galleryItem"></img> + </a> + <div class="galleryText"> + Drawing bitmap on chart + <a href="https://github.com/38/plotters/blob/master/plotters/examples/blit-bitmap.rs">[code]</a> + </div> +</div> + +<div class="galleryItem"> + <a href="https://plotters-rs.github.io/plotters-doc-data/boxplot.svg"> + <img src="https://plotters-rs.github.io/plotters-doc-data/boxplot.svg" class="galleryItem"></img> + </a> + <div class="galleryText"> + The boxplot demo + <a href="https://github.com/38/plotters/blob/master/plotters/examples/boxplot.rs">[code]</a> + </div> +</div> + +<div class="galleryItem"> + <a href="https://plotters-rs.github.io/plotters-doc-data/3d-plot.svg"> + <img src="https://plotters-rs.github.io/plotters-doc-data/3d-plot.svg" class="galleryItem"></img> + </a> + <div class="galleryText"> + 3D plot rendering + <a href="https://github.com/38/plotters/blob/master/plotters/examples/3d-plot.rs">[code]</a> + </div> +</div> + +<div class="galleryItem"> + <a href="https://plotters-rs.github.io/plotters-doc-data/3d-plot2.gif"> + <img src="https://plotters-rs.github.io/plotters-doc-data/3d-plot2.gif" class="galleryItem"></img> + </a> + <div class="galleryText"> + 2-Var Gussian Distribution PDF + <a href="https://github.com/38/plotters/blob/master/plotters/examples/3d-plot2.rs">[code]</a> + </div> +</div> + +<div class="galleryItem"> + <a href="https://plotters-rs.github.io/plotters-doc-data/tick_control.svg"> + <img src="https://plotters-rs.github.io/plotters-doc-data/tick_control.svg" class="galleryItem"></img> + </a> + <div class="galleryText"> + COVID-19 Visualization + <a href="https://github.com/38/plotters/blob/master/plotters/examples/tick_control.rs">[code]</a> + </div> +</div> + + +## Table of Contents + * [Gallery](#gallery) + * [Dependencies](#dependencies) + + [Ubuntu Linux](#ubuntu-linux) + * [Quick Start](#quick-start) + * [Demo Projects](#demo-projects) + * [Trying with Jupyter evcxr Kernel Interactively](#trying-with-jupyter-evcxr-kernel-interactively) + * [Interactive Tutorial with Jupyter Notebook](#interactive-tutorial-with-jupyter-notebook) + * [Plotting in Rust](#plotting-in-rust) + * [Plotting on HTML5 canvas with WASM Backend](#plotting-on-html5-canvas-with-wasm-backend) + * [What types of figure are supported?](#what-types-of-figure-are-supported) + * [Concepts by examples](#concepts-by-examples) + + [Drawing Back-ends](#drawing-back-ends) + + [Drawing Area](#drawing-area) + + [Elements](#elements) + + [Composable Elements](#composable-elements) + + [Chart Context](#chart-context) + * [Misc](#misc) + + [Development Version](#development-version) + + [Reducing Depending Libraries && Turning Off Backends](#reducing-depending-libraries--turning-off-backends) + + [List of Features](#list-of-features) + * [FAQ List](#faq-list) + +## Dependencies + +### Ubuntu Linux + + ```sudo apt install pkg-config libfreetype6-dev libfontconfig1-dev``` + +## Quick Start + +To use Plotters, you can simply add Plotters into your `Cargo.toml` +```toml +[dependencies] +plotters = "0.3.1" +``` + +And the following code draws a quadratic function. `src/main.rs`, + +```rust +use plotters::prelude::*; +fn main() -> Result<(), Box<dyn std::error::Error>> { + let root = BitMapBackend::new("plotters-doc-data/0.png", (640, 480)).into_drawing_area(); + root.fill(&WHITE)?; + let mut chart = ChartBuilder::on(&root) + .caption("y=x^2", ("sans-serif", 50).into_font()) + .margin(5) + .x_label_area_size(30) + .y_label_area_size(30) + .build_cartesian_2d(-1f32..1f32, -0.1f32..1f32)?; + + chart.configure_mesh().draw()?; + + chart + .draw_series(LineSeries::new( + (-50..=50).map(|x| x as f32 / 50.0).map(|x| (x, x * x)), + &RED, + ))? + .label("y = x^2") + .legend(|(x, y)| PathElement::new(vec![(x, y), (x + 20, y)], &RED)); + + chart + .configure_series_labels() + .background_style(&WHITE.mix(0.8)) + .border_style(&BLACK) + .draw()?; + + root.present()?; + + Ok(()) +} +``` + + + +## Demo Projects + +To learn how to use Plotters in different scenarios by checking out the following demo projects: + +- WebAssembly + Plotters: [plotters-wasm-demo](https://github.com/plotters-rs/plotters-wasm-demo) +- minifb + Plotters: [plotters-minifb-demo](https://github.com/plotters-rs/plotters-minifb-demo) +- GTK + Plotters: [plotters-gtk-demo](https://github.com/plotters/plotters-gtk-demo) + + +## Trying with Jupyter evcxr Kernel Interactively + +Plotters now supports integrate with `evcxr` and is able to interactively drawing plots in Jupyter Notebook. +The feature `evcxr` should be enabled when including Plotters to Jupyter Notebook. + +The following code shows a minimal example of this. + +```text +:dep plotters = { git = "https://github.com/38/plotters", default_features = false, features = ["evcxr"] } +extern crate plotters; +use plotters::prelude::*; + +let figure = evcxr_figure((640, 480), |root| { + root.fill(&WHITE); + let mut chart = ChartBuilder::on(&root) + .caption("y=x^2", ("Arial", 50).into_font()) + .margin(5) + .x_label_area_size(30) + .y_label_area_size(30) + .build_cartesian_2d(-1f32..1f32, -0.1f32..1f32)?; + + chart.configure_mesh().draw()?; + + chart.draw_series(LineSeries::new( + (-50..=50).map(|x| x as f32 / 50.0).map(|x| (x, x * x)), + &RED, + )).unwrap() + .label("y = x^2") + .legend(|(x,y)| PathElement::new(vec![(x,y), (x + 20,y)], &RED)); + + chart.configure_series_labels() + .background_style(&WHITE.mix(0.8)) + .border_style(&BLACK) + .draw()?; + Ok(()) +}); +figure +``` + +<img src="https://plotters-rs.github.io/plotters-doc-data/evcxr_animation.gif" width="450px"></img> + +## Interactive Tutorial with Jupyter Notebook + +*This tutorial is now working in progress and isn't complete* + +Thanks to the evcxr, now we have an interactive tutorial for Plotters! +To use the interactive notebook, you must have Jupyter and evcxr installed on your computer. +Follow the instruction on [this page](https://github.com/google/evcxr/tree/master/evcxr_jupyter) below to install it. + +After that, you should be able to start your Jupyter server locally and load the tutorial! + +```bash +git clone https://github.com/38/plotters-doc-data +cd plotteres-doc-data +jupyter notebook +``` + +And select the notebook called `evcxr-jupyter-integration.ipynb`. + +Also, there's a static HTML version of this notebook available at the [this location](https://plotters-rs.github.io/plotters-doc-data/evcxr-jupyter-integration.html) + +## Plotting in Rust + +Rust is a perfect language for data visualization. Although there are many mature visualization libraries in many different languages. +But Rust is one of the best languages fits the need. + +* **Easy to use** Rust has a very good iterator system built into the standard library. With the help of iterators, +Plotting in Rust can be as easy as most of the high-level programming languages. The Rust based plotting library +can be very easy to use. + +* **Fast** If you need rendering a figure with trillions of data points, +Rust is a good choice. Rust's performance allows you to combine data processing step +and rendering step into a single application. When plotting in high-level programming languages, +e.g. Javascript or Python, data points must be down-sampled before feeding into the plotting +program because of the performance considerations. Rust is fast enough to do the data processing and visualization +within a single program. You can also integrate the +figure rendering code into your application handling a huge amount of data and visualize it in real-time. + +* **WebAssembly Support** Rust is one of few the language with the best WASM support. Plotting in Rust could be +very useful for visualization on a web page and would have a huge performance improvement comparing to Javascript. + +## Plotting on HTML5 canvas with WASM Backend + +Plotters currently supports backend that uses the HTML5 canvas. To use the WASM support, you can simply use +`CanvasBackend` instead of other backend and all other API remains the same! + +There's a small demo for Plotters + WASM available at [here](https://github.com/plotters-rs/plotters-wasm-demo). +To play with the deployed version, follow this [link](https://plotters-rs.github.io/wasm-demo/www/index.html). + + +## What types of figure are supported? + +Plotters is not limited to any specific type of figure. +You can create your own types of figures easily with the Plotters API. + +But Plotters provides some builtin figure types for convenience. +Currently, we support line series, point series, candlestick series, and histogram. +And the library is designed to be able to render multiple figure into a single image. +But Plotter is aimed to be a platform that is fully extendable to support any other types of figure. + +## Concepts by examples + +### Drawing Back-ends +Plotters can use different drawing back-ends, including SVG, BitMap, and even real-time rendering. For example, a bitmap drawing backend. + +```rust +use plotters::prelude::*; +fn main() -> Result<(), Box<dyn std::error::Error>> { + // Create a 800*600 bitmap and start drawing + let mut backend = BitMapBackend::new("plotters-doc-data/1.png", (300, 200)); + // And if we want SVG backend + // let backend = SVGBackend::new("output.svg", (800, 600)); + backend.draw_rect((50, 50), (200, 150), &RED, true)?; + backend.present()?; + Ok(()) +} +``` + + + +### Drawing Area +Plotters uses a concept called drawing area for layout purpose. +Plotters support multiple integrating into a single image. +This is done by creating sub-drawing-areas. + +Besides that, the drawing area also allows the customized coordinate system, by doing so, the coordinate mapping is done by the drawing area automatically. + +```rust +use plotters::prelude::*; +fn main() -> Result<(), Box<dyn std::error::Error>> { + let root_drawing_area = + BitMapBackend::new("plotters-doc-data/2.png", (300, 200)).into_drawing_area(); + // And we can split the drawing area into 3x3 grid + let child_drawing_areas = root_drawing_area.split_evenly((3, 3)); + // Then we fill the drawing area with different color + for (area, color) in child_drawing_areas.into_iter().zip(0..) { + area.fill(&Palette99::pick(color))?; + } + root_drawing_area.present()?; + Ok(()) +} +``` + + + +### Elements + +In Plotters, elements are build blocks of figures. All elements are able to draw on a drawing area. +There are different types of built-in elements, like lines, texts, circles, etc. +You can also define your own element in the application code. + +You may also combine existing elements to build a complex element. + +To learn more about the element system, please read the [element module documentation](./element/index.html). + +```rust +use plotters::prelude::*; +fn main() -> Result<(), Box<dyn std::error::Error>> { + let root = BitMapBackend::new("plotters-doc-data/3.png", (300, 200)).into_drawing_area(); + root.fill(&WHITE)?; + // Draw an circle on the drawing area + root.draw(&Circle::new( + (100, 100), + 50, + Into::<ShapeStyle>::into(&GREEN).filled(), + ))?; + root.present()?; + Ok(()) +} +``` + + + +### Composable Elements + +Besides the built-in elements, elements can be composed into a logic group we called composed elements. +When composing new elements, the upper-left corner is given in the target coordinate, and a new pixel-based +coordinate which has the upper-left corner defined as `(0,0)` is used for further element composition purpose. + +For example, we can have an element which includes a dot and its coordinate. + +```rust +use plotters::prelude::*; +use plotters::coord::types::RangedCoordf32; + +fn main() -> Result<(), Box<dyn std::error::Error>> { + let root = BitMapBackend::new("plotters-doc-data/4.png", (640, 480)).into_drawing_area(); + + root.fill(&RGBColor(240, 200, 200))?; + + let root = root.apply_coord_spec(Cartesian2d::<RangedCoordf32, RangedCoordf32>::new( + 0f32..1f32, + 0f32..1f32, + (0..640, 0..480), + )); + + let dot_and_label = |x: f32, y: f32| { + return EmptyElement::at((x, y)) + + Circle::new((0, 0), 3, ShapeStyle::from(&BLACK).filled()) + + Text::new( + format!("({:.2},{:.2})", x, y), + (10, 0), + ("sans-serif", 15.0).into_font(), + ); + }; + + root.draw(&dot_and_label(0.5, 0.6))?; + root.draw(&dot_and_label(0.25, 0.33))?; + root.draw(&dot_and_label(0.8, 0.8))?; + root.present()?; + Ok(()) +} +``` + + + +### Chart Context + +In order to draw a chart, Plotters need a data object built on top of the drawing area called `ChartContext`. +The chart context defines even higher level constructs compare to the drawing area. +For example, you can define the label areas, meshes, and put a data series onto the drawing area with the help +of the chart context object. + +```rust +use plotters::prelude::*; +fn main() -> Result<(), Box<dyn std::error::Error>> { + let root = BitMapBackend::new("plotters-doc-data/5.png", (640, 480)).into_drawing_area(); + root.fill(&WHITE); + let root = root.margin(10, 10, 10, 10); + // After this point, we should be able to draw construct a chart context + let mut chart = ChartBuilder::on(&root) + // Set the caption of the chart + .caption("This is our first plot", ("sans-serif", 40).into_font()) + // Set the size of the label region + .x_label_area_size(20) + .y_label_area_size(40) + // Finally attach a coordinate on the drawing area and make a chart context + .build_cartesian_2d(0f32..10f32, 0f32..10f32)?; + + // Then we can draw a mesh + chart + .configure_mesh() + // We can customize the maximum number of labels allowed for each axis + .x_labels(5) + .y_labels(5) + // We can also change the format of the label text + .y_label_formatter(&|x| format!("{:.3}", x)) + .draw()?; + + // And we can draw something in the drawing area + chart.draw_series(LineSeries::new( + vec![(0.0, 0.0), (5.0, 5.0), (8.0, 7.0)], + &RED, + ))?; + // Similarly, we can draw point series + chart.draw_series(PointSeries::of_element( + vec![(0.0, 0.0), (5.0, 5.0), (8.0, 7.0)], + 5, + &RED, + &|c, s, st| { + return EmptyElement::at(c) // We want to construct a composed element on-the-fly + + Circle::new((0,0),s,st.filled()) // At this point, the new pixel coordinate is established + + Text::new(format!("{:?}", c), (10, 0), ("sans-serif", 10).into_font()); + }, + ))?; + root.present()?; + Ok(()) +} +``` + + + +## Misc + +### Development Version + +Find the latest development version of Plotters on [GitHub](https://github.com/38/plotters.git). +Clone the repository and learn more about the Plotters API and ways to contribute. Your help is needed! + +If you want to add the development version of Plotters to your project, add the following to your `Cargo.toml`: + +```toml +[dependencies] +plotters = { git = "https://github.com/38/plotters.git" } +``` + +### Reducing Depending Libraries && Turning Off Backends +Plotters now supports use features to control the backend dependencies. By default, `BitMapBackend` and `SVGBackend` are supported, +use `default_features = false` in the dependency description in `Cargo.toml` and you can cherry-pick the backend implementations. + +- `svg` Enable the `SVGBackend` +- `bitmap` Enable the `BitMapBackend` + +For example, the following dependency description would avoid compiling with bitmap support: + +```toml +[dependencies] +plotters = { git = "https://github.com/38/plotters.git", default_features = false, features = ["svg"] } +``` + +The library also allows consumers to make use of the [`Palette`](https://crates.io/crates/palette/) crate's color types by default. +This behavior can also be turned off by setting `default_features = false`. + +### List of Features + +This is the full list of features that is defined by `Plotters` crate. +Use `default_features = false` to disable those default enabled features, +and then you should be able to cherry-pick what features you want to include into `Plotters` crate. +By doing so, you can minimize the number of dependencies down to only `itertools` and compile time is less than 6s. + +The following list is a complete list of features that can be opt in and out. + +- Tier 1 drawing backends + +| Name | Description | Additional Dependency |Default?| +|---------|--------------|--------|------------| +| bitmap\_encoder | Allow `BitMapBackend` save the result to bitmap files | image, rusttype, font-kit | Yes | +| svg\_backend | Enable `SVGBackend` Support | None | Yes | +| bitmap\_gif| Opt-in GIF animation Rendering support for `BitMapBackend`, implies `bitmap` enabled | gif | Yes | + +- Font manipulation features + +| Name | Description | Additional Dependency |Default?| +|---------|--------------|--------|------------| +| ttf | Allows TrueType font support | rusttype, font-kit | Yes | + +- Coordinate features + +| Name | Description | Additional Dependency |Default?| +|---------|--------------|--------|------------| +| datetime | Enable the date and time coordinate support | chrono | Yes | + +- Element, series and util functions + +| Name | Description | Additional Dependency |Default?| +|---------|--------------|--------|------------| +| errorbar | The errorbar element support | None | Yes | +| candlestick | The candlestick element support | None | Yes | +| boxplot | The boxplot element support | None | Yes | +| area\_series | The area series support | None | Yes | +| line\_series | The line series support | None | Yes | +| histogram | The histogram series support | None | Yes | +| point\_series| The point series support | None | Yes | + +- Misc + +| Name | Description | Additional Dependency |Default?| +|---------|--------------|--------|------------| +| deprecated\_items | This feature allows use of deprecated items which is going to be removed in the future | None | Yes | +| debug | Enable the code used for debugging | None | No | + + +## FAQ List + +* Why does the WASM example break on my machine ? + + The WASM example requires using `wasm32` target to build. Using `cargo build` is likely to use the default target + which in most of the case is any of the x86 target. Thus you need add `--target=wasm32-unknown-unknown` in the cargo + parameter list to build it. + +* How to draw text/circle/point/rectangle/... on the top of chart ? + + As you may realized, Plotters is a drawing library rather than a traditional data plotting library, + you have the freedom to draw anything you want on the drawing area. + Use `DrawingArea::draw` to draw any element on the drawing area. + +* Where can I find the backend code ? + + Since Plotters 0.3, all drawing backends are independent crate from the main Plotters crate. + Use the following link to find the backend code: + + - [Bitmap Backend](https://github.com/plotters-rs/plotters-bitmap.git) + - [SVG Backend](https://github.com/plotters-rs/plotters-svg.git) + - [HTML5 Canvas Backend](https://github.com/plotters-rs/plotters-canvas.git) + - [GTK/Cairo Backend](https://github.com/plotters-rs/plotters-cairo.git) + +* How to check if a backend writes file successfully ? + + The behavior of Plotters backend is consistent with standard library. + When the backend instance is being dropped, [`crate::drawing::DrawingArea::present()`] or `Backend::present()` is called automatically + whenever is needed. When the `present()` method is called from `drop`, any error will be silently ignored. + + In the case that error handling is important, you need manually call the `present()` method before the backend gets dropped. + For more information, please see the examples. + + +<style> + img { + display: block; + margin: 0 auto; + max-width: 500px; + } + .galleryItem { + width: 250px; + display: inline-block; + } + .galleryImg { + max-width: 100%; + } + .galleryText { + text-align: center; + } +</style> + + +*/ +pub mod chart; +pub mod coord; +pub mod data; +pub mod drawing; +pub mod element; +pub mod series; +pub mod style; + +/// Evaluation Context for Rust. See [the evcxr crate](https://crates.io/crates/evcxr) for more information. +#[cfg(feature = "evcxr")] +pub mod evcxr; + +#[cfg(test)] +pub use crate::drawing::{check_color, create_mocked_drawing_area}; + +#[cfg(feature = "palette_ext")] +pub use palette; + +/// The module imports the most commonly used types and modules in Plotters +pub mod prelude { + // Chart related types + pub use crate::chart::{ChartBuilder, ChartContext, LabelAreaPosition, SeriesLabelPosition}; + + // Coordinates + pub use crate::coord::{ + cartesian::Cartesian2d, + combinators::{ + make_partial_axis, BindKeyPointMethod, BindKeyPoints, BuildNestedCoord, GroupBy, + IntoLinspace, IntoLogRange, IntoPartialAxis, Linspace, LogCoord, LogScalable, + NestedRange, NestedValue, ToGroupByRange, + }, + ranged1d::{DiscreteRanged, IntoSegmentedCoord, Ranged, SegmentValue}, + CoordTranslate, + }; + + #[allow(deprecated)] + pub use crate::coord::combinators::LogRange; + + #[cfg(feature = "chrono")] + pub use crate::coord::types::{ + IntoMonthly, IntoYearly, RangedDate, RangedDateTime, RangedDuration, + }; + + // Re-export the backend for backward compatibility + pub use plotters_backend::DrawingBackend; + + pub use crate::drawing::*; + + // Series helpers + #[cfg(feature = "area_series")] + pub use crate::series::AreaSeries; + #[cfg(feature = "histogram")] + pub use crate::series::Histogram; + #[cfg(feature = "line_series")] + pub use crate::series::LineSeries; + #[cfg(feature = "point_series")] + pub use crate::series::PointSeries; + #[cfg(feature = "surface_series")] + pub use crate::series::SurfaceSeries; + + // Styles + pub use crate::style::{BLACK, BLUE, CYAN, GREEN, MAGENTA, RED, TRANSPARENT, WHITE, YELLOW}; + + #[cfg(feature = "full_palette")] + pub use crate::style::full_palette; + + pub use crate::style::{ + AsRelative, Color, FontDesc, FontFamily, FontStyle, FontTransform, HSLColor, IntoFont, + IntoTextStyle, Palette, Palette100, Palette99, Palette9999, PaletteColor, RGBAColor, + RGBColor, ShapeStyle, TextStyle, + }; + + // Elements + pub use crate::element::{ + Circle, Cross, Cubiod, DynElement, EmptyElement, IntoDynElement, MultiLineText, + PathElement, Pie, Pixel, Polygon, Rectangle, Text, TriangleMarker, + }; + + #[cfg(feature = "boxplot")] + pub use crate::element::Boxplot; + #[cfg(feature = "candlestick")] + pub use crate::element::CandleStick; + #[cfg(feature = "errorbar")] + pub use crate::element::ErrorBar; + + #[cfg(feature = "bitmap_backend")] + pub use crate::element::BitMapElement; + + // Data + pub use crate::data::Quartiles; + + // TODO: This should be deprecated and completely removed + #[cfg(feature = "deprecated_items")] + #[allow(deprecated)] + pub use crate::element::Path; + + #[allow(type_alias_bounds)] + /// The type used to returns a drawing operation that can be failed + /// - `T`: The return type + /// - `D`: The drawing backend type + pub type DrawResult<T, D: DrawingBackend> = + Result<T, crate::drawing::DrawingAreaErrorKind<D::ErrorType>>; + + #[cfg(feature = "evcxr")] + pub use crate::evcxr::evcxr_figure; + + // Re-export tier 1 backends for backward compatibility + #[cfg(feature = "bitmap_backend")] + pub use plotters_bitmap::BitMapBackend; + + #[cfg(feature = "svg_backend")] + pub use plotters_svg::SVGBackend; +} + +/// This module contains some useful re-export of backend related types. +pub mod backend { + pub use plotters_backend::DrawingBackend; + #[cfg(feature = "bitmap_backend")] + pub use plotters_bitmap::{ + bitmap_pixel::{BGRXPixel, PixelFormat, RGBPixel}, + BitMapBackend, + }; + #[cfg(feature = "svg_backend")] + pub use plotters_svg::SVGBackend; +} + +#[cfg(test)] +mod test; diff --git a/vendor/plotters/src/series/area_series.rs b/vendor/plotters/src/series/area_series.rs new file mode 100644 index 000000000..92c92619c --- /dev/null +++ b/vendor/plotters/src/series/area_series.rs @@ -0,0 +1,96 @@ +use crate::element::{DynElement, IntoDynElement, PathElement, Polygon}; +use crate::style::colors::TRANSPARENT; +use crate::style::ShapeStyle; +use plotters_backend::DrawingBackend; + +/** +An area series is similar to a line series but uses a filled polygon. +It takes an iterator of data points in guest coordinate system +and creates appropriate lines and points with the given style. + +# Example + +``` +use plotters::prelude::*; +let x_values = [0.0f64, 1., 2., 3., 4.]; +let drawing_area = SVGBackend::new("area_series.svg", (300, 200)).into_drawing_area(); +drawing_area.fill(&WHITE).unwrap(); +let mut chart_builder = ChartBuilder::on(&drawing_area); +chart_builder.margin(10).set_left_and_bottom_label_area_size(20); +let mut chart_context = chart_builder.build_cartesian_2d(0.0..4.0, 0.0..3.0).unwrap(); +chart_context.configure_mesh().draw().unwrap(); +chart_context.draw_series(AreaSeries::new(x_values.map(|x| (x, 0.3 * x)), 0., BLACK.mix(0.2))).unwrap(); +chart_context.draw_series(AreaSeries::new(x_values.map(|x| (x, 2.5 - 0.05 * x * x)), 0., RED.mix(0.2))).unwrap(); +chart_context.draw_series(AreaSeries::new(x_values.map(|x| (x, 2. - 0.1 * x * x)), 0., BLUE.mix(0.2)).border_style(BLUE)).unwrap(); +``` + +The result is a chart with three line series; one of them has a highlighted blue border: + + +*/ +pub struct AreaSeries<DB: DrawingBackend, X: Clone, Y: Clone> { + area_style: ShapeStyle, + border_style: ShapeStyle, + baseline: Y, + data: Vec<(X, Y)>, + state: u32, + _p: std::marker::PhantomData<DB>, +} + +impl<DB: DrawingBackend, X: Clone, Y: Clone> AreaSeries<DB, X, Y> { + /** + Creates an area series with transparent border. + + See [`AreaSeries`] for more information and examples. + */ + pub fn new<S: Into<ShapeStyle>, I: IntoIterator<Item = (X, Y)>>( + iter: I, + baseline: Y, + area_style: S, + ) -> Self { + Self { + area_style: area_style.into(), + baseline, + data: iter.into_iter().collect(), + state: 0, + border_style: (&TRANSPARENT).into(), + _p: std::marker::PhantomData, + } + } + + /** + Sets the border style of the area series. + + See [`AreaSeries`] for more information and examples. + */ + pub fn border_style<S: Into<ShapeStyle>>(mut self, style: S) -> Self { + self.border_style = style.into(); + self + } +} + +impl<DB: DrawingBackend, X: Clone + 'static, Y: Clone + 'static> Iterator for AreaSeries<DB, X, Y> { + type Item = DynElement<'static, DB, (X, Y)>; + fn next(&mut self) -> Option<Self::Item> { + if self.state == 0 { + let mut data: Vec<_> = self.data.clone(); + + if !data.is_empty() { + data.push((data[data.len() - 1].0.clone(), self.baseline.clone())); + data.push((data[0].0.clone(), self.baseline.clone())); + } + + self.state = 1; + + Some(Polygon::new(data, self.area_style).into_dyn()) + } else if self.state == 1 { + let data: Vec<_> = self.data.clone(); + + self.state = 2; + + Some(PathElement::new(data, self.border_style).into_dyn()) + } else { + None + } + } +} diff --git a/vendor/plotters/src/series/histogram.rs b/vendor/plotters/src/series/histogram.rs new file mode 100644 index 000000000..2d7d8f48c --- /dev/null +++ b/vendor/plotters/src/series/histogram.rs @@ -0,0 +1,280 @@ +use std::collections::{hash_map::IntoIter as HashMapIter, HashMap}; +use std::marker::PhantomData; +use std::ops::AddAssign; + +use crate::chart::ChartContext; +use crate::coord::cartesian::Cartesian2d; +use crate::coord::ranged1d::{DiscreteRanged, Ranged}; +use crate::element::Rectangle; +use crate::style::{Color, ShapeStyle, GREEN}; +use plotters_backend::DrawingBackend; + +pub trait HistogramType {} +pub struct Vertical; +pub struct Horizontal; + +impl HistogramType for Vertical {} +impl HistogramType for Horizontal {} + +/** +Presents data in a histogram. Input data can be raw or aggregated. + +# Examples + +``` +use plotters::prelude::*; +let data = [1, 1, 2, 2, 1, 3, 3, 2, 2, 1, 1, 2, 2, 2, 3, 3, 1, 2, 3]; +let drawing_area = SVGBackend::new("histogram_vertical.svg", (300, 200)).into_drawing_area(); +drawing_area.fill(&WHITE).unwrap(); +let mut chart_builder = ChartBuilder::on(&drawing_area); +chart_builder.margin(5).set_left_and_bottom_label_area_size(20); +let mut chart_context = chart_builder.build_cartesian_2d((1..3).into_segmented(), 0..9).unwrap(); +chart_context.configure_mesh().draw().unwrap(); +chart_context.draw_series(Histogram::vertical(&chart_context).style(BLUE.filled()).margin(10) + .data(data.map(|x| (x, 1)))).unwrap(); +``` + +The result is a histogram counting the occurrences of 1, 2, and 3 in `data`: + + + +Here is a variation with [`Histogram::horizontal()`], replacing `(1..3).into_segmented(), 0..9` with +`0..9, (1..3).into_segmented()`: + + + +The spacing between histogram bars is adjusted with [`Histogram::margin()`]. +Here is a version of the figure where `.margin(10)` has been replaced by `.margin(20)`; +the resulting bars are narrow and more spaced: + + + +[`crate::coord::ranged1d::IntoSegmentedCoord::into_segmented()`] is useful for discrete data; it makes sure the histogram bars +are centered on each data value. Here is another variation with `(1..3).into_segmented()` +replaced by `1..4`: + + + +[`Histogram::style()`] sets the style of the bars. Here is a histogram without `.filled()`: + + + +The following version uses [`Histogram::style_func()`] for finer control. Let's replace `.style(BLUE.filled())` with +`.style_func(|x, _bar_height| if let SegmentValue::Exact(v) = x {[BLACK, RED, GREEN, BLUE][*v as usize].filled()} else {BLACK.filled()})`. +The resulting bars come in different colors: + + + +[`Histogram::baseline()`] adjusts the base of the bars. The following figure adds `.baseline(1)` +to the right of `.margin(10)`. The lower portion of the bars are removed: + + + +The following figure uses [`Histogram::baseline_func()`] for finer control. Let's add +`.baseline_func(|x| if let SegmentValue::Exact(v) = x {*v as i32} else {0})` +to the right of `.margin(10)`. The lower portion of the bars are removed; the removed portion is taller +to the right: + + +*/ +pub struct Histogram<'a, BR, A, Tag = Vertical> +where + BR: DiscreteRanged, + A: AddAssign<A> + Default, + Tag: HistogramType, +{ + style: Box<dyn Fn(&BR::ValueType, &A) -> ShapeStyle + 'a>, + margin: u32, + iter: HashMapIter<usize, A>, + baseline: Box<dyn Fn(&BR::ValueType) -> A + 'a>, + br: BR, + _p: PhantomData<Tag>, +} + +impl<'a, BR, A, Tag> Histogram<'a, BR, A, Tag> +where + BR: DiscreteRanged + Clone, + A: AddAssign<A> + Default + 'a, + Tag: HistogramType, +{ + fn empty(br: &BR) -> Self { + Self { + style: Box::new(|_, _| GREEN.filled()), + margin: 5, + iter: HashMap::new().into_iter(), + baseline: Box::new(|_| A::default()), + br: br.clone(), + _p: PhantomData, + } + } + /** + Sets the style of the histogram bars. + + See [`Histogram`] for more information and examples. + */ + pub fn style<S: Into<ShapeStyle>>(mut self, style: S) -> Self { + let style = style.into(); + self.style = Box::new(move |_, _| style); + self + } + + /** + Sets the style of histogram using a closure. + + The closure takes the position of the bar in guest coordinates as argument. + The argument may need some processing if the data range has been transformed by + [`crate::coord::ranged1d::IntoSegmentedCoord::into_segmented()`] as shown in the [`Histogram`] example. + */ + pub fn style_func( + mut self, + style_func: impl Fn(&BR::ValueType, &A) -> ShapeStyle + 'a, + ) -> Self { + self.style = Box::new(style_func); + self + } + + /** + Sets the baseline of the histogram. + + See [`Histogram`] for more information and examples. + */ + pub fn baseline(mut self, baseline: A) -> Self + where + A: Clone, + { + self.baseline = Box::new(move |_| baseline.clone()); + self + } + + /** + Sets the histogram bar baselines using a closure. + + The closure takes the bar position and height as argument. + The argument may need some processing if the data range has been transformed by + [`crate::coord::ranged1d::IntoSegmentedCoord::into_segmented()`] as shown in the [`Histogram`] example. + */ + pub fn baseline_func(mut self, func: impl Fn(&BR::ValueType) -> A + 'a) -> Self { + self.baseline = Box::new(func); + self + } + + /** + Sets the margin for each bar, in backend pixels. + + See [`Histogram`] for more information and examples. + */ + pub fn margin(mut self, value: u32) -> Self { + self.margin = value; + self + } + + /** + Specifies the input data for the histogram through an appropriate data iterator. + + See [`Histogram`] for more information and examples. + */ + pub fn data<TB: Into<BR::ValueType>, I: IntoIterator<Item = (TB, A)>>( + mut self, + iter: I, + ) -> Self { + let mut buffer = HashMap::<usize, A>::new(); + for (x, y) in iter.into_iter() { + if let Some(x) = self.br.index_of(&x.into()) { + *buffer.entry(x).or_insert_with(Default::default) += y; + } + } + self.iter = buffer.into_iter(); + self + } +} + +impl<'a, BR, A> Histogram<'a, BR, A, Vertical> +where + BR: DiscreteRanged + Clone, + A: AddAssign<A> + Default + 'a, +{ + /** + Creates a vertical histogram. + + See [`Histogram`] for more information and examples. + */ + pub fn vertical<ACoord, DB: DrawingBackend + 'a>( + parent: &ChartContext<DB, Cartesian2d<BR, ACoord>>, + ) -> Self + where + ACoord: Ranged<ValueType = A>, + { + let dp = parent.as_coord_spec().x_spec(); + + Self::empty(dp) + } +} + +impl<'a, BR, A> Histogram<'a, BR, A, Horizontal> +where + BR: DiscreteRanged + Clone, + A: AddAssign<A> + Default + 'a, +{ + /** + Creates a horizontal histogram. + + See [`Histogram`] for more information and examples. + */ + pub fn horizontal<ACoord, DB: DrawingBackend>( + parent: &ChartContext<DB, Cartesian2d<ACoord, BR>>, + ) -> Self + where + ACoord: Ranged<ValueType = A>, + { + let dp = parent.as_coord_spec().y_spec(); + Self::empty(dp) + } +} + +impl<'a, BR, A> Iterator for Histogram<'a, BR, A, Vertical> +where + BR: DiscreteRanged, + A: AddAssign<A> + Default, +{ + type Item = Rectangle<(BR::ValueType, A)>; + fn next(&mut self) -> Option<Self::Item> { + while let Some((x, y)) = self.iter.next() { + if let Some((x, Some(nx))) = self + .br + .from_index(x) + .map(|v| (v, self.br.from_index(x + 1))) + { + let base = (self.baseline)(&x); + let style = (self.style)(&x, &y); + let mut rect = Rectangle::new([(x, y), (nx, base)], style); + rect.set_margin(0, 0, self.margin, self.margin); + return Some(rect); + } + } + None + } +} + +impl<'a, BR, A> Iterator for Histogram<'a, BR, A, Horizontal> +where + BR: DiscreteRanged, + A: AddAssign<A> + Default, +{ + type Item = Rectangle<(A, BR::ValueType)>; + fn next(&mut self) -> Option<Self::Item> { + while let Some((y, x)) = self.iter.next() { + if let Some((y, Some(ny))) = self + .br + .from_index(y) + .map(|v| (v, self.br.from_index(y + 1))) + { + let base = (self.baseline)(&y); + let style = (self.style)(&y, &x); + let mut rect = Rectangle::new([(x, y), (base, ny)], style); + rect.set_margin(self.margin, self.margin, 0, 0); + return Some(rect); + } + } + None + } +} diff --git a/vendor/plotters/src/series/line_series.rs b/vendor/plotters/src/series/line_series.rs new file mode 100644 index 000000000..2d0cf9863 --- /dev/null +++ b/vendor/plotters/src/series/line_series.rs @@ -0,0 +1,122 @@ +use crate::element::{Circle, DynElement, IntoDynElement, PathElement}; +use crate::style::ShapeStyle; +use plotters_backend::DrawingBackend; +use std::marker::PhantomData; + +/** +The line series object, which takes an iterator of data points in guest coordinate system +and creates appropriate lines and points with the given style. + +# Example + +``` +use plotters::prelude::*; +let x_values = [0.0f64, 1., 2., 3., 4.]; +let drawing_area = SVGBackend::new("line_series_point_size.svg", (300, 200)).into_drawing_area(); +drawing_area.fill(&WHITE).unwrap(); +let mut chart_builder = ChartBuilder::on(&drawing_area); +chart_builder.margin(10).set_left_and_bottom_label_area_size(20); +let mut chart_context = chart_builder.build_cartesian_2d(0.0..4.0, 0.0..3.0).unwrap(); +chart_context.configure_mesh().draw().unwrap(); +chart_context.draw_series(LineSeries::new(x_values.map(|x| (x, 0.3 * x)), BLACK)).unwrap(); +chart_context.draw_series(LineSeries::new(x_values.map(|x| (x, 2.5 - 0.05 * x * x)), RED) + .point_size(5)).unwrap(); +chart_context.draw_series(LineSeries::new(x_values.map(|x| (x, 2. - 0.1 * x * x)), BLUE.filled()) + .point_size(4)).unwrap(); +``` + +The result is a chart with three line series; two of them have their data points highlighted: + + +*/ +pub struct LineSeries<DB: DrawingBackend, Coord> { + style: ShapeStyle, + data: Vec<Coord>, + point_idx: usize, + point_size: u32, + phantom: PhantomData<DB>, +} + +impl<DB: DrawingBackend, Coord: Clone + 'static> Iterator for LineSeries<DB, Coord> { + type Item = DynElement<'static, DB, Coord>; + fn next(&mut self) -> Option<Self::Item> { + if !self.data.is_empty() { + if self.point_size > 0 && self.point_idx < self.data.len() { + let idx = self.point_idx; + self.point_idx += 1; + return Some( + Circle::new(self.data[idx].clone(), self.point_size, self.style) + .into_dyn(), + ); + } + let mut data = vec![]; + std::mem::swap(&mut self.data, &mut data); + Some(PathElement::new(data, self.style).into_dyn()) + } else { + None + } + } +} + +impl<DB: DrawingBackend, Coord> LineSeries<DB, Coord> { + /** + Creates a new line series based on a data iterator and a given style. + + See [`LineSeries`] for more information and examples. + */ + pub fn new<I: IntoIterator<Item = Coord>, S: Into<ShapeStyle>>(iter: I, style: S) -> Self { + Self { + style: style.into(), + data: iter.into_iter().collect(), + point_size: 0, + point_idx: 0, + phantom: PhantomData, + } + } + + /** + Sets the size of the points in the series, in pixels. + + See [`LineSeries`] for more information and examples. + */ + pub fn point_size(mut self, size: u32) -> Self { + self.point_size = size; + self + } +} + +#[cfg(test)] +mod test { + use crate::prelude::*; + + #[test] + fn test_line_series() { + let drawing_area = create_mocked_drawing_area(200, 200, |m| { + m.check_draw_path(|c, s, _path| { + assert_eq!(c, RED.to_rgba()); + assert_eq!(s, 3); + // TODO when cleanup the backend coordinate defination, then we uncomment the + // following check + //for i in 0..100 { + // assert_eq!(path[i], (i as i32 * 2, 199 - i as i32 * 2)); + //} + }); + + m.drop_check(|b| { + assert_eq!(b.num_draw_path_call, 1); + assert_eq!(b.draw_count, 1); + }); + }); + + let mut chart = ChartBuilder::on(&drawing_area) + .build_cartesian_2d(0..100, 0..100) + .expect("Build chart error"); + + chart + .draw_series(LineSeries::new( + (0..100).map(|x| (x, x)), + Into::<ShapeStyle>::into(&RED).stroke_width(3), + )) + .expect("Drawing Error"); + } +} diff --git a/vendor/plotters/src/series/mod.rs b/vendor/plotters/src/series/mod.rs new file mode 100644 index 000000000..a0c8f198f --- /dev/null +++ b/vendor/plotters/src/series/mod.rs @@ -0,0 +1,33 @@ +/*! + This module contains predefined types of series. + The series in Plotters is actually an iterator of elements, which + can be taken by `ChartContext::draw_series` function. + + This module defines some "iterator transformer", which transform the data + iterator to the element iterator. + + Any type that implements iterator emitting drawable elements are acceptable series. + So iterator combinator such as `map`, `zip`, etc can also be used. +*/ + +#[cfg(feature = "area_series")] +mod area_series; +#[cfg(feature = "histogram")] +mod histogram; +#[cfg(feature = "line_series")] +mod line_series; +#[cfg(feature = "point_series")] +mod point_series; +#[cfg(feature = "surface_series")] +mod surface; + +#[cfg(feature = "area_series")] +pub use area_series::AreaSeries; +#[cfg(feature = "histogram")] +pub use histogram::Histogram; +#[cfg(feature = "line_series")] +pub use line_series::LineSeries; +#[cfg(feature = "point_series")] +pub use point_series::PointSeries; +#[cfg(feature = "surface_series")] +pub use surface::SurfaceSeries; diff --git a/vendor/plotters/src/series/point_series.rs b/vendor/plotters/src/series/point_series.rs new file mode 100644 index 000000000..a1e2107d5 --- /dev/null +++ b/vendor/plotters/src/series/point_series.rs @@ -0,0 +1,61 @@ +use crate::element::PointElement; +use crate::style::{ShapeStyle, SizeDesc}; + +/// The point plot object, which takes an iterator of points in guest coordinate system +/// and create an element for each point +pub struct PointSeries<'a, Coord, I: IntoIterator<Item = Coord>, E, Size: SizeDesc + Clone> { + style: ShapeStyle, + size: Size, + data_iter: I::IntoIter, + make_point: &'a dyn Fn(Coord, Size, ShapeStyle) -> E, +} + +impl<'a, Coord, I: IntoIterator<Item = Coord>, E, Size: SizeDesc + Clone> Iterator + for PointSeries<'a, Coord, I, E, Size> +{ + type Item = E; + fn next(&mut self) -> Option<Self::Item> { + self.data_iter + .next() + .map(|x| (self.make_point)(x, self.size.clone(), self.style)) + } +} + +impl<'a, Coord, I: IntoIterator<Item = Coord>, E, Size: SizeDesc + Clone> + PointSeries<'a, Coord, I, E, Size> +where + E: PointElement<Coord, Size>, +{ + /// Create a new point series with the element that implements point trait. + /// You may also use a more general way to create a point series with `of_element` + /// function which allows a customized element construction function + pub fn new<S: Into<ShapeStyle>>(iter: I, size: Size, style: S) -> Self { + Self { + data_iter: iter.into_iter(), + size, + style: style.into(), + make_point: &|a, b, c| E::make_point(a, b, c), + } + } +} + +impl<'a, Coord, I: IntoIterator<Item = Coord>, E, Size: SizeDesc + Clone> + PointSeries<'a, Coord, I, E, Size> +{ + /// Create a new point series. Similar to `PointSeries::new` but it doesn't + /// requires the element implements point trait. So instead of using the point + /// constructor, it uses the customized function for element creation + pub fn of_element<S: Into<ShapeStyle>, F: Fn(Coord, Size, ShapeStyle) -> E>( + iter: I, + size: Size, + style: S, + cons: &'a F, + ) -> Self { + Self { + data_iter: iter.into_iter(), + size, + style: style.into(), + make_point: cons, + } + } +} diff --git a/vendor/plotters/src/series/surface.rs b/vendor/plotters/src/series/surface.rs new file mode 100644 index 000000000..2307e32f6 --- /dev/null +++ b/vendor/plotters/src/series/surface.rs @@ -0,0 +1,250 @@ +use crate::element::Polygon; +use crate::style::{colors::BLUE, Color, ShapeStyle}; +use std::marker::PhantomData; + +/// Any type that describe a surface orientation +pub trait Direction<X, Y, Z> { + /// The type for the first input argument + type Input1Type; + /// The type for the second input argument + type Input2Type; + /// The output of the surface function + type OutputType; + + /// The function that maps a point on surface into the coordinate system + fn make_coord( + free_vars: (Self::Input1Type, Self::Input2Type), + result: Self::OutputType, + ) -> (X, Y, Z); +} + +macro_rules! define_panel_descriptor { + ($name: ident, $var1: ident, $var2: ident, $out: ident, ($first: ident, $second:ident) -> $result: ident = $output: expr) => { + #[allow(clippy::upper_case_acronyms)] + pub struct $name; + impl<X, Y, Z> Direction<X, Y, Z> for $name { + type Input1Type = $var1; + type Input2Type = $var2; + type OutputType = $out; + fn make_coord( + ($first, $second): (Self::Input1Type, Self::Input2Type), + $result: Self::OutputType, + ) -> (X, Y, Z) { + $output + } + } + }; +} + +define_panel_descriptor!(XOY, X, Y, Z, (x, y) -> z = (x,y,z)); +define_panel_descriptor!(XOZ, X, Z, Y, (x, z) -> y = (x,y,z)); +define_panel_descriptor!(YOZ, Y, Z, X, (y, z) -> x = (x,y,z)); + +enum StyleConfig<'a, T> { + Fixed(ShapeStyle), + Function(&'a dyn Fn(&T) -> ShapeStyle), +} + +impl<T> StyleConfig<'_, T> { + fn get_style(&self, v: &T) -> ShapeStyle { + match self { + StyleConfig::Fixed(s) => *s, + StyleConfig::Function(f) => f(v), + } + } +} + +/** +Represents functions of two variables. + +# Examples + +``` +use plotters::prelude::*; +let drawing_area = SVGBackend::new("surface_series_xoz.svg", (640, 480)).into_drawing_area(); +drawing_area.fill(&WHITE).unwrap(); +let mut chart_context = ChartBuilder::on(&drawing_area) + .margin(10) + .build_cartesian_3d(-3.0..3.0f64, -3.0..3.0f64, -3.0..3.0f64) + .unwrap(); +chart_context.configure_axes().draw().unwrap(); +let axis_title_style = ("sans-serif", 20, &BLACK).into_text_style(&drawing_area); +chart_context.draw_series([("x", (3., -3., -3.)), ("y", (-3., 3., -3.)), ("z", (-3., -3., 3.))] +.map(|(label, position)| Text::new(label, position, &axis_title_style))).unwrap(); +chart_context.draw_series(SurfaceSeries::xoz( + (-30..30).map(|v| v as f64 / 10.0), + (-30..30).map(|v| v as f64 / 10.0), + |x:f64,z:f64|(0.7 * (x * x + z * z)).cos()).style(&BLUE.mix(0.5)) +).unwrap(); +``` + +The code above with [`SurfaceSeries::xoy()`] produces a surface that depends on x and y and +points in the z direction: + + + +The code above with [`SurfaceSeries::xoz()`] produces a surface that depends on x and z and +points in the y direction: + + + +The code above with [`SurfaceSeries::yoz()`] produces a surface that depends on y and z and +points in the x direction: + + +*/ +pub struct SurfaceSeries<'a, X, Y, Z, D, SurfaceFunc> +where + D: Direction<X, Y, Z>, + SurfaceFunc: Fn(D::Input1Type, D::Input2Type) -> D::OutputType, +{ + free_var_1: Vec<D::Input1Type>, + free_var_2: Vec<D::Input2Type>, + surface_f: SurfaceFunc, + style: StyleConfig<'a, D::OutputType>, + vidx_1: usize, + vidx_2: usize, + _phantom: PhantomData<(X, Y, Z, D)>, +} + +impl<'a, X, Y, Z, D, SurfaceFunc> SurfaceSeries<'a, X, Y, Z, D, SurfaceFunc> +where + D: Direction<X, Y, Z>, + SurfaceFunc: Fn(D::Input1Type, D::Input2Type) -> D::OutputType, +{ + /// Create a new surface series, the surface orientation is determined by D + pub fn new<IterA: Iterator<Item = D::Input1Type>, IterB: Iterator<Item = D::Input2Type>>( + first_iter: IterA, + second_iter: IterB, + func: SurfaceFunc, + ) -> Self { + Self { + free_var_1: first_iter.collect(), + free_var_2: second_iter.collect(), + surface_f: func, + style: StyleConfig::Fixed(BLUE.mix(0.4).filled()), + vidx_1: 0, + vidx_2: 0, + _phantom: PhantomData, + } + } + + /** + Sets the style as a function of the value of the dependent coordinate of the surface. + + # Examples + + ``` + use plotters::prelude::*; + let drawing_area = SVGBackend::new("surface_series_style_func.svg", (640, 480)).into_drawing_area(); + drawing_area.fill(&WHITE).unwrap(); + let mut chart_context = ChartBuilder::on(&drawing_area) + .margin(10) + .build_cartesian_3d(-3.0..3.0f64, -3.0..3.0f64, -3.0..3.0f64) + .unwrap(); + chart_context.configure_axes().draw().unwrap(); + let axis_title_style = ("sans-serif", 20, &BLACK).into_text_style(&drawing_area); + chart_context.draw_series([("x", (3., -3., -3.)), ("y", (-3., 3., -3.)), ("z", (-3., -3., 3.))] + .map(|(label, position)| Text::new(label, position, &axis_title_style))).unwrap(); + chart_context.draw_series(SurfaceSeries::xoz( + (-30..30).map(|v| v as f64 / 10.0), + (-30..30).map(|v| v as f64 / 10.0), + |x:f64,z:f64|(0.4 * (x * x + z * z)).cos()).style_func( + &|y| HSLColor(0.6666, y + 0.5, 0.5).mix(0.8).filled() + ) + ).unwrap(); + ``` + + The resulting style varies from gray to blue according to the value of y: + +  + */ + pub fn style_func<F: Fn(&D::OutputType) -> ShapeStyle>(mut self, f: &'a F) -> Self { + self.style = StyleConfig::Function(f); + self + } + + /// Sets the style of the plot. See [`SurfaceSeries`] for more information and examples. + pub fn style<S: Into<ShapeStyle>>(mut self, s: S) -> Self { + self.style = StyleConfig::Fixed(s.into()); + self + } +} + +macro_rules! impl_constructor { + ($dir: ty, $name: ident) => { + impl<'a, X, Y, Z, SurfaceFunc> SurfaceSeries<'a, X, Y, Z, $dir, SurfaceFunc> + where + SurfaceFunc: Fn( + <$dir as Direction<X, Y, Z>>::Input1Type, + <$dir as Direction<X, Y, Z>>::Input2Type, + ) -> <$dir as Direction<X, Y, Z>>::OutputType, + { + /// Implements the constructor. See [`SurfaceSeries`] for more information and examples. + pub fn $name<IterA, IterB>(a: IterA, b: IterB, f: SurfaceFunc) -> Self + where + IterA: Iterator<Item = <$dir as Direction<X, Y, Z>>::Input1Type>, + IterB: Iterator<Item = <$dir as Direction<X, Y, Z>>::Input2Type>, + { + Self::new(a, b, f) + } + } + }; +} + +impl_constructor!(XOY, xoy); +impl_constructor!(XOZ, xoz); +impl_constructor!(YOZ, yoz); +impl<'a, X, Y, Z, D, SurfaceFunc> Iterator for SurfaceSeries<'a, X, Y, Z, D, SurfaceFunc> +where + D: Direction<X, Y, Z>, + D::Input1Type: Clone, + D::Input2Type: Clone, + SurfaceFunc: Fn(D::Input1Type, D::Input2Type) -> D::OutputType, +{ + type Item = Polygon<(X, Y, Z)>; + fn next(&mut self) -> Option<Self::Item> { + let (b0, b1) = if let (Some(b0), Some(b1)) = ( + self.free_var_2.get(self.vidx_2), + self.free_var_2.get(self.vidx_2 + 1), + ) { + self.vidx_2 += 1; + (b0, b1) + } else { + self.vidx_1 += 1; + self.vidx_2 = 1; + if let (Some(b0), Some(b1)) = (self.free_var_2.get(0), self.free_var_2.get(1)) { + (b0, b1) + } else { + return None; + } + }; + + match ( + self.free_var_1.get(self.vidx_1), + self.free_var_1.get(self.vidx_1 + 1), + ) { + (Some(a0), Some(a1)) => { + let value = (self.surface_f)(a0.clone(), b0.clone()); + let style = self.style.get_style(&value); + let vert = vec![ + D::make_coord((a0.clone(), b0.clone()), value), + D::make_coord( + (a0.clone(), b1.clone()), + (self.surface_f)(a0.clone(), b1.clone()), + ), + D::make_coord( + (a1.clone(), b1.clone()), + (self.surface_f)(a1.clone(), b1.clone()), + ), + D::make_coord( + (a1.clone(), b0.clone()), + (self.surface_f)(a1.clone(), b0.clone()), + ), + ]; + Some(Polygon::new(vert, style)) + } + _ => None, + } + } +} diff --git a/vendor/plotters/src/style/color.rs b/vendor/plotters/src/style/color.rs new file mode 100644 index 000000000..7e372cd12 --- /dev/null +++ b/vendor/plotters/src/style/color.rs @@ -0,0 +1,184 @@ +use super::palette::Palette; +use super::ShapeStyle; + +use plotters_backend::{BackendColor, BackendStyle}; + +use std::marker::PhantomData; + +/// Any color representation +pub trait Color { + /// Normalize this color representation to the backend color + fn to_backend_color(&self) -> BackendColor; + + /// Convert the RGB representation to the standard RGB tuple + #[inline(always)] + fn rgb(&self) -> (u8, u8, u8) { + self.to_backend_color().rgb + } + + /// Get the alpha channel of the color + #[inline(always)] + fn alpha(&self) -> f64 { + self.to_backend_color().alpha + } + + /// Mix the color with given opacity + fn mix(&self, value: f64) -> RGBAColor { + let (r, g, b) = self.rgb(); + let a = self.alpha() * value; + RGBAColor(r, g, b, a) + } + + /// Convert the color into the RGBA color which is internally used by Plotters + fn to_rgba(&self) -> RGBAColor { + let (r, g, b) = self.rgb(); + let a = self.alpha(); + RGBAColor(r, g, b, a) + } + + /// Make a filled style form the color + fn filled(&self) -> ShapeStyle + where + Self: Sized, + { + Into::<ShapeStyle>::into(self).filled() + } + + /// Make a shape style with stroke width from a color + fn stroke_width(&self, width: u32) -> ShapeStyle + where + Self: Sized, + { + Into::<ShapeStyle>::into(self).stroke_width(width) + } +} + +impl<T: Color> Color for &'_ T { + fn to_backend_color(&self) -> BackendColor { + <T as Color>::to_backend_color(*self) + } +} + +/// The RGBA representation of the color, Plotters use RGBA as the internal representation +/// of color +/// +/// If you want to directly create a RGB color with transparency use [RGBColor::mix] +#[derive(Copy, Clone, PartialEq, Debug, Default)] +pub struct RGBAColor(pub u8, pub u8, pub u8, pub f64); + +impl Color for RGBAColor { + #[inline(always)] + fn to_backend_color(&self) -> BackendColor { + BackendColor { + rgb: (self.0, self.1, self.2), + alpha: self.3, + } + } +} + +impl From<RGBColor> for RGBAColor { + fn from(rgb: RGBColor) -> Self { + Self(rgb.0, rgb.1, rgb.2, 1.0) + } +} + +/// A color in the given palette +#[derive(Copy, Clone, Eq, PartialEq, Hash, Debug, Default)] +pub struct PaletteColor<P: Palette>(usize, PhantomData<P>); + +impl<P: Palette> PaletteColor<P> { + /// Pick a color from the palette + pub fn pick(idx: usize) -> PaletteColor<P> { + PaletteColor(idx % P::COLORS.len(), PhantomData) + } +} + +impl<P: Palette> Color for PaletteColor<P> { + #[inline(always)] + fn to_backend_color(&self) -> BackendColor { + BackendColor { + rgb: P::COLORS[self.0], + alpha: 1.0, + } + } +} + +/// The color described by its RGB value +#[derive(Copy, Clone, Eq, PartialEq, Hash, Debug, Default)] +pub struct RGBColor(pub u8, pub u8, pub u8); + +impl BackendStyle for RGBAColor { + fn color(&self) -> BackendColor { + self.to_backend_color() + } +} + +impl Color for RGBColor { + #[inline(always)] + fn to_backend_color(&self) -> BackendColor { + BackendColor { + rgb: (self.0, self.1, self.2), + alpha: 1.0, + } + } +} +impl BackendStyle for RGBColor { + fn color(&self) -> BackendColor { + self.to_backend_color() + } +} + +/// The color described by HSL color space +#[derive(Copy, Clone, PartialEq, Debug, Default)] +pub struct HSLColor(pub f64, pub f64, pub f64); + +impl Color for HSLColor { + #[inline(always)] + #[allow(clippy::many_single_char_names)] + fn to_backend_color(&self) -> BackendColor { + let (h, s, l) = ( + self.0.min(1.0).max(0.0), + self.1.min(1.0).max(0.0), + self.2.min(1.0).max(0.0), + ); + + if s == 0.0 { + let value = (l * 255.0).round() as u8; + return BackendColor { + rgb: (value, value, value), + alpha: 1.0, + }; + } + + let q = if l < 0.5 { + l * (1.0 + s) + } else { + l + s - l * s + }; + let p = 2.0 * l - q; + + let cvt = |mut t| { + if t < 0.0 { + t += 1.0; + } + if t > 1.0 { + t -= 1.0; + } + let value = if t < 1.0 / 6.0 { + p + (q - p) * 6.0 * t + } else if t < 1.0 / 2.0 { + q + } else if t < 2.0 / 3.0 { + p + (q - p) * (2.0 / 3.0 - t) * 6.0 + } else { + p + }; + (value * 255.0).round() as u8 + }; + + BackendColor { + rgb: (cvt(h + 1.0 / 3.0), cvt(h), cvt(h - 1.0 / 3.0)), + alpha: 1.0, + } + } +} diff --git a/vendor/plotters/src/style/colors/full_palette.rs b/vendor/plotters/src/style/colors/full_palette.rs new file mode 100644 index 000000000..6a1a17252 --- /dev/null +++ b/vendor/plotters/src/style/colors/full_palette.rs @@ -0,0 +1,1263 @@ +//! A full color palette derived from the +//! [Material Design 2014 Color Palette](https://material.io/design/color/the-color-system.html). +//! Colors are chosen to go well with each other, and each color is available in several tints, +//! ranging from 50 (very light) to 900 (very dark). A tint of 500 is considered "standard". Color's whose tint starts +//! with an 'A' (for example [`RED_A400`]) are *accent* colors and are more saturated than their +//! standard counterparts. +//! +//! See the full list of colors defined in this module: +//! +//! <img src="https://plotters-rs.github.io/plotters-doc-data/full_palette.png"></img> +use super::RGBColor; + +/* +Colors were auto-generated from the Material-UI color palette using the following +Javascript code. It can be run in a code sandbox here: https://codesandbox.io/s/q9nj9o6o44?file=/index.js + +/////////////////////////////////////////////////////// +import React from "react"; +import { render } from "react-dom"; +import * as c from "material-ui/colors"; + +function capitalize(name) { + return name.charAt(0).toUpperCase() + name.slice(1); +} + +function kebabize(str) { + return str + .split("") + .map((letter, idx) => { + return letter.toUpperCase() === letter + ? `${idx !== 0 ? " " : ""}${letter.toLowerCase()}` + : letter; + }) + .join(""); +} + +function hexToRgb(hex) { + var result = /^#?([a-f\d]{2})([a-f\d]{2})([a-f\d]{2})$/i.exec(hex); + return result + ? { + r: parseInt(result[1], 16), + g: parseInt(result[2], 16), + b: parseInt(result[3], 16) + } + : null; +} + +function ColorList() { + const colorNames = Object.keys(c); + + return ( + <pre> + {colorNames.map((name, i) => ( + <div key={i}> + {"//"} {name} + <div> + {(() => { + const rustName = name.toUpperCase(); + const cvalue = c[name][500]; + const color = hexToRgb(cvalue); + if (color == null) { + return ""; + } + let docComment = `*${capitalize(kebabize(name))}*; same as [\`${rustName}_500\`]`; + return `define_color!(${rustName}, ${color.r}, ${color.g}, ${color.b}, "${docComment}");`; + })()} + </div> + {Object.entries(c[name]).map(([cname, cvalue]) => { + const color = hexToRgb(cvalue); + if (color == null) { + return ""; + } + const rustName = `${name.toUpperCase()}_${cname}`; + const adjective = + cname > 500 + ? cname >= 800 + ? "Dark " + : "Darker " + : cname < 500 + ? cname <= 100 + ? "Light " + : "Lighter " + : ""; + const readableName = kebabize(name); + let docComment = `${adjective}*${ + adjective ? readableName : capitalize(readableName) + }* with a tint of ${cname}`; + if (cname.charAt(0) === "A") { + docComment = + "Accent *" + + docComment.charAt(1).toLowerCase() + + docComment.slice(2); + } + return ( + <div key={cname}> + define_color!({rustName}, {color.r}, {color.g}, {color.b}, " + {docComment}"); + </div> + ); + })} + </div> + ))} + </pre> + ); +} + +render(<ColorList />, document.querySelector("#root")); +/////////////////////////////////////////////////////// +*/ + +// common +define_color!(WHITE, 255, 255, 255, "*White*"); +define_color!(BLACK, 0, 0, 0, "*Black*"); +// red +define_color!(RED, 244, 67, 54, "*Red*; same as [`RED_500`]"); +define_color!(RED_50, 255, 235, 238, "Light *red* with a tint of 50"); +define_color!(RED_100, 255, 205, 210, "Light *red* with a tint of 100"); +define_color!(RED_200, 239, 154, 154, "Lighter *red* with a tint of 200"); +define_color!(RED_300, 229, 115, 115, "Lighter *red* with a tint of 300"); +define_color!(RED_400, 239, 83, 80, "Lighter *red* with a tint of 400"); +define_color!(RED_500, 244, 67, 54, "*Red* with a tint of 500"); +define_color!(RED_600, 229, 57, 53, "Darker *red* with a tint of 600"); +define_color!(RED_700, 211, 47, 47, "Darker *red* with a tint of 700"); +define_color!(RED_800, 198, 40, 40, "Dark *red* with a tint of 800"); +define_color!(RED_900, 183, 28, 28, "Dark *red* with a tint of 900"); +define_color!(RED_A100, 255, 138, 128, "Accent *red* with a tint of A100"); +define_color!(RED_A200, 255, 82, 82, "Accent *red* with a tint of A200"); +define_color!(RED_A400, 255, 23, 68, "Accent *red* with a tint of A400"); +define_color!(RED_A700, 213, 0, 0, "Accent *red* with a tint of A700"); +// pink +define_color!(PINK, 233, 30, 99, "*Pink*; same as [`PINK_500`]"); +define_color!(PINK_50, 252, 228, 236, "Light *pink* with a tint of 50"); +define_color!(PINK_100, 248, 187, 208, "Light *pink* with a tint of 100"); +define_color!(PINK_200, 244, 143, 177, "Lighter *pink* with a tint of 200"); +define_color!(PINK_300, 240, 98, 146, "Lighter *pink* with a tint of 300"); +define_color!(PINK_400, 236, 64, 122, "Lighter *pink* with a tint of 400"); +define_color!(PINK_500, 233, 30, 99, "*Pink* with a tint of 500"); +define_color!(PINK_600, 216, 27, 96, "Darker *pink* with a tint of 600"); +define_color!(PINK_700, 194, 24, 91, "Darker *pink* with a tint of 700"); +define_color!(PINK_800, 173, 20, 87, "Dark *pink* with a tint of 800"); +define_color!(PINK_900, 136, 14, 79, "Dark *pink* with a tint of 900"); +define_color!( + PINK_A100, + 255, + 128, + 171, + "Accent *pink* with a tint of A100" +); +define_color!(PINK_A200, 255, 64, 129, "Accent *pink* with a tint of A200"); +define_color!(PINK_A400, 245, 0, 87, "Accent *pink* with a tint of A400"); +define_color!(PINK_A700, 197, 17, 98, "Accent *pink* with a tint of A700"); +// purple +define_color!(PURPLE, 156, 39, 176, "*Purple*; same as [`PURPLE_500`]"); +define_color!(PURPLE_50, 243, 229, 245, "Light *purple* with a tint of 50"); +define_color!( + PURPLE_100, + 225, + 190, + 231, + "Light *purple* with a tint of 100" +); +define_color!( + PURPLE_200, + 206, + 147, + 216, + "Lighter *purple* with a tint of 200" +); +define_color!( + PURPLE_300, + 186, + 104, + 200, + "Lighter *purple* with a tint of 300" +); +define_color!( + PURPLE_400, + 171, + 71, + 188, + "Lighter *purple* with a tint of 400" +); +define_color!(PURPLE_500, 156, 39, 176, "*Purple* with a tint of 500"); +define_color!( + PURPLE_600, + 142, + 36, + 170, + "Darker *purple* with a tint of 600" +); +define_color!( + PURPLE_700, + 123, + 31, + 162, + "Darker *purple* with a tint of 700" +); +define_color!(PURPLE_800, 106, 27, 154, "Dark *purple* with a tint of 800"); +define_color!(PURPLE_900, 74, 20, 140, "Dark *purple* with a tint of 900"); +define_color!( + PURPLE_A100, + 234, + 128, + 252, + "Accent *purple* with a tint of A100" +); +define_color!( + PURPLE_A200, + 224, + 64, + 251, + "Accent *purple* with a tint of A200" +); +define_color!( + PURPLE_A400, + 213, + 0, + 249, + "Accent *purple* with a tint of A400" +); +define_color!( + PURPLE_A700, + 170, + 0, + 255, + "Accent *purple* with a tint of A700" +); +// deepPurple +define_color!( + DEEPPURPLE, + 103, + 58, + 183, + "*Deep purple*; same as [`DEEPPURPLE_500`]" +); +define_color!( + DEEPPURPLE_50, + 237, + 231, + 246, + "Light *deep purple* with a tint of 50" +); +define_color!( + DEEPPURPLE_100, + 209, + 196, + 233, + "Light *deep purple* with a tint of 100" +); +define_color!( + DEEPPURPLE_200, + 179, + 157, + 219, + "Lighter *deep purple* with a tint of 200" +); +define_color!( + DEEPPURPLE_300, + 149, + 117, + 205, + "Lighter *deep purple* with a tint of 300" +); +define_color!( + DEEPPURPLE_400, + 126, + 87, + 194, + "Lighter *deep purple* with a tint of 400" +); +define_color!( + DEEPPURPLE_500, + 103, + 58, + 183, + "*Deep purple* with a tint of 500" +); +define_color!( + DEEPPURPLE_600, + 94, + 53, + 177, + "Darker *deep purple* with a tint of 600" +); +define_color!( + DEEPPURPLE_700, + 81, + 45, + 168, + "Darker *deep purple* with a tint of 700" +); +define_color!( + DEEPPURPLE_800, + 69, + 39, + 160, + "Dark *deep purple* with a tint of 800" +); +define_color!( + DEEPPURPLE_900, + 49, + 27, + 146, + "Dark *deep purple* with a tint of 900" +); +define_color!( + DEEPPURPLE_A100, + 179, + 136, + 255, + "Accent *deep purple* with a tint of A100" +); +define_color!( + DEEPPURPLE_A200, + 124, + 77, + 255, + "Accent *deep purple* with a tint of A200" +); +define_color!( + DEEPPURPLE_A400, + 101, + 31, + 255, + "Accent *deep purple* with a tint of A400" +); +define_color!( + DEEPPURPLE_A700, + 98, + 0, + 234, + "Accent *deep purple* with a tint of A700" +); +// indigo +define_color!(INDIGO, 63, 81, 181, "*Indigo*; same as [`INDIGO_500`]"); +define_color!(INDIGO_50, 232, 234, 246, "Light *indigo* with a tint of 50"); +define_color!( + INDIGO_100, + 197, + 202, + 233, + "Light *indigo* with a tint of 100" +); +define_color!( + INDIGO_200, + 159, + 168, + 218, + "Lighter *indigo* with a tint of 200" +); +define_color!( + INDIGO_300, + 121, + 134, + 203, + "Lighter *indigo* with a tint of 300" +); +define_color!( + INDIGO_400, + 92, + 107, + 192, + "Lighter *indigo* with a tint of 400" +); +define_color!(INDIGO_500, 63, 81, 181, "*Indigo* with a tint of 500"); +define_color!( + INDIGO_600, + 57, + 73, + 171, + "Darker *indigo* with a tint of 600" +); +define_color!( + INDIGO_700, + 48, + 63, + 159, + "Darker *indigo* with a tint of 700" +); +define_color!(INDIGO_800, 40, 53, 147, "Dark *indigo* with a tint of 800"); +define_color!(INDIGO_900, 26, 35, 126, "Dark *indigo* with a tint of 900"); +define_color!( + INDIGO_A100, + 140, + 158, + 255, + "Accent *indigo* with a tint of A100" +); +define_color!( + INDIGO_A200, + 83, + 109, + 254, + "Accent *indigo* with a tint of A200" +); +define_color!( + INDIGO_A400, + 61, + 90, + 254, + "Accent *indigo* with a tint of A400" +); +define_color!( + INDIGO_A700, + 48, + 79, + 254, + "Accent *indigo* with a tint of A700" +); +// blue +define_color!(BLUE, 33, 150, 243, "*Blue*; same as [`BLUE_500`]"); +define_color!(BLUE_50, 227, 242, 253, "Light *blue* with a tint of 50"); +define_color!(BLUE_100, 187, 222, 251, "Light *blue* with a tint of 100"); +define_color!(BLUE_200, 144, 202, 249, "Lighter *blue* with a tint of 200"); +define_color!(BLUE_300, 100, 181, 246, "Lighter *blue* with a tint of 300"); +define_color!(BLUE_400, 66, 165, 245, "Lighter *blue* with a tint of 400"); +define_color!(BLUE_500, 33, 150, 243, "*Blue* with a tint of 500"); +define_color!(BLUE_600, 30, 136, 229, "Darker *blue* with a tint of 600"); +define_color!(BLUE_700, 25, 118, 210, "Darker *blue* with a tint of 700"); +define_color!(BLUE_800, 21, 101, 192, "Dark *blue* with a tint of 800"); +define_color!(BLUE_900, 13, 71, 161, "Dark *blue* with a tint of 900"); +define_color!( + BLUE_A100, + 130, + 177, + 255, + "Accent *blue* with a tint of A100" +); +define_color!(BLUE_A200, 68, 138, 255, "Accent *blue* with a tint of A200"); +define_color!(BLUE_A400, 41, 121, 255, "Accent *blue* with a tint of A400"); +define_color!(BLUE_A700, 41, 98, 255, "Accent *blue* with a tint of A700"); +// lightBlue +define_color!( + LIGHTBLUE, + 3, + 169, + 244, + "*Light blue*; same as [`LIGHTBLUE_500`]" +); +define_color!( + LIGHTBLUE_50, + 225, + 245, + 254, + "Light *light blue* with a tint of 50" +); +define_color!( + LIGHTBLUE_100, + 179, + 229, + 252, + "Light *light blue* with a tint of 100" +); +define_color!( + LIGHTBLUE_200, + 129, + 212, + 250, + "Lighter *light blue* with a tint of 200" +); +define_color!( + LIGHTBLUE_300, + 79, + 195, + 247, + "Lighter *light blue* with a tint of 300" +); +define_color!( + LIGHTBLUE_400, + 41, + 182, + 246, + "Lighter *light blue* with a tint of 400" +); +define_color!( + LIGHTBLUE_500, + 3, + 169, + 244, + "*Light blue* with a tint of 500" +); +define_color!( + LIGHTBLUE_600, + 3, + 155, + 229, + "Darker *light blue* with a tint of 600" +); +define_color!( + LIGHTBLUE_700, + 2, + 136, + 209, + "Darker *light blue* with a tint of 700" +); +define_color!( + LIGHTBLUE_800, + 2, + 119, + 189, + "Dark *light blue* with a tint of 800" +); +define_color!( + LIGHTBLUE_900, + 1, + 87, + 155, + "Dark *light blue* with a tint of 900" +); +define_color!( + LIGHTBLUE_A100, + 128, + 216, + 255, + "Accent *light blue* with a tint of A100" +); +define_color!( + LIGHTBLUE_A200, + 64, + 196, + 255, + "Accent *light blue* with a tint of A200" +); +define_color!( + LIGHTBLUE_A400, + 0, + 176, + 255, + "Accent *light blue* with a tint of A400" +); +define_color!( + LIGHTBLUE_A700, + 0, + 145, + 234, + "Accent *light blue* with a tint of A700" +); +// cyan +define_color!(CYAN, 0, 188, 212, "*Cyan*; same as [`CYAN_500`]"); +define_color!(CYAN_50, 224, 247, 250, "Light *cyan* with a tint of 50"); +define_color!(CYAN_100, 178, 235, 242, "Light *cyan* with a tint of 100"); +define_color!(CYAN_200, 128, 222, 234, "Lighter *cyan* with a tint of 200"); +define_color!(CYAN_300, 77, 208, 225, "Lighter *cyan* with a tint of 300"); +define_color!(CYAN_400, 38, 198, 218, "Lighter *cyan* with a tint of 400"); +define_color!(CYAN_500, 0, 188, 212, "*Cyan* with a tint of 500"); +define_color!(CYAN_600, 0, 172, 193, "Darker *cyan* with a tint of 600"); +define_color!(CYAN_700, 0, 151, 167, "Darker *cyan* with a tint of 700"); +define_color!(CYAN_800, 0, 131, 143, "Dark *cyan* with a tint of 800"); +define_color!(CYAN_900, 0, 96, 100, "Dark *cyan* with a tint of 900"); +define_color!( + CYAN_A100, + 132, + 255, + 255, + "Accent *cyan* with a tint of A100" +); +define_color!(CYAN_A200, 24, 255, 255, "Accent *cyan* with a tint of A200"); +define_color!(CYAN_A400, 0, 229, 255, "Accent *cyan* with a tint of A400"); +define_color!(CYAN_A700, 0, 184, 212, "Accent *cyan* with a tint of A700"); +// teal +define_color!(TEAL, 0, 150, 136, "*Teal*; same as [`TEAL_500`]"); +define_color!(TEAL_50, 224, 242, 241, "Light *teal* with a tint of 50"); +define_color!(TEAL_100, 178, 223, 219, "Light *teal* with a tint of 100"); +define_color!(TEAL_200, 128, 203, 196, "Lighter *teal* with a tint of 200"); +define_color!(TEAL_300, 77, 182, 172, "Lighter *teal* with a tint of 300"); +define_color!(TEAL_400, 38, 166, 154, "Lighter *teal* with a tint of 400"); +define_color!(TEAL_500, 0, 150, 136, "*Teal* with a tint of 500"); +define_color!(TEAL_600, 0, 137, 123, "Darker *teal* with a tint of 600"); +define_color!(TEAL_700, 0, 121, 107, "Darker *teal* with a tint of 700"); +define_color!(TEAL_800, 0, 105, 92, "Dark *teal* with a tint of 800"); +define_color!(TEAL_900, 0, 77, 64, "Dark *teal* with a tint of 900"); +define_color!( + TEAL_A100, + 167, + 255, + 235, + "Accent *teal* with a tint of A100" +); +define_color!( + TEAL_A200, + 100, + 255, + 218, + "Accent *teal* with a tint of A200" +); +define_color!(TEAL_A400, 29, 233, 182, "Accent *teal* with a tint of A400"); +define_color!(TEAL_A700, 0, 191, 165, "Accent *teal* with a tint of A700"); +// green +define_color!(GREEN, 76, 175, 80, "*Green*; same as [`GREEN_500`]"); +define_color!(GREEN_50, 232, 245, 233, "Light *green* with a tint of 50"); +define_color!(GREEN_100, 200, 230, 201, "Light *green* with a tint of 100"); +define_color!( + GREEN_200, + 165, + 214, + 167, + "Lighter *green* with a tint of 200" +); +define_color!( + GREEN_300, + 129, + 199, + 132, + "Lighter *green* with a tint of 300" +); +define_color!( + GREEN_400, + 102, + 187, + 106, + "Lighter *green* with a tint of 400" +); +define_color!(GREEN_500, 76, 175, 80, "*Green* with a tint of 500"); +define_color!(GREEN_600, 67, 160, 71, "Darker *green* with a tint of 600"); +define_color!(GREEN_700, 56, 142, 60, "Darker *green* with a tint of 700"); +define_color!(GREEN_800, 46, 125, 50, "Dark *green* with a tint of 800"); +define_color!(GREEN_900, 27, 94, 32, "Dark *green* with a tint of 900"); +define_color!( + GREEN_A100, + 185, + 246, + 202, + "Accent *green* with a tint of A100" +); +define_color!( + GREEN_A200, + 105, + 240, + 174, + "Accent *green* with a tint of A200" +); +define_color!( + GREEN_A400, + 0, + 230, + 118, + "Accent *green* with a tint of A400" +); +define_color!(GREEN_A700, 0, 200, 83, "Accent *green* with a tint of A700"); +// lightGreen +define_color!( + LIGHTGREEN, + 139, + 195, + 74, + "*Light green*; same as [`LIGHTGREEN_500`]" +); +define_color!( + LIGHTGREEN_50, + 241, + 248, + 233, + "Light *light green* with a tint of 50" +); +define_color!( + LIGHTGREEN_100, + 220, + 237, + 200, + "Light *light green* with a tint of 100" +); +define_color!( + LIGHTGREEN_200, + 197, + 225, + 165, + "Lighter *light green* with a tint of 200" +); +define_color!( + LIGHTGREEN_300, + 174, + 213, + 129, + "Lighter *light green* with a tint of 300" +); +define_color!( + LIGHTGREEN_400, + 156, + 204, + 101, + "Lighter *light green* with a tint of 400" +); +define_color!( + LIGHTGREEN_500, + 139, + 195, + 74, + "*Light green* with a tint of 500" +); +define_color!( + LIGHTGREEN_600, + 124, + 179, + 66, + "Darker *light green* with a tint of 600" +); +define_color!( + LIGHTGREEN_700, + 104, + 159, + 56, + "Darker *light green* with a tint of 700" +); +define_color!( + LIGHTGREEN_800, + 85, + 139, + 47, + "Dark *light green* with a tint of 800" +); +define_color!( + LIGHTGREEN_900, + 51, + 105, + 30, + "Dark *light green* with a tint of 900" +); +define_color!( + LIGHTGREEN_A100, + 204, + 255, + 144, + "Accent *light green* with a tint of A100" +); +define_color!( + LIGHTGREEN_A200, + 178, + 255, + 89, + "Accent *light green* with a tint of A200" +); +define_color!( + LIGHTGREEN_A400, + 118, + 255, + 3, + "Accent *light green* with a tint of A400" +); +define_color!( + LIGHTGREEN_A700, + 100, + 221, + 23, + "Accent *light green* with a tint of A700" +); +// lime +define_color!(LIME, 205, 220, 57, "*Lime*; same as [`LIME_500`]"); +define_color!(LIME_50, 249, 251, 231, "Light *lime* with a tint of 50"); +define_color!(LIME_100, 240, 244, 195, "Light *lime* with a tint of 100"); +define_color!(LIME_200, 230, 238, 156, "Lighter *lime* with a tint of 200"); +define_color!(LIME_300, 220, 231, 117, "Lighter *lime* with a tint of 300"); +define_color!(LIME_400, 212, 225, 87, "Lighter *lime* with a tint of 400"); +define_color!(LIME_500, 205, 220, 57, "*Lime* with a tint of 500"); +define_color!(LIME_600, 192, 202, 51, "Darker *lime* with a tint of 600"); +define_color!(LIME_700, 175, 180, 43, "Darker *lime* with a tint of 700"); +define_color!(LIME_800, 158, 157, 36, "Dark *lime* with a tint of 800"); +define_color!(LIME_900, 130, 119, 23, "Dark *lime* with a tint of 900"); +define_color!( + LIME_A100, + 244, + 255, + 129, + "Accent *lime* with a tint of A100" +); +define_color!(LIME_A200, 238, 255, 65, "Accent *lime* with a tint of A200"); +define_color!(LIME_A400, 198, 255, 0, "Accent *lime* with a tint of A400"); +define_color!(LIME_A700, 174, 234, 0, "Accent *lime* with a tint of A700"); +// yellow +define_color!(YELLOW, 255, 235, 59, "*Yellow*; same as [`YELLOW_500`]"); +define_color!(YELLOW_50, 255, 253, 231, "Light *yellow* with a tint of 50"); +define_color!( + YELLOW_100, + 255, + 249, + 196, + "Light *yellow* with a tint of 100" +); +define_color!( + YELLOW_200, + 255, + 245, + 157, + "Lighter *yellow* with a tint of 200" +); +define_color!( + YELLOW_300, + 255, + 241, + 118, + "Lighter *yellow* with a tint of 300" +); +define_color!( + YELLOW_400, + 255, + 238, + 88, + "Lighter *yellow* with a tint of 400" +); +define_color!(YELLOW_500, 255, 235, 59, "*Yellow* with a tint of 500"); +define_color!( + YELLOW_600, + 253, + 216, + 53, + "Darker *yellow* with a tint of 600" +); +define_color!( + YELLOW_700, + 251, + 192, + 45, + "Darker *yellow* with a tint of 700" +); +define_color!(YELLOW_800, 249, 168, 37, "Dark *yellow* with a tint of 800"); +define_color!(YELLOW_900, 245, 127, 23, "Dark *yellow* with a tint of 900"); +define_color!( + YELLOW_A100, + 255, + 255, + 141, + "Accent *yellow* with a tint of A100" +); +define_color!( + YELLOW_A200, + 255, + 255, + 0, + "Accent *yellow* with a tint of A200" +); +define_color!( + YELLOW_A400, + 255, + 234, + 0, + "Accent *yellow* with a tint of A400" +); +define_color!( + YELLOW_A700, + 255, + 214, + 0, + "Accent *yellow* with a tint of A700" +); +// amber +define_color!(AMBER, 255, 193, 7, "*Amber*; same as [`AMBER_500`]"); +define_color!(AMBER_50, 255, 248, 225, "Light *amber* with a tint of 50"); +define_color!(AMBER_100, 255, 236, 179, "Light *amber* with a tint of 100"); +define_color!( + AMBER_200, + 255, + 224, + 130, + "Lighter *amber* with a tint of 200" +); +define_color!( + AMBER_300, + 255, + 213, + 79, + "Lighter *amber* with a tint of 300" +); +define_color!( + AMBER_400, + 255, + 202, + 40, + "Lighter *amber* with a tint of 400" +); +define_color!(AMBER_500, 255, 193, 7, "*Amber* with a tint of 500"); +define_color!(AMBER_600, 255, 179, 0, "Darker *amber* with a tint of 600"); +define_color!(AMBER_700, 255, 160, 0, "Darker *amber* with a tint of 700"); +define_color!(AMBER_800, 255, 143, 0, "Dark *amber* with a tint of 800"); +define_color!(AMBER_900, 255, 111, 0, "Dark *amber* with a tint of 900"); +define_color!( + AMBER_A100, + 255, + 229, + 127, + "Accent *amber* with a tint of A100" +); +define_color!( + AMBER_A200, + 255, + 215, + 64, + "Accent *amber* with a tint of A200" +); +define_color!( + AMBER_A400, + 255, + 196, + 0, + "Accent *amber* with a tint of A400" +); +define_color!( + AMBER_A700, + 255, + 171, + 0, + "Accent *amber* with a tint of A700" +); +// orange +define_color!(ORANGE, 255, 152, 0, "*Orange*; same as [`ORANGE_500`]"); +define_color!(ORANGE_50, 255, 243, 224, "Light *orange* with a tint of 50"); +define_color!( + ORANGE_100, + 255, + 224, + 178, + "Light *orange* with a tint of 100" +); +define_color!( + ORANGE_200, + 255, + 204, + 128, + "Lighter *orange* with a tint of 200" +); +define_color!( + ORANGE_300, + 255, + 183, + 77, + "Lighter *orange* with a tint of 300" +); +define_color!( + ORANGE_400, + 255, + 167, + 38, + "Lighter *orange* with a tint of 400" +); +define_color!(ORANGE_500, 255, 152, 0, "*Orange* with a tint of 500"); +define_color!( + ORANGE_600, + 251, + 140, + 0, + "Darker *orange* with a tint of 600" +); +define_color!( + ORANGE_700, + 245, + 124, + 0, + "Darker *orange* with a tint of 700" +); +define_color!(ORANGE_800, 239, 108, 0, "Dark *orange* with a tint of 800"); +define_color!(ORANGE_900, 230, 81, 0, "Dark *orange* with a tint of 900"); +define_color!( + ORANGE_A100, + 255, + 209, + 128, + "Accent *orange* with a tint of A100" +); +define_color!( + ORANGE_A200, + 255, + 171, + 64, + "Accent *orange* with a tint of A200" +); +define_color!( + ORANGE_A400, + 255, + 145, + 0, + "Accent *orange* with a tint of A400" +); +define_color!( + ORANGE_A700, + 255, + 109, + 0, + "Accent *orange* with a tint of A700" +); +// deepOrange +define_color!( + DEEPORANGE, + 255, + 87, + 34, + "*Deep orange*; same as [`DEEPORANGE_500`]" +); +define_color!( + DEEPORANGE_50, + 251, + 233, + 231, + "Light *deep orange* with a tint of 50" +); +define_color!( + DEEPORANGE_100, + 255, + 204, + 188, + "Light *deep orange* with a tint of 100" +); +define_color!( + DEEPORANGE_200, + 255, + 171, + 145, + "Lighter *deep orange* with a tint of 200" +); +define_color!( + DEEPORANGE_300, + 255, + 138, + 101, + "Lighter *deep orange* with a tint of 300" +); +define_color!( + DEEPORANGE_400, + 255, + 112, + 67, + "Lighter *deep orange* with a tint of 400" +); +define_color!( + DEEPORANGE_500, + 255, + 87, + 34, + "*Deep orange* with a tint of 500" +); +define_color!( + DEEPORANGE_600, + 244, + 81, + 30, + "Darker *deep orange* with a tint of 600" +); +define_color!( + DEEPORANGE_700, + 230, + 74, + 25, + "Darker *deep orange* with a tint of 700" +); +define_color!( + DEEPORANGE_800, + 216, + 67, + 21, + "Dark *deep orange* with a tint of 800" +); +define_color!( + DEEPORANGE_900, + 191, + 54, + 12, + "Dark *deep orange* with a tint of 900" +); +define_color!( + DEEPORANGE_A100, + 255, + 158, + 128, + "Accent *deep orange* with a tint of A100" +); +define_color!( + DEEPORANGE_A200, + 255, + 110, + 64, + "Accent *deep orange* with a tint of A200" +); +define_color!( + DEEPORANGE_A400, + 255, + 61, + 0, + "Accent *deep orange* with a tint of A400" +); +define_color!( + DEEPORANGE_A700, + 221, + 44, + 0, + "Accent *deep orange* with a tint of A700" +); +// brown +define_color!(BROWN, 121, 85, 72, "*Brown*; same as [`BROWN_500`]"); +define_color!(BROWN_50, 239, 235, 233, "Light *brown* with a tint of 50"); +define_color!(BROWN_100, 215, 204, 200, "Light *brown* with a tint of 100"); +define_color!( + BROWN_200, + 188, + 170, + 164, + "Lighter *brown* with a tint of 200" +); +define_color!( + BROWN_300, + 161, + 136, + 127, + "Lighter *brown* with a tint of 300" +); +define_color!( + BROWN_400, + 141, + 110, + 99, + "Lighter *brown* with a tint of 400" +); +define_color!(BROWN_500, 121, 85, 72, "*Brown* with a tint of 500"); +define_color!(BROWN_600, 109, 76, 65, "Darker *brown* with a tint of 600"); +define_color!(BROWN_700, 93, 64, 55, "Darker *brown* with a tint of 700"); +define_color!(BROWN_800, 78, 52, 46, "Dark *brown* with a tint of 800"); +define_color!(BROWN_900, 62, 39, 35, "Dark *brown* with a tint of 900"); +define_color!( + BROWN_A100, + 215, + 204, + 200, + "Accent *brown* with a tint of A100" +); +define_color!( + BROWN_A200, + 188, + 170, + 164, + "Accent *brown* with a tint of A200" +); +define_color!( + BROWN_A400, + 141, + 110, + 99, + "Accent *brown* with a tint of A400" +); +define_color!(BROWN_A700, 93, 64, 55, "Accent *brown* with a tint of A700"); +// grey +define_color!(GREY, 158, 158, 158, "*Grey*; same as [`GREY_500`]"); +define_color!(GREY_50, 250, 250, 250, "Light *grey* with a tint of 50"); +define_color!(GREY_100, 245, 245, 245, "Light *grey* with a tint of 100"); +define_color!(GREY_200, 238, 238, 238, "Lighter *grey* with a tint of 200"); +define_color!(GREY_300, 224, 224, 224, "Lighter *grey* with a tint of 300"); +define_color!(GREY_400, 189, 189, 189, "Lighter *grey* with a tint of 400"); +define_color!(GREY_500, 158, 158, 158, "*Grey* with a tint of 500"); +define_color!(GREY_600, 117, 117, 117, "Darker *grey* with a tint of 600"); +define_color!(GREY_700, 97, 97, 97, "Darker *grey* with a tint of 700"); +define_color!(GREY_800, 66, 66, 66, "Dark *grey* with a tint of 800"); +define_color!(GREY_900, 33, 33, 33, "Dark *grey* with a tint of 900"); +define_color!( + GREY_A100, + 213, + 213, + 213, + "Accent *grey* with a tint of A100" +); +define_color!( + GREY_A200, + 170, + 170, + 170, + "Accent *grey* with a tint of A200" +); +define_color!(GREY_A400, 48, 48, 48, "Accent *grey* with a tint of A400"); +define_color!(GREY_A700, 97, 97, 97, "Accent *grey* with a tint of A700"); +// blueGrey +define_color!( + BLUEGREY, + 96, + 125, + 139, + "*Blue grey*; same as [`BLUEGREY_500`]" +); +define_color!( + BLUEGREY_50, + 236, + 239, + 241, + "Light *blue grey* with a tint of 50" +); +define_color!( + BLUEGREY_100, + 207, + 216, + 220, + "Light *blue grey* with a tint of 100" +); +define_color!( + BLUEGREY_200, + 176, + 190, + 197, + "Lighter *blue grey* with a tint of 200" +); +define_color!( + BLUEGREY_300, + 144, + 164, + 174, + "Lighter *blue grey* with a tint of 300" +); +define_color!( + BLUEGREY_400, + 120, + 144, + 156, + "Lighter *blue grey* with a tint of 400" +); +define_color!(BLUEGREY_500, 96, 125, 139, "*Blue grey* with a tint of 500"); +define_color!( + BLUEGREY_600, + 84, + 110, + 122, + "Darker *blue grey* with a tint of 600" +); +define_color!( + BLUEGREY_700, + 69, + 90, + 100, + "Darker *blue grey* with a tint of 700" +); +define_color!( + BLUEGREY_800, + 55, + 71, + 79, + "Dark *blue grey* with a tint of 800" +); +define_color!( + BLUEGREY_900, + 38, + 50, + 56, + "Dark *blue grey* with a tint of 900" +); +define_color!( + BLUEGREY_A100, + 207, + 216, + 220, + "Accent *blue grey* with a tint of A100" +); +define_color!( + BLUEGREY_A200, + 176, + 190, + 197, + "Accent *blue grey* with a tint of A200" +); +define_color!( + BLUEGREY_A400, + 120, + 144, + 156, + "Accent *blue grey* with a tint of A400" +); +define_color!( + BLUEGREY_A700, + 69, + 90, + 100, + "Accent *blue grey* with a tint of A700" +); diff --git a/vendor/plotters/src/style/colors/mod.rs b/vendor/plotters/src/style/colors/mod.rs new file mode 100644 index 000000000..34448ba0b --- /dev/null +++ b/vendor/plotters/src/style/colors/mod.rs @@ -0,0 +1,59 @@ +//! Basic predefined colors. +use super::{RGBAColor, RGBColor}; + +// Macro for allowing dynamic creation of doc attributes. +// Taken from https://stackoverflow.com/questions/60905060/prevent-line-break-in-doc-test +macro_rules! doc { + { + $(#[$m:meta])* + $( + [$doc:expr] + $(#[$n:meta])* + )* + @ $thing:item + } => { + $(#[$m])* + $( + #[doc = $doc] + $(#[$n])* + )* + $thing + } +} + +/// Defines and names a color based on its R, G, B, A values. +#[macro_export] +macro_rules! define_color { + ($name:ident, $r:expr, $g:expr, $b:expr, $doc:expr) => { + doc! { + [$doc] + // Format a colored box that will show up in the docs + [concat!("(<span style='color: rgb(", $r,",", $g, ",", $b, "); background-color: #ddd; padding: 0 0.2em;'>■</span>" )] + [concat!("*rgb = (", $r,", ", $g, ", ", $b, ")*)")] + @pub const $name: RGBColor = RGBColor($r, $g, $b); + } + }; + + ($name:ident, $r:expr, $g:expr, $b:expr, $a: expr, $doc:expr) => { + doc! { + [$doc] + // Format a colored box that will show up in the docs + [concat!("(<span style='color: rgba(", $r,",", $g, ",", $b, ",", $a, "); background-color: #ddd; padding: 0 0.2em;'>■</span>" )] + [concat!("*rgba = (", $r,", ", $g, ", ", $b, ", ", $a, ")*)")] + @pub const $name: RGBAColor = RGBAColor($r, $g, $b, $a); + } + }; +} + +define_color!(WHITE, 255, 255, 255, "White"); +define_color!(BLACK, 0, 0, 0, "Black"); +define_color!(RED, 255, 0, 0, "Red"); +define_color!(GREEN, 0, 255, 0, "Green"); +define_color!(BLUE, 0, 0, 255, "Blue"); +define_color!(YELLOW, 255, 255, 0, "Yellow"); +define_color!(CYAN, 0, 255, 255, "Cyan"); +define_color!(MAGENTA, 255, 0, 255, "Magenta"); +define_color!(TRANSPARENT, 0, 0, 0, 0.0, "Transparent"); + +#[cfg(feature = "full_palette")] +pub mod full_palette; diff --git a/vendor/plotters/src/style/font/font_desc.rs b/vendor/plotters/src/style/font/font_desc.rs new file mode 100644 index 000000000..a101a5d8b --- /dev/null +++ b/vendor/plotters/src/style/font/font_desc.rs @@ -0,0 +1,220 @@ +use super::{FontData, FontDataInternal}; +use crate::style::text_anchor::Pos; +use crate::style::{Color, TextStyle}; + +use std::convert::From; + +pub use plotters_backend::{FontFamily, FontStyle, FontTransform}; + +/// The error type for the font implementation +pub type FontError = <FontDataInternal as FontData>::ErrorType; + +/// The type we used to represent a result of any font operations +pub type FontResult<T> = Result<T, FontError>; + +/// Describes a font +#[derive(Clone)] +pub struct FontDesc<'a> { + size: f64, + family: FontFamily<'a>, + data: FontResult<FontDataInternal>, + transform: FontTransform, + style: FontStyle, +} + +impl<'a> FontDesc<'a> { + /// Create a new font + /// + /// - `family`: The font family name + /// - `size`: The size of the font + /// - `style`: The font variations + /// - **returns** The newly created font description + pub fn new(family: FontFamily<'a>, size: f64, style: FontStyle) -> Self { + Self { + size, + family, + data: FontDataInternal::new(family, style), + transform: FontTransform::None, + style, + } + } + + /// Create a new font desc with the same font but different size + /// + /// - `size`: The new size to set + /// - **returns** The newly created font descriptor with a new size + pub fn resize(&self, size: f64) -> Self { + Self { + size, + family: self.family, + data: self.data.clone(), + transform: self.transform.clone(), + style: self.style, + } + } + + /// Set the style of the font + /// + /// - `style`: The new style + /// - **returns** The new font description with this style applied + pub fn style(&self, style: FontStyle) -> Self { + Self { + size: self.size, + family: self.family, + data: self.data.clone(), + transform: self.transform.clone(), + style, + } + } + + /// Set the font transformation + /// + /// - `trans`: The new transformation + /// - **returns** The new font description with this font transformation applied + pub fn transform(&self, trans: FontTransform) -> Self { + Self { + size: self.size, + family: self.family, + data: self.data.clone(), + transform: trans, + style: self.style, + } + } + + /// Get the font transformation description + pub fn get_transform(&self) -> FontTransform { + self.transform.clone() + } + + /** Returns a new text style object with the specified `color`. + + # Example + + ``` + use plotters::prelude::*; + let text_style = ("sans-serif", 20).into_font().color(&RED); + let drawing_area = SVGBackend::new("font_desc_color.svg", (200, 100)).into_drawing_area(); + drawing_area.fill(&WHITE).unwrap(); + drawing_area.draw_text("This is a big red label", &text_style, (10, 50)); + ``` + + The result is a text label colorized accordingly: + +  + + # See also + + [`IntoTextStyle::with_color()`](crate::style::IntoTextStyle::with_color) + + [`IntoTextStyle::into_text_style()`](crate::style::IntoTextStyle::into_text_style) for a more succinct example + + */ + pub fn color<C: Color>(&self, color: &C) -> TextStyle<'a> { + TextStyle { + font: self.clone(), + color: color.to_backend_color(), + pos: Pos::default(), + } + } + + /// Returns the font family + pub fn get_family(&self) -> FontFamily { + self.family + } + + /// Get the name of the font + pub fn get_name(&self) -> &str { + self.family.as_str() + } + + /// Get the name of the style + pub fn get_style(&self) -> FontStyle { + self.style + } + + /// Get the size of font + pub fn get_size(&self) -> f64 { + self.size + } + + /// Get the size of the text if rendered in this font + /// + /// For a TTF type, zero point of the layout box is the left most baseline char of the string + /// Thus the upper bound of the box is most likely be negative + pub fn layout_box(&self, text: &str) -> FontResult<((i32, i32), (i32, i32))> { + match &self.data { + Ok(ref font) => font.estimate_layout(self.size, text), + Err(e) => Err(e.clone()), + } + } + + /// Get the size of the text if rendered in this font. + /// This is similar to `layout_box` function, but it apply the font transformation + /// and estimate the overall size of the font + pub fn box_size(&self, text: &str) -> FontResult<(u32, u32)> { + let ((min_x, min_y), (max_x, max_y)) = self.layout_box(text)?; + let (w, h) = self.get_transform().transform(max_x - min_x, max_y - min_y); + Ok((w.unsigned_abs(), h.unsigned_abs())) + } + + /// Actually draws a font with a drawing function + pub fn draw<E, DrawFunc: FnMut(i32, i32, f32) -> Result<(), E>>( + &self, + text: &str, + (x, y): (i32, i32), + draw: DrawFunc, + ) -> FontResult<Result<(), E>> { + match &self.data { + Ok(ref font) => font.draw((x, y), self.size, text, draw), + Err(e) => Err(e.clone()), + } + } +} + +impl<'a> From<&'a str> for FontDesc<'a> { + fn from(from: &'a str) -> FontDesc<'a> { + FontDesc::new(from.into(), 12.0, FontStyle::Normal) + } +} + +impl<'a> From<FontFamily<'a>> for FontDesc<'a> { + fn from(family: FontFamily<'a>) -> FontDesc<'a> { + FontDesc::new(family, 12.0, FontStyle::Normal) + } +} + +impl<'a, T: Into<f64>> From<(FontFamily<'a>, T)> for FontDesc<'a> { + fn from((family, size): (FontFamily<'a>, T)) -> FontDesc<'a> { + FontDesc::new(family, size.into(), FontStyle::Normal) + } +} + +impl<'a, T: Into<f64>> From<(&'a str, T)> for FontDesc<'a> { + fn from((typeface, size): (&'a str, T)) -> FontDesc<'a> { + FontDesc::new(typeface.into(), size.into(), FontStyle::Normal) + } +} + +impl<'a, T: Into<f64>, S: Into<FontStyle>> From<(FontFamily<'a>, T, S)> for FontDesc<'a> { + fn from((family, size, style): (FontFamily<'a>, T, S)) -> FontDesc<'a> { + FontDesc::new(family, size.into(), style.into()) + } +} + +impl<'a, T: Into<f64>, S: Into<FontStyle>> From<(&'a str, T, S)> for FontDesc<'a> { + fn from((typeface, size, style): (&'a str, T, S)) -> FontDesc<'a> { + FontDesc::new(typeface.into(), size.into(), style.into()) + } +} + +/// The trait that allows some type turns into a font description +pub trait IntoFont<'a> { + /// Make the font description from the source type + fn into_font(self) -> FontDesc<'a>; +} + +impl<'a, T: Into<FontDesc<'a>>> IntoFont<'a> for T { + fn into_font(self) -> FontDesc<'a> { + self.into() + } +} diff --git a/vendor/plotters/src/style/font/mod.rs b/vendor/plotters/src/style/font/mod.rs new file mode 100644 index 000000000..305978fd0 --- /dev/null +++ b/vendor/plotters/src/style/font/mod.rs @@ -0,0 +1,55 @@ +/// The implementation of an actual font implementation +/// +/// This exists since for the image rendering task, we want to use +/// the system font. But in wasm application, we want the browser +/// to handle all the font issue. +/// +/// Thus we need different mechanism for the font implementation + +#[cfg(all( + not(all(target_arch = "wasm32", not(target_os = "wasi"))), + feature = "ttf" +))] +mod ttf; +#[cfg(all( + not(all(target_arch = "wasm32", not(target_os = "wasi"))), + feature = "ttf" +))] +use ttf::FontDataInternal; + +#[cfg(all( + not(all(target_arch = "wasm32", not(target_os = "wasi"))), + not(feature = "ttf") +))] +mod naive; +#[cfg(all( + not(all(target_arch = "wasm32", not(target_os = "wasi"))), + not(feature = "ttf") +))] +use naive::FontDataInternal; + +#[cfg(all(target_arch = "wasm32", not(target_os = "wasi")))] +mod web; +#[cfg(all(target_arch = "wasm32", not(target_os = "wasi")))] +use web::FontDataInternal; + +mod font_desc; +pub use font_desc::*; + +/// Represents a box where a text label can be fit +pub type LayoutBox = ((i32, i32), (i32, i32)); + +pub trait FontData: Clone { + type ErrorType: Sized + std::error::Error + Clone; + fn new(family: FontFamily, style: FontStyle) -> Result<Self, Self::ErrorType>; + fn estimate_layout(&self, size: f64, text: &str) -> Result<LayoutBox, Self::ErrorType>; + fn draw<E, DrawFunc: FnMut(i32, i32, f32) -> Result<(), E>>( + &self, + _pos: (i32, i32), + _size: f64, + _text: &str, + _draw: DrawFunc, + ) -> Result<Result<(), E>, Self::ErrorType> { + panic!("The font implementation is unable to draw text"); + } +} diff --git a/vendor/plotters/src/style/font/naive.rs b/vendor/plotters/src/style/font/naive.rs new file mode 100644 index 000000000..99530401b --- /dev/null +++ b/vendor/plotters/src/style/font/naive.rs @@ -0,0 +1,40 @@ +use super::{FontData, FontFamily, FontStyle, LayoutBox}; + +#[derive(Debug, Clone)] +pub struct FontError; + +impl std::fmt::Display for FontError { + fn fmt(&self, fmt: &mut std::fmt::Formatter) -> Result<(), std::fmt::Error> { + write!(fmt, "General Error")?; + Ok(()) + } +} + +impl std::error::Error for FontError {} + +#[derive(Clone)] +pub struct FontDataInternal(String, String); + +impl FontData for FontDataInternal { + type ErrorType = FontError; + fn new(family: FontFamily, style: FontStyle) -> Result<Self, FontError> { + Ok(FontDataInternal( + family.as_str().into(), + style.as_str().into(), + )) + } + + /// Note: This is only a crude estimatation, since for some backend such as SVG, we have no way to + /// know the real size of the text anyway. Thus using font-kit is an overkill and doesn't helps + /// the layout. + fn estimate_layout(&self, size: f64, text: &str) -> Result<LayoutBox, Self::ErrorType> { + let em = size / 1.24 / 1.24; + Ok(( + (0, -em.round() as i32), + ( + (em * 0.7 * text.len() as f64).round() as i32, + (em * 0.24).round() as i32, + ), + )) + } +} diff --git a/vendor/plotters/src/style/font/ttf.rs b/vendor/plotters/src/style/font/ttf.rs new file mode 100644 index 000000000..e6feadc82 --- /dev/null +++ b/vendor/plotters/src/style/font/ttf.rs @@ -0,0 +1,321 @@ +use std::borrow::{Borrow, Cow}; +use std::cell::RefCell; +use std::collections::HashMap; +use std::i32; +use std::sync::{Arc, RwLock}; + +use lazy_static::lazy_static; + +use font_kit::{ + canvas::{Canvas, Format, RasterizationOptions}, + error::{FontLoadingError, GlyphLoadingError}, + family_name::FamilyName, + font::Font, + handle::Handle, + hinting::HintingOptions, + properties::{Properties, Style, Weight}, + source::SystemSource, +}; + +use ttf_parser::{Face, GlyphId}; + +use pathfinder_geometry::transform2d::Transform2F; +use pathfinder_geometry::vector::{Vector2F, Vector2I}; + +use super::{FontData, FontFamily, FontStyle, LayoutBox}; + +type FontResult<T> = Result<T, FontError>; + +#[derive(Debug, Clone)] +pub enum FontError { + LockError, + NoSuchFont(String, String), + FontLoadError(Arc<FontLoadingError>), + GlyphError(Arc<GlyphLoadingError>), +} + +impl std::fmt::Display for FontError { + fn fmt(&self, fmt: &mut std::fmt::Formatter) -> Result<(), std::fmt::Error> { + match self { + FontError::LockError => write!(fmt, "Could not lock mutex"), + FontError::NoSuchFont(family, style) => { + write!(fmt, "No such font: {} {}", family, style) + } + FontError::FontLoadError(e) => write!(fmt, "Font loading error {}", e), + FontError::GlyphError(e) => write!(fmt, "Glyph error {}", e), + } + } +} + +impl std::error::Error for FontError {} + +lazy_static! { + static ref DATA_CACHE: RwLock<HashMap<String, FontResult<Handle>>> = + RwLock::new(HashMap::new()); +} + +thread_local! { + static FONT_SOURCE: SystemSource = SystemSource::new(); + static FONT_OBJECT_CACHE: RefCell<HashMap<String, FontExt>> = RefCell::new(HashMap::new()); +} + +const PLACEHOLDER_CHAR: char = '�'; + +#[derive(Clone)] +struct FontExt { + inner: Font, + face: Option<Face<'static>>, +} + +impl Drop for FontExt { + fn drop(&mut self) { + // We should make sure the face object dead first + self.face.take(); + } +} + +impl FontExt { + fn new(font: Font) -> Self { + let handle = font.handle(); + let (data, idx) = match handle.as_ref() { + Some(Handle::Memory { bytes, font_index }) => (&bytes[..], *font_index), + _ => unreachable!(), + }; + let face = unsafe { + std::mem::transmute::<_, Option<Face<'static>>>( + ttf_parser::Face::from_slice(data, idx).ok(), + ) + }; + Self { inner: font, face } + } + + fn query_kerning_table(&self, prev: u32, next: u32) -> f32 { + if let Some(face) = self.face.as_ref() { + if let Some(kern) = face.tables().kern { + let kern = kern + .subtables + .into_iter() + .filter(|st| st.horizontal && !st.variable) + .filter_map(|st| st.glyphs_kerning(GlyphId(prev as u16), GlyphId(next as u16))) + .next() + .unwrap_or(0); + return kern as f32; + } + } + 0.0 + } +} + +impl std::ops::Deref for FontExt { + type Target = Font; + fn deref(&self) -> &Font { + &self.inner + } +} + +/// Lazily load font data. Font type doesn't own actual data, which +/// lives in the cache. +fn load_font_data(face: FontFamily, style: FontStyle) -> FontResult<FontExt> { + let key = match style { + FontStyle::Normal => Cow::Borrowed(face.as_str()), + _ => Cow::Owned(format!("{}, {}", face.as_str(), style.as_str())), + }; + + // First, we try to find the font object for current thread + if let Some(font_object) = FONT_OBJECT_CACHE.with(|font_object_cache| { + font_object_cache + .borrow() + .get(Borrow::<str>::borrow(&key)) + .map(Clone::clone) + }) { + return Ok(font_object); + } + + // Then we need to check if the data cache contains the font data + let cache = DATA_CACHE.read().unwrap(); + if let Some(data) = cache.get(Borrow::<str>::borrow(&key)) { + return data.clone().map(|handle| { + handle + .load() + .map(FontExt::new) + .map_err(|e| FontError::FontLoadError(Arc::new(e))) + })?; + } + drop(cache); + + // Otherwise we should load from system + let mut properties = Properties::new(); + match style { + FontStyle::Normal => properties.style(Style::Normal), + FontStyle::Italic => properties.style(Style::Italic), + FontStyle::Oblique => properties.style(Style::Oblique), + FontStyle::Bold => properties.weight(Weight::BOLD), + }; + + let family = match face { + FontFamily::Serif => FamilyName::Serif, + FontFamily::SansSerif => FamilyName::SansSerif, + FontFamily::Monospace => FamilyName::Monospace, + FontFamily::Name(name) => FamilyName::Title(name.to_owned()), + }; + + let make_not_found_error = + || FontError::NoSuchFont(face.as_str().to_owned(), style.as_str().to_owned()); + + if let Ok(handle) = FONT_SOURCE + .with(|source| source.select_best_match(&[family, FamilyName::SansSerif], &properties)) + { + let font = handle + .load() + .map(FontExt::new) + .map_err(|e| FontError::FontLoadError(Arc::new(e))); + let (should_cache, data) = match font.as_ref().map(|f| f.handle()) { + Ok(None) => (false, Err(FontError::LockError)), + Ok(Some(handle)) => (true, Ok(handle)), + Err(e) => (true, Err(e.clone())), + }; + + if should_cache { + DATA_CACHE + .write() + .map_err(|_| FontError::LockError)? + .insert(key.clone().into_owned(), data); + } + + if let Ok(font) = font.as_ref() { + FONT_OBJECT_CACHE.with(|font_object_cache| { + font_object_cache + .borrow_mut() + .insert(key.into_owned(), font.clone()); + }); + } + + return font; + } + Err(make_not_found_error()) +} + +#[derive(Clone)] +pub struct FontDataInternal(FontExt); + +impl FontData for FontDataInternal { + type ErrorType = FontError; + + fn new(family: FontFamily, style: FontStyle) -> Result<Self, FontError> { + Ok(FontDataInternal(load_font_data(family, style)?)) + } + + fn estimate_layout(&self, size: f64, text: &str) -> Result<LayoutBox, Self::ErrorType> { + let font = &self.0; + let pixel_per_em = size / 1.24; + let metrics = font.metrics(); + + let font = &self.0; + + let mut x_in_unit = 0f32; + + let mut prev = None; + let place_holder = font.glyph_for_char(PLACEHOLDER_CHAR); + + for c in text.chars() { + if let Some(glyph_id) = font.glyph_for_char(c).or(place_holder) { + if let Ok(size) = font.advance(glyph_id) { + x_in_unit += size.x(); + } + if let Some(pc) = prev { + x_in_unit += font.query_kerning_table(pc, glyph_id); + } + prev = Some(glyph_id); + } + } + + let x_pixels = x_in_unit * pixel_per_em as f32 / metrics.units_per_em as f32; + + Ok(((0, 0), (x_pixels as i32, pixel_per_em as i32))) + } + + fn draw<E, DrawFunc: FnMut(i32, i32, f32) -> Result<(), E>>( + &self, + (base_x, mut base_y): (i32, i32), + size: f64, + text: &str, + mut draw: DrawFunc, + ) -> Result<Result<(), E>, Self::ErrorType> { + let em = (size / 1.24) as f32; + + let mut x = base_x as f32; + let font = &self.0; + let metrics = font.metrics(); + + let canvas_size = size as usize; + + base_y -= (0.24 * em) as i32; + + let mut prev = None; + let place_holder = font.glyph_for_char(PLACEHOLDER_CHAR); + + let mut result = Ok(()); + + for c in text.chars() { + if let Some(glyph_id) = font.glyph_for_char(c).or(place_holder) { + if let Some(pc) = prev { + x += font.query_kerning_table(pc, glyph_id) * em / metrics.units_per_em as f32; + } + + let mut canvas = Canvas::new(Vector2I::splat(canvas_size as i32), Format::A8); + + result = font + .rasterize_glyph( + &mut canvas, + glyph_id, + em as f32, + Transform2F::from_translation(Vector2F::new(0.0, em as f32)), + HintingOptions::None, + RasterizationOptions::GrayscaleAa, + ) + .map_err(|e| FontError::GlyphError(Arc::new(e))) + .and(result); + + let base_x = x as i32; + + for dy in 0..canvas_size { + for dx in 0..canvas_size { + let alpha = canvas.pixels[dy * canvas_size + dx] as f32 / 255.0; + if let Err(e) = draw(base_x + dx as i32, base_y + dy as i32, alpha) { + return Ok(Err(e)); + } + } + } + + x += font.advance(glyph_id).map(|size| size.x()).unwrap_or(0.0) * em + / metrics.units_per_em as f32; + + prev = Some(glyph_id); + } + } + result?; + Ok(Ok(())) + } +} + +#[cfg(test)] +mod test { + + use super::*; + + #[test] + fn test_font_cache() -> FontResult<()> { + // We cannot only check the size of font cache, because + // the test case may be run in parallel. Thus the font cache + // may contains other fonts. + let _a = load_font_data(FontFamily::Serif, FontStyle::Normal)?; + assert!(DATA_CACHE.read().unwrap().contains_key("serif")); + + let _b = load_font_data(FontFamily::Serif, FontStyle::Normal)?; + assert!(DATA_CACHE.read().unwrap().contains_key("serif")); + + // TODO: Check they are the same + + return Ok(()); + } +} diff --git a/vendor/plotters/src/style/font/web.rs b/vendor/plotters/src/style/font/web.rs new file mode 100644 index 000000000..e70e7b1aa --- /dev/null +++ b/vendor/plotters/src/style/font/web.rs @@ -0,0 +1,46 @@ +use super::{FontData, FontFamily, FontStyle, LayoutBox}; +use wasm_bindgen::JsCast; +use web_sys::{window, HtmlElement}; + +#[derive(Debug, Clone)] +pub enum FontError { + UnknownError, +} + +impl std::fmt::Display for FontError { + fn fmt(&self, fmt: &mut std::fmt::Formatter) -> Result<(), std::fmt::Error> { + match self { + _ => write!(fmt, "Unknown error"), + } + } +} + +impl std::error::Error for FontError {} + +#[derive(Clone)] +pub struct FontDataInternal(String, String); + +impl FontData for FontDataInternal { + type ErrorType = FontError; + fn new(family: FontFamily, style: FontStyle) -> Result<Self, FontError> { + Ok(FontDataInternal( + family.as_str().into(), + style.as_str().into(), + )) + } + fn estimate_layout(&self, size: f64, text: &str) -> Result<LayoutBox, Self::ErrorType> { + let window = window().unwrap(); + let document = window.document().unwrap(); + let body = document.body().unwrap(); + let span = document.create_element("span").unwrap(); + span.set_text_content(Some(text)); + span.set_attribute("style", &format!("display: inline-block; font-family:{}; font-size: {}px; position: fixed; top: 100%", self.0, size)).unwrap(); + let span = span.into(); + body.append_with_node_1(&span).unwrap(); + let elem = JsCast::dyn_into::<HtmlElement>(span).unwrap(); + let height = elem.offset_height() as i32; + let width = elem.offset_width() as i32; + elem.remove(); + Ok(((0, 0), (width, height))) + } +} diff --git a/vendor/plotters/src/style/mod.rs b/vendor/plotters/src/style/mod.rs new file mode 100644 index 000000000..7d7c9ac35 --- /dev/null +++ b/vendor/plotters/src/style/mod.rs @@ -0,0 +1,26 @@ +/*! + The style for shapes and text, font, color, etc. +*/ +mod color; +pub mod colors; +mod font; +mod palette; +mod shape; +mod size; +mod text; + +/// Definitions of palettes of accessibility +pub use self::palette::*; +pub use color::{Color, HSLColor, PaletteColor, RGBAColor, RGBColor}; +pub use colors::{BLACK, BLUE, CYAN, GREEN, MAGENTA, RED, TRANSPARENT, WHITE, YELLOW}; + +#[cfg(feature = "full_palette")] +pub use colors::full_palette; + +pub use font::{ + FontDesc, FontError, FontFamily, FontResult, FontStyle, FontTransform, IntoFont, LayoutBox, +}; +pub use shape::ShapeStyle; +pub use size::{AsRelative, RelativeSize, SizeDesc}; +pub use text::text_anchor; +pub use text::{IntoTextStyle, TextStyle}; diff --git a/vendor/plotters/src/style/palette.rs b/vendor/plotters/src/style/palette.rs new file mode 100644 index 000000000..d98df293b --- /dev/null +++ b/vendor/plotters/src/style/palette.rs @@ -0,0 +1,66 @@ +use super::color::PaletteColor; + +/// Represents a color palette +pub trait Palette { + /// Array of colors + const COLORS: &'static [(u8, u8, u8)]; + /// Returns a color from the palette + fn pick(idx: usize) -> PaletteColor<Self> + where + Self: Sized, + { + PaletteColor::<Self>::pick(idx) + } +} + +/// The palette of 99% accessibility +pub struct Palette99; +/// The palette of 99.99% accessibility +pub struct Palette9999; +/// The palette of 100% accessibility +pub struct Palette100; + +impl Palette for Palette99 { + const COLORS: &'static [(u8, u8, u8)] = &[ + (230, 25, 75), + (60, 180, 75), + (255, 225, 25), + (0, 130, 200), + (245, 130, 48), + (145, 30, 180), + (70, 240, 240), + (240, 50, 230), + (210, 245, 60), + (250, 190, 190), + (0, 128, 128), + (230, 190, 255), + (170, 110, 40), + (255, 250, 200), + (128, 0, 0), + (170, 255, 195), + (128, 128, 0), + (255, 215, 180), + (0, 0, 128), + (128, 128, 128), + (0, 0, 0), + ]; +} + +impl Palette for Palette9999 { + const COLORS: &'static [(u8, u8, u8)] = &[ + (255, 225, 25), + (0, 130, 200), + (245, 130, 48), + (250, 190, 190), + (230, 190, 255), + (128, 0, 0), + (0, 0, 128), + (128, 128, 128), + (0, 0, 0), + ]; +} + +impl Palette for Palette100 { + const COLORS: &'static [(u8, u8, u8)] = + &[(255, 225, 25), (0, 130, 200), (128, 128, 128), (0, 0, 0)]; +} diff --git a/vendor/plotters/src/style/shape.rs b/vendor/plotters/src/style/shape.rs new file mode 100644 index 000000000..389cc75ce --- /dev/null +++ b/vendor/plotters/src/style/shape.rs @@ -0,0 +1,98 @@ +use super::color::{Color, RGBAColor}; +use plotters_backend::{BackendColor, BackendStyle}; + +/// Style for any shape +#[derive(Copy, Clone)] +pub struct ShapeStyle { + /// Specification of the color. + pub color: RGBAColor, + /// Whether the style is filled with color. + pub filled: bool, + /// Stroke width. + pub stroke_width: u32, +} + +impl ShapeStyle { + /** + Returns a filled style with the same color and stroke width. + + # Example + + ``` + use plotters::prelude::*; + let original_style = ShapeStyle { + color: BLUE.mix(0.6), + filled: false, + stroke_width: 2, + }; + let filled_style = original_style.filled(); + let drawing_area = SVGBackend::new("shape_style_filled.svg", (400, 200)).into_drawing_area(); + drawing_area.fill(&WHITE).unwrap(); + drawing_area.draw(&Circle::new((150, 100), 90, original_style)); + drawing_area.draw(&Circle::new((250, 100), 90, filled_style)); + ``` + + The result is a figure with two circles, one of them filled: + +  + */ + pub fn filled(&self) -> Self { + Self { + color: self.color.to_rgba(), + filled: true, + stroke_width: self.stroke_width, + } + } + + /** + Returns a new style with the same color and the specified stroke width. + + # Example + + ``` + use plotters::prelude::*; + let original_style = ShapeStyle { + color: BLUE.mix(0.6), + filled: false, + stroke_width: 2, + }; + let new_style = original_style.stroke_width(5); + let drawing_area = SVGBackend::new("shape_style_stroke_width.svg", (400, 200)).into_drawing_area(); + drawing_area.fill(&WHITE).unwrap(); + drawing_area.draw(&Circle::new((150, 100), 90, original_style)); + drawing_area.draw(&Circle::new((250, 100), 90, new_style)); + ``` + + The result is a figure with two circles, one of them thicker than the other: + +  + */ + pub fn stroke_width(&self, width: u32) -> Self { + Self { + color: self.color.to_rgba(), + filled: self.filled, + stroke_width: width, + } + } +} + +impl<T: Color> From<T> for ShapeStyle { + fn from(f: T) -> Self { + ShapeStyle { + color: f.to_rgba(), + filled: false, + stroke_width: 1, + } + } +} + +impl BackendStyle for ShapeStyle { + /// Returns the color as interpreted by the backend. + fn color(&self) -> BackendColor { + self.color.to_backend_color() + } + /// Returns the stroke width. + fn stroke_width(&self) -> u32 { + self.stroke_width + } +} diff --git a/vendor/plotters/src/style/size.rs b/vendor/plotters/src/style/size.rs new file mode 100644 index 000000000..254df8d4f --- /dev/null +++ b/vendor/plotters/src/style/size.rs @@ -0,0 +1,186 @@ +use crate::coord::CoordTranslate; +use crate::drawing::DrawingArea; +use plotters_backend::DrawingBackend; + +/// The trait indicates that the type has a dimensional data. +/// This is the abstraction for the relative sizing model. +/// A relative sizing value is able to be converted into a concrete size +/// when coupling with a type with `HasDimension` type. +pub trait HasDimension { + /// Get the dimensional data for this object + fn dim(&self) -> (u32, u32); +} + +impl<D: DrawingBackend, C: CoordTranslate> HasDimension for DrawingArea<D, C> { + fn dim(&self) -> (u32, u32) { + self.dim_in_pixel() + } +} + +impl HasDimension for (u32, u32) { + fn dim(&self) -> (u32, u32) { + *self + } +} + +/// The trait that describes a size, it may be a relative size which the +/// size is determined by the parent size, e.g., 10% of the parent width +pub trait SizeDesc { + /// Convert the size into the number of pixels + /// + /// - `parent`: The reference to the parent container of this size + /// - **returns**: The number of pixels + fn in_pixels<T: HasDimension>(&self, parent: &T) -> i32; +} + +impl SizeDesc for i32 { + fn in_pixels<D: HasDimension>(&self, _parent: &D) -> i32 { + *self + } +} + +impl SizeDesc for u32 { + fn in_pixels<D: HasDimension>(&self, _parent: &D) -> i32 { + *self as i32 + } +} + +impl SizeDesc for f32 { + fn in_pixels<D: HasDimension>(&self, _parent: &D) -> i32 { + *self as i32 + } +} + +impl SizeDesc for f64 { + fn in_pixels<D: HasDimension>(&self, _parent: &D) -> i32 { + *self as i32 + } +} + +/// Describes a relative size, might be +/// 1. portion of height +/// 2. portion of width +/// 3. portion of the minimal of height and weight +pub enum RelativeSize { + /// Percentage height + Height(f64), + /// Percentage width + Width(f64), + /// Percentage of either height or width, which is smaller + Smaller(f64), +} + +impl RelativeSize { + /// Set the lower bound of the relative size. + /// + /// - `min_sz`: The minimal size the relative size can be in pixels + /// - **returns**: The relative size with the bound + pub fn min(self, min_sz: i32) -> RelativeSizeWithBound { + RelativeSizeWithBound { + size: self, + min: Some(min_sz), + max: None, + } + } + + /// Set the upper bound of the relative size + /// + /// - `max_size`: The maximum size in pixels for this relative size + /// - **returns** The relative size with the upper bound + pub fn max(self, max_sz: i32) -> RelativeSizeWithBound { + RelativeSizeWithBound { + size: self, + max: Some(max_sz), + min: None, + } + } +} + +impl SizeDesc for RelativeSize { + fn in_pixels<D: HasDimension>(&self, parent: &D) -> i32 { + let (w, h) = parent.dim(); + match self { + RelativeSize::Width(p) => *p * f64::from(w), + RelativeSize::Height(p) => *p * f64::from(h), + RelativeSize::Smaller(p) => *p * f64::from(w.min(h)), + } + .round() as i32 + } +} + +/// Allows a value turns into a relative size +pub trait AsRelative: Into<f64> { + /// Make the value a relative size of percentage of width + fn percent_width(self) -> RelativeSize { + RelativeSize::Width(self.into() / 100.0) + } + /// Make the value a relative size of percentage of height + fn percent_height(self) -> RelativeSize { + RelativeSize::Height(self.into() / 100.0) + } + /// Make the value a relative size of percentage of minimal of height and width + fn percent(self) -> RelativeSize { + RelativeSize::Smaller(self.into() / 100.0) + } +} + +impl<T: Into<f64>> AsRelative for T {} + +/// The struct describes a relative size with upper bound and lower bound +pub struct RelativeSizeWithBound { + size: RelativeSize, + min: Option<i32>, + max: Option<i32>, +} + +impl RelativeSizeWithBound { + /// Set the lower bound of the bounded relative size + /// + /// - `min_sz`: The lower bound of this size description + /// - **returns**: The newly created size description with the bound + pub fn min(mut self, min_sz: i32) -> RelativeSizeWithBound { + self.min = Some(min_sz); + self + } + + /// Set the upper bound of the bounded relative size + /// + /// - `min_sz`: The upper bound of this size description + /// - **returns**: The newly created size description with the bound + pub fn max(mut self, max_sz: i32) -> RelativeSizeWithBound { + self.max = Some(max_sz); + self + } +} + +impl SizeDesc for RelativeSizeWithBound { + fn in_pixels<D: HasDimension>(&self, parent: &D) -> i32 { + let size = self.size.in_pixels(parent); + let size_lower_capped = self.min.map_or(size, |x| x.max(size)); + self.max.map_or(size_lower_capped, |x| x.min(size)) + } +} + +#[cfg(test)] +mod test { + use super::*; + #[test] + fn test_relative_size() { + let size = (10).percent_height(); + assert_eq!(size.in_pixels(&(100, 200)), 20); + + let size = (10).percent_width(); + assert_eq!(size.in_pixels(&(100, 200)), 10); + + let size = (-10).percent_width(); + assert_eq!(size.in_pixels(&(100, 200)), -10); + + let size = (10).percent_width().min(30); + assert_eq!(size.in_pixels(&(100, 200)), 30); + assert_eq!(size.in_pixels(&(400, 200)), 40); + + let size = (10).percent(); + assert_eq!(size.in_pixels(&(100, 200)), 10); + assert_eq!(size.in_pixels(&(400, 200)), 20); + } +} diff --git a/vendor/plotters/src/style/text.rs b/vendor/plotters/src/style/text.rs new file mode 100644 index 000000000..e98f3193d --- /dev/null +++ b/vendor/plotters/src/style/text.rs @@ -0,0 +1,327 @@ +use super::color::Color; +use super::font::{FontDesc, FontError, FontFamily, FontStyle, FontTransform}; +use super::size::{HasDimension, SizeDesc}; +use super::BLACK; +pub use plotters_backend::text_anchor; +use plotters_backend::{BackendColor, BackendCoord, BackendStyle, BackendTextStyle}; + +/// Style of a text +#[derive(Clone)] +pub struct TextStyle<'a> { + /// The font description + pub font: FontDesc<'a>, + /// The text color + pub color: BackendColor, + /// The anchor point position + pub pos: text_anchor::Pos, +} + +/// Trait for values that can be converted into `TextStyle` values +pub trait IntoTextStyle<'a> { + /** Converts the value into a TextStyle value. + + `parent` is used in some cases to convert a font size from points to pixels. + + # Example + + ``` + use plotters::prelude::*; + let drawing_area = SVGBackend::new("into_text_style.svg", (200, 100)).into_drawing_area(); + drawing_area.fill(&WHITE).unwrap(); + let text_style = ("sans-serif", 20, &RED).into_text_style(&drawing_area); + drawing_area.draw_text("This is a big red label", &text_style, (10, 50)).unwrap(); + ``` + + The result is a text label styled accordingly: + +  + + */ + fn into_text_style<P: HasDimension>(self, parent: &P) -> TextStyle<'a>; + + /** Specifies the color of the text element + + # Example + + ``` + use plotters::prelude::*; + let drawing_area = SVGBackend::new("with_color.svg", (200, 100)).into_drawing_area(); + drawing_area.fill(&WHITE).unwrap(); + let text_style = ("sans-serif", 20).with_color(RED).into_text_style(&drawing_area); + drawing_area.draw_text("This is a big red label", &text_style, (10, 50)).unwrap(); + ``` + + The result is a text label styled accordingly: + +  + + # See also + + [`FontDesc::color()`] + + [`IntoTextStyle::into_text_style()`] for a more succinct example + + */ + fn with_color<C: Color>(self, color: C) -> TextStyleBuilder<'a, Self> + where + Self: Sized, + { + TextStyleBuilder { + base: self, + new_color: Some(color.to_backend_color()), + new_pos: None, + _phatom: std::marker::PhantomData, + } + } + + /** Specifies the position of the text anchor relative to the text element + + # Example + + ``` + use plotters::{prelude::*,style::text_anchor::{HPos, Pos, VPos}}; + let anchor_position = (200,100); + let anchor_left_bottom = Pos::new(HPos::Left, VPos::Bottom); + let anchor_right_top = Pos::new(HPos::Right, VPos::Top); + let drawing_area = SVGBackend::new("with_anchor.svg", (400, 200)).into_drawing_area(); + drawing_area.fill(&WHITE).unwrap(); + drawing_area.draw(&Circle::new(anchor_position, 5, RED.filled())); + let text_style_right_top = BLACK.with_anchor::<RGBColor>(anchor_right_top).into_text_style(&drawing_area); + drawing_area.draw_text("The anchor sits at the right top of this label", &text_style_right_top, anchor_position); + let text_style_left_bottom = BLACK.with_anchor::<RGBColor>(anchor_left_bottom).into_text_style(&drawing_area); + drawing_area.draw_text("The anchor sits at the left bottom of this label", &text_style_left_bottom, anchor_position); + ``` + + The result has a red pixel at the center and two text labels positioned accordingly: + +  + + # See also + + [`TextStyle::pos()`] + + */ + fn with_anchor<C: Color>(self, pos: text_anchor::Pos) -> TextStyleBuilder<'a, Self> + where + Self: Sized, + { + TextStyleBuilder { + base: self, + new_pos: Some(pos), + new_color: None, + _phatom: std::marker::PhantomData, + } + } +} + +pub struct TextStyleBuilder<'a, T: IntoTextStyle<'a>> { + base: T, + new_color: Option<BackendColor>, + new_pos: Option<text_anchor::Pos>, + _phatom: std::marker::PhantomData<&'a T>, +} + +impl<'a, T: IntoTextStyle<'a>> IntoTextStyle<'a> for TextStyleBuilder<'a, T> { + fn into_text_style<P: HasDimension>(self, parent: &P) -> TextStyle<'a> { + let mut base = self.base.into_text_style(parent); + if let Some(color) = self.new_color { + base.color = color; + } + if let Some(pos) = self.new_pos { + base = base.pos(pos); + } + base + } +} + +impl<'a> TextStyle<'a> { + /// Sets the color of the style. + /// + /// - `color`: The required color + /// - **returns** The up-to-dated text style + /// + /// ```rust + /// use plotters::prelude::*; + /// + /// let style = TextStyle::from(("sans-serif", 20).into_font()).color(&RED); + /// ``` + pub fn color<C: Color>(&self, color: &'a C) -> Self { + Self { + font: self.font.clone(), + color: color.to_backend_color(), + pos: self.pos, + } + } + + /// Sets the font transformation of the style. + /// + /// - `trans`: The required transformation + /// - **returns** The up-to-dated text style + /// + /// ```rust + /// use plotters::prelude::*; + /// + /// let style = TextStyle::from(("sans-serif", 20).into_font()).transform(FontTransform::Rotate90); + /// ``` + pub fn transform(&self, trans: FontTransform) -> Self { + Self { + font: self.font.clone().transform(trans), + color: self.color, + pos: self.pos, + } + } + + /// Sets the anchor position. + /// + /// - `pos`: The required anchor position + /// - **returns** The up-to-dated text style + /// + /// ```rust + /// use plotters::prelude::*; + /// use plotters::style::text_anchor::{Pos, HPos, VPos}; + /// + /// let pos = Pos::new(HPos::Left, VPos::Top); + /// let style = TextStyle::from(("sans-serif", 20).into_font()).pos(pos); + /// ``` + /// + /// # See also + /// + /// [`IntoTextStyle::with_anchor()`] + pub fn pos(&self, pos: text_anchor::Pos) -> Self { + Self { + font: self.font.clone(), + color: self.color, + pos, + } + } +} + +impl<'a> IntoTextStyle<'a> for FontDesc<'a> { + fn into_text_style<P: HasDimension>(self, _: &P) -> TextStyle<'a> { + self.into() + } +} + +impl<'a> IntoTextStyle<'a> for TextStyle<'a> { + fn into_text_style<P: HasDimension>(self, _: &P) -> TextStyle<'a> { + self + } +} + +impl<'a> IntoTextStyle<'a> for &'a str { + fn into_text_style<P: HasDimension>(self, _: &P) -> TextStyle<'a> { + self.into() + } +} + +impl<'a> IntoTextStyle<'a> for FontFamily<'a> { + fn into_text_style<P: HasDimension>(self, _: &P) -> TextStyle<'a> { + self.into() + } +} + +impl IntoTextStyle<'static> for u32 { + fn into_text_style<P: HasDimension>(self, _: &P) -> TextStyle<'static> { + TextStyle::from((FontFamily::SansSerif, self)) + } +} + +impl IntoTextStyle<'static> for f64 { + fn into_text_style<P: HasDimension>(self, _: &P) -> TextStyle<'static> { + TextStyle::from((FontFamily::SansSerif, self)) + } +} + +impl<'a, T: Color> IntoTextStyle<'a> for &'a T { + fn into_text_style<P: HasDimension>(self, _: &P) -> TextStyle<'a> { + TextStyle::from(FontFamily::SansSerif).color(self) + } +} + +impl<'a, F: Into<FontFamily<'a>>, T: SizeDesc> IntoTextStyle<'a> for (F, T) { + fn into_text_style<P: HasDimension>(self, parent: &P) -> TextStyle<'a> { + (self.0.into(), self.1.in_pixels(parent)).into() + } +} + +impl<'a, F: Into<FontFamily<'a>>, T: SizeDesc, C: Color> IntoTextStyle<'a> for (F, T, &'a C) { + fn into_text_style<P: HasDimension>(self, parent: &P) -> TextStyle<'a> { + IntoTextStyle::into_text_style((self.0, self.1), parent).color(self.2) + } +} + +impl<'a, F: Into<FontFamily<'a>>, T: SizeDesc> IntoTextStyle<'a> for (F, T, FontStyle) { + fn into_text_style<P: HasDimension>(self, parent: &P) -> TextStyle<'a> { + (self.0.into(), self.1.in_pixels(parent), self.2).into() + } +} + +impl<'a, F: Into<FontFamily<'a>>, T: SizeDesc, C: Color> IntoTextStyle<'a> + for (F, T, FontStyle, &'a C) +{ + fn into_text_style<P: HasDimension>(self, parent: &P) -> TextStyle<'a> { + IntoTextStyle::into_text_style((self.0, self.1, self.2), parent).color(self.3) + } +} + +/// Make sure that we are able to automatically copy the `TextStyle` +impl<'a, 'b: 'a> From<&'b TextStyle<'a>> for TextStyle<'a> { + fn from(this: &'b TextStyle<'a>) -> Self { + this.clone() + } +} + +impl<'a, T: Into<FontDesc<'a>>> From<T> for TextStyle<'a> { + fn from(font: T) -> Self { + Self { + font: font.into(), + color: BLACK.to_backend_color(), + pos: text_anchor::Pos::default(), + } + } +} + +impl<'a> BackendTextStyle for TextStyle<'a> { + type FontError = FontError; + fn color(&self) -> BackendColor { + self.color + } + + fn size(&self) -> f64 { + self.font.get_size() + } + + fn transform(&self) -> FontTransform { + self.font.get_transform() + } + + fn style(&self) -> FontStyle { + self.font.get_style() + } + + #[allow(clippy::type_complexity)] + fn layout_box(&self, text: &str) -> Result<((i32, i32), (i32, i32)), Self::FontError> { + self.font.layout_box(text) + } + + fn anchor(&self) -> text_anchor::Pos { + self.pos + } + + fn family(&self) -> FontFamily { + self.font.get_family() + } + + fn draw<E, DrawFunc: FnMut(i32, i32, BackendColor) -> Result<(), E>>( + &self, + text: &str, + pos: BackendCoord, + mut draw: DrawFunc, + ) -> Result<Result<(), E>, Self::FontError> { + let color = self.color.color(); + self.font.draw(text, pos, move |x, y, a| { + let mix_color = color.mix(a as f64); + draw(x, y, mix_color) + }) + } +} diff --git a/vendor/plotters/src/test.rs b/vendor/plotters/src/test.rs new file mode 100644 index 000000000..2c94f0824 --- /dev/null +++ b/vendor/plotters/src/test.rs @@ -0,0 +1,22 @@ +use crate::prelude::*; + +#[cfg(feature = "svg_backend")] +#[test] +fn regression_test_issue_267() { + let p1 = (338, 122); + let p2 = (365, 122); + + let mut backend = SVGBackend::new("blub.png", (800, 600)); + + backend + .draw_line(p1, p2, &RGBColor(0, 0, 0).stroke_width(0)) + .unwrap(); +} + +#[test] +fn from_trait_impl_rgba_color() { + let rgb = RGBColor(1, 2, 3); + let c = RGBAColor::from(rgb); + + assert_eq!(c.rgb(), rgb.rgb()); +} |