
diff options
| author | Daniel Baumann <daniel.baumann@progress-linux.org> | 2021-12-01 06:15:11 +0000 |
|---|---|---|
| committer | Daniel Baumann <daniel.baumann@progress-linux.org> | 2021-12-01 06:15:11 +0000 |
| commit | 483926a283e118590da3f9ecfa75a8a4d62143ce (patch) | |
| tree | cb77052778df9a128a8cd3ff5bf7645322a13bc5 /docs/dashboard | |
| parent | Releasing debian version 1.31.0-4. (diff) | |
| download | netdata-483926a283e118590da3f9ecfa75a8a4d62143ce.tar.xz netdata-483926a283e118590da3f9ecfa75a8a4d62143ce.zip | |
Merging upstream version 1.32.0.
Signed-off-by: Daniel Baumann <daniel.baumann@progress-linux.org>
Diffstat (limited to 'docs/dashboard')
| -rw-r--r-- | docs/dashboard/customize.mdx | 4 | ||||
| -rw-r--r-- | docs/dashboard/dimensions-contexts-families.mdx | 4 | ||||
| -rw-r--r-- | docs/dashboard/how-dashboard-works.mdx | 2 | ||||
| -rw-r--r-- | docs/dashboard/import-export-print-snapshot.mdx | 8 | ||||
| -rw-r--r-- | docs/dashboard/interact-charts.mdx | 9 | ||||
| -rw-r--r-- | docs/dashboard/visualization-date-and-time-controls.mdx (renamed from docs/dashboard/select-timeframes.mdx) | 58 |
6 files changed, 62 insertions, 23 deletions
diff --git a/docs/dashboard/customize.mdx b/docs/dashboard/customize.mdx index f3a8f805a..2c82a1c50 100644 --- a/docs/dashboard/customize.mdx +++ b/docs/dashboard/customize.mdx @@ -25,7 +25,7 @@ Here are a few popular settings: ### Change chart legend position Find this setting under the **Visual** tab. By default, Netdata places the [legend of -dimensions](/docs/dashboards/charts-dimensions-contexts-families.mdx#dimensions) _below_ charts. Click this toggle to +dimensions](/docs/dashboard/dimensions-contexts-families.mdx#dimensions) _below_ charts. Click this toggle to move the legend to the _right_ of charts. ### Change theme @@ -88,6 +88,6 @@ dashboards](/web/gui/custom/README.md) with HTML, CSS, and JavaScript. - [How the dashboard works](/docs/dashboard/how-dashboard-works.mdx) - [Interact with charts](/docs/dashboard/interact-charts.mdx) - [Chart dimensions, contexts, and families](/docs/dashboard/dimensions-contexts-families.mdx) - - [Select timeframes to visualize](/docs/dashboard/select-timeframes.mdx) + - [Select timeframes to visualize](/docs/dashboard/visualization-date-and-time-controls.mdx) - [Import, export, and print a snapshot](/docs/dashboard/import-export-print-snapshot.mdx) - **[Customize the standard dashboard](/docs/dashboard/customize.mdx)** diff --git a/docs/dashboard/dimensions-contexts-families.mdx b/docs/dashboard/dimensions-contexts-families.mdx index 49438bf2d..da9aad78f 100644 --- a/docs/dashboard/dimensions-contexts-families.mdx +++ b/docs/dashboard/dimensions-contexts-families.mdx @@ -79,7 +79,7 @@ names: ## What's next? With an understanding of a chart's dimensions, context, and family, you're now ready to dig even deeper into Netdata's -dashboard. We recommend looking into [using the timeframe selector](/docs/dashboard/select-timeframes.mdx). +dashboard. We recommend looking into [using the timeframe selector](/docs/dashboard/visualization-date-and-time-controls.mdx). If you feel comfortable with the [dashboard](/docs/dashboard/how-dashboard-works.mdx) and interacting with charts, we recommend learning about [configuration](/docs/configure/nodes.md). While Netdata doesn't _require_ a complicated setup @@ -91,6 +91,6 @@ process or a query language to create charts, there are a lot of ways to tweak t - [How the dashboard works](/docs/dashboard/how-dashboard-works.mdx) - [Interact with charts](/docs/dashboard/interact-charts.mdx) - **[Chart dimensions, contexts, and families](/docs/dashboard/dimensions-contexts-families.mdx)** - - [Select timeframes to visualize](/docs/dashboard/select-timeframes.mdx) + - [Select timeframes to visualize](/docs/dashboard/visualization-date-and-time-controls.mdx) - [Import, export, and print a snapshot](/docs/dashboard/import-export-print-snapshot.mdx) - [Customize the standard dashboard](/docs/dashboard/customize.mdx) diff --git a/docs/dashboard/how-dashboard-works.mdx b/docs/dashboard/how-dashboard-works.mdx index 00c5df33b..315614d69 100644 --- a/docs/dashboard/how-dashboard-works.mdx +++ b/docs/dashboard/how-dashboard-works.mdx @@ -105,7 +105,7 @@ organizes its dashboard and operates [alarms](/docs/monitor/configure-alarms.md) - **[How the dashboard works](/docs/dashboard/how-dashboard-works.mdx)** - [Interact with charts](/docs/dashboard/interact-charts.mdx) - [Chart dimensions, contexts, and families](/docs/dashboard/dimensions-contexts-families.mdx) - - [Select timeframes to visualize](/docs/dashboard/select-timeframes.mdx) + - [Select timeframes to visualize](/docs/dashboard/visualization-date-and-time-controls.mdx) - [Import, export, and print a snapshot](/docs/dashboard/import-export-print-snapshot.mdx) - [Customize the standard dashboard](/docs/dashboard/customize.mdx) - [HTTP API](/web/api/README.md) diff --git a/docs/dashboard/import-export-print-snapshot.mdx b/docs/dashboard/import-export-print-snapshot.mdx index b5488914a..7e94a52c8 100644 --- a/docs/dashboard/import-export-print-snapshot.mdx +++ b/docs/dashboard/import-export-print-snapshot.mdx @@ -13,8 +13,8 @@ paper. Snapshots can be incredibly useful for diagnosing anomalies after they've already happened. Let's say Netdata triggered a warning alarm while you were asleep. In the morning, you can [pick the -timeframe](/docs/dashboards/pick-timeframes.mdx) when the alarm triggered, export a snapshot, and send it to a colleague -for further analysis. +timeframe](/docs/dashboard/visualization-date-and-time-controls.mdx) when the alarm triggered, export a snapshot, and send it to a +colleague for further analysis. Or, send the Netdata team a snapshot of your dashboard when [filing a bug report](https://github.com/netdata/netdata/issues/new?assignees=&labels=bug%2C+needs+triage&template=bug_report.md) on @@ -39,7 +39,7 @@ Some caveats and tips to keep in mind: - Only metrics in the export timeframe are available to you. If you zoom out or pan through time, you'll see the beginning and end of the snapshot. -- Charts won't update with new inforamtion, as you're looking at a static replica, not the live dashboard. +- Charts won't update with new information, as you're looking at a static replica, not the live dashboard. - The import is only temporary. Reload your browser tab to return to your node's real-time dashboard. ## Export a snapshot @@ -78,6 +78,6 @@ dashboards](/web/gui/custom/README.md). - [How the dashboard works](/docs/dashboard/how-dashboard-works.mdx) - [Interact with charts](/docs/dashboard/interact-charts.mdx) - [Chart dimensions, contexts, and families](/docs/dashboard/dimensions-contexts-families.mdx) - - [Select timeframes to visualize](/docs/dashboard/select-timeframes.mdx) + - [Select timeframes to visualize](/docs/dashboard/visualization-date-and-time-controls.mdx) - **[Import, export, and print a snapshot](/docs/dashboard/import-export-print-snapshot.mdx)** - [Customize the standard dashboard](/docs/dashboard/customize.mdx)
\ No newline at end of file diff --git a/docs/dashboard/interact-charts.mdx b/docs/dashboard/interact-charts.mdx index 2266e101e..5633bd080 100644 --- a/docs/dashboard/interact-charts.mdx +++ b/docs/dashboard/interact-charts.mdx @@ -7,6 +7,9 @@ custom_edit_url: https://github.com/netdata/netdata/edit/master/docs/dashboard/i # Interact with charts +> ⚠️ There is a new version of charts that is currently **only** available on [Netdata Cloud](https://learn.netdata.cloud/docs/cloud/visualize/interact-new-charts). We didn't +> want to keep this valuable feature from you, so after we get this into your hands on the Cloud, we will collect and implement your feedback to make sure we are providing the best possible version of the feature on the Netdata Agent dashboard as quickly as possible. + While charts that update every second with new metrics are helpful for understanding the immediate state of a node, deep troubleshooting and root cause analysis begins by manipulating the default charts. To help you troubleshoot, Netdata synchronizes every chart every time you interact with one of them. @@ -119,7 +122,7 @@ are, respectively, `Pan Left`, `Reset`, `Pan Right`, `Zoom In`, and `Zoom Out`. We recommend you read up on the differences between [chart dimensions, contexts, and families](/docs/dashboard/dimensions-contexts-families.mdx) to complete your understanding of how Netdata organizes its dashboards. Another valuable way to interact with charts is to use the [timeframe -selector](/docs/dashboard/select-timeframes.mdx), which helps you visualize specific moments of historical metrics. +selector](/docs/dashboard/visualization-date-and-time-controls.mdx), which helps you visualize specific moments of historical metrics. If you feel comfortable with the [dashboard](/docs/dashboard/how-dashboard-works.mdx) and interacting with charts, we recommend moving on to learning about [configuration](/docs/configure/nodes.md). While Netdata doesn't _require_ a @@ -130,8 +133,8 @@ your needs. - Dashboard - [How the dashboard works](/docs/dashboard/how-dashboard-works.mdx) - - **[Interact with charts](/docs/dashboard/interact-charts.mdx)** + - [Netdata Cloud · Interact with new charts](https://learn.netdata.cloud/docs/cloud/visualize/interact-new-charts) - [Chart dimensions, contexts, and families](/docs/dashboard/dimensions-contexts-families.mdx) - - [Select timeframes to visualize](/docs/dashboard/select-timeframes.mdx) + - [Select timeframes to visualize](/docs/dashboard/visualization-date-and-time-controls.mdx) - [Import, export, and print a snapshot](/docs/dashboard/import-export-print-snapshot.mdx) - [Customize the standard dashboard](/docs/dashboard/customize.mdx) diff --git a/docs/dashboard/select-timeframes.mdx b/docs/dashboard/visualization-date-and-time-controls.mdx index ac1b3f7c7..fe3e51091 100644 --- a/docs/dashboard/select-timeframes.mdx +++ b/docs/dashboard/visualization-date-and-time-controls.mdx @@ -1,13 +1,17 @@ --- -title: "Select timeframes to visualize" -description: "Netdata's dashboard features a rich timeframe selector, with useful defaults and rich customization, to help you narrow your focus when troubleshooting issues or anomalies." +title: "Visualization date and time controls" +description: "Netdata's dashboard features powerful date visualization controls that include a time control (play, pause, force play), a timezone selector and a rich date and timeframe selector, with useful defaults and rich customization, to help you narrow your focus when troubleshooting issues or anomalies." type: how-to -custom_edit_url: https://github.com/netdata/netdata/edit/master/docs/dashboard/select-timeframes.mdx +custom_edit_url: https://github.com/netdata/netdata/edit/master/docs/dashboard/visualization-date-and-time-controls.mdx --- -# Pick timeframes to visualize +# Visualization date and time controls -While [panning through time and zooming in/out](/docs/dashboard/interact-charts.mdx) from charts is helpful when +## Date and time selector + +### Pick timeframes to visualize + +While [panning through time and zooming in/out](/docs/dashboard/interact-charts.mdx) from charts it is helpful when you're looking a recent history, or want to do granular troubleshooting, what if you want to see metrics from 6 hours ago? Or 6 days? @@ -15,7 +19,7 @@ Netdata's dashboard features a **timeframe selector** to help you visualize spec By default, it shows a certain number of minutes of historical metrics based on the your browser's viewport to ensure it's always showing per-second granularity. -## Open the timeframe selector +#### Open the timeframe selector To visualize a new timeframe, you need to open the picker, which appears just above the menu, near the top-right cover of the dashboard. @@ -26,7 +30,7 @@ dashboard](https://user-images.githubusercontent.com/1153921/101507784-2c585080- The **Clear** button resets the dashboard back to its default state based on your browser viewport, and **Apply** closes the picker and shifts all charts to the selected timeframe. -## Use the Quick Selector +#### Use the Quick Selector Click any of the following options in the **Quick Selector** to choose a commonly-used timeframe. @@ -38,16 +42,49 @@ Click any of the following options in the **Quick Selector** to choose a commonl Click **Apply** to see metrics from your selected timeframe. -## Choose a specific interval +#### Choose a specific interval Beneath the Quick Selector is an input field and dropdown you use in combination to select a specific timeframe of minutes, hours, days, or months. Enter a number and choose the appropriate unit of time, then click **Apply**. -## Choose multiple days +#### Choose multiple days Use the calendar to select multiple days. Click on a date to begin the timeframe selection, then an ending date. The timeframe begins at noon on the beginning and end dates. Click **Apply** to see your selected multi-day timeframe. +## Time controls + +The time control provides you the following options: **Play**, **Pause** and **Force Play**. +* **Play** - the content of the page will be automatically refreshed while this is in the foreground +* **Pause** - the content of the page isn't refreshed due to a manual request to pause it or, for example, when your investigating data on a +chart (cursor is on top of a chart) +* **Force Play** - the content of the page will be automatically refreshed even if this is in the background + +With this, we aim to bring more clarity and allow you to distinguish if the content you are looking at is live or historical and also allow you + to always refresh the content of the page when the tabs are in the background. + +Main use cases for **Force Play**: +* You use a terminal or deployment tools to do changes in your infra and want to see immediately, Netdata is in the background, displaying the impact +of these changes +* You want to have Netdata on the background, example displayed on a TV, to constantly see metrics through dashboards or to watch the alert +status + +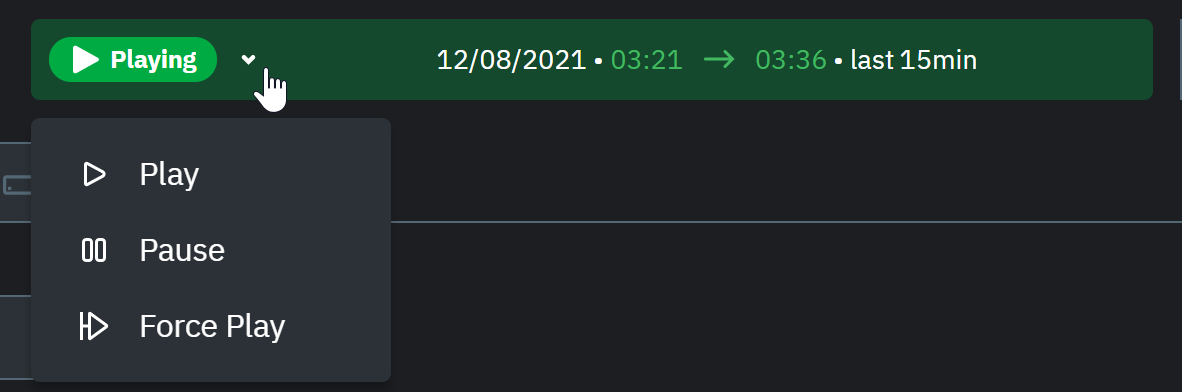 + +## Timezone selector + +With the timezone selector, you have the ability to change the timezone on Netdata Cloud. More often than not teams are +distributed in different timezones and they need to collaborate. + +Our goal is to make it easier for you and your teams to troubleshoot based on your timezone preference and communicate easily +with varying timezones and timeframes without the need to be concerned about their specificity. + +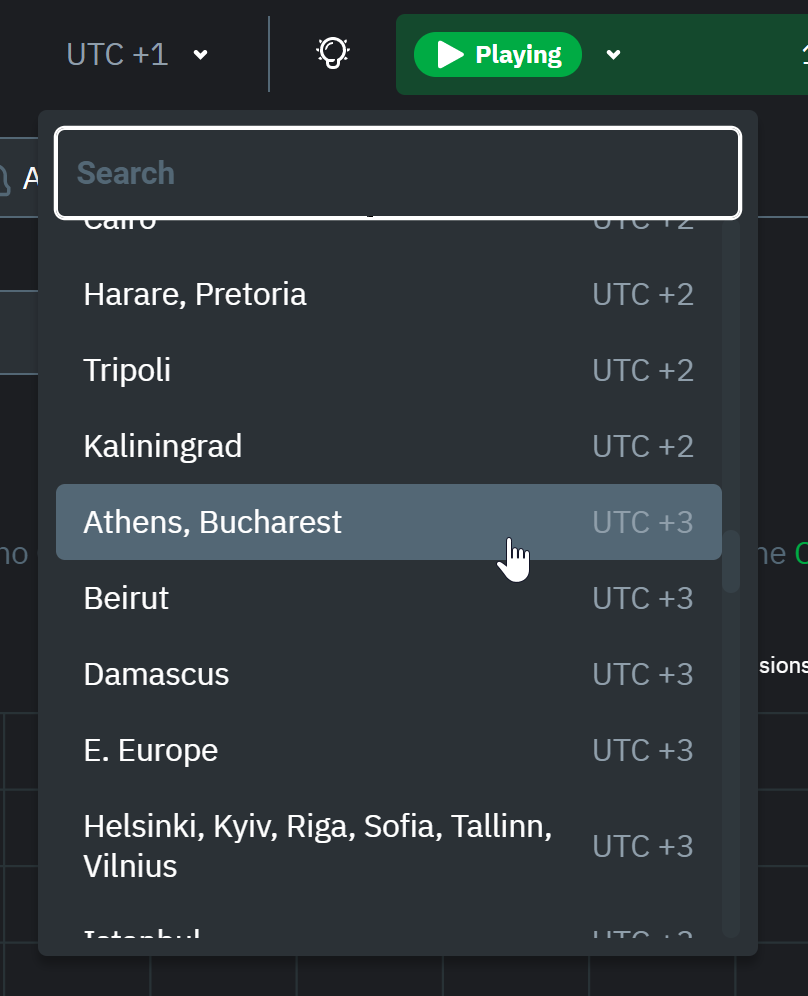 + +When you change the timezone all the date and time fields will be updated to be displayed according to the specified timezone, this goes from +charts to alerts information and across the Netdata Cloud. + ## Caveats and considerations **Longer timeframes will decrease metrics granularity**. At the default timeframe, based on your browser viewport, each @@ -74,12 +111,11 @@ into any other Netdata dashboard. There are also many ways to [customize](/docs/dashboard/customize.mdx) the standard dashboard experience, from changing the theme to editing the text that accompanies every section of charts. -### Further reading & related information +## Further reading & related information - Dashboard - [How the dashboard works](/docs/dashboard/how-dashboard-works.mdx) - [Interact with charts](/docs/dashboard/interact-charts.mdx) - [Chart dimensions, contexts, and families](/docs/dashboard/dimensions-contexts-families.mdx) - - **[Select timeframes to visualize](/docs/dashboard/select-timeframes.mdx)** - [Import, export, and print a snapshot](/docs/dashboard/import-export-print-snapshot.mdx) - [Customize the standard dashboard](/docs/dashboard/customize.mdx) |