
diff options
| author | Daniel Baumann <daniel.baumann@progress-linux.org> | 2022-11-30 18:47:05 +0000 |
|---|---|---|
| committer | Daniel Baumann <daniel.baumann@progress-linux.org> | 2022-11-30 18:47:05 +0000 |
| commit | 97e01009d69b8fbebfebf68f51e3d126d0ed43fc (patch) | |
| tree | 02e8b836c3a9d89806f3e67d4a5fe9f52dbb0061 /docs | |
| parent | Releasing debian version 1.36.1-1. (diff) | |
| download | netdata-97e01009d69b8fbebfebf68f51e3d126d0ed43fc.tar.xz netdata-97e01009d69b8fbebfebf68f51e3d126d0ed43fc.zip | |
Merging upstream version 1.37.0.
Signed-off-by: Daniel Baumann <daniel.baumann@progress-linux.org>
Diffstat (limited to 'docs')
| -rw-r--r-- | docs/Demo-Sites.md | 2 | ||||
| -rw-r--r-- | docs/collect/system-metrics.md | 10 | ||||
| -rw-r--r-- | docs/dashboard/interact-charts.mdx | 57 | ||||
| -rw-r--r-- | docs/get-started.mdx | 4 | ||||
| -rw-r--r-- | docs/guides/configure/performance.md | 48 | ||||
| -rw-r--r-- | docs/guides/export/export-netdata-metrics-graphite.md | 2 | ||||
| -rw-r--r-- | docs/guides/monitor/lamp-stack.md | 2 | ||||
| -rw-r--r-- | docs/guides/monitor/pi-hole-raspberry-pi.md | 2 | ||||
| -rw-r--r-- | docs/guides/python-collector.md | 10 | ||||
| -rw-r--r-- | docs/guides/step-by-step/step-00.md | 2 | ||||
| -rw-r--r-- | docs/guides/step-by-step/step-09.md | 16 | ||||
| -rw-r--r-- | docs/guides/troubleshoot/troubleshooting-agent-with-cloud-connection.md | 10 | ||||
| -rw-r--r-- | docs/netdata-for-IoT.md | 2 | ||||
| -rw-r--r-- | docs/store/change-metrics-storage.md | 6 |
14 files changed, 131 insertions, 42 deletions
diff --git a/docs/Demo-Sites.md b/docs/Demo-Sites.md index 80c98df3d..5c4d1018f 100644 --- a/docs/Demo-Sites.md +++ b/docs/Demo-Sites.md @@ -6,7 +6,7 @@ custom_edit_url: https://github.com/netdata/netdata/edit/master/docs/Demo-Sites. # Demo sites -You can also view live demos of Netdata at **[https://www.netdata.cloud](https://www.netdata.cloud/#live-demo)**. +You can also view live demos of Netdata at **https://app.netdata.cloud/spaces/netdata-demo** | Location | Netdata demo URL | 60 mins reqs | VM donated by | | :------------------ | :-------------------------------------------------------------------------------------------------------------------------------------------- | :------------------------------------------------------------------------------------------------------------------------------------------------------------------------------------------------------------------------------------------------------------| :------------------------------------------------- | diff --git a/docs/collect/system-metrics.md b/docs/collect/system-metrics.md index 623302894..ecd8dad70 100644 --- a/docs/collect/system-metrics.md +++ b/docs/collect/system-metrics.md @@ -37,14 +37,8 @@ can find all system collectors in our [supported collectors list](/collectors/CO Netdata is also capable of monitoring Windows systems. The [WMI collector](https://learn.netdata.cloud/docs/agent/collectors/go.d.plugin/modules/wmi) integrates with [windows_exporter](https://github.com/prometheus-community/windows_exporter), a small Go-based binary that you can run -on Windows systems. The WMI collector then gathers metrics from an endpoint created by windows_exporter. - -First, [download windows_exporter](https://github.com/prometheus-community/windows_exporter#installation) and run it -with the following collectors enabled, changing `0.14.0` to the version you downloaded. - -```powershell -windows_exporter-0.14.0-amd64.exe --collectors.enabled="cpu,memory,net,logical_disk,os,system,logon" -``` +on Windows systems. The WMI collector then gathers metrics from an endpoint created by windows_exporter, for more +details see [the requirements](https://learn.netdata.cloud/docs/agent/collectors/go.d.plugin/modules/wmi#requirements). Next, [configure the WMI collector](https://learn.netdata.cloud/docs/agent/collectors/go.d.plugin/modules/wmi#configuration) to point to the URL diff --git a/docs/dashboard/interact-charts.mdx b/docs/dashboard/interact-charts.mdx index 5633bd080..fe0f05e3f 100644 --- a/docs/dashboard/interact-charts.mdx +++ b/docs/dashboard/interact-charts.mdx @@ -117,6 +117,63 @@ the resolution to `resolution 1 sec` to see the exact values. Many of the above interactions can also be triggered using the icons on the bottom-right corner of every chart. They are, respectively, `Pan Left`, `Reset`, `Pan Right`, `Zoom In`, and `Zoom Out`. +## Chart label filtering + +The chart label filtering feature supports grouping by and filtering each chart based on labels (key/value pairs) applicable to the context and provides fine-grain capability on slicing the data and metrics. + +All metrics collected get "tagged" with labels and values, thus providing a powerful way of slicing and visualizing all metrics related to the infrastructure. + +The chart label filtering is currently enabled on: + +- All charts on the **Overview** tab +- Custom dashboards + +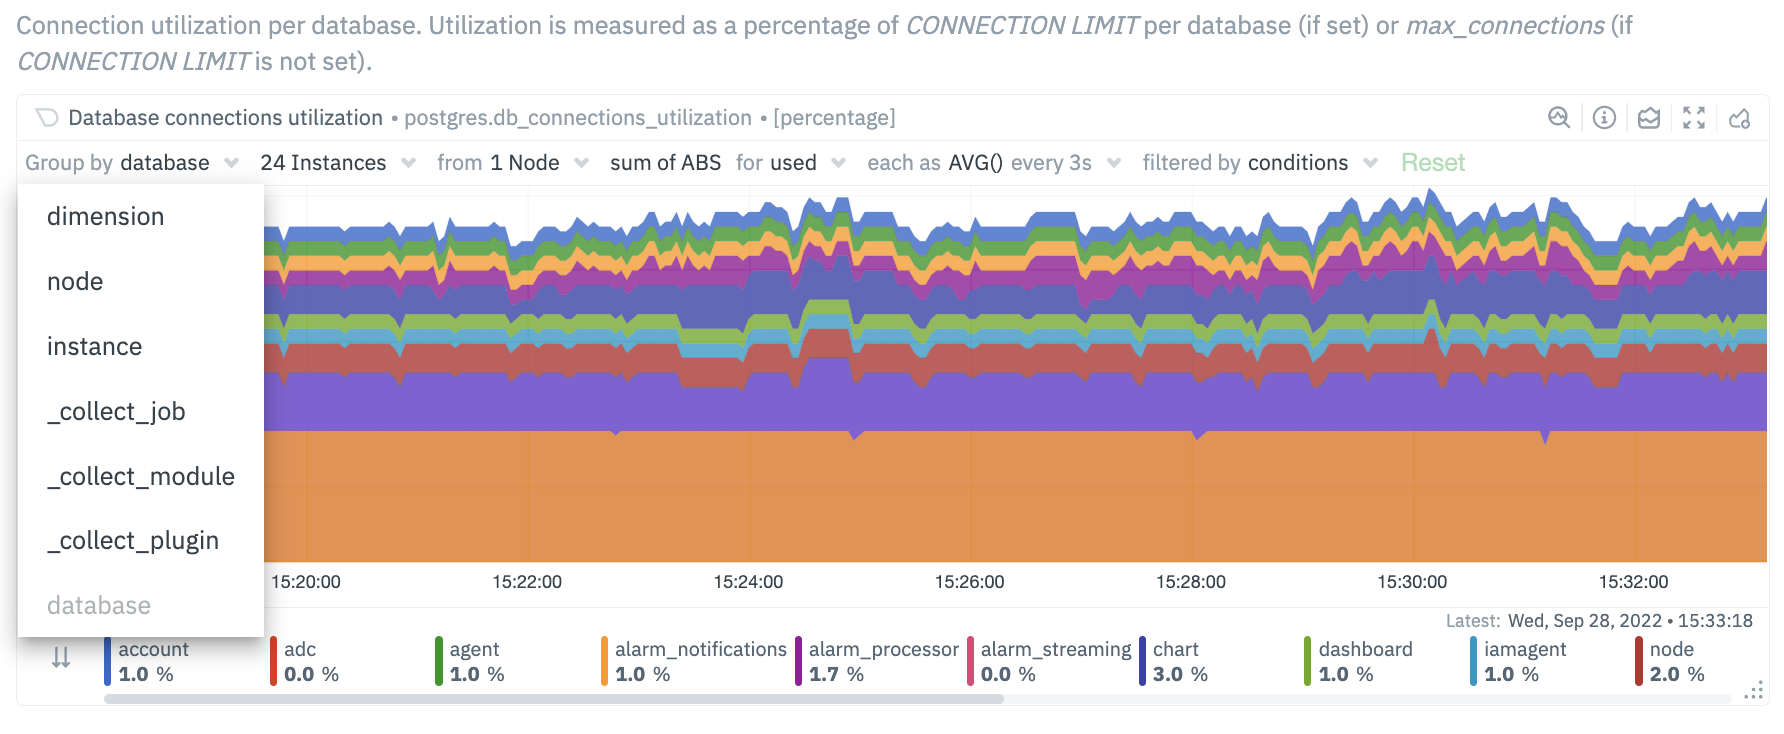 +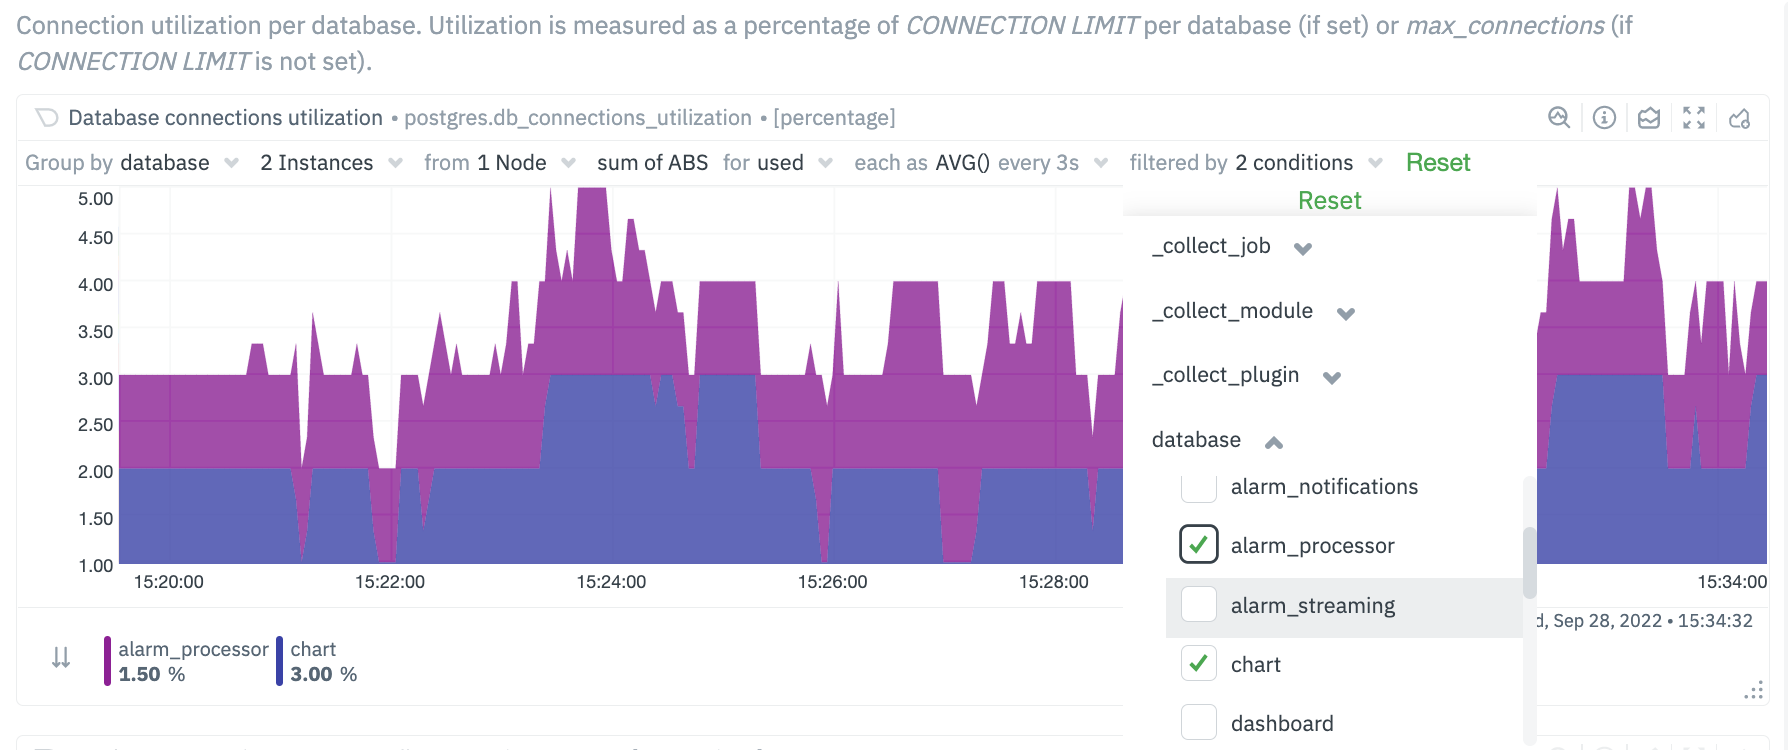 + +The top panel on each chart displays the various filters and grouping options selected on the specific chart. These filters are specific for each chart and need to be manually configured on each chart. + +Additionally, the charts can be saved to a custom dashboard, new or existing, with the selected filters from the overview screen. + +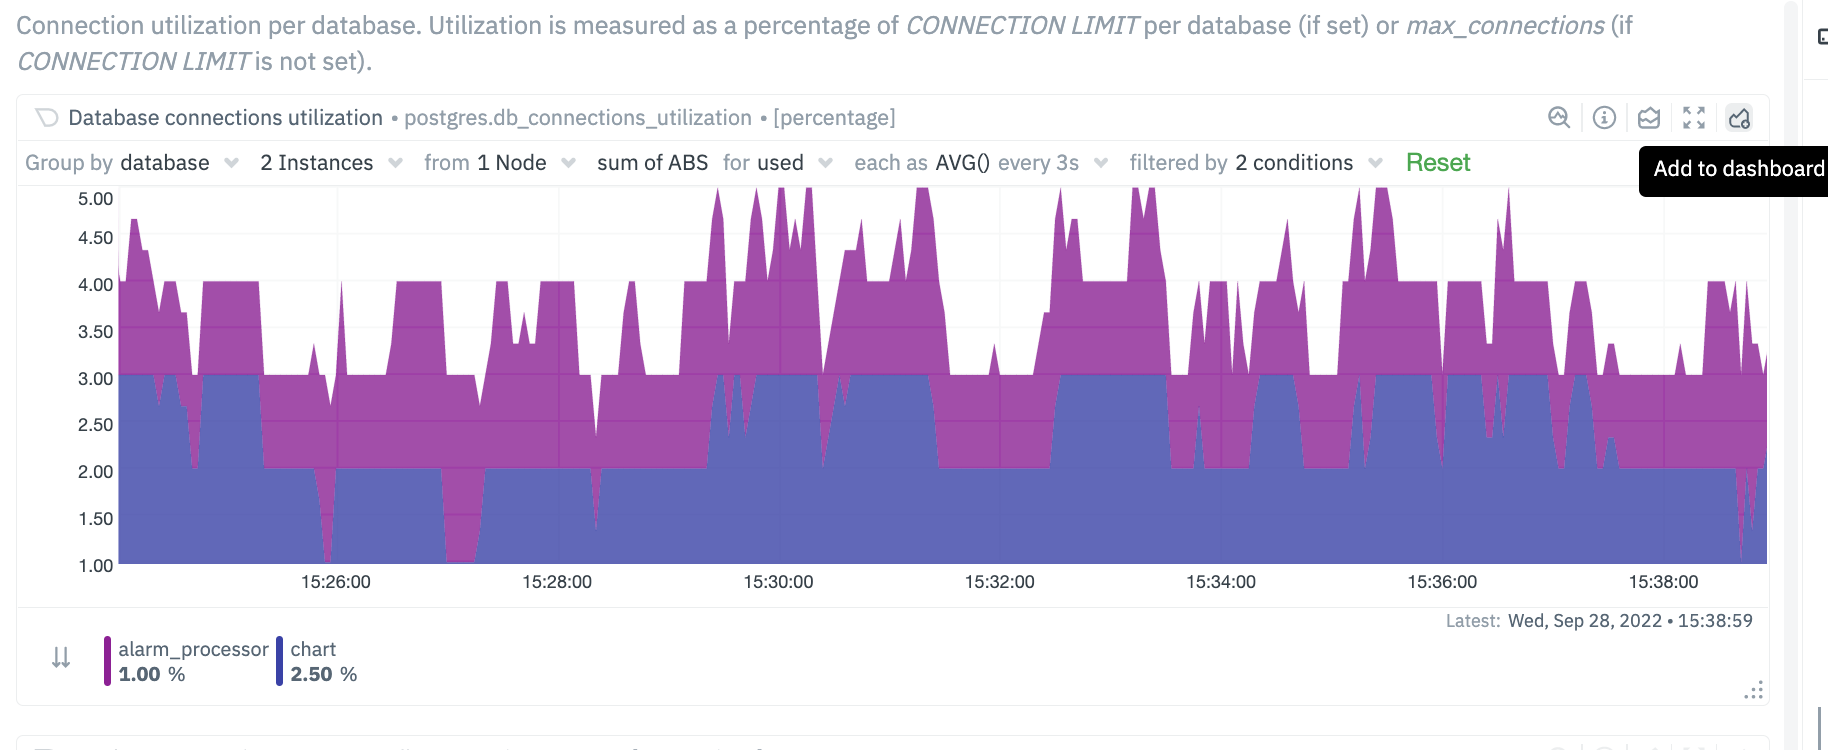 + +## Custom labels for Collectors + +In addition to the default labels associated with a collector and metrics context (you can identify them by seeing which ones have an underscore as a prefix), there is now a new feature enabled to create custom labels. These custom labels may be needed to group your jobs or instances into various categories. + +These custom labels can be configured within your go.d plugins by simply associating a label key/value pair, as in the following eaxmple. + +```conf +jobs: + - name: example_1 + someOption: someValue + labels: + label1: value1 + label2: value2 + - name: example_2 + someOption: someValue + labels: + label3: value3 + label4: value4 +``` + +For instance, you may be running multiple Postgres database instances within an infrastructure. Some of these may be associated with testing environments, some with staging and some with production environments. You can now associate each Postgres job / instance with a custom label. The “group by” and filtering options will then allow you to associate individual jobs by specific labels. + +```conf +jobs: + - name: local + dsn: 'postgres://postgres:postgres@127.0.0.1:5432/postgres' + collect_databases_matching: '*' + labels: + instance_type: production + ``` + 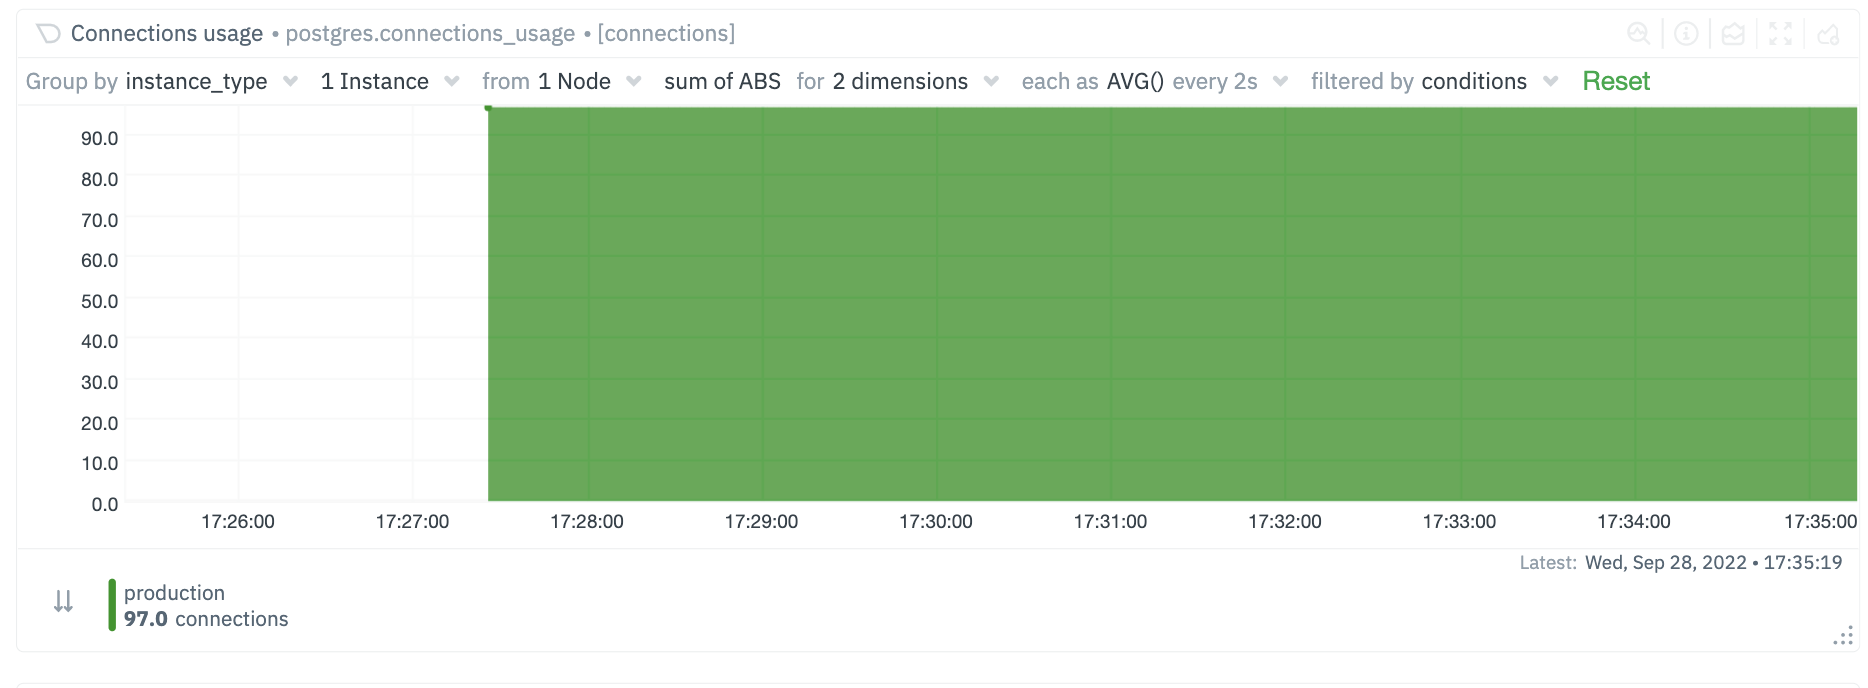 + 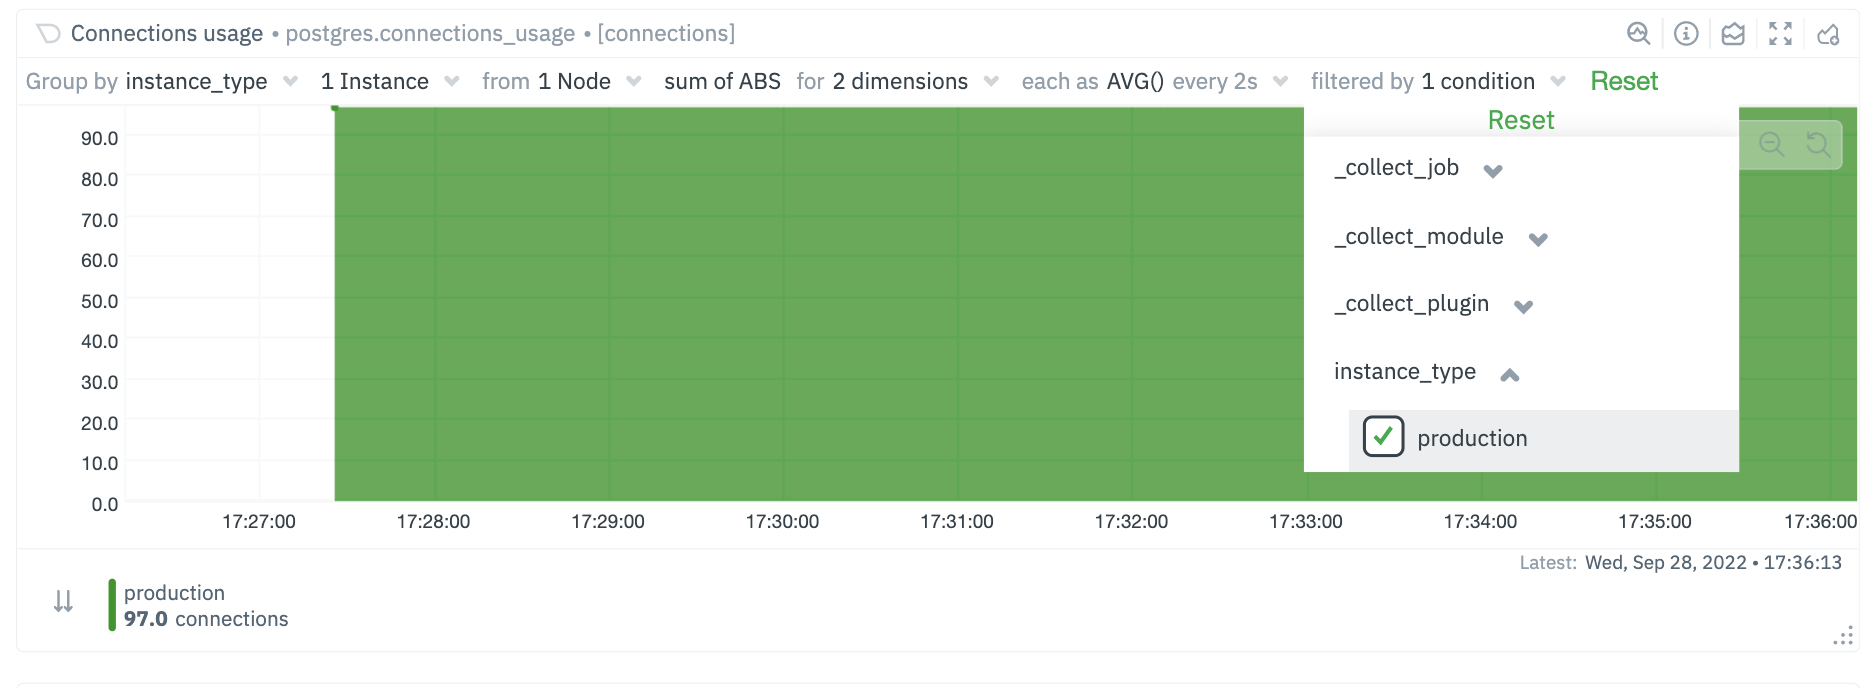 + +### Future Work + +We already have [configurable host labels](https://learn.netdata.cloud/guides/using-host-labels) as well, which currently can’t be used to filter or group your metrics. We intend to provide the same capabilities described here with host labels, among other capabilities on other areas of the app as well + ## What's next? We recommend you read up on the differences between [chart dimensions, contexts, and diff --git a/docs/get-started.mdx b/docs/get-started.mdx index ec36c6a2a..892baa0ce 100644 --- a/docs/get-started.mdx +++ b/docs/get-started.mdx @@ -6,8 +6,8 @@ sidebar_label: "Get started" custom_edit_url: https://github.com/netdata/netdata/edit/master/docs/get-started.mdx --- -import { OneLineInstallWget } from '../src/components/OneLineInstall/' -import { Install, InstallBox } from '../src/components/Install/' +import { OneLineInstallWget } from '@site/src/components/OneLineInstall/' +import { Install, InstallBox } from '@site/src/components/Install/' # Get started with Netdata diff --git a/docs/guides/configure/performance.md b/docs/guides/configure/performance.md index f83634168..cb52a1141 100644 --- a/docs/guides/configure/performance.md +++ b/docs/guides/configure/performance.md @@ -8,8 +8,9 @@ custom_edit_url: https://github.com/netdata/netdata/edit/master/docs/guides/conf # How to optimize the Netdata Agent's performance We designed the Netdata Agent to be incredibly lightweight, even when it's collecting a few thousand dimensions every -second and visualizing that data into hundreds of charts. The Agent itself should never use more than 1% of a single CPU -core, roughly 100 MiB of RAM, and minimal disk I/O to collect, store, and visualize all this data. +second and visualizing that data into hundreds of charts. When properly configured for a production node, the Agent +itself should never use more than 1% of a single CPU core, roughly 50-100 MiB of RAM, and minimal disk I/O to collect, +store, and visualize all this data. We take this scalability seriously. We have one user [running Netdata](https://github.com/netdata/netdata/issues/1323#issuecomment-266427841) on a system with 144 cores and 288 @@ -21,6 +22,11 @@ only 512 MiB of RAM, or an IoT device like a [Raspberry Pi](/docs/guides/monitor cases, reducing Netdata's footprint beyond its already diminutive size can pay big dividends, giving your services more horsepower while still monitoring the health and the performance of the node, OS, hardware, and applications. +The default settings of the Netdata Agent are not optimized for performance, but for a simple standalone setup. We want +the first install to give you something you can run without any configuration. Most of the settings and options are +enabled, since we want you to experience the full thing. + + ## Prerequisites - A node running the Netdata Agent. @@ -146,18 +152,39 @@ calculator](/docs/store/change-metrics-storage.md#calculate-the-system-resources All the settings are found in the `[global]` section of `netdata.conf`: ```conf -[global] +[db] memory mode = dbengine page cache size = 32 dbengine multihost disk space = 256 ``` +To save even more memory, you can disable the dbengine and reduce retention to just 30 minutes, as shown below: + +```conf +[db] + storage tiers = 1 + mode = alloc + retention = 1800 +``` + Metric retention is not important in certain use cases, such as: - Data collection nodes stream collected metrics collected to a centralization point. - Data collection nodes export their metrics to another time series DB, or are scraped by Prometheus - Netdata installed only during incidents, to get richer information. -In such cases, you may not want to use the dbengine at all and instead opt for memory mode `memory mode = ram` or `memory mode = none`. +In such cases, you may not want to use the dbengine at all and instead opt for memory mode +`memory mode = alloc` or `memory mode = none`. + +## Disable machine learning + +Automated anomaly detection may be a powerful tool, but we recommend it to only be enabled on Netdata parents +that sit outside your production infrastructure, or if you have cpu and memory to spare. You can disable ML +with the following: +```conf +[ml] + enabled = no +``` + ## Run Netdata behind Nginx A dedicated web server like Nginx provides far more robustness than the Agent's internal [web server](/web/README.md). @@ -220,6 +247,19 @@ If you installation is working correctly, and you're not actively auditing Netda access log = none ``` +## Disable health checks + +If you are streaming metrics to parent nodes, we recommend you run your health checks on the parent, for all the metrics collected +by the children nodes. This saves resources on the children and makes it easier to configure or disable alerts and agent notifications. + +The parents by default run health checks for each child, as long as it is connected (the details are in `stream.conf`). +On the child nodes you should add to `netdata.conf` the following: + +```conf +[health] + enabled = no +``` + ## What's next? We hope this guide helped you better understand how to optimize the performance of the Netdata Agent. diff --git a/docs/guides/export/export-netdata-metrics-graphite.md b/docs/guides/export/export-netdata-metrics-graphite.md index 007c30f8b..dd742e454 100644 --- a/docs/guides/export/export-netdata-metrics-graphite.md +++ b/docs/guides/export/export-netdata-metrics-graphite.md @@ -3,7 +3,7 @@ title: Export and visualize Netdata metrics in Graphite description: "Use Netdata to collect and export thousands of metrics to Graphite for long-term storage or further analysis." image: /img/seo/guides/export/export-netdata-metrics-graphite.png --> -import { OneLineInstallWget } from '../../src/components/OneLineInstall/' +import { OneLineInstallWget } from '@site/src/components/OneLineInstall/' # Export and visualize Netdata metrics in Graphite diff --git a/docs/guides/monitor/lamp-stack.md b/docs/guides/monitor/lamp-stack.md index 595d64400..29b35e142 100644 --- a/docs/guides/monitor/lamp-stack.md +++ b/docs/guides/monitor/lamp-stack.md @@ -7,7 +7,7 @@ author_title: "Editorial Director, Technical & Educational Resources" author_img: "/img/authors/joel-hans.jpg" custom_edit_url: https://github.com/netdata/netdata/edit/master/docs/guides/monitor/lamp-stack.md --> -import { OneLineInstallWget } from '../../src/components/OneLineInstall/' +import { OneLineInstallWget } from '@site/src/components/OneLineInstall/' # LAMP stack monitoring (Linux, Apache, MySQL, PHP) with Netdata diff --git a/docs/guides/monitor/pi-hole-raspberry-pi.md b/docs/guides/monitor/pi-hole-raspberry-pi.md index 721ba2a8f..1246d8ba1 100644 --- a/docs/guides/monitor/pi-hole-raspberry-pi.md +++ b/docs/guides/monitor/pi-hole-raspberry-pi.md @@ -4,7 +4,7 @@ description: "Monitor Pi-hole metrics, plus Raspberry Pi system metrics, in minu image: /img/seo/guides/monitor/netdata-pi-hole-raspberry-pi.png custom_edit_url: https://github.com/netdata/netdata/edit/master/docs/guides/monitor/pi-hole-raspberry-pi.md --> -import { OneLineInstallWget } from '../../src/components/OneLineInstall/' +import { OneLineInstallWget } from '@site/src/components/OneLineInstall/' # Monitor Pi-hole (and a Raspberry Pi) with Netdata diff --git a/docs/guides/python-collector.md b/docs/guides/python-collector.md index f93c724bf..920b9b9ef 100644 --- a/docs/guides/python-collector.md +++ b/docs/guides/python-collector.md @@ -424,8 +424,8 @@ configuration in [YAML](https://www.tutorialspoint.com/yaml/yaml_basics.htm) for run. This enables you to define different "ways" to fetch data from a particular data source so that the collector has more chances to work out-of-the-box. For example, if the data source supports both `HTTP` and `linux socket`, you can define 2 jobs named `local`, with each using a different method. -- Check the `postgresql` collector configuration file on - [GitHub](https://github.com/netdata/netdata/blob/master/collectors/python.d.plugin/postgres/postgres.conf) to get a +- Check the `example` collector configuration file on + [GitHub](https://github.com/netdata/netdata/blob/master/collectors/python.d.plugin/example/example.conf) to get a sense of the structure. ```yaml @@ -455,8 +455,8 @@ function takes 2 arguments, one with the name of the configuration field and one find the configuration field. This allows you to define sane defaults for your collector. Moreover, when creating the configuration file, create a large comment section that describes the configuration -variables and inform the user about the defaults. For example, take a look at the `postgresql` collector on -[GitHub](https://github.com/netdata/netdata/blob/master/collectors/python.d.plugin/postgres/postgres.conf). +variables and inform the user about the defaults. For example, take a look at the `example` collector on +[GitHub](https://github.com/netdata/netdata/blob/master/collectors/python.d.plugin/example/example.conf). You can read more about the configuration file on the [`python.d.plugin` documentation](https://learn.netdata.cloud/docs/agent/collectors/python.d.plugin). @@ -465,7 +465,7 @@ documentation](https://learn.netdata.cloud/docs/agent/collectors/python.d.plugin Find the source code for the above examples on [GitHub](https://github.com/papajohn-uop/netdata). -Now we you ready to start developing our Netdata python Collector and share it with the rest of the Netdata community. +Now you are ready to start developing our Netdata python Collector and share it with the rest of the Netdata community. - If you need help while developing your collector, join our [Netdata Community](https://community.netdata.cloud/c/agent-development/9) to chat about it. diff --git a/docs/guides/step-by-step/step-00.md b/docs/guides/step-by-step/step-00.md index ab68fe741..9f0fecac8 100644 --- a/docs/guides/step-by-step/step-00.md +++ b/docs/guides/step-by-step/step-00.md @@ -3,7 +3,7 @@ title: "The step-by-step Netdata guide" date: 2020-03-31 custom_edit_url: https://github.com/netdata/netdata/edit/master/docs/guides/step-by-step/step-00.md --> -import { OneLineInstallWget, OneLineInstallCurl } from '../../src/components/OneLineInstall/' +import { OneLineInstallWget, OneLineInstallCurl } from '@site/src/components/OneLineInstall/' # The step-by-step Netdata guide diff --git a/docs/guides/step-by-step/step-09.md b/docs/guides/step-by-step/step-09.md index 6333dfe69..8aacd7514 100644 --- a/docs/guides/step-by-step/step-09.md +++ b/docs/guides/step-by-step/step-09.md @@ -36,10 +36,10 @@ guide, your Netdata agent is already using the database engine. Let's look at your `netdata.conf` file again. Under the `[global]` section, you'll find three connected options. ```conf -[global] - # memory mode = dbengine - # page cache size = 32 - # dbengine disk space = 256 +[db] + # mode = dbengine + # dbengine page cache size MB = 32 + # dbengine disk space MB = 256 ``` The `memory mode` option is set, by default, to `dbengine`. `page cache size` determines the amount of RAM, in MiB, that @@ -56,10 +56,10 @@ space` based on your needs. The calculator gives an accurate estimate based on h metrics your Agent collects, and more. ```conf -[global] - memory mode = dbengine - page cache size = 64 - dbengine disk space = 512 +[db] + mode = dbengine + dbengine page cache size MB = 64 + dbengine disk space MB = 512 ``` After you've made your changes, restart Netdata using `sudo systemctl restart netdata`, or the [appropriate diff --git a/docs/guides/troubleshoot/troubleshooting-agent-with-cloud-connection.md b/docs/guides/troubleshoot/troubleshooting-agent-with-cloud-connection.md index ee214c814..3bb5ace66 100644 --- a/docs/guides/troubleshoot/troubleshooting-agent-with-cloud-connection.md +++ b/docs/guides/troubleshoot/troubleshooting-agent-with-cloud-connection.md @@ -65,7 +65,7 @@ With the introduction of our new architecture, Agents running versions lower tha ### Verify that your IP is whitelisted from Netdata Cloud -Most of the nodes change IPs dynamically. It is possible that your current IP has been restricted from accessing `app.netdata.cloud` due to security concerns. +Most of the nodes change IPs dynamically. It is possible that your current IP has been restricted from accessing `api.netdata.cloud` due to security concerns. To verify this: @@ -75,7 +75,7 @@ To verify this: sudo netdatacli aclk-state | grep "Banned By Cloud" ``` - The output will contain a line indicating if the IP is banned from `app.netdata.cloud`: + The output will contain a line indicating if the IP is banned from `api.netdata.cloud`: ```bash Banned By Cloud: yes @@ -97,13 +97,13 @@ To verify this: 2. If you can reach external IPs, then check your domain resolution. ```bash - host app.netdata.cloud + host api.netdata.cloud ``` The expected output should be something like this: ```bash - app.netdata.cloud is an alias for main-ingress-545609a41fcaf5d6.elb.us-east-1.amazonaws.com. + api.netdata.cloud is an alias for main-ingress-545609a41fcaf5d6.elb.us-east-1.amazonaws.com. main-ingress-545609a41fcaf5d6.elb.us-east-1.amazonaws.com has address 54.198.178.11 main-ingress-545609a41fcaf5d6.elb.us-east-1.amazonaws.com has address 44.207.131.212 main-ingress-545609a41fcaf5d6.elb.us-east-1.amazonaws.com has address 44.196.50.41 @@ -111,7 +111,7 @@ To verify this: :::info - There will be cases in which the firewall restricts network access. In those cases, you need to whitelist the `app.netdata.cloud` domain to be able to see your nodes in Netdata Cloud. + There will be cases in which the firewall restricts network access. In those cases, you need to whitelist `api.netdata.cloud` and `mqtt.netdata.cloud` domains to be able to see your nodes in Netdata Cloud. If you can't whitelist domains in your firewall, you can whitelist the IPs that the above command will produce, but keep in mind that they can change without any notice. ::: diff --git a/docs/netdata-for-IoT.md b/docs/netdata-for-IoT.md index 35d770537..8d5bb21ba 100644 --- a/docs/netdata-for-IoT.md +++ b/docs/netdata-for-IoT.md @@ -25,7 +25,7 @@ custom_edit_url: https://github.com/netdata/netdata/edit/master/docs/netdata-for --- -Netdata is a **very efficient** server performance monitoring solution. When running in server hardware, it can collect +Netdata is a [very efficient](/docs/guides/configure/performance.md) server performance monitoring solution. When running in server hardware, it can collect thousands of system and application metrics **per second** with just 1% CPU utilization of a single core. Its web server responds to most data requests in about **half a millisecond** making its web dashboards spontaneous, amazingly fast! diff --git a/docs/store/change-metrics-storage.md b/docs/store/change-metrics-storage.md index 437b45fc2..c4b77d9af 100644 --- a/docs/store/change-metrics-storage.md +++ b/docs/store/change-metrics-storage.md @@ -51,10 +51,8 @@ the accuracy of the values you enter below, changes in the compression ratio, an ::: -Download -the [calculator](https://docs.google.com/spreadsheets/d/e/2PACX-1vTYMhUU90aOnIQ7qF6iIk6tXps57wmY9lxS6qDXznNJrzCKMDzxU3zkgh8Uv0xj_XqwFl3U6aHDZ6ag/pub?output=xlsx) -to optimize the data retention to your preferences. Utilize the "Front" spreadsheet. Experiment with the variables which -are padded with yellow to come up with the best settings for your use case. +Visit the [Netdata Storage Calculator](https://netdata-storage-calculator.herokuapp.com/) app to customize +data retention according to your preferences. ## Edit `netdata.conf` with recommended database engine settings |