
diff options
| author | Daniel Baumann <daniel.baumann@progress-linux.org> | 2018-12-28 14:42:52 +0000 |
|---|---|---|
| committer | Daniel Baumann <daniel.baumann@progress-linux.org> | 2018-12-28 14:42:52 +0000 |
| commit | 12b9efaebb6d008437af4a72a98d05c4319fc825 (patch) | |
| tree | 70876046e52ae898dd7327424f2c27fde1a5d45f | |
| parent | Releasing debian version 1.11.0+dfsg-1~exp1. (diff) | |
| download | netdata-12b9efaebb6d008437af4a72a98d05c4319fc825.tar.xz netdata-12b9efaebb6d008437af4a72a98d05c4319fc825.zip | |
Merging upstream version 1.11.1+dfsg
Signed-off-by: Daniel Baumann <daniel.baumann@progress-linux.org>
237 files changed, 32660 insertions, 14435 deletions
diff --git a/.codacy.yml b/.codacy.yml index 62f669ab3..ea322de83 100644 --- a/.codacy.yml +++ b/.codacy.yml @@ -4,9 +4,9 @@ exclude_paths: - collectors/python.d.plugin/python_modules/pyyaml3/** - collectors/python.d.plugin/python_modules/urllib3/** - collectors/python.d.plugin/python_modules/third_party/** - - web/css/** - - web/lib/** - - web/old/** - - web/gui/src/** - collectors/node.d.plugin/node_modules/** + - web/gui/css/** + - web/gui/lib/** + - web/gui/old/** + - web/gui/src/** - tests/** diff --git a/.github/CODEOWNERS b/.github/CODEOWNERS index f4e61be24..586030e6d 100644 --- a/.github/CODEOWNERS +++ b/.github/CODEOWNERS @@ -2,30 +2,47 @@ * @ktsaou # Ownership by directory structure -.travis/ @paulfantom -# backends/ +.travis/ @paufantom build/ @paulfantom -collectors/python.d.plugin/ @l2isbad @Ferroin -contrib/ @paulfantom -daemon/ @ktsaou -database/ @ktsaou +backends/ @ktsaou @vlvkobal +backends/graphite/ @ktsaou @vlvkobal +backends/json/ @ktsaou @vlvkobal +backends/opentsdb/ @ktsaou @vlvkobal +backends/prometheus/ @ktsaou @vlvkobal @paulfantom +collectors/ @ktsaou @vlvkobal +collectors/charts.d.plugin/ @ktsaou @paulfantom +collectors/freebsd.plugin/ @vlvkobal +collectors/macos.plugin/ @vlvkobal +collectors/node.d.plugin/ @ktsaou @gmosx +collectors/node.d.plugin/fronius/ @ktsaou @gmosx @ccremer +collectors/node.d.plugin/snmp/ @ktsaou @gmosx @cakrit +collectors/node.d.plugin/stiebeleltron/ @ktsaou @gmosx @ccremer +collectors/python.d.plugin/ @l2isbad +daemon/ @ktsaou @vlvkobal +database/ @ktsaou @mfundul docker/ @paulfantom -# health/ -# installer/ -# libnetdata/ -# makeself/ +health/ @ktsaou @mfundul +health/health.d/ @ktsaou @cakrit +health/notifications/ @ktsaou @Ferroin +installer/ @ktsaou @paulfantom +libnetdata/ @ktsaou @vlvkobal +makeself/ @ktsaou @paulfantom packaging/ @paulfantom -# registry/ -# streaming/ -# system/ -# tests/ -# web/ +registry/ @ktsaou @gmosx +streaming/ @ktsaou @mfundul +web/ @ktsaou @vlvkobal @gmosx + +# Ownership by filetype (overwrites ownership by directory) +*.md @ktsaou @cakrit +*.am @paulfantom @ktsaou # Ownership of specific files -CHANGELOG.md @netdatabot .travis.yml @paulfantom .lgtm.yml @paulfantom +.eslintrc @paulfantom +.eslintignore @paulfantom +.csslintrc @paulfantom +.codeclimate.yml @paulfantom +.codacy.yml @paulfantom -# Ownership by filetype (overwrites ownership by directory) -*.am @paulfantom @ktsaou -*.c *.h @ktsaou @vlvkobal +CHANGELOG.md @netdatabot diff --git a/.gitignore b/.gitignore index c3f327b37..c64d75954 100644 --- a/.gitignore +++ b/.gitignore @@ -143,3 +143,8 @@ sitespeed-result/ # tests and temp files python.d/python-modules-installer.sh + +# documentation generated files +htmldoc/src +htmldoc/build +htmldoc/mkdocs.yml @@ -18,6 +18,7 @@ path_classifiers: - collectors/node.d.plugin/node_modules/net-snmp.js - collectors/node.d.plugin/node_modules/pixl-xml.js - web/gui/lib/ + - web/gui/src/ - web/gui/css/ test: - tests/ diff --git a/.travis/README.md b/.travis/README.md index 5a51b2a7c..e37e9feff 100644 --- a/.travis/README.md +++ b/.travis/README.md @@ -29,40 +29,43 @@ installations of netdata. Jobs are run on following operating systems: - CentOS 7 (containerized) - alpine (containerized) -### Release +### Packaging This stage is executed only on "master" brach and allows us to create a new tag just looking at git commit message. -It also has an option to automatically generate changelog based on GitHub labels and sync it with GitHub release. -For the sake of simplicity and to use travis features this stage cannot be integrated with next stage. - -Releases are generated by searching for a keyword in last commit message. Keywords are: - - [patch] or [fix] to bump patch number - - [minor], [feature] or [feat] to bump minor number - - [major] or [breaking change] to bump major number -All keywords MUST be surrounded with square braces. -Alternative is to push a tag to master branch. - -### Packaging +It executes one script called `releaser.sh` which is responsible for creating a release on GitHub by using +[hub](https://github.com/github/hub). This script is also executing other scripts which can also be used in other +CI jobs: + - `tagger.sh` + - `generate_changelog.sh` + - `build.sh` + - `create_artifacts.sh` -This stage is executed only on "master" branch and it is separated into 3 jobs: - - Update Changelog/Create release - - Nightly tarball and self-extractor build - - Nightly docker images +Alternatively new release can be also created by pushing new tag to master branch. -##### Update Changelog/Create release +##### tagger.sh -This job is running one script called `releaser.sh`, which is responsible for a couple of things. First of all it -automatically updates our CHANGELOG.md file based on GitHub features (mostly labels and pull requests). Apart from -that it can also create a new git tag and a github draft release connected to that tag. -Releases are generated by searching for a keyword in last commit message. Keywords are: +Script responsible to find out what will be the next tag based on a keyword in last commit message. Keywords are: - `[netdata patch release]` to bump patch number - `[netdata minor release]` to bump minor number - `[netdata major release]` to bump major number + - `[netdata release candidate]` to create a new release candidate (appends or modifies suffix `-rcX` of previous tag) All keywords MUST be surrounded with square brackets. +Tag is then stored in `GIT_TAG` variable. -Alternatively new release can be also created by pushing new tag to master branch. +##### generate_changelog.sh -##### Nightly tarball and self-extractor build AND Nightly docker images +Automatic changelog generator which updates our CHANGELOG.md file based on GitHub features (mostly labels and pull +requests). Internally it uses +[github-changelog-generator](https://github.com/github-changelog-generator/github-changelog-generator) and more +information can be found on that project site. + +##### build.sh and create_artifacts.sh + +Scripts used to build new container images and provide release artifacts (tar.gz and makeself archives) + +### Nightlies + +##### Tarball and self-extractor build AND Nightly docker images As names might suggest those two jobs are responsible for nightly netdata package creation and are run every day (in cron). Combined they produce: @@ -70,11 +73,16 @@ cron). Combined they produce: - tar.gz archive (soon to be removed) - self-extracting package -Currently "Nightly tarball and self-extractor build" is using old firehol script and it is planed to be replaced with -new design. +This is achieved by running 2 scripts described earlier: + - `create_artifacts.sh` + - `build.sh` -##### Nightly changelog generation +##### Changelog generation This job is responsible for regenerating changelog every day by executing `generate_changelog.sh` script. This is done only once a day due to github rate limiter. +##### Labeler + +Once a day we are doing automatic label assignment by executing `labeler.sh`. This script is a temporary workaround until +we start using GitHub Actions. For more information what it is currently doing go to its code. diff --git a/.travis/decrypt-if-have-key b/.travis/decrypt-if-have-key deleted file mode 100755 index 7fcab8970..000000000 --- a/.travis/decrypt-if-have-key +++ /dev/null @@ -1,33 +0,0 @@ -#!/bin/bash - -set -e - -# Decrypt our private files; changes to this file should be inspected -# closely to ensure they do not create information leaks - -eval key="\${encrypted_${1}_key}" -eval iv="\${encrypted_${1}_iv}" - -if [ ! "$key" ] -then - echo "No aes key present - skipping decryption" - exit 0 -fi - -for i in .travis/*.enc -do - u=$(echo $i | sed -e 's/.enc$//') - openssl aes-256-cbc -K "$key" -iv "$iv" -in $i -out $u -d -done - -if [ -f .travis/travis_rsa ] -then - echo "ssh key present - loading to agent" - # add key, then remove to prevent leaks - chmod 600 .travis/travis_rsa - ssh-add .travis/travis_rsa - rm -f .travis/travis_rsa - touch /tmp/ssh-key-loaded -else - echo "No ssh key present - skipping agent start" -fi diff --git a/.travis/deploy-if-have-key b/.travis/deploy-if-have-key deleted file mode 100755 index 8b3b40f7e..000000000 --- a/.travis/deploy-if-have-key +++ /dev/null @@ -1,55 +0,0 @@ -#!/bin/bash - -set -e - -# Deploy tar-files and checksums to the firehol website - -if [ ! -f /tmp/ssh-key-loaded ] -then - echo "No ssh key decrypted - skipping deployment to website" - exit 0 -fi - -case "$TRAVIS_BRANCH" in - master|stable-*) - : - ;; - *) - echo "Not on master or stable-* branch - skipping deployment to website" - exit 0 - ;; -esac - -if [ "$TRAVIS_PULL_REQUEST" = "true" ] -then - echo "Building pull request - skipping deployment to website" - exit 0 -fi - -if [ "$TRAVIS_TAG" != "" ] -then - echo "Building tag - skipping deployment to website" - exit 0 -fi - -if [ "$TRAVIS_OS_NAME" != "linux" ] -then - echo "Building non-linux version - skipping deployment to website" - exit 0 -fi - -if [ "$CC" != "gcc" ] -then - echo "Building non-gcc version - skipping deployment to website" - exit 0 -fi - -ssh-keyscan -H firehol.org >> ~/.ssh/known_hosts -ssh travis@firehol.org mkdir -p uploads/netdata/$TRAVIS_BRANCH/ -scp -p *.tar.gz travis@firehol.org:uploads/netdata/$TRAVIS_BRANCH/ -scp -p *.tar.gz.sha travis@firehol.org:uploads/netdata/$TRAVIS_BRANCH/ -scp -p *.tar.gz.asc travis@firehol.org:uploads/netdata/$TRAVIS_BRANCH/ -scp -p *.gz.run travis@firehol.org:uploads/netdata/$TRAVIS_BRANCH/ -scp -p *.gz.run.sha travis@firehol.org:uploads/netdata/$TRAVIS_BRANCH/ -scp -p *.gz.run.asc travis@firehol.org:uploads/netdata/$TRAVIS_BRANCH/ -ssh travis@firehol.org touch uploads/netdata/$TRAVIS_BRANCH/complete.txt diff --git a/.travis/firehol_create_artifacts.sh b/.travis/firehol_create_artifacts.sh deleted file mode 100755 index 3fcb910e7..000000000 --- a/.travis/firehol_create_artifacts.sh +++ /dev/null @@ -1,31 +0,0 @@ -#!/bin/bash -# shellcheck disable=SC2230 - -# WARNING: This script is deprecated and placed here until @paulfantom figures out how to fully replace it - -if [ ! -f .gitignore ] -then - echo "Run as ./travis/$(basename "$0") from top level directory of git repository" - exit 1 -fi - -eval "$(ssh-agent -s)" -./.travis/decrypt-if-have-key decb6f6387c4 -export KEYSERVER=ipv4.pool.sks-keyservers.net -./packaging/gpg-recv-key phil@firehol.org "0762 9FF7 89EA 6156 012F 9F50 C406 9602 1359 9237" -./packaging/gpg-recv-key costa@tsaousis.gr "4DFF 624A E564 3B51 2872 1F40 29CA 3358 89B9 A863" -# Run the commit hooks in case the developer didn't -git diff 4b825dc642cb6eb9a060e54bf8d69288fbee4904 | ./packaging/check-files - -fakeroot ./packaging/git-build -# Make sure stdout is in blocking mode. If we don't, then conda create will barf during downloads. -# See https://github.com/travis-ci/travis-ci/issues/4704#issuecomment-348435959 for details. -python -c 'import os,sys,fcntl; flags = fcntl.fcntl(sys.stdout, fcntl.F_GETFL); fcntl.fcntl(sys.stdout, fcntl.F_SETFL, flags&~os.O_NONBLOCK);' -echo "--- Create tarball ---" -make dist -echo "--- Create self-extractor ---" -./makeself/build-x86_64-static.sh -echo "--- Create checksums ---" -for i in *.tar.gz; do sha512sum -b "$i" > "$i.sha"; done #FIXME remove? -for i in *.gz.run; do sha512sum -b "$i" > "$i.sha"; done #FIXME remove? -sha256sum -b ./*.tar.gz ./*.gz.run > "sha256sums.txt" -./.travis/deploy-if-have-key diff --git a/.travis/generate_changelog.sh b/.travis/generate_changelog.sh index bc8be1023..d9b91113a 100755 --- a/.travis/generate_changelog.sh +++ b/.travis/generate_changelog.sh @@ -10,8 +10,8 @@ fi ORGANIZATION=$(echo "$TRAVIS_REPO_SLUG" | awk -F '/' '{print $1}') PROJECT=$(echo "$TRAVIS_REPO_SLUG" | awk -F '/' '{print $2}') -GIT_MAIL="pawel+bot@netdata.cloud" -GIT_USER="netdatabot" +GIT_MAIL=${GIT_MAIL:-"pawel+bot@netdata.cloud"} +GIT_USER=${GIT_USER:-"netdatabot"} echo "--- Initialize git configuration ---" git config user.email "${GIT_MAIL}" @@ -32,5 +32,5 @@ docker run -it -v "$(pwd)":/project markmandel/github-changelog-generator:latest echo "--- Uploading changelog ---" git add CHANGELOG.md -git commit -m '[ci skip] Automatic changelog update' +git commit -m '[ci skip] Automatic changelog update' || exit 0 git push "https://${GITHUB_TOKEN}:@$(git config --get remote.origin.url | sed -e 's/^https:\/\///')" diff --git a/.travis/labeler.sh b/.travis/labeler.sh new file mode 100755 index 000000000..47bf250a0 --- /dev/null +++ b/.travis/labeler.sh @@ -0,0 +1,32 @@ +#!/bin/bash + +# This is a simple script which should apply labels to unlabelled issues from last 3 days. +# It will soon be deprecated by GitHub Actions so no futher development on it is planned. + +if [ "$GITHUB_TOKEN" == "" ]; then + echo "GITHUB_TOKEN is needed" + exit 1 +fi + +# Download hub +HUB_VERSION=${HUB_VERSION:-"2.5.1"} +wget "https://github.com/github/hub/releases/download/v${HUB_VERSION}/hub-linux-amd64-${HUB_VERSION}.tgz" -O "/tmp/hub-linux-amd64-${HUB_VERSION}.tgz" +tar -C /tmp -xvf "/tmp/hub-linux-amd64-${HUB_VERSION}.tgz" &>/dev/null +export PATH=$PATH:"/tmp/hub-linux-amd64-${HUB_VERSION}/bin" + +echo "Looking up available labels" +LABELS_FILE=/tmp/exclude_labels +hub issue labels > $LABELS_FILE + +for STATE in "open" "closed"; do + for ISSUE in $(hub issue -f "%I %l%n" -s "$STATE" -d "$(date +%F -d '3 days ago')" | grep -v -f $LABELS_FILE); do + echo "Processing $STATE issue no. $ISSUE" + URL="https://api.github.com/repos/netdata/netdata/issues/$ISSUE" + BODY="$(curl "${URL}" | jq .body 2>/dev/null)" + case "${BODY}" in + *"# Question summary"* ) curl -H "Authorization: token $GITHUB_TOKEN" -d '{"labels":["question"]}' -X PATCH "${URL}" ;; + *"# Bug report summary"* ) curl -H "Authorization: token $GITHUB_TOKEN" -d '{"labels":["bug"]}' -X PATCH "${URL}" ;; + * ) curl -H "Authorization: token $GITHUB_TOKEN" -d '{"labels":["needs triage"]}' -X PATCH "${URL}" ;; + esac + done +done diff --git a/.travis/releaser.sh b/.travis/releaser.sh index 9f7ecd4ee..c184cc726 100755 --- a/.travis/releaser.sh +++ b/.travis/releaser.sh @@ -21,49 +21,24 @@ # Requirements: # - GITHUB_TOKEN variable set with GitHub token. Access level: repo.public_repo # - docker -# - git-semver python package (pip install git-semver) set -e -if [ ! -f .gitignore ] -then - echo "Run as ./travis/$(basename "$0") from top level directory of git repository" - exit 1 +if [ ! -f .gitignore ]; then + echo "Run as ./travis/$(basename "$0") from top level directory of git repository" + exit 1 fi -echo "---- GENERATING CHANGELOG -----" -./.travis/generate_changelog.sh +export GIT_MAIL="pawel+bot@netdata.cloud" +export GIT_USER="netdatabot" +echo "--- Initialize git configuration ---" +git config user.email "${GIT_MAIL}" +git config user.name "${GIT_USER}" echo "---- FIGURING OUT TAGS ----" -# Check if current commit is tagged or not -GIT_TAG=$(git tag --points-at) -if [ -z "${GIT_TAG}" ]; then - git semver - # Figure out next tag based on commit message - GIT_TAG=HEAD - echo "Last commit message: $TRAVIS_COMMIT_MESSAGE" - case "${TRAVIS_COMMIT_MESSAGE}" in - *"[netdata patch release]"* ) GIT_TAG="v$(git semver --next-patch)" ;; - *"[netdata minor release]"* ) GIT_TAG="v$(git semver --next-minor)" ;; - *"[netdata major release]"* ) GIT_TAG="v$(git semver --next-major)" ;; - *) echo "Keyword not detected. Doing nothing" ;; - esac - - # Tag it! - if [ "$GIT_TAG" != "HEAD" ]; then - echo "Assigning a new tag: $GIT_TAG" - git tag "$GIT_TAG" -a -m "Automatic tag generation for travis build no. $TRAVIS_BUILD_NUMBER" - # git is able to push due to configuration already being initialized in `generate_changelog.sh` script - git push "https://${GITHUB_TOKEN}:@$(git config --get remote.origin.url | sed -e 's/^https:\/\///')" --tags - fi -fi - -if [ "${GIT_TAG}" == "HEAD" ]; then - echo "Not creating a release since neither of two conditions was met:" - echo " - keyword in commit message" - echo " - commit is tagged" - exit 0 -fi +# tagger.sh is sourced since we need environment variables it sets +#shellcheck source=/dev/null +source .travis/tagger.sh || exit 0 echo "---- CREATING TAGGED DOCKER CONTAINERS ----" export REPOSITORY="netdata/netdata" @@ -80,4 +55,20 @@ tar -C /tmp -xvf "/tmp/hub-linux-amd64-${HUB_VERSION}.tgz" export PATH=$PATH:"/tmp/hub-linux-amd64-${HUB_VERSION}/bin" # Create a release draft -hub release create --draft -a "netdata-${GIT_TAG}.tar.gz" -a "netdata-${GIT_TAG}.gz.run" -a "sha256sums.txt" -m "${GIT_TAG}" "${GIT_TAG}" +if [ -z ${GIT_TAG+x} ]; then + echo "Variable GIT_TAG is not set. Something went terribly wrong! Exiting." + exit 1 +fi +if [ "${GIT_TAG}" != "$(git tag --points-at)" ]; then + echo "ERROR! Current commit is not tagged. Stopping release creation." + exit 1 +fi +if [ -z ${RC+x} ]; then + hub release create --prerelease --draft -a "netdata-${GIT_TAG}.tar.gz" -a "netdata-${GIT_TAG}.gz.run" -a "sha256sums.txt" -m "${GIT_TAG}" "${GIT_TAG}" +else + hub release create --draft -a "netdata-${GIT_TAG}.tar.gz" -a "netdata-${GIT_TAG}.gz.run" -a "sha256sums.txt" -m "${GIT_TAG}" "${GIT_TAG}" +fi + +# Changelog needs to be created AFTER new release to avoid problems with circular dependencies and wrong entries in changelog file +echo "---- GENERATING CHANGELOG -----" +./.travis/generate_changelog.sh diff --git a/.travis/tagger.sh b/.travis/tagger.sh new file mode 100755 index 000000000..b1907c347 --- /dev/null +++ b/.travis/tagger.sh @@ -0,0 +1,81 @@ +#!/bin/bash +# SPDX-License-Identifier: MIT +# Copyright (C) 2018 Pawel Krupa (@paulfantom) - All Rights Reserved +# Permission to copy and modify is granted under the MIT license +# +# Original script is available at https://github.com/paulfantom/travis-helper/blob/master/releasing/releaser.sh +# +# Tags are generated by searching for a keyword in last commit message. Keywords are: +# - [patch] or [fix] to bump patch number +# - [minor], [feature] or [feat] to bump minor number +# - [major] or [breaking change] to bump major number +# All keywords MUST be surrounded with square braces. +# +# Requirements: +# - GITHUB_TOKEN variable set with GitHub token. Access level: repo.public_repo +# - git-semver python package (pip install git-semver) + +set -e + +if [ ! -f .gitignore ]; then + echo "Run as ./travis/$(basename "$0") from top level directory of git repository" + exit 1 +fi + +# Embed new version in files which need it. +# This wouldn't be needed if we could use `git tag` everywhere. +function embed_version { + VERSION="$1" + MAJOR=$(echo "$GIT_TAG" | cut -d . -f 1 | cut -d v -f 2) + MINOR=$(echo "$GIT_TAG" | cut -d . -f 2) + PATCH=$(echo "$GIT_TAG" | cut -d . -f 3 | cut -d '-' -f 1) + sed -i "s/\\[VERSION_MAJOR\\], \\[.*\\]/\\[VERSION_MAJOR\\], \\[$MAJOR\\]/" configure.ac + sed -i "s/\\[VERSION_MINOR\\], \\[.*\\]/\\[VERSION_MINOR\\], \\[$MINOR\\]/" configure.ac + sed -i "s/\\[VERSION_PATCH\\], \\[.*\\]/\\[VERSION_PATCH\\], \\[$PATCH\\]/" configure.ac + git add configure.ac +} + +# Figure out what will be new release candidate tag based only on previous ones. +# This assumes that RELEASES are in format of "v0.1.2" and prereleases (RCs) are using "v0.1.2-rc0" +function release_candidate { + LAST_TAG=$(git semver) + if [[ $LAST_TAG =~ -rc* ]]; then + LAST_RELEASE=$(echo "$LAST_TAG" | cut -d'-' -f 1) + LAST_RC=$(echo "$LAST_TAG" | cut -d'c' -f 2) + RC=$((LAST_RC + 1)) + else + LAST_RELEASE=$LAST_TAG + RC=0 + fi + GIT_TAG="v$LAST_RELEASE-rc$RC" + export GIT_TAG +} + +# Check if current commit is tagged or not +GIT_TAG=$(git tag --points-at) +if [ -z "${GIT_TAG}" ]; then + git semver + # Figure out next tag based on commit message + echo "Last commit message: $TRAVIS_COMMIT_MESSAGE" + case "${TRAVIS_COMMIT_MESSAGE}" in + *"[netdata patch release]"*) GIT_TAG="v$(git semver --next-patch)" ;; + *"[netdata minor release]"*) GIT_TAG="v$(git semver --next-minor)" ;; + *"[netdata major release]"*) GIT_TAG="v$(git semver --next-major)" ;; + *"[netdata release candidate]"*) release_candidate ;; + *) echo "Keyword not detected. Exiting..."; exit 1;; + esac + # Tag it! + if [ "$GIT_TAG" != "HEAD" ]; then + echo "Assigning a new tag: $GIT_TAG" + embed_version "$GIT_TAG" + git commit -m "[ci skip] release $GIT_TAG" + git tag "$GIT_TAG" -a -m "Automatic tag generation for travis build no. $TRAVIS_BUILD_NUMBER" + git push "https://${GITHUB_TOKEN}:@$(git config --get remote.origin.url | sed -e 's/^https:\/\///')" + git push "https://${GITHUB_TOKEN}:@$(git config --get remote.origin.url | sed -e 's/^https:\/\///')" --tags + fi +else + embed_version "$GIT_TAG" + git commit -m "[ci skip] release $GIT_TAG" + git push "https://${GITHUB_TOKEN}:@$(git config --get remote.origin.url | sed -e 's/^https:\/\///')" +fi +export GIT_TAG diff --git a/.travis/travis_rsa.enc b/.travis/travis_rsa.enc Binary files differdeleted file mode 100644 index 148a425bc..000000000 --- a/.travis/travis_rsa.enc +++ /dev/null diff --git a/CONTRIBUTING.md b/CONTRIBUTING.md new file mode 100644 index 000000000..fa0656526 --- /dev/null +++ b/CONTRIBUTING.md @@ -0,0 +1,92 @@ +# Contributing + +Thank you for considering contributing to Netdata. + +We love to receive contributions. Maintaining a platform for monitoring everything imaginable requires a broad understanding of a plethora of technologies, systems and applications. We rely on community contributions and user feedback to continue providing the best monitoring solution out there. + +There are many ways to contribute, with varying requirements of skills: + +## All NetData Users + +### Give Netdata a GitHub star + +This is the minimum open-source users should contribute back to the projects they use. Github stars help the project gain visibility, stand out. So, if you use Netdata, consider pressing that button. **It really matters**. + +### Spread the word + +Community growth allows the project to attract new talent willing to contribute. This talent is then developing new features and improves the project. These new features and improvements attract more users and so on. It is a loop. So, post about netdata, present it to local meetups you attend, let your online social network or twitter, facebook, reddit, etc. know you are using it. **The more people involved, the faster the project evolves**. + +### Provide feedback + +Is there anything that bothers you about netdata? Did you experience an issue while installing it or using it? Would you like to see it evolve to you need? Let us know. [Open a github issue](https://github.com/netdata/netdata/issues) to discuss it. Feedback is very important for open-source projects. We can't commit we will do everything, but your feedback influences our road-map significantly. **We rely on your feedback to make Netdata better**. + +#### Help the developers understand what they have to do + +NetData is all about simplicity and meaningful presentation. It's impossible for a handful of people to know which metrics really matter when monitoring a particular software or hardware component you are interested in. Be specific about what should be collected, how the information should be presented in the dashboard and which alarms make sense in most situations. + +## Experienced Users + +### Help other users + +As the project grows, an increasing share of our time is spent on supporting this community of users in terms of answering questions, of helping users understand how netdata works and find their way with it. Helping other users is crucial. It allows the developers and maintainers of the project to focus on improving it. + +### Improve documentation + +Most of our documentation is in markdown (.md) files inside the netdata GitHub project. What remains in our Wiki will soon be moved in there as well. Don't be afraid to edit any of these documents and submit a GitHub Pull Request with your corrections/additions. + + +## Developers + +We expect most contributions to be for new data collection plugins. You can read about how external plugins work [here](collectors/plugins.d/). Additional instructions are available for [Node.js plugins](collectors/node.d.plugin) and [Python plugis](collectors/python.d.plugin). + +Of course we appreciate contributions for any other part of the NetData agent, including the [daemon](daemon), [backends for long term archiving](backends/), innovative ways of using the [REST API](web/api) to create cool [Custom Dashboards](web/gui/custom/) or to include NetData charts in other applications, similarly to what can be done with [Confluence](web/gui/confluence/). + + +### Contributions Ground Rules + +#### Code of Conduct and CLA + +We expect all contributors to abide by the [Contributor Covenant Code of Conduct](CODE_OF_CONDUCT.md). For a pull request to be accepted, you will also need to accept the [netdata contributors license agreement](CONTRIBUTORS.md), as part of the PR process. + +#### Performance and efficiency + +Everything on Netdata is about efficiency. We need netdata to always be the most lightweight monitoring solution available. We will reject to merge PRs that are not optimal in resource utilization and efficiency. + +Of course there are cases that such technical excellence is either not reasonable or not feasible. In these cases, we may require the feature or code submitted to be by disabled by default. + +#### Meaningful metrics + +Unlike other monitoring solutions, Netdata requires all metrics collected to have some structure attached to them. So, Netdata metrics have a name, units, belong to a chart that has a title, a family, a context, belong to an application, etc. + +This structure is what makes netdata different. Most other monitoring solution collect bulk metrics in terms of name-value pairs and then expect their users to give meaning to these metrics during visualization. This does not work. It is neither practical nor reasonable to give to someone 2000 metrics and let him/her visualize them in a meaningful way. + +So, netdata requires all metrics to have a meaning at the time they are collected. We will reject to merge PRs that loosely collect just a "bunch of metrics", but we are very keen to help you fix this. + +#### Automated Testing + +Netdata is a very large application to have automated testing end-to-end. But automated testing is required for crucial functions of it. + +Generally, all pull requests should be coupled with automated testing scenarios. However since we do not currently have a framework in place for testing everything little bit of it, we currently require automated tests for parts of Netdata that seem too risky to be changed without automated testing. + +Of course, manual testing is always required. + +#### Netdata is a distributed application + +Netdata is a distributed monitoring application. A few basic features can become quite complicated for such applications. We may reject features that alter or influence the nature of netdata, though we usually discuss the requirements with contributors and help them adapt their code to be better suited for Netdata. + +#### Operating systems supported + +Netdata should be running everywhere, on every production system out there. + +Although we focus on **supported operating systems**, we still want Netdata to run even on non-supported systems. This, of course, may require some more manual work from the users (to prepare their environment, or enable certain flags, etc). + +If your contributions limit the number of operating systems supported we will request from you to improve it. + +#### Documentation + +Your contributions should be bundled with related documentation to help users understand how to use the features you introduce. + +#### Maintenance + +When you contribute code to Netdata, you are automatically accepting that you will be responsible for maintaining that code in the future. So, if users need help, or report bugs, we will invite you to the related github issues to help them or fix the issues or bugs of your contributions. + diff --git a/CONTRIBUTORS.md b/CONTRIBUTORS.md index fde3d0b4f..46ae396f3 100644 --- a/CONTRIBUTORS.md +++ b/CONTRIBUTORS.md @@ -10,7 +10,7 @@ This agreement is part of the legal framework of the open-source ecosystem that adds some red tape, but protects both the contributor and the project. To understand why this is needed, please read [a well-written chapter from -Karl Fogel’s Producing Open Source Software on CLAs](http://producingoss.com/en/copyright-assignment.html). +Karl Fogel’s Producing Open Source Software on CLAs](https://producingoss.com/en/copyright-assignment.html). By signing this agreement, you do not change your rights to use your own contributions for any other purpose. diff --git a/Makefile.am b/Makefile.am index c7fa48c6b..c90db5ca3 100644 --- a/Makefile.am +++ b/Makefile.am @@ -1,6 +1,6 @@ # SPDX-License-Identifier: GPL-3.0-or-later -AUTOMAKE_OPTIONS=foreign subdir-objects 1.10 +AUTOMAKE_OPTIONS=foreign subdir-objects 1.11 ACLOCAL_AMFLAGS = -I build/m4 MAINTAINERCLEANFILES= \ @@ -44,6 +44,7 @@ EXTRA_DIST = \ CODE_OF_CONDUCT.md \ LICENSE \ REDISTRIBUTED.md \ + CONTRIBUTING.md \ $(NULL) SUBDIRS = \ @@ -61,6 +62,27 @@ dist_noinst_DATA= \ netdata.cppcheck \ netdata.spec \ package.json \ + doc/Add-more-charts-to-netdata.md \ + doc/Demo-Sites.md \ + doc/Donations-netdata-has-received.md \ + doc/Netdata-Security-and-Disclosure-Information.md \ + doc/Performance.md \ + doc/Running-behind-apache.md \ + doc/Running-behind-caddy.md \ + doc/Running-behind-lighttpd.md \ + doc/Running-behind-nginx.md \ + doc/Third-Party-Plugins.md \ + doc/a-github-star-is-important.md \ + doc/high-performance-netdata.md \ + doc/netdata-for-IoT.md \ + doc/netdata-security.md \ + doc/Why-Netdata.md \ + htmldoc/themes/material/partials/footer.html \ + installer/README.md \ + installer/UNINSTALL.md \ + installer/UPDATE.md \ + requirements.txt \ + runtime.txt \ $(NULL) # until integrated within build @@ -71,6 +93,8 @@ dist_noinst_SCRIPTS= \ kickstart-static64.sh \ netdata-installer.sh \ installer/functions.sh \ + htmldoc/buildhtml.sh \ + htmldoc/buildyaml.sh \ $(NULL) # ----------------------------------------------------------------------------- diff --git a/Makefile.in b/Makefile.in index 9b1c226b8..d0ad19a01 100644 --- a/Makefile.in +++ b/Makefile.in @@ -824,7 +824,7 @@ top_builddir = @top_builddir@ top_srcdir = @top_srcdir@ varlibdir = @varlibdir@ webdir = @webdir@ -AUTOMAKE_OPTIONS = foreign subdir-objects 1.10 +AUTOMAKE_OPTIONS = foreign subdir-objects 1.11 ACLOCAL_AMFLAGS = -I build/m4 MAINTAINERCLEANFILES = \ config.log config.status \ @@ -867,6 +867,7 @@ EXTRA_DIST = \ CODE_OF_CONDUCT.md \ LICENSE \ REDISTRIBUTED.md \ + CONTRIBUTING.md \ $(NULL) @@ -882,6 +883,27 @@ dist_noinst_DATA = \ netdata.cppcheck \ netdata.spec \ package.json \ + doc/Add-more-charts-to-netdata.md \ + doc/Demo-Sites.md \ + doc/Donations-netdata-has-received.md \ + doc/Netdata-Security-and-Disclosure-Information.md \ + doc/Performance.md \ + doc/Running-behind-apache.md \ + doc/Running-behind-caddy.md \ + doc/Running-behind-lighttpd.md \ + doc/Running-behind-nginx.md \ + doc/Third-Party-Plugins.md \ + doc/a-github-star-is-important.md \ + doc/high-performance-netdata.md \ + doc/netdata-for-IoT.md \ + doc/netdata-security.md \ + doc/Why-Netdata.md \ + htmldoc/themes/material/partials/footer.html \ + installer/README.md \ + installer/UNINSTALL.md \ + installer/UPDATE.md \ + requirements.txt \ + runtime.txt \ $(NULL) @@ -893,6 +915,8 @@ dist_noinst_SCRIPTS = \ kickstart-static64.sh \ netdata-installer.sh \ installer/functions.sh \ + htmldoc/buildhtml.sh \ + htmldoc/buildyaml.sh \ $(NULL) AM_CFLAGS = \ @@ -1,421 +1,499 @@ -# netdata [](https://travis-ci.com/netdata/netdata) [](https://bestpractices.coreinfrastructure.org/projects/2231) [](https://www.gnu.org/licenses/gpl-3.0) - -[](https://codeclimate.com/github/netdata/netdata) -[](https://www.codacy.com/app/netdata/netdata?utm_source=github.com&utm_medium=referral&utm_content=netdata/netdata&utm_campaign=Badge_Grade) -[](https://lgtm.com/projects/g/netdata/netdata/context:cpp) -[](https://lgtm.com/projects/g/netdata/netdata/context:javascript) -[](https://lgtm.com/projects/g/netdata/netdata/context:python) - -> *New to netdata? Here is a live demo: [http://my-netdata.io](http://my-netdata.io)* - -**netdata** is a system for **distributed real-time performance and health monitoring**. - -It provides **unparalleled insights**, **in real-time**, of everything happening on the systems it runs (including containers and applications such as web and database servers), using **modern interactive web dashboards**. - -### netdata core values - -we value |netdata... -:--------------------------:|:---- -high resolution metrics |collects all metrics **every single second** -unlimited metrics |collects **thousands of metrics** per monitored node -real-time visualization |dashboards run with **sub-second latency**, collection to visualization -powerful anomaly detection |has a **distributed watchdog** embedded in it, running on all monitored nodes -visual anomaly detection |dashboards are optimized for **spotting anomalies**, across all metrics -meaningful presentation |dashboards present **all metrics in a structured, easy to understand, way** -zero configuration |**auto-detects** all metrics and comes with dozens of alarms -resource utilization |core is **optimized C code**, using <1% utilization of single CPU core - -netdata also supports: - - - monitoring **ephemeral nodes** and **auto-scaled containers**, - - **integration** with existing monitoring infrastructure (time-series databases like `prometheus`, `graphite`, `opentsdb`) and third-party event notification methods -(like `slack`, `pagerduty`, `pushover`, and dozens more), - - building hierarchies of monitored nodes via **real-time metrics streaming** between them, - - embedding charts and dashboards on third party web sites and applications, such as [Atlassian's Confluence](https://github.com/netdata/netdata/wiki/Custom-Dashboard-with-Confluence). - -_netdata is **fast** and **efficient**, designed to permanently run on all systems -(**physical** & **virtual** servers, **containers**, **IoT** devices), without -disrupting their core function._ - -netdata currently runs on **Linux**, **FreeBSD**, and **MacOS**. - -[](https://twitter.com/linuxnetdata) -[]() +# netdata [](https://travis-ci.com/netdata/netdata) [](https://bestpractices.coreinfrastructure.org/projects/2231) [](https://www.gnu.org/licenses/gpl-3.0) []() + +[](https://codeclimate.com/github/netdata/netdata) [](https://www.codacy.com/app/netdata/netdata?utm_source=github.com&utm_medium=referral&utm_content=netdata/netdata&utm_campaign=Badge_Grade) [](https://lgtm.com/projects/g/netdata/netdata/context:cpp) [](https://lgtm.com/projects/g/netdata/netdata/context:javascript) [](https://lgtm.com/projects/g/netdata/netdata/context:python) --- -## User base -*Docker pulls*<br/> -[](https://hub.docker.com/r/netdata/netdata/) -[](https://hub.docker.com/r/firehol/netdata/) -[](https://hub.docker.com/r/titpetric/netdata/) +**Netdata** is **distributed, real-time, performance and health monitoring for systems and applications**. It is a highly optimized monitoring agent you install on all your systems and containers. -*Since May 16th 2016 (the date the [global public netdata registry](https://github.com/netdata/netdata/wiki/mynetdata-menu-item) was released):*<br/> -[](https://registry.my-netdata.io/#menu_netdata_submenu_registry) -[](https://registry.my-netdata.io/#menu_netdata_submenu_registry) -[](https://registry.my-netdata.io/#menu_netdata_submenu_registry) - -*in the last 24 hours:*<br/> -[](https://registry.my-netdata.io/#menu_netdata_submenu_registry) -[](https://registry.my-netdata.io/#menu_netdata_submenu_registry) -[](https://registry.my-netdata.io/#menu_netdata_submenu_registry) - ---- +Netdata provides **unparalleled insights**, **in real-time**, of everything happening on the systems it runs (including web servers, databases, applications), using **highly interactive web dashboards**. It can run autonomously, without any third party components, or it can be integrated to existing monitoring toolchains (Prometheus, Graphite, OpenTSDB, Kafka, Grafana, etc). -## News +_Netdata is **fast** and **efficient**, designed to permanently run on all systems (**physical** & **virtual** servers, **containers**, **IoT** devices), without disrupting their core function._ -`Sep 18, 2018` - **netdata has its own organization** +Netdata is **free, open-source software** and it currently runs on **Linux**, **FreeBSD**, and **MacOS**. -Netdata used to be a [firehol.org](https://firehol.org) project, accessible as `firehol/netdata`. + -Netdata now has its own github organization `netdata`, so all github URLs are now `netdata/netdata`. The old github URLs, repo clones, forks, etc redirect automatically to the new repo. +Netdata is in the [Cloud Native Computing Foundation (CNCF) landscape](https://landscape.cncf.io/grouping=no&sort=stars). +Check the [CNCF TOC Netdata presentation](https://docs.google.com/presentation/d/18C8bCTbtgKDWqPa57GXIjB2PbjjpjsUNkLtZEz6YK8s/edit?usp=sharing). --- - - -`Jun 16, 2018` - **netdata in CNCF** - -Netdata is now at the [Cloud Native Computing Foundation (CNCF) landscape](https://landscape.cncf.io/grouping=no&sort=stars). - -Read the [netdata presentation](https://docs.google.com/presentation/d/18C8bCTbtgKDWqPa57GXIjB2PbjjpjsUNkLtZEz6YK8s/edit?usp=sharing) we gave at CNCF TOC on Sep 18, 2018. - ---- - -`Mar 27th, 2018` - **[netdata v1.10.0 released!](https://github.com/netdata/netdata/releases)** - - - new web server, a lot faster and more secure - - updated all javascript libraries to their latest versions (fixed compatibility issues - now netdata chart can now be embedded on **Atlassian Confluence** pages and remain fully interactive!) - - new plugins: - - **BTRFS** (visualize BTRFS allocation with alarms) - - **bcache** (monitor hybrid setups HDD + SSD) - - **ceph** - - **nginx plus** - - **libreswan** (monitor the traffic of IPSEC tunnels) - - **traefik** - - **icecast** - - **ntpd** - - **httpcheck** (monitor any remote web server) - - **portcheck** (monitor any remote TCP port) - - **spring-boot** (monitor java spring-boot apps) - - **dnsdist** - - **Linux hugepages** - - improved plugins: - - **statsd** - - **web_log** - - **cgroups** for containers and VMs monitoring (netdata now supports **systemd-nspawn** and **kubernetes** - fixed security issue with `cgroup-network`) - - **Linux memory** - - **diskspace** - - **network interfaces** - - **postgres** - - **rabbitmq** - - **apps.plugin** (now it also tracks swap usage per process) - - **haproxy** - - **uptime** - - **ksm** (kernel memory debupper) - - **mdstat** (software raid) - - **elasticsearch** - - **apcupsd** - - **dhcpd** - - **fronius** - - **stiebeletron** - - new alarm notification methods - - **alerta** - - **IRC** (post on IRC channels) - - and dozens more improvements, enhancements, features and compatibility fixes - ---- - -## Features - -<p align="center"> -<img src="https://cloud.githubusercontent.com/assets/2662304/19168687/f6a567be-8c19-11e6-8561-ce8d589e8346.gif"/> -</p> - - - **Stunning interactive bootstrap dashboards**<br/> - mouse and touch friendly, in 2 themes: dark, light - - - **Amazingly fast**<br/> - responds to all queries in less than 0.5 ms per metric, - even on low-end hardware +People get **addicted to netdata**.<br/> +Once you use it on your systems, **there is no going back**! *You have been warned...* - - **Highly efficient**<br/> - collects thousands of metrics per server per second, - with just 1% CPU utilization of a single core, a few MB of RAM and no disk I/O at all + - - **Sophisticated alerting**<br/> - hundreds of alarms, **out of the box**!<br/> - supports dynamic thresholds, hysteresis, alarm templates, - multiple role-based notification methods (such as email, slack.com, flock.com, - pushover.net, pushbullet.com, telegram.org, twilio.com, messagebird.com, kavenegar.com) +[](https://twitter.com/intent/tweet?text=Netdata,%20real-time%20performance%20and%20health%20monitoring,%20done%20right!&url=https://my-netdata.io/&via=linuxnetdata&hashtags=netdata,monitoring) - - **Extensible**<br/> - you can monitor anything you can get a metric for, - using its Plugin API (anything can be a netdata plugin, - BASH, python, perl, node.js, java, Go, ruby, etc) - - **Embeddable**<br/> - it can run anywhere a Linux kernel runs (even IoT) - and its charts can be embedded on your web pages too +## Contents - - **Customizable**<br/> - custom dashboards can be built using simple HTML (no javascript necessary) +1. [How it looks](#how-it-looks) - have a quick look at it +2. [User base](#user-base) - who uses netdata? +3. [Quick Start](#quick-start) - try it now on your systems +4. [Why Netdata](#why-netdata) - why people love netdata, how it compares with other solutions +5. [News](#news) - latest news about netdata +6. [How it works](#how-it-works) - high level diagram of how netdata works +7. [infographic](#infographic) - everything about netdata, in a page +8. [Features](#features) - what features does it have +9. [Visualization](#visualization) - unique visualization features +10. [What does it monitor](#what-does-it-monitor) - which metrics it collects +11. [Documentation](#documentation) - read the docs +12. [Community](#community) - disucss with others and get support +13. [License](#license) - check the license of netdata - - **Zero configuration**<br/> - auto-detects everything, it can collect up to 5000 metrics - per server out of the box - - **Zero dependencies**<br/> - it is even its own web server, for its static web files and its web API +## How it looks - - **Zero maintenance**<br/> - you just run it, it does the rest +The following animated image, shows the top part of a typical netdata dashboard. - - **scales to infinity**<br/> - requiring minimal central resources + - - **several operating modes**<br/> - autonomous host monitoring, headless data collector, forwarding proxy, store and forward proxy, central multi-host monitoring, in all possible configurations. - Each node may have different metrics retention policy and run with or without health monitoring. +*A typical netdata dashboard, in 1:1 timing. Charts can be panned by dragging them, zoomed in/out with `SHIFT` + `mouse wheel`, an area can be selected for zoom-in with `SHIFT` + `mouse selection`. Netdata is highly interactive and **real-time**, optimized to get the work done!* - - **time-series back-ends supported**<br/> - can archive its metrics on `graphite`, `opentsdb`, `prometheus`, json document DBs, in the same or lower detail - (lower: to prevent it from congesting these servers due to the amount of data collected) +> *We have a few online demos to experience it live: [https://my-netdata.io](https://my-netdata.io)* - - ---- - -## What does it monitor? - -netdata collects several thousands of metrics per device. -All these metrics are collected and visualized in real-time. - -> _Almost all metrics are auto-detected, without any configuration._ - -This is a list of what it currently monitors: - -- **CPU**<br/> - usage, interrupts, softirqs, frequency, total and per core, CPU states - -- **Memory**<br/> - RAM, swap and kernel memory usage, KSM (Kernel Samepage Merging), NUMA - -- **Disks**<br/> - per disk: I/O, operations, backlog, utilization, space, software RAID (md) - -  - -- **Network interfaces**<br/> - per interface: bandwidth, packets, errors, drops - -  - -- **IPv4 networking**<br/> - bandwidth, packets, errors, fragments, - tcp: connections, packets, errors, handshake, - udp: packets, errors, - broadcast: bandwidth, packets, - multicast: bandwidth, packets - -- **IPv6 networking**<br/> - bandwidth, packets, errors, fragments, ECT, - udp: packets, errors, - udplite: packets, errors, - broadcast: bandwidth, - multicast: bandwidth, packets, - icmp: messages, errors, echos, router, neighbor, MLDv2, group membership, - break down by type - -- **Interprocess Communication - IPC**<br/> - such as semaphores and semaphores arrays - -- **netfilter / iptables Linux firewall**<br/> - connections, connection tracker events, errors +## User base -- **Linux DDoS protection**<br/> - SYNPROXY metrics +Netdata is used by hundreds of thousands of users all over the world. +Check our [GitHub watchers list](https://github.com/netdata/netdata/watchers). +You will find people working for **Amazon**, **Atos**, **Baidu**, **Cisco Systems**, **Citrix**, **Deutsche Telekom**, **DigitalOcean**, +**Elastic**, **EPAM Systems**, **Ericsson**, **Google**, **Groupon**, **Hortonworks**, **HP**, **Huawei**, +**IBM**, **Microsoft**, **NewRelic**, **Nvidia**, **Red Hat**, **SAP**, **Selectel**, **TicketMaster**, +**Vimeo**, and many more! + +### Docker pulls +We provide docker images for the most common architectures. These are statistics reported by docker hub: + +[](https://hub.docker.com/r/netdata/netdata/) [](https://hub.docker.com/r/firehol/netdata/) [](https://hub.docker.com/r/titpetric/netdata/) + +### Registry +When you install multiple netdata, they are integrated into **one distributed application**, via a [netdata registry](registry/#netdata-registry). This is a web browser feature and it allows us to count the number of unique users and unique netdata servers installed. The following information comes from the global public netdata registry we run: + +[](https://registry.my-netdata.io/#menu_netdata_submenu_registry) [](https://registry.my-netdata.io/#menu_netdata_submenu_registry) [](https://registry.my-netdata.io/#menu_netdata_submenu_registry) + +*in the last 24 hours:*<br/> [](https://registry.my-netdata.io/#menu_netdata_submenu_registry) [](https://registry.my-netdata.io/#menu_netdata_submenu_registry) [](https://registry.my-netdata.io/#menu_netdata_submenu_registry) -- **fping** latencies</br> - for any number of hosts, showing latency, packets and packet loss +## Quick Start -  +You can quickly install netdata on a Linux box (physical, virtual, container, IoT) with the following command: +```sh +# make sure you run `bash` for your shell +bash + +# install netdata, directly from github sources +bash <(curl -Ss https://my-netdata.io/kickstart.sh) +``` +  -- **Processes**<br/> - running, blocked, forks, active +The above command will: -- **Entropy**<br/> - random numbers pool, using in cryptography +1. install any required packages on your system (it will ask you to confirm before doing so), +2. download netdata source to `/usr/src/netdata.git` +3. compile it, install it and start it + +More installation methods and additional options can be found at the [installation page](installer/#installation). -- **NFS file servers and clients**<br/> - NFS v2, v3, v4: I/O, cache, read ahead, RPC calls +To try netdata in a docker container, run this: -- **Network QoS**<br/> - the only tool that visualizes network `tc` classes in realtime +``` +docker run -d --name=netdata \ + -p 19999:19999 \ + -v /proc:/host/proc:ro \ + -v /sys:/host/sys:ro \ + -v /var/run/docker.sock:/var/run/docker.sock:ro \ + --cap-add SYS_PTRACE \ + --security-opt apparmor=unconfined \ + netdata/netdata +``` -  +For more information about running netdata in docker, check the [docker installation page](docker/). -- **Linux Control Groups**<br/> - containers: systemd, lxc, docker + -- **Applications**<br/> - by grouping the process tree and reporting CPU, memory, disk reads, - disk writes, swap, threads, pipes, sockets - per group +## Why Netdata -  +Netdata has a quite different approach to monitoring. -- **Users and User Groups resource usage**<br/> - by summarizing the process tree per user and group, - reporting: CPU, memory, disk reads, disk writes, swap, threads, pipes, sockets +Netdata is a monitoring agent you install on all your systems. It is: -- **Apache and lighttpd web servers**<br/> - `mod-status` (v2.2, v2.4) and cache log statistics, for multiple servers +- a **metrics collector** - for system and application metrics (including web servers, databases, containers, etc) +- a **time-series database** - all stored in memory (does not touch the disks while it runs) +- a **metrics visualizer** - super fast, interactive, modern, optimized for anomaly detection +- an **alarms notification engine** - an advanced watchdog for detecting performance and availability issues -- **Nginx web servers**<br/> - `stub-status`, for multiple servers +All the above, are packaged together in a very flexible, extremely modular, distributed application. -- **Tomcat**<br/> - accesses, threads, free memory, volume +This is how netdata compares to other monitoring solutions: -- **web server log files**<br/> - extracting in real-time, web server performance metrics and applying several health checks +netdata|others (open-source and commercial) +:---:|:---: +**High resolution metrics** (1s granularity)|Low resolution metrics (10s granularity at best) +Monitors everything, **thousands of metrics per node**|Monitor just a few metrics +UI is super fast, optimized for **anomaly detection**|UI is good for just an abstract view +**Meaningful presentation**, to help you understand the metrics|You have to know the metrics before you start +Install and get results **immediately**|Long preparation is required to get any useful results +Use it for **troubleshooting** performance problems|Use them to get *statistics of past performance* +**Kills the console** for tracing performance issues|The console is always required for troubleshooting +Requires **zero dedicated resources**|Require large dedicated resources -- **mySQL databases**<br/> - multiple servers, each showing: bandwidth, queries/s, handlers, locks, issues, - tmp operations, connections, binlog metrics, threads, innodb metrics, and more +Netdata is **open-source**, **free**, super **fast**, very **easy**, completely **open**, extremely **efficient**, +**flexible** and integrate-able. -- **Postgres databases**<br/> - multiple servers, each showing: per database statistics (connections, tuples - read - written - returned, transactions, locks), backend processes, indexes, - tables, write ahead, background writer and more +It has been designed by **SysAdmins**, **DevOps** and **Developers** for troubleshooting performance problems, +not just visualize metrics. -- **Redis databases**<br/> - multiple servers, each showing: operations, hit rate, memory, keys, clients, slaves +## News + +`Nov 6th, 2018` - **[netdata v1.11.0 released!](https://github.com/netdata/netdata/releases)** + + - New query engine, supporting statistical functions. + - Fixed security issues identified by Red4Sec.com and Synacktiv. + - New Data Collection Modules: [`rethinkdbs`](collectors/python.d.plugin/rethinkdbs/), [`proxysql`](collectors/python.d.plugin/proxysql/), [`litespeed`](collectors/python.d.plugin/litespeed/), [`uwsgi`](collectors/python.d.plugin/uwsgi/), [`unbound`](collectors/python.d.plugin/unbound/), [`powerdns`](collectors/python.d.plugin/powerdns/), [`dockerd`](collectors/python.d.plugin/dockerd/), [`puppet`](collectors/python.d.plugin/puppet/), [`logind`](collectors/python.d.plugin/logind/), [`adaptec_raid`](collectors/python.d.plugin/adaptec_raid/), [`megacli`](collectors/python.d.plugin/megacli/), [`spigotmc`](collectors/python.d.plugin/spigotmc/), [`boinc`](collectors/python.d.plugin/boinc/), [`w1sensor`](collectors/python.d.plugin/w1sensor/), [`monit`](collectors/python.d.plugin/monit/), [`linux_power_supplies`](collectors/python.d.plugin/linux_power_supply/). + - Improved Data Collection Modules: [`statsd.plugin`](collectors/statsd.plugin/), [`apps.plugin`](collectors/apps.plugin/), [`freeipmi.plugin`](collectors/freeipmi.plugin/), [`proc.plugin`](collectors/proc.plugin/), [`diskspace.plugin`](collectors/diskspace.plugin/), [`freebsd.plugin`](collectors/freebsd.plugin/), [`python.d.plugin`](collectors/python.d.plugin/), [`web_log`](collectors/python.d.plugin/web_log/), [`nginx_plus`](collectors/python.d.plugin/nginx_plus/), [`ipfs`](collectors/python.d.plugin/ipfs/), [`fail2ban`](collectors/python.d.plugin/fail2ban/), [`ceph`](collectors/python.d.plugin/ceph/), [`elasticsearch`](collectors/python.d.plugin/elasticsearch/), [`redis`](collectors/python.d.plugin/redis/), + [`beanstalk`](collectors/python.d.plugin/beanstalk/), [`mysql`](collectors/python.d.plugin/mysql/), [`varnish`](collectors/python.d.plugin/varnish/), [`couchdb`](collectors/python.d.plugin/couchdb/), [`phpfpm`](collectors/python.d.plugin/phpfpm/), [`apache`](collectors/python.d.plugin/apache/), [`icecast`](collectors/python.d.plugin/icecast/), [`mongodb`](collectors/python.d.plugin/mongodb/), [`postgress`](collectors/python.d.plugin/postgres/), [`mdstat`](collectors/python.d.plugin/mdstat/), [`openvpn_log`](collectors/python.d.plugin/ovpn_status_log/), [`snmp`](collectors/node.d.plugin/snmp/), [`nut`](collectors/charts.d.plugin/nut/). + + - Added alarms for detecting abnormally high load average, `TCP` `SYN` and `TCP` accept queue overflows, network interfaces congestion and alarms for `bcache`, `mdstat`, `apcupsd`, `mysql`. + - system alarms are now enabled on FreeBSD. + - New notification methods: **[rocket.chat](health/notifications/rocketchat/)**, **Microsoft Teams**, **[syslog](health/notifications/syslog/)**, **fleep.io**, **[Amazon SNS](health/notifications/awssns/)**. + + - and dozens more improvements, enhancements, features and compatibility fixes + +--- + +`Sep 18, 2018` - **netdata has its own organization** + +Netdata used to be a [firehol.org](https://firehol.org) project, accessible as `firehol/netdata`. + +Netdata now has its own github organization `netdata`, so all github URLs are now `netdata/netdata`. The old github URLs, repo clones, forks, etc redirect automatically to the new repo. + +## How it works -- **couchdb**<br/> - reads/writes, request methods, status codes, tasks, replication, per-db, etc +Netdata is a highly efficient, highly modular, metrics management engine. Its lockless design makes it ideal for concurrent operations on the metrics. + +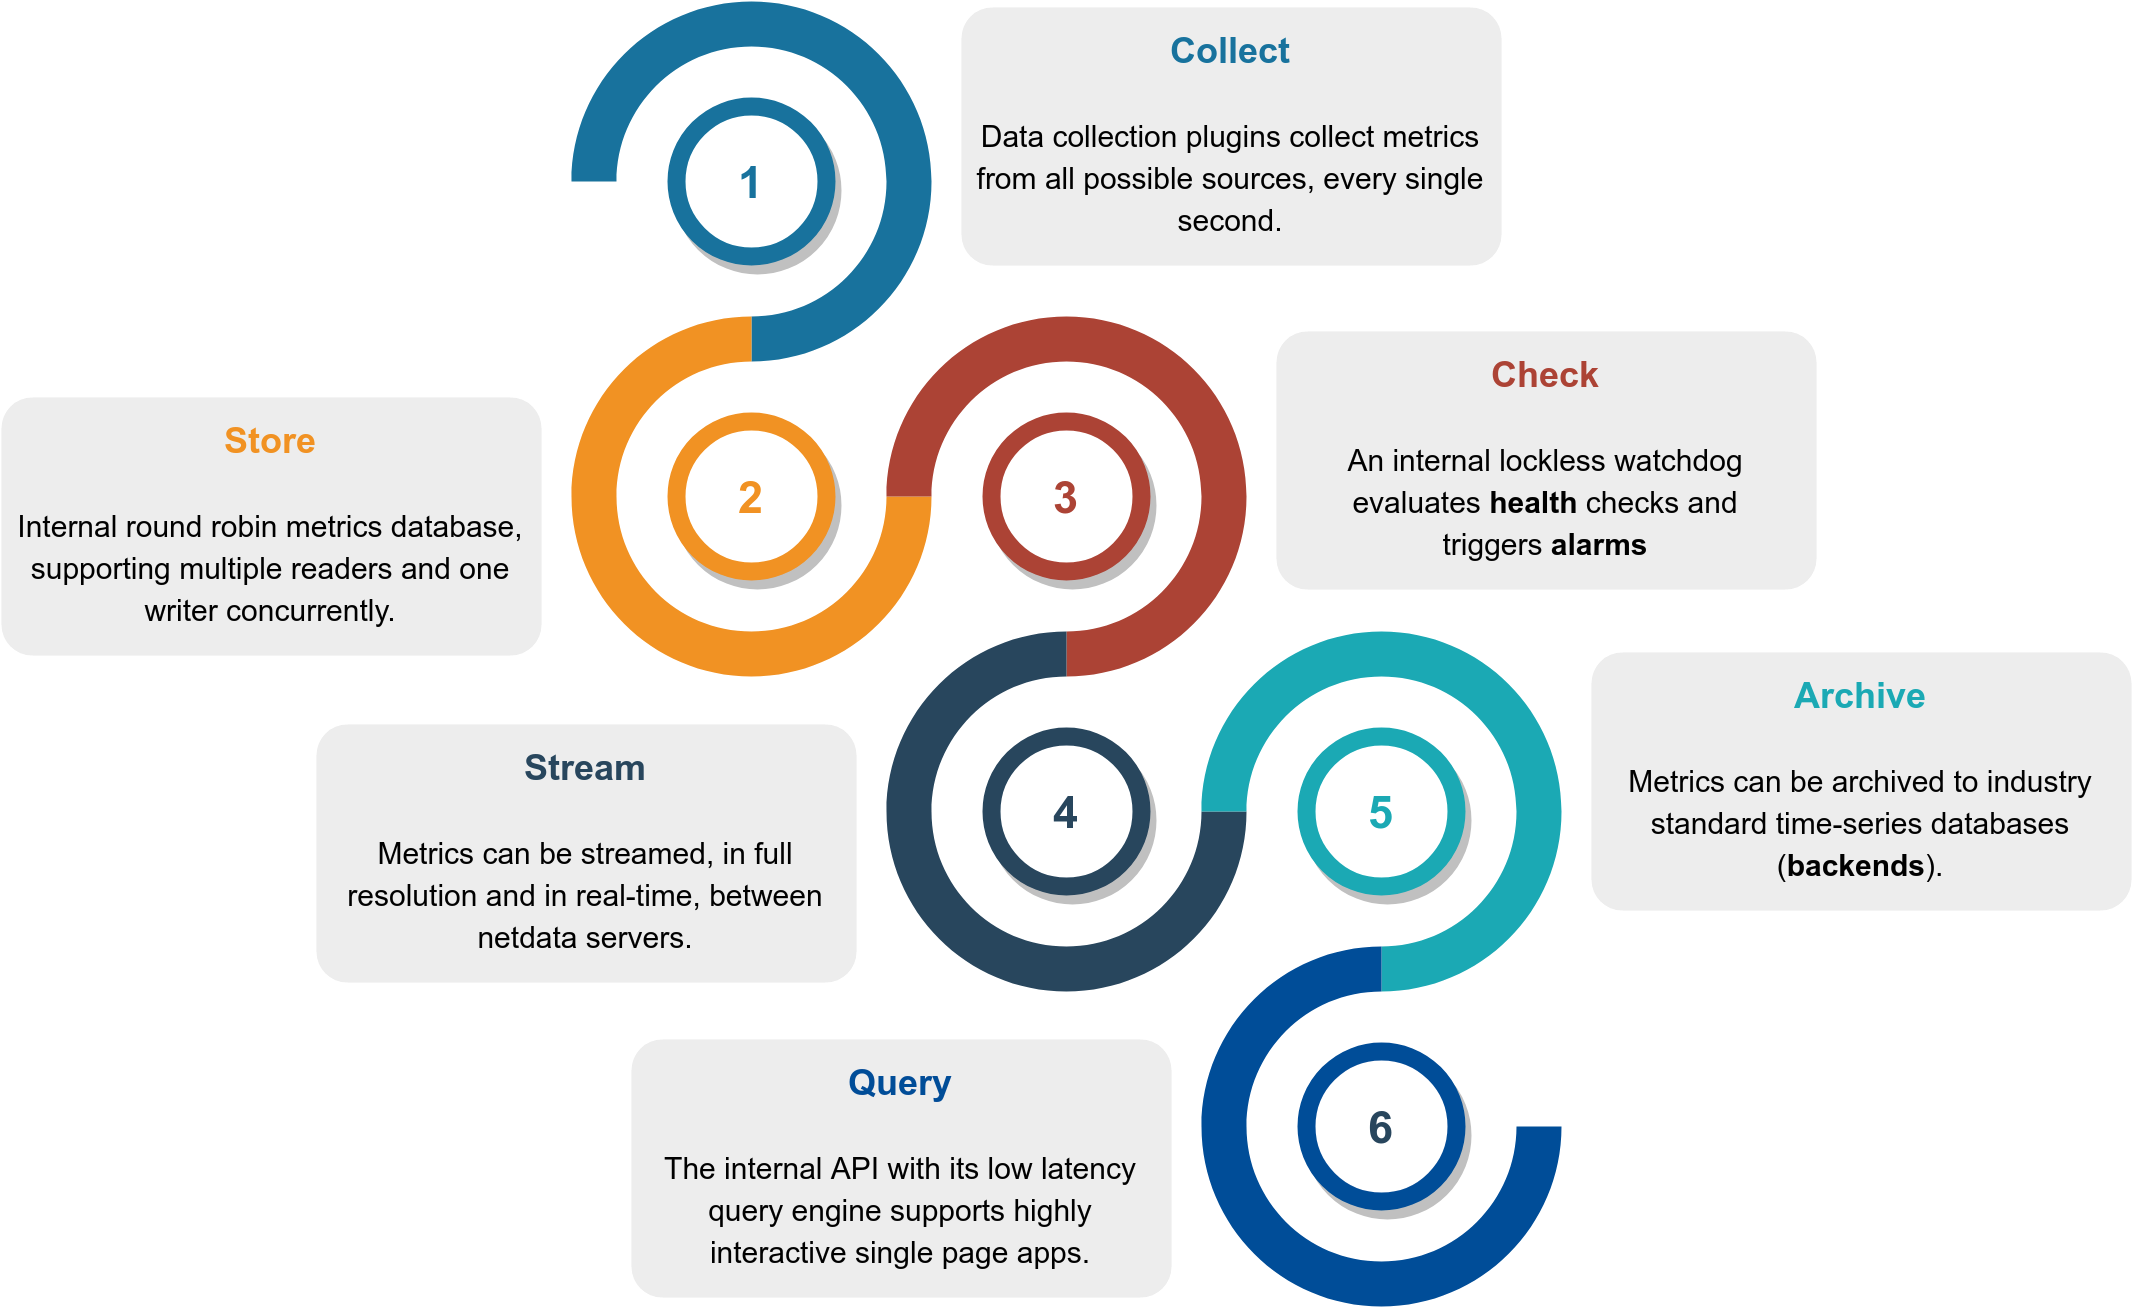 -- **mongodb**<br/> - operations, clients, transactions, cursors, connections, asserts, locks, etc +This is how it works: + +Function|Description|Documentation +:---:|:---|:---: +**Collect**|Multiple independent data collection workers are collecting metrics from their sources using the optimal protocol for each application and push the metrics to the database. Each data collection worker has lockless write access to the metrics it collects.|[`collectors`](collectors/#data-collection-plugins) +**Store**|Metrics are stored in RAM in a round robin database (ring buffer), using a custom made floating point number for minimal footprint.|[`database`](database/#netdata-database) +**Check**|A lockless independent watchdog is evaluating **health checks** on the collected metrics, triggers alarms, maintains a health transaction log and dispatches alarm notifications.|[`health`](health/#health-monitoring) +**Stream**|An lockless independent worker is streaming metrics, in full detail and in real-time, to remote netdata servers, as soon as they are collected.|[`streaming`](streaming/#metrics-streaming) +**Archive**|A lockless independent worker is down-sampling the metrics and pushes them to **backend** time-series databases.|[`backends`](backends/) +**Query**|Multiple independent workers are attached to the [internal web server](web/server/#netdata-web-server), servicing API requests, including [data queries](web/api/queries/#database-queries).|[`web/api`](web/api/#api) + +The result is a highly efficient, low latency system, supporting multiple readers and one writer on each metric. + +## Infographic + +This is a high level overview of netdata feature set and architecture. +Click it to to interact with it (it has direct links to documentation). + +[](https://my-netdata.io/infographic.html) -- **memcached databases**<br/> - multiple servers, each showing: bandwidth, connections, items -- **elasticsearch**<br/> - search and index performance, latency, timings, cluster statistics, threads statistics, etc +## Features -- **ISC Bind name servers**<br/> - multiple servers, each showing: clients, requests, queries, updates, failures and several per view metrics + -- **NSD name servers**<br/> - queries, zones, protocols, query types, transfers, etc. +This is what you should expect from Netdata: -- **PowerDNS**</br> - queries, answers, cache, latency, etc. +### General +- **1s granularity** - the highest possible resolution for all metrics. +- **Unlimited metrics** - collects all the available metrics, the more the better. +- **1% CPU utilization of a single core** - it is super fast, unbelievably optimized. +- **A few MB of RAM** - by default it uses 25MB RAM. [You size it](database). +- **Zero disk I/O** - while it runs, it does not load or save anything (except `error` and `access` logs). +- **Zero configuration** - auto-detects everything, it can collect up to 10000 metrics per server out of the box. +- **Zero maintenance** - You just run it, it does the rest. +- **Zero dependencies** - it is even its own web server, for its static web files and its web API (though its plugins may require additional libraries, depending on the applications monitored). +- **Scales to infinity** - you can install it on all your servers, containers, VMs and IoTs. Metrics are not centralized by default, so there is no limit. +- **Several operating modes** - Autonomous host monitoring (the default), headless data collector, forwarding proxy, store and forward proxy, central multi-host monitoring, in all possible configurations. Each node may have different metrics retention policy and run with or without health monitoring. -- **Postfix email servers**<br/> - message queue (entries, size) +### Health Monitoring & Alarms +- **Sophisticated alerting** - comes with hundreds of alarms, **out of the box**! Supports dynamic thresholds, hysteresis, alarm templates, multiple role-based notification methods. +- **Notifications**: [alerta.io](health/notifications/alerta/), [amazon sns](health/notifications/awssns/), [discordapp.com](health/notifications/discord/), [email](health/notifications/email/), [flock.com](health/notifications/flock/), [irs](health/notifications/irc/), [kavenegar.com](health/notifications/kavenegar/), [messagebird.com](health/notifications/messagebird/), [pagerduty.com](health/notifications/pagerduty/), [pushbullet.com](health/notifications/pushbullet/), [pushover.net](health/notifications/pushover/), [rocket.chat](health/notifications/rocketchat/), [slack.com](health/notifications/slack/), [syslog](health/notifications/syslog/), [telegram.org](health/notifications/telegram/), [twilio.com](health/notifications/twilio/), [web](health/notifications/web/). -- **exim email servers**<br/> - message queue (emails queued) +### Integrations +- **time-series dbs** - can archive its metrics to `graphite`, `opentsdb`, `prometheus`, json document DBs, in the same or lower resolution (lower: to prevent it from congesting these servers due to the amount of data collected). -- **Dovecot** POP3/IMAP servers<br/> +## Visualization -- **ISC dhcpd**<br/> - pools utilization, leases, etc. +- **Stunning interactive dashboards** - mouse, touchpad and touch-screen friendly in 2 themes: `slate` (dark) and `white`. +- **Amazingly fast visualization** - responds to all queries in less than 1 ms per metric, even on low-end hardware. +- **Visual anomaly detection** - the dashboards are optimized for detecting anomalies visually. +- **Embeddable** - its charts can be embedded on your web pages, wikis and blogs. You can even use [Atlassian's Confluence as a monitoring dashboard](web/gui/confluence/). +- **Customizable** - custom dashboards can be built using simple HTML (no javascript necessary). -- **IPFS**<br/> - bandwidth, peers +### Positive and negative values -- **Squid proxy servers**<br/> - multiple servers, each showing: clients bandwidth and requests, servers bandwidth and requests +To improve clarity on charts, netdata dashboards present **positive** values for metrics representing `read`, `input`, `inbound`, `received` and **negative** values for metrics representing `write`, `output`, `outbound`, `sent`. -- **HAproxy**<br/> - bandwidth, sessions, backends, etc + -- **varnish**<br/> - threads, sessions, hits, objects, backends, etc +*Netdata charts showing the bandwidth and packets of a network interface. `received` is positive and `sent` is negative.* -- **OpenVPN**<br/> - status per tunnel +### Autoscaled y-axis -- **Hardware sensors**<br/> - `lm_sensors` and `IPMI`: temperature, voltage, fans, power, humidity +Netdata charts automatically zoom vertically, to visualize the variation of each metric within the visible time-frame. -- **NUT and APC UPSes**<br/> - load, charge, battery voltage, temperature, utility metrics, output metrics + -- **PHP-FPM**<br/> - multiple instances, each reporting connections, requests, performance +*A zero based `stacked` chart, automatically switches to an auto-scaled `area` chart when a single dimension is selected.* -- **hddtemp**<br/> - disk temperatures +### Charts are synchronized -- **smartd**<br/> - disk S.M.A.R.T. values +Charts on netdata dashboards are synchronized to each other. There is no master chart. Any chart can be panned or zoomed at any time, and all other charts will follow. -- **SNMP devices**<br/> - can be monitored too (although you will need to configure these) + -- **chrony**</br> - frequencies, offsets, delays, etc. +*Charts are panned by dragging them with the mouse. Charts can be zoomed in/out with`SHIFT` + `mouse wheel` while the mouse pointer is over a chart.* -- **beanstalkd**</br> - global and per tube monitoring +> The visible time-frame (pan and zoom) is propagated from netdata server to netdata server, when navigating via the [`my-netdata` menu](registry#netdata-registry). -- **statsd**<br/> - [netdata is a fully featured statsd server](https://github.com/netdata/netdata/wiki/statsd) -- **ceph**<br/> - OSD usage, Pool usage, number of objects, etc. +### Highlighted time-frame -And you can extend it, by writing plugins that collect data from any source, using any computer language. +To improve visual anomaly detection across charts, the user can highlight a time-frame (by pressing `ALT` + `mouse selection`) on all charts. ---- + -## netdata infographic +*A highlighted time-frame can be given by pressing `ALT` + `mouse selection` on any chart. Netdata will highlight the same range on all charts.* -This is a high level overview of netdata feature set and architecture. -Click it to to interact with it (it has direct links to documentation). +> Highlighted ranges are propagated from netdata server to netdata server, when navigating via the [`my-netdata` menu](registry#netdata-registry). -[](https://my-netdata.io/infographic.html) ---- - -## Installation - -Use our **[automatic installer](https://github.com/netdata/netdata/wiki/Installation)** to build and install it on your system. +## What does it monitor + +Netdata data collection is **extensible** - you can monitor anything you can get a metric for. +Its [Plugin API](collectors/plugins.d/) supports all programing languages (anything can be a netdata plugin, BASH, python, perl, node.js, java, Go, ruby, etc). + +- For better performance, most system related plugins (cpu, memory, disks, filesystems, networking, etc) have been written in `C`. +- For faster development and easier contributions, most application related plugins (databases, web servers, etc) have been written in `python`. + +#### APM (Application Performance Monitoring) +- **[statsd](collectors/statsd.plugin/)** - netdata is a fully featured statsd server. +- **[Go expvar](collectors/python.d.plugin/go_expvar/)** - collects metrics exposed by applications written in the Go programming language using the expvar package. +- **[Spring Boot](collectors/python.d.plugin/springboot/)** - monitors running Java Spring Boot applications that expose their metrics with the use of the Spring Boot Actuator included in Spring Boot library. +- **[uWSGI](collectors/python.d.plugin/uwsgi/)** - collects performance metrics from uWSGI applications. + +#### System Resources +- **[CPU Utilization](collectors/proc.plugin/)** - total and per core CPU usage. +- **[Interrupts](collectors/proc.plugin/)** - total and per core CPU interrupts. +- **[SoftIRQs](collectors/proc.plugin/)** - total and per core SoftIRQs. +- **[SoftNet](collectors/proc.plugin/)** - total and per core SoftIRQs related to network activity. +- **[CPU Throttling](collectors/proc.plugin/)** - collects per core CPU throttling. +- **[CPU Frequency](collectors/python.d.plugin/couchdb/)** - collects the current CPU frequency. +- **[CPU Idle](collectors/python.d.plugin/cpuidle/)** - collects the time spent per processor state. +- **[IdleJitter](collectors/idlejitter.plugin/)** - measures CPU latency. +- **[Entropy](collectors/proc.plugin/)** - random numbers pool, using in cryptography. +- **[Interprocess Communication - IPC](collectors/proc.plugin/)** - such as semaphores and semaphores arrays. + +#### Memory +- **[ram](collectors/proc.plugin/)** - collects info about RAM usage. +- **[swap](collectors/proc.plugin/)** - collects info about swap memory usage. +- **[available memory](collectors/proc.plugin/)** - collects the amount of RAM available for userspace processes. +- **[committed memory](collectors/proc.plugin/)** - collects the amount of RAM committed to userspace processes. +- **[Page Faults](collectors/proc.plugin/)** - collects the system page faults (major and minor). +- **[writeback memory](collectors/proc.plugin/)** - collects the system dirty memory and writeback activity. +- **[huge pages](collectors/proc.plugin/)** - collects the amount of RAM used for huge pages. +- **[KSM](collectors/proc.plugin/)** - collects info about Kernel Same Merging (memory dedupper). +- **[Numa](collectors/proc.plugin/)** - collects Numa info on systems that support it. +- **[slab](collectors/proc.plugin/)** - collects info about the Linux kernel memory usage. + +#### Disks +- **[block devices](collectors/proc.plugin/)** - per disk: I/O, operations, backlog, utilization, space, etc. +- **[BCACHE](collectors/proc.plugin/)** - detailed performance of SSD caching devices. +- **[DiskSpace](collectors/proc.plugin/)** - monitors disk space usage. +- **[mdstat](collectors/python.d.plugin/mdstat/)** - software RAID. +- **[hddtemp](collectors/python.d.plugin/hddtemp/)** - disk temperatures. +- **[smartd](collectors/python.d.plugin/smartd_log/)** - disk S.M.A.R.T. values. +- **[device mapper](collectors/proc.plugin/)** - naming disks. +- **[Veritas Volume Manager](collectors/proc.plugin/)** - naming disks. +- **[megacli](collectors/python.d.plugin/megacli/)** - adapter, physical drives and battery stats. +- **[adaptec_raid](collectors/python.d.plugin/adaptec_raid/)** - logical and physical devices health metrics. + +#### Filesystems +- **[BTRFS](collectors/proc.plugin/)** - detailed disk space allocation and usage. +- **[Ceph](collectors/python.d.plugin/ceph/)** - OSD usage, Pool usage, number of objects, etc. +- **[NFS file servers and clients](collectors/proc.plugin/)** - NFS v2, v3, v4: I/O, cache, read ahead, RPC calls +- **[Samba](collectors/python.d.plugin/samba/)** - performance metrics of Samba SMB2 file sharing. +- **[ZFS](collectors/proc.plugin/)** - detailed performance and resource usage. + +#### Networking +- **[Network Stack](collectors/proc.plugin/)** - everything about the networking stack (both IPv4 and IPv6 for all protocols: TCP, UDP, SCTP, UDPLite, ICMP, Multicast, Broadcast, etc), and all network interfaces (per interface: bandwidth, packets, errors, drops). +- **[Netfilter](collectors/proc.plugin/)** - everything about the netfilter connection tracker. +- **[SynProxy](collectors/proc.plugin/)** - collects performance data about the linux SYNPROXY (DDoS). +- **[NFacct](collectors/nfacct.plugin/)** - collects accounting data from iptables. +- **[Network QoS](collectors/tc.plugin/)** - the only tool that visualizes network `tc` classes in real-time +- **[FPing](collectors/fping.plugin/)** - to measure latency and packet loss between any number of hosts. +- **[ISC dhcpd](collectors/python.d.plugin/isc_dhcpd/)** - pools utilization, leases, etc. +- **[AP](collectors/charts.d.plugin/ap/)** - collects Linux access point performance data (`hostapd`). +- **[SNMP](collectors/node.d.plugin/snmp/)** - SNMP devices can be monitored too (although you will need to configure these). +- **[port_check](collectors/python.d.plugin/portcheck/)** - checks TCP ports for availability and response time. + +#### Virtual Private Networks +- **[OpenVPN](collectors/python.d.plugin/ovpn_status_log/)** - collects status per tunnel. +- **[LibreSwan](collectors/charts.d.plugin/libreswan/)** - collects metrics per IPSEC tunnel. +- **[Tor](collectors/python.d.plugin/tor/)** - collects Tor traffic statistics. + +#### Processes +- **[System Processes](collectors/proc.plugin/)** - running, blocked, forks, active. +- **[Applications](collectors/apps.plugin/)** - by grouping the process tree and reporting CPU, memory, disk reads, disk writes, swap, threads, pipes, sockets - per process group. +- **[systemd](collectors/cgroups.plugin/)** - monitors systemd services using CGROUPS. + +#### Users +- **[Users and User Groups resource usage](collectors/apps.plugin/)** - by summarizing the process tree per user and group, reporting: CPU, memory, disk reads, disk writes, swap, threads, pipes, sockets +- **[logind](collectors/python.d.plugin/logind/)** - collects sessions, users and seats connected. + +#### Containers and VMs +- **[Containers](collectors/cgroups.plugin/)** - collects resource usage for all kinds of containers, using CGROUPS (systemd-nspawn, lxc, lxd, docker, kubernetes, etc). +- **[libvirt VMs](collectors/cgroups.plugin/)** - collects resource usage for all kinds of VMs, using CGROUPS. +- **[dockerd](collectors/python.d.plugin/dockerd/)** - collects docker health metrics. + +#### Web Servers +- **[Apache and lighttpd](collectors/python.d.plugin/apache/)** - `mod-status` (v2.2, v2.4) and cache log statistics, for multiple servers. +- **[IPFS](collectors/python.d.plugin/ipfs/)** - bandwidth, peers. +- **[LiteSpeed](collectors/python.d.plugin/litespeed/)** - reads the litespeed rtreport files to collect metrics. +- **[Nginx](collectors/python.d.plugin/nginx/)** - `stub-status`, for multiple servers. +- **[Nginx+](collectors/python.d.plugin/nginx_plus/)** - connects to multiple nginx_plus servers (local or remote) to collect real-time performance metrics. +- **[PHP-FPM](collectors/python.d.plugin/phpfpm/)** - multiple instances, each reporting connections, requests, performance, etc. +- **[Tomcat](collectors/python.d.plugin/tomcat/)** - accesses, threads, free memory, volume, etc. +- **[web server `access.log` files](collectors/python.d.plugin/web_log/)** - extracting in real-time, web server and proxy performance metrics and applying several health checks, etc. +- **[HTTP check](collectors/python.d.plugin/httpcheck/)** - checks one or more web servers for HTTP status code and returned content. + +#### Proxies, Balancers, Accelerators +- **[HAproxy](collectors/python.d.plugin/haproxy/)** - bandwidth, sessions, backends, etc. +- **[Squid](collectors/python.d.plugin/squid/)** - multiple servers, each showing: clients bandwidth and requests, servers bandwidth and requests. +- **[Traefik](collectors/python.d.plugin/traefik/)** - connects to multiple traefik instances (local or remote) to collect API metrics (response status code, response time, average response time and server uptime). +- **[Varnish](collectors/python.d.plugin/varnish/)** - threads, sessions, hits, objects, backends, etc. +- **[IPVS](collectors/proc.plugin/)** - collects metrics from the Linux IPVS load balancer. + +#### Database Servers +- **[CouchDB](collectors/python.d.plugin/couchdb/)** - reads/writes, request methods, status codes, tasks, replication, per-db, etc. +- **[MemCached](collectors/python.d.plugin/memcached/)** - multiple servers, each showing: bandwidth, connections, items, etc. +- **[MongoDB](collectors/python.d.plugin/mongodb/)** - operations, clients, transactions, cursors, connections, asserts, locks, etc. +- **[MySQL and mariadb](collectors/python.d.plugin/mysql/)** - multiple servers, each showing: bandwidth, queries/s, handlers, locks, issues, tmp operations, connections, binlog metrics, threads, innodb metrics, and more. +- **[PostgreSQL](collectors/python.d.plugin/postgres/)** - multiple servers, each showing: per database statistics (connections, tuples read - written - returned, transactions, locks), backend processes, indexes, tables, write ahead, background writer and more. +- **[Proxy SQL](collectors/python.d.plugin/proxysql/)** - collects Proxy SQL backend and frontend performance metrics. +- **[Redis](collectors/python.d.plugin/redis/)** - multiple servers, each showing: operations, hit rate, memory, keys, clients, slaves. +- **[RethinkDB](collectors/python.d.plugin/rethinkdbs/)** - connects to multiple rethinkdb servers (local or remote) to collect real-time metrics. + +#### Message Brokers +- **[beanstalkd](collectors/python.d.plugin/beanstalk/)** - global and per tube monitoring. +- **[RabbitMQ](collectors/python.d.plugin/rabbitmq/)** - performance and health metrics. + +#### Search and Indexing +- **[ElasticSearch](collectors/python.d.plugin/elasticsearch/)** - search and index performance, latency, timings, cluster statistics, threads statistics, etc. + +#### DNS Servers +- **[bind_rndc](collectors/python.d.plugin/bind_rndc/)** - parses `named.stats` dump file to collect real-time performance metrics. All versions of bind after 9.6 are supported. +- **[dnsdist](collectors/python.d.plugin/dnsdist/)** - performance and health metrics. +- **[ISC Bind (named)](collectors/node.d.plugin/named/)** - multiple servers, each showing: clients, requests, queries, updates, failures and several per view metrics. All versions of bind after 9.9.10 are supported. +- **[NSD](collectors/python.d.plugin/nsd/)** - queries, zones, protocols, query types, transfers, etc. +- **[PowerDNS](collectors/python.d.plugin/powerdns/)** - queries, answers, cache, latency, etc. +- **[unbound](collectors/python.d.plugin/unbound/)** - performance and resource usage metrics. +- **[dns_query_time](collectors/python.d.plugin/dns_query_time/)** - DNS query time statistics. + +#### Time Servers +- **[chrony](collectors/python.d.plugin/chrony/)** - uses the `chronyc` command to collect chrony statistics (Frequency, Last offset, RMS offset, Residual freq, Root delay, Root dispersion, Skew, System time). +- **[ntpd](collectors/python.d.plugin/ntpd/)** - connects to multiple ntpd servers (local or remote) to provide statistics of system variables and optional also peer variables. + +#### Mail Servers +- **[Dovecot](collectors/python.d.plugin/dovecot/)** - POP3/IMAP servers. +- **[Exim](collectors/python.d.plugin/exim/)** - message queue (emails queued). +- **[Postfix](collectors/python.d.plugin/postfix/)** - message queue (entries, size). + +#### Hardware Sensors +- **[IPMI](collectors/freeipmi.plugin/)** - enterprise hardware sensors and events. +- **[lm-sensors](collectors/python.d.plugin/sensors/)** - temperature, voltage, fans, power, humidity, etc. +- **[Nvidia](collectors/python.d.plugin/nvidia_smi/)** - collects information for Nvidia GPUs. +- **[RPi](collectors/charts.d.plugin/sensors/)** - Raspberry Pi temperature sensors. +- **[w1sensor](collectors/python.d.plugin/w1sensor/)** - collects data from connected 1-Wire sensors. + +#### UPSes +- **[apcupsd](collectors/charts.d.plugin/apcupsd/)** - load, charge, battery voltage, temperature, utility metrics, output metrics +- **[NUT](collectors/charts.d.plugin/nut/)** - load, charge, battery voltage, temperature, utility metrics, output metrics +- **[Linux Power Supply](collectors/python.d.plugin/linux_power_supply/)** - collects metrics reported by power supply drivers on Linux. + +#### Social Sharing Servers +- **[RetroShare](collectors/python.d.plugin/retroshare/)** - connects to multiple retroshare servers (local or remote) to collect real-time performance metrics. + +#### Security +- **[Fail2Ban](collectors/python.d.plugin/fail2ban/)** - monitors the fail2ban log file to check all bans for all active jails. + +#### Authentication, Authorization, Accounting (AAA, RADIUS, LDAP) Servers +- **[FreeRadius](collectors/python.d.plugin/freeradius/)** - uses the `radclient` command to provide freeradius statistics (authentication, accounting, proxy-authentication, proxy-accounting). + +#### Telephony Servers +- **[opensips](collectors/charts.d.plugin/opensips/)** - connects to an opensips server (localhost only) to collect real-time performance metrics. + +#### Household Appliances +- **[SMA webbox](collectors/node.d.plugin/sma_webbox/)** - connects to multiple remote SMA webboxes to collect real-time performance metrics of the photovoltaic (solar) power generation. +- **[Fronius](collectors/node.d.plugin/fronius/)** - connects to multiple remote Fronius Symo servers to collect real-time performance metrics of the photovoltaic (solar) power generation. +- **[StiebelEltron](collectors/node.d.plugin/stiebeleltron/)** - collects the temperatures and other metrics from your Stiebel Eltron heating system using their Internet Service Gateway (ISG web). + +#### Game Servers +- **[SpigotMC](collectors/python.d.plugin/spigotmc/)** - monitors Spigot Minecraft server ticks per second and number of online players using the Minecraft remote console. + +#### Distributed Computing +- **[BOINC](collectors/python.d.plugin/boinc/)** - monitors task states for local and remote BOINC client software using the remote GUI RPC interface. Also provides alarms for a handful of error conditions. + +#### Media Streaming Servers +- **[IceCast](collectors/python.d.plugin/icecast/)** - collects the number of listeners for active sources. + +### Monitoring Systems +- **[Monit](collectors/python.d.plugin/monit/)** - collects metrics about monit targets (filesystems, applications, networks). + +#### Provisioning Systems +- **[Puppet](collectors/python.d.plugin/puppet/)** - connects to multiple Puppet Server and Puppet DB instances (local or remote) to collect real-time status metrics. + +And you can extend it, by writing plugins that collect data from any source, using any computer language. + +--- + +## Documentation -It should run on **any Linux** system (including IoT). It has been tested on: +The netdata documentation is inside the repo, so by just navigating the repo on github you can find all the documentation. -- Alpine -- Arch Linux -- CentOS -- Debian -- Fedora -- Gentoo -- openSUSE -- PLD Linux -- RedHat Enterprise Linux -- SUSE -- Ubuntu +Here is a quick list: ---- +Directory|Description +:---|:--- +[`installer`](installer/)|Instructions to install netdata on your systems. +[`docker`](docker/)|Instructions to install netdata using docker. +[`daemon`](daemon/)|Information about the netdata daemon and its configuration. +[`collectors`](collectors/)|Information about data collection plugins. +[`health`](health/)|How netdata's health monitoring works, how to create your own alarms and how to configure alarm notification methods. +[`streaming`](streaming/)|How to build hierarchies of netdata servers, by streaming metrics between them. +[`backends`](backends/)|Long term archiving of metrics to industry standard time-series databases, like `prometheus`, `graphite`, `opentsdb`. +[`web/api`](web/api/)|Learn how to query the netdata API and the queries it supports. +[`web/api/badges`](web/api/badges/)|Learn how to generate badges (SVG images) from live data. +[`web/gui/custom`](web/gui/custom/)|Learn how to create custom netdata dashboards. +[`web/gui/confluence`](web/gui/confluence/)|Learn how to create netdata dashboards on Atlassian's Confluence. -## Interaction with netdata +But you can also check all the other directories. Most of them have plenty of documentation. -After installation, you can interact with netdata using **[CLI](https://github.com/netdata/netdata/wiki/Command-Line-Options)** and web dashboards. -The default port of dashboard is 19999. To access the web dashboard on localhost, use: http://localhost:19999 +## Community ---- +We welcome contributions. So, feel free to join the team. -## Documentation +To report bugs, or get help, use [GitHub Issues](https://github.com/netdata/netdata/issues). -Check the **[netdata wiki](https://github.com/netdata/netdata/wiki)**. +You can also find netdata on: -## License +- [Facebook](https://www.facebook.com/linuxnetdata/) +- [Twitter](https://twitter.com/linuxnetdata) +- [OpenHub](https://www.openhub.net/p/netdata) +- [Repology](https://repology.org/metapackage/netdata/versions) +- [StackShare](https://stackshare.io/netdata) -netdata is [GPLv3+](LICENSE). +## License + +netdata is [GPLv3+](LICENSE). -Netdata re-distributes other open-source tools and libraries. Please check the [third party licenses](https://github.com/netdata/netdata/blob/master/REDISTRIBUTED.md). +Netdata re-distributes other open-source tools and libraries. Please check the [third party licenses](REDISTRIBUTED.md). diff --git a/REDISTRIBUTED.md b/REDISTRIBUTED.md index ed30624fb..fbafa1aba 100644 --- a/REDISTRIBUTED.md +++ b/REDISTRIBUTED.md @@ -31,7 +31,7 @@ connectivity is not available. - [Gauge.js](http://bernii.github.io/gauge.js/) Copyright, Bernard Kobos - [MIT License](http://bernii.github.io/gauge.js/) + [MIT License](https://github.com/getgauge/gauge-js/blob/master/LICENSE) - [d3pie](https://github.com/benkeen/d3pie) @@ -85,7 +85,7 @@ connectivity is not available. - [Bootstrap](http://getbootstrap.com/getting-started/) Copyright 2015, Twitter - [MIT License](http://getbootstrap.com/getting-started/#license-faqs) + [MIT License](https://github.com/twbs/bootstrap/blob/v4-dev/LICENSE) - [Bootstrap Toggle](http://www.bootstraptoggle.com/) @@ -109,7 +109,7 @@ connectivity is not available. - [tableExport.jquery.plugin](https://github.com/hhurz/tableExport.jquery.plugin) Copyright (c) 2015,2016 hhurz - [MIT License](http://rawgit.com/hhurz/tableExport.jquery.plugin/master/tableExport.js) + [MIT License](https://github.com/hhurz/tableExport.jquery.plugin/blob/master/LICENSE) - [perfect-scrollbar](https://jamesflorentino.github.io/nanoScrollerJS/) @@ -126,11 +126,6 @@ connectivity is not available. Code license: [MIT License](http://opensource.org/licenses/mit-license.html) -- [IconsDB.com Icons](http://www.iconsdb.com/soylent-red-icons/seo-performance-icon.html) - - Icons provided as CC0 1.0 Universal (CC0 1.0) Public Domain Dedication - - - [node-extend](https://github.com/justmoon/node-extend) Copyright 2014, Stefan Thomas @@ -140,20 +135,20 @@ connectivity is not available. - [node-net-snmp](https://github.com/stephenwvickers/node-net-snmp) Copyright 2013, Stephen Vickers - [MIT License](https://github.com/stephenwvickers/node-net-snmp) + [MIT License](https://github.com/nospaceships/node-net-snmp#license) - [node-asn1-ber](https://github.com/stephenwvickers/node-asn1-ber) Copyright 2017, Stephen Vickers Copyright 2011, Mark Cavage - [MIT License](https://github.com/stephenwvickers/node-asn1-ber) + [MIT License](https://github.com/nospaceships/node-asn1-ber#license) - [pixl-xml](https://github.com/jhuckaby/pixl-xml) Copyright 2015, Joseph Huckaby - [MIT License](https://github.com/jhuckaby/pixl-xml) + [MIT License](https://github.com/jhuckaby/pixl-xml#license) - [sensors](https://github.com/paroj/sensors.py) @@ -165,7 +160,7 @@ connectivity is not available. - [PyYAML](https://bitbucket.org/blackjack/pysensors) Copyright 2006, Kirill Simonov - [MIT License](https://github.com/yaml/pyyaml) + [MIT License](https://github.com/yaml/pyyaml/blob/master/LICENSE) - [urllib3](https://github.com/shazow/urllib3) @@ -192,10 +187,10 @@ connectivity is not available. [MIT License](https://github.com/lgarron/clipboard-polyfill/blob/master/LICENSE.md) -- [Utilities for writing code that runs on Python 2 and 3](https://github.com/netdata/netdata/blob/master/python.d/python_modules/urllib3/packages/six.py) +- [Utilities for writing code that runs on Python 2 and 3](collectors/python.d.plugin/python_modules/urllib3/packages/six.py) Copyright (c) 2010-2015 Benjamin Peterson - [MIT License](https://github.com/netdata/netdata/blob/master/python.d/python_modules/urllib3/packages/six.py) + [MIT License](https://github.com/benjaminp/six/blob/master/LICENSE) - [mcrcon](https://github.com/barneygale/MCRcon) diff --git a/backends/Makefile.am b/backends/Makefile.am index 268259edd..b8daefc59 100644 --- a/backends/Makefile.am +++ b/backends/Makefile.am @@ -12,6 +12,7 @@ SUBDIRS = \ dist_noinst_DATA = \ README.md \ + WALKTHROUGH.md \ $(NULL) dist_noinst_SCRIPTS = \ diff --git a/backends/Makefile.in b/backends/Makefile.in index c2484e96a..026377845 100644 --- a/backends/Makefile.in +++ b/backends/Makefile.in @@ -341,6 +341,7 @@ SUBDIRS = \ dist_noinst_DATA = \ README.md \ + WALKTHROUGH.md \ $(NULL) dist_noinst_SCRIPTS = \ diff --git a/backends/README.md b/backends/README.md index b449f060f..cc943d4d7 100644 --- a/backends/README.md +++ b/backends/README.md @@ -1,4 +1,3 @@ - # Metrics Long Term Archiving netdata supports backends for archiving the metrics, or providing long term dashboards, diff --git a/backends/WALKTHROUGH.md b/backends/WALKTHROUGH.md new file mode 100644 index 000000000..b899556ab --- /dev/null +++ b/backends/WALKTHROUGH.md @@ -0,0 +1,292 @@ +# Netdata, Prometheus, Grafana stack + +## Intro +In this article I will walk you through the basics of getting Netdata, +Prometheus and Grafana all working together and monitoring your application +servers. This article will be using docker on your local workstation. We will be +working with docker in an ad-hoc way, launching containers that run ‘/bin/bash’ +and attaching a TTY to them. I use docker here in a purely academic fashion and +do not condone running Netdata in a container. I pick this method so individuals +without cloud accounts or access to VMs can try this out and for it’s speed of +deployment. + +## Why Netdata, Prometheus, and Grafana +Some time ago I was introduced to Netdata by a coworker. We were attempting to +troubleshoot python code which seemed to be bottlenecked. I was instantly +impressed by the amount of metrics Netdata exposes to you. I quickly added +Netdata to my set of go-to tools when troubleshooting systems performance. + +Some time ago, even later, I was introduced to Prometheus. Prometheus is a +monitoring application which flips the normal architecture around and polls +rest endpoints for its metrics. This architectural change greatly simplifies +and decreases the time necessary to begin monitoring your applications. +Compared to current monitoring solutions the time spent on designing the +infrastructure is greatly reduced. Running a single Prometheus server per +application becomes feasible with the help of Grafana. + +Grafana has been the go to graphing tool for… some time now. It’s awesome, +anyone that has used it knows it’s awesome. We can point Grafana at Prometheus +and use Prometheus as a data source. This allows a pretty simple overall +monitoring architecture: Install Netdata on your application servers, point +Prometheus at Netdata, and then point Grafana at Prometheus. + +I’m omitting an important ingredient in this stack in order to keep this tutorial +simple and that is service discovery. My personal preference is to use Consul. +Prometheus can plug into consul and automatically begin to scrape new hosts that +register a Netdata client with Consul. + +At the end of this tutorial you will understand how each technology fits +together to create a modern monitoring stack. This stack will offer you +visibility into your application and systems performance. + +## Getting Started - Netdata +To begin let’s create our container which we will install Netdata on. We need +to run a container, forward the necessary port that netdata listens on, and +attach a tty so we can interact with the bash shell on the container. But +before we do this we want name resolution between the two containers to work. +In order to accomplish this we will create a user-defined network and attach +both containers to this network. The first command we should run is: + +``` +docker network create --driver bridge netdata-tutorial +``` + +With this user-defined network created we can now launch our container we will +install Netdata on and point it to this network. + +``` +docker run -it --name netdata --hostname netdata --network=netdata-tutorial -p 19999:19999 centos:latest '/bin/bash' +``` + +This command creates an interactive tty session (-it), gives the container both +a name in relation to the docker daemon and a hostname (this is so you know what +container is which when working in the shells and docker maps hostname +resolution to this container), forwards the local port 19999 to the container’s +port 19999 (-p 19999:19999), sets the command to run (/bin/bash) and then +chooses the base container images (centos:latest). After running this you should +be sitting inside the shell of the container. + +After we have entered the shell we can install Netdata. This process could not +be easier. If you take a look at [this link](../installer/#installation), the Netdata devs give us +several one-liners to install netdata. I have not had any issues with these one +liners and their bootstrapping scripts so far (If you guys run into anything do +share). Run the following command in your container. + +``` +bash <(curl -Ss https://my-netdata.io/kickstart.sh) --dont-wait +``` + +After the install completes you should be able to hit the Netdata dashboard at +http://localhost:19999/ (replace localhost if you’re doing this on a VM or have +the docker container hosted on a machine not on your local system). If this is +your first time using Netdata I suggest you take a look around. The amount of +time I’ve spent digging through /proc and calculating my own metrics has been +greatly reduced by this tool. Take it all in. + +Next I want to draw your attention to a particular endpoint. Navigate to +http://localhost:19999/api/v1/allmetrics?format=prometheus&help=yes In your +browser. This is the endpoint which publishes all the metrics in a format which +Prometheus understands. Let’s take a look at one of these metrics. +`netdata_system_cpu_percentage_average{chart="system.cpu",family="cpu",dimension="system"} +0.0831255 1501271696000` This metric is representing several things which I will +go in more details in the section on prometheus. For now understand that this +metric: `netdata_system_cpu_percentage_average` has several labels: [chart, +family, dimension]. This corresponds with the first cpu chart you see on the +Netdata dashboard. + + + +This CHART is called ‘system.cpu’, The FAMILY is cpu, and the DIMENSION we are +observing is “system”. You can begin to draw links between the charts in netdata +to the prometheus metrics format in this manner. + +## Prometheus +We will be installing prometheus in a container for purpose of demonstration. +While prometheus does have an official container I would like to walk through +the install process and setup on a fresh container. This will allow anyone +reading to migrate this tutorial to a VM or Server of any sort. + +Let’s start another container in the same fashion as we did the Netdata +container. `docker run -it --name prometheus --hostname prometheus +--network=netdata-tutorial -p 9090:9090 centos:latest '/bin/bash'` This should +drop you into a shell once again. Once there quickly install your favorite +editor as we will be editing files later in this tutorial. `yum install vim -y` + +Prometheus provides a tarball of their latest stable versions here: +https://prometheus.io/download/. Let’s download the latest version and install +into your container. + +``` +curl -L 'https://github.com/prometheus/prometheus/releases/download/v1.7.1/prometheus-1.7.1.linux-amd64.tar.gz' -o /tmp/prometheus.tar.gz + +mkdir /opt/prometheus + +tar -xf /tmp/prometheus.tar.gz -C /opt/prometheus/ --strip-components 1 +``` + +This should get prometheus installed into the container. Let’s test that we can run +prometheus and connect to it’s web interface. This will look similar to what +follows: + +``` +[root@prometheus prometheus]# /opt/prometheus/prometheus +INFO[0000] Starting prometheus (version=1.7.1, branch=master, revision=3afb3fffa3a29c3de865e1172fb740442e9d0133) + source="main.go:88" +INFO[0000] Build context (go=go1.8.3, user=root@0aa1b7fc430d, date=20170612-11:44:05) source="main.go:89" +INFO[0000] Host details (Linux 4.9.36-moby #1 SMP Wed Jul 12 15:29:07 UTC 2017 x86_64 prometheus (none)) source="main.go:90" +INFO[0000] Loading configuration file prometheus.yml source="main.go:252" +INFO[0000] Loading series map and head chunks... source="storage.go:428" +INFO[0000] 0 series loaded. source="storage.go:439" +INFO[0000] Starting target manager... source="targetmanager.go:63" +INFO[0000] Listening on :9090 source="web.go:259" +``` + +Now attempt to go to http://localhost:9090/. You should be presented with the +prometheus homepage. This is a good point to talk about Prometheus’s data model +which can be viewed here: https://prometheus.io/docs/concepts/data_model/ As +explained we have two key elements in Prometheus metrics. We have the ‘metric’ +and its ‘labels’. Labels allow for granularity between metrics. Let’s use our +previous example to further explain. + +``` +netdata_system_cpu_percentage_average{chart="system.cpu",family="cpu",dimension="system"} 0.0831255 1501271696000 +``` + +Here our metric is +‘netdata_system_cpu_percentage_average’ and our labels are ‘chart’, ‘family’, +and ‘dimension. The last two values constitute the actual metric value for the +metric type (gauge, counter, etc…). We can begin graphing system metrics with +this information, but first we need to hook up Prometheus to poll Netdata stats. + +Let’s move our attention to Prometheus’s configuration. Prometheus gets it +config from the file located (in our example) at +`/opt/prometheus/prometheus.yml`. I won’t spend an extensive amount of time +going over the configuration values documented here: +https://prometheus.io/docs/operating/configuration/. We will be adding a new +“job” under the “scrape_configs”. Let’s make the “scrape_configs” section look +like this (we can use the dns name Netdata due to the custom user-defined +network we created in docker beforehand). + +```yml +scrape_configs: + # The job name is added as a label `job=<job_name>` to any timeseries scraped from this config. + - job_name: 'prometheus' + + # metrics_path defaults to '/metrics' + # scheme defaults to 'http'. + + static_configs: + - targets: ['localhost:9090'] + + - job_name: 'netdata' + + metrics_path: /api/v1/allmetrics + params: + format: [ prometheus ] + + static_configs: + - targets: ['netdata:19999'] +``` + +Let’s start prometheus once again by running `/opt/prometheus/prometheus`. If we +now navigate to prometheus at ‘http://localhost:9090/targets’ we should see our +target being successfully scraped. If we now go back to the Prometheus’s +homepage and begin to type ‘netdata_’ Prometheus should auto complete metrics +it is now scraping. + + + +Let’s now start exploring how we can graph some metrics. Back in our NetData +container lets get the CPU spinning with a pointless busy loop. On the shell do +the following: + +``` +[root@netdata /]# while true; do echo "HOT HOT HOT CPU"; done +``` + +Our NetData cpu graph should be showing some activity. Let’s represent this in +Prometheus. In order to do this let’s keep our metrics page open for reference: +http://localhost:19999/api/v1/allmetrics?format=prometheus&help=yes We are +setting out to graph the data in the CPU chart so let’s search for “system.cpu” +in the metrics page above. We come across a section of metrics with the first +comments `# COMMENT homogeneus chart "system.cpu", context "system.cpu", family +"cpu", units "percentage"` Followed by the metrics. This is a good start now let +us drill down to the specific metric we would like to graph. + +``` +# COMMENT +netdata_system_cpu_percentage_average: dimension "system", value is percentage, gauge, dt 1501275951 to 1501275951 inclusive +netdata_system_cpu_percentage_average{chart="system.cpu",family="cpu",dimension="system"} 0.0000000 1501275951000 +``` + +Here we learn that the metric name we care about is +‘netdata_system_cpu_percentage_average’ so throw this into Prometheus and see +what we get. We should see something similar to this (I shut off my busy loop) + + + +This is a good step toward what we want. Also make note that Prometheus will tag +on an ‘instance’ label for us which corresponds to our statically defined job in +the configuration file. This allows us to tailor our queries to specific +instances. Now we need to isolate the dimension we want in our query. To do this +let us refine the query slightly. Let’s query the dimension also. Place this +into our query text box. +`netdata_system_cpu_percentage_average{dimension="system"}` We now wind up with +the following graph. + + + +Awesome, this is exactly what we wanted. If you haven’t caught on yet we can +emulate entire charts from NetData by using the `chart` dimension. If you’d like +you can combine the ‘chart’ and ‘instance’ dimension to create per-instance +charts. Let’s give this a try: +`netdata_system_cpu_percentage_average{chart="system.cpu", instance="netdata:19999"}` + +This is the basics of using Prometheus to query NetData. I’d advise everyone at +this point to read [this page](../backends/prometheus/#using-netdata-with-prometheus). +The key point here is that NetData can export metrics from its internal DB or +can send metrics “as-collected” by specifying the ‘source=as-collected’ url +parameter like so. +http://localhost:19999/api/v1/allmetrics?format=prometheus&help=yes&types=yes&source=as-collected +If you choose to use this method you will need to use Prometheus's set of +functions here: https://prometheus.io/docs/querying/functions/ to obtain useful +metrics as you are now dealing with raw counters from the system. For example +you will have to use the `irate()` function over a counter to get that metric’s +rate per second. If your graphing needs are met by using the metrics returned by +NetData’s internal database (not specifying any source= url parameter) then use +that. If you find limitations then consider re-writing your queries using the +raw data and using Prometheus functions to get the desired chart. + +## Grafana +Finally we make it to grafana. This is the easiest part in my opinion. This time +we will actually run the official grafana docker container as all configuration +we need to do is done via the GUI. Let’s run the following command: + +``` +docker run -i -p 3000:3000 --network=netdata-tutorial grafana/grafana +``` + +This will get grafana running at ‘http://localhost:3000/’ Let’s go there and +login using the credentials Admin:Admin. + +The first thing we want to do is click ‘Add data source’. Let’s make it look +like the following screenshot + + + +With this completed let’s graph! Create a new Dashboard by clicking on the top +left Grafana Icon and create a new graph in that dashboard. Fill in the query +like we did above and save. + + + +## Conclusion + +There you have it, a complete systems monitoring stack which is very easy to +deploy. From here I would begin to understand how Prometheus and a service +discovery mechanism such as Consul can play together nicely. My current prod +deployments automatically register Netdata services into Consul and Prometheus +automatically begins to scrape them. Once achieved you do not have to think +about the monitoring system until Prometheus cannot keep up with your scale. +Once this happens there are options presented in the Prometheus documentation +for solving this. Hope this was helpful, happy monitoring. diff --git a/backends/prometheus/README.md b/backends/prometheus/README.md index 826cf051b..99a11f942 100644 --- a/backends/prometheus/README.md +++ b/backends/prometheus/README.md @@ -1,18 +1,21 @@ -> IMPORTANT: the format netdata sends metrics to prometheus has changed since netdata v1.7. The new prometheus backend for netdata supports a lot more features and is aligned to the development of the rest of the netdata backends. - # Using netdata with Prometheus +> IMPORTANT: the format netdata sends metrics to prometheus has changed since netdata v1.7. The new prometheus backend for netdata supports a lot more features and is aligned to the development of the rest of the netdata backends. + Prometheus is a distributed monitoring system which offers a very simple setup along with a robust data model. Recently netdata added support for Prometheus. I'm going to quickly show you how to install both netdata and prometheus on the same server. We can then use grafana pointed at Prometheus to obtain long term metrics netdata offers. I'm assuming we are starting at a fresh ubuntu shell (whether you'd like to follow along in a VM or a cloud instance is up to you). + ## Installing netdata and prometheus ### Installing netdata -There are number of ways to install netdata according to [Installation](https://github.com/netdata/netdata/wiki/Installation) + +There are number of ways to install netdata according to [Installation](../../installer/#installation) The suggested way of installing the latest netdata and keep it upgrade automatically. Using one line installation: ``` bash <(curl -Ss https://my-netdata.io/kickstart.sh) ``` + At this point we should have netdata listening on port 19999. Attempt to take your browser here: ``` @@ -22,15 +25,16 @@ http://your.netdata.ip:19999 *(replace `your.netdata.ip` with the IP or hostname of the server running netdata)* ### Installing Prometheus + In order to install prometheus we are going to introduce our own systemd startup script along with an example of prometheus.yaml configuration. Prometheus needs to be pointed to your server at a specific target url for it to scrape netdata's api. Prometheus is always a pull model meaning netdata is the passive client within this architecture. Prometheus always initiates the connection with netdata. -##### Download Prometheus +#### Download Prometheus ```sh wget -O /tmp/prometheus-2.3.2.linux-amd64.tar.gz https://github.com/prometheus/prometheus/releases/download/v2.3.2/prometheus-2.3.2.linux-amd64.tar.gz ``` -##### Create prometheus system user +#### Create prometheus system user ```sh sudo useradd -r prometheus @@ -104,6 +108,7 @@ scrape_configs: static_configs: - targets: ['{your.netdata.ip}:19999'] ``` + #### Install nodes.yml The following is completely optional, it will enable Prometheus to generate alerts from some NetData sources. Tweak the values to your own needs. We will use the following `nodes.yml` file below. Save it at `/opt/prometheus/nodes.yml`, and add a *- "nodes.yml"* entry under the *rule_files:* section in the example prometheus.yml file above. @@ -166,7 +171,6 @@ ExecStop=/bin/kill -SIGINT $MAINPID [Install] WantedBy=multi-user.target ``` - ##### Start Prometheus ``` @@ -180,7 +184,7 @@ If everything is working correctly when you fetch `http://your.prometheus.ip:909 --- -## netdata support for prometheus +## Netdata support for prometheus > IMPORTANT: the format netdata sends metrics to prometheus has changed since netdata v1.6. The new format allows easier queries for metrics and supports both `as collected` and normalized metrics. @@ -208,7 +212,7 @@ Then each netdata chart contains metrics called `dimensions`. All the dimensions ### netdata data source -netdata can send metrics to prometheus from 3 data sources: +Netdata can send metrics to prometheus from 3 data sources: - `as collected` or `raw` - this data source sends the metrics to prometheus as they are collected. No conversion is done by netdata. The latest value for each metric is just given to prometheus. This is the most preferred method by prometheus, but it is also the harder to work with. To work with this data source, you will need to understand how to get meaningful values out of them. @@ -231,7 +235,6 @@ netdata can send metrics to prometheus from 3 data sources: Keep in mind that early versions of netdata were sending the metrics as: `CHART_DIMENSION{}`. - ### Querying Metrics Fetch with your web browser this URL: @@ -298,6 +301,7 @@ netdata_system_cpu_total{chart="system.cpu",family="cpu",dimension="iowait"} 233 # COMMENT netdata_system_cpu_total: chart "system.cpu", context "system.cpu", family "cpu", dimension "idle", value * 1 / 1 delta gives percentage (counter) netdata_system_cpu_total{chart="system.cpu",family="cpu",dimension="idle"} 918470 1500066716438 ``` + *(netdata response for `system.cpu` with source=`as-collected`)* For more information check prometheus documentation. @@ -315,11 +319,11 @@ The `format=prometheus` parameter only exports the host's netdata metrics. If y This will report all upstream host data, and `honor_labels` will make Prometheus take note of the instance names provided. -### timestamps +### Timestamps To pass the metrics through prometheus pushgateway, netdata supports the option `×tamps=no` to send the metrics without timestamps. -## netdata host variables +## Netdata host variables netdata collects various system configuration metrics, like the max number of TCP sockets supported, the max number of files allowed system-wide, various IPC sizes, etc. These metrics are not exposed to prometheus by default. @@ -369,7 +373,7 @@ netdata sends all metrics prefixed with `netdata_`. You can change this in `netd It can also be changed from the URL, by appending `&prefix=netdata`. -### accuracy of `average` and `sum` data sources +### Accuracy of `average` and `sum` data sources When the data source is set to `average` or `sum`, netdata remembers the last access of each client accessing prometheus metrics and uses this last access time to respond with the `average` or `sum` of all the entries in the database since that. This means that prometheus servers are not losing data when they access netdata with data source = `average` or `sum`. diff --git a/collectors/README.md b/collectors/README.md index b7fc73286..83c92d9dd 100644 --- a/collectors/README.md +++ b/collectors/README.md @@ -15,9 +15,9 @@ To minimize the number of processes spawn for data collection, netdata also supp data collection modules with the minimum of code. Currently netdata provides plugin orchestrators - BASH v4+ [charts.d.plugin](charts.d.plugin), - node.js [node.d.plugin](node.d.plugin) and - python v2+ (including v3) [python.d.plugin](python.d.plugin). + BASH v4+ [charts.d.plugin](charts.d.plugin/), + node.js [node.d.plugin](node.d.plugin/) and + python v2+ (including v3) [python.d.plugin](python.d.plugin/). ## Netdata Plugins diff --git a/collectors/apps.plugin/README.md b/collectors/apps.plugin/README.md index 05680efe8..d1ca8114c 100644 --- a/collectors/apps.plugin/README.md +++ b/collectors/apps.plugin/README.md @@ -188,21 +188,21 @@ Here is an example for the process group `sql` at `https://registry.my-netdata.i Netdata is able give you a lot more badges for your app. Examples below for process group `sql`: -- CPU usage:  -- Disk Physical Reads  -- Disk Physical Writes  -- Disk Logical Reads  -- Disk Logical Writes  -- Open Files  -- Real Memory  -- Virtual Memory  -- Swap Memory  -- Minor Page Faults  -- Processes  -- Threads  -- Major Faults (swap activity)  -- Open Pipes  -- Open Sockets  +- CPU usage:  +- Disk Physical Reads  +- Disk Physical Writes  +- Disk Logical Reads  +- Disk Logical Writes  +- Open Files  +- Real Memory  +- Virtual Memory  +- Swap Memory  +- Minor Page Faults  +- Processes  +- Threads  +- Major Faults (swap activity)  +- Open Pipes  +- Open Sockets  For more information about badges check [Generating Badges](../../web/api/badges) diff --git a/collectors/cgroups.plugin/README.md b/collectors/cgroups.plugin/README.md index e78aa0440..47eeebc53 100644 --- a/collectors/cgroups.plugin/README.md +++ b/collectors/cgroups.plugin/README.md @@ -54,7 +54,7 @@ To provide a sane default for this setting, netdata uses the following pattern l search for cgroups in subpaths matching = !*/init.scope !*-qemu !/init.scope !/system !/systemd !/user !/user.slice * ``` -So, we disable checking for **child cgroups** in systemd internal cgroups ([systemd services are monitored by netdata](https://github.com/netdata/netdata/wiki/monitoring-systemd-services)), user cgroups (normally used for desktop and remote user sessions), qemu virtual machines (child cgroups of virtual machines) and `init.scope`. All others are enabled. +So, we disable checking for **child cgroups** in systemd internal cgroups ([systemd services are monitored by netdata](#monitoring-systemd-services)), user cgroups (normally used for desktop and remote user sessions), qemu virtual machines (child cgroups of virtual machines) and `init.scope`. All others are enabled. ### enabled cgroups @@ -87,7 +87,7 @@ For this mapping netdata provides 2 configuration options: The whole point for the additional pattern list, is to limit the number of times the script will be called. Without this pattern list, the script might be called thousands of times, depending on the number of cgroups available in the system. -The above pattern list is matched against the path of the cgroup. For matched cgroups, netdata calls the script [cgroup-name.sh](https://github.com/netdata/netdata/blob/master/collectors/cgroups.plugin/cgroup-name.sh.in) to get its name. This script queries `docker`, or applies heuristics to find give a name for the cgroup. +The above pattern list is matched against the path of the cgroup. For matched cgroups, netdata calls the script [cgroup-name.sh](cgroup-name.sh.in) to get its name. This script queries `docker`, or applies heuristics to find give a name for the cgroup. ## Monitoring systemd services diff --git a/collectors/checks.plugin/Makefile.am b/collectors/checks.plugin/Makefile.am index babdcf0df..19554bed8 100644 --- a/collectors/checks.plugin/Makefile.am +++ b/collectors/checks.plugin/Makefile.am @@ -2,3 +2,7 @@ AUTOMAKE_OPTIONS = subdir-objects MAINTAINERCLEANFILES = $(srcdir)/Makefile.in + +dist_noinst_DATA = \ + README.md \ + $(NULL) diff --git a/collectors/checks.plugin/Makefile.in b/collectors/checks.plugin/Makefile.in index 632125466..faadbe58a 100644 --- a/collectors/checks.plugin/Makefile.in +++ b/collectors/checks.plugin/Makefile.in @@ -15,6 +15,7 @@ @SET_MAKE@ # SPDX-License-Identifier: GPL-3.0-or-later + VPATH = @srcdir@ am__is_gnu_make = test -n '$(MAKEFILE_LIST)' && test -n '$(MAKELEVEL)' am__make_running_with_option = \ @@ -80,7 +81,8 @@ POST_UNINSTALL = : build_triplet = @build@ host_triplet = @host@ subdir = collectors/checks.plugin -DIST_COMMON = $(srcdir)/Makefile.in $(srcdir)/Makefile.am +DIST_COMMON = $(srcdir)/Makefile.in $(srcdir)/Makefile.am \ + $(dist_noinst_DATA) ACLOCAL_M4 = $(top_srcdir)/aclocal.m4 am__aclocal_m4_deps = $(top_srcdir)/build/m4/ax_c___atomic.m4 \ $(top_srcdir)/build/m4/ax_c__generic.m4 \ @@ -117,6 +119,7 @@ am__can_run_installinfo = \ n|no|NO) false;; \ *) (install-info --version) >/dev/null 2>&1;; \ esac +DATA = $(dist_noinst_DATA) am__tagged_files = $(HEADERS) $(SOURCES) $(TAGS_FILES) $(LISP) DISTFILES = $(DIST_COMMON) $(DIST_SOURCES) $(TEXINFOS) $(EXTRA_DIST) ACLOCAL = @ACLOCAL@ @@ -267,6 +270,10 @@ varlibdir = @varlibdir@ webdir = @webdir@ AUTOMAKE_OPTIONS = subdir-objects MAINTAINERCLEANFILES = $(srcdir)/Makefile.in +dist_noinst_DATA = \ + README.md \ + $(NULL) + all: all-am .SUFFIXES: @@ -339,7 +346,7 @@ distdir: $(DISTFILES) done check-am: all-am check: check-am -all-am: Makefile +all-am: Makefile $(DATA) installdirs: install: install-am install-exec: install-exec-am diff --git a/collectors/checks.plugin/README.md b/collectors/checks.plugin/README.md new file mode 100644 index 000000000..503b96ada --- /dev/null +++ b/collectors/checks.plugin/README.md @@ -0,0 +1,3 @@ +# Netdata internal checks + +A debugging plugin (by default it is disabled) diff --git a/collectors/diskspace.plugin/README.md b/collectors/diskspace.plugin/README.md index 74d6cde3c..f7d0e7b49 100644 --- a/collectors/diskspace.plugin/README.md +++ b/collectors/diskspace.plugin/README.md @@ -1,5 +1,6 @@ -> for disks performance monitoring, see the `proc` plugin, [here](../proc.plugin/#monitoring-disks-performance-with-netdata) - # diskspace.plugin This plugin monitors the disk space usage of mounted disks, under Linux. + +> for disks performance monitoring, see the `proc` plugin, [here](../proc.plugin/#monitoring-disks) + diff --git a/collectors/fping.plugin/README.md b/collectors/fping.plugin/README.md index 0554a7edc..a83b7912c 100644 --- a/collectors/fping.plugin/README.md +++ b/collectors/fping.plugin/README.md @@ -37,7 +37,7 @@ fping_opts="-R -b 56 -i 1 -r 0 -t 5000" ## alarms netdata will automatically attach a few alarms for each host. -Check the [latest versions of the fping alarms](https://github.com/netdata/netdata/blob/master/health/health.d/fping.conf) +Check the [latest versions of the fping alarms](../../health/health.d/fping.conf) ## Additional Tips diff --git a/collectors/freebsd.plugin/Makefile.am b/collectors/freebsd.plugin/Makefile.am index e80ec702d..ca4d4ddd7 100644 --- a/collectors/freebsd.plugin/Makefile.am +++ b/collectors/freebsd.plugin/Makefile.am @@ -3,3 +3,7 @@ AUTOMAKE_OPTIONS = subdir-objects MAINTAINERCLEANFILES = $(srcdir)/Makefile.in + +dist_noinst_DATA = \ + README.md \ + $(NULL) diff --git a/collectors/freebsd.plugin/Makefile.in b/collectors/freebsd.plugin/Makefile.in index c88b3d755..d3332677b 100644 --- a/collectors/freebsd.plugin/Makefile.in +++ b/collectors/freebsd.plugin/Makefile.in @@ -15,6 +15,7 @@ @SET_MAKE@ # SPDX-License-Identifier: GPL-3.0-or-later + VPATH = @srcdir@ am__is_gnu_make = test -n '$(MAKEFILE_LIST)' && test -n '$(MAKELEVEL)' am__make_running_with_option = \ @@ -80,7 +81,8 @@ POST_UNINSTALL = : build_triplet = @build@ host_triplet = @host@ subdir = collectors/freebsd.plugin -DIST_COMMON = $(srcdir)/Makefile.in $(srcdir)/Makefile.am +DIST_COMMON = $(srcdir)/Makefile.in $(srcdir)/Makefile.am \ + $(dist_noinst_DATA) ACLOCAL_M4 = $(top_srcdir)/aclocal.m4 am__aclocal_m4_deps = $(top_srcdir)/build/m4/ax_c___atomic.m4 \ $(top_srcdir)/build/m4/ax_c__generic.m4 \ @@ -117,6 +119,7 @@ am__can_run_installinfo = \ n|no|NO) false;; \ *) (install-info --version) >/dev/null 2>&1;; \ esac +DATA = $(dist_noinst_DATA) am__tagged_files = $(HEADERS) $(SOURCES) $(TAGS_FILES) $(LISP) DISTFILES = $(DIST_COMMON) $(DIST_SOURCES) $(TEXINFOS) $(EXTRA_DIST) ACLOCAL = @ACLOCAL@ @@ -267,6 +270,10 @@ varlibdir = @varlibdir@ webdir = @webdir@ AUTOMAKE_OPTIONS = subdir-objects MAINTAINERCLEANFILES = $(srcdir)/Makefile.in +dist_noinst_DATA = \ + README.md \ + $(NULL) + all: all-am .SUFFIXES: @@ -339,7 +346,7 @@ distdir: $(DISTFILES) done check-am: all-am check: check-am -all-am: Makefile +all-am: Makefile $(DATA) installdirs: install: install-am install-exec: install-exec-am diff --git a/collectors/freebsd.plugin/README.md b/collectors/freebsd.plugin/README.md new file mode 100644 index 000000000..e6302f420 --- /dev/null +++ b/collectors/freebsd.plugin/README.md @@ -0,0 +1,3 @@ +# freebsd + +Collects resource usage and performance data on FreeBSD systems diff --git a/collectors/freeipmi.plugin/README.md b/collectors/freeipmi.plugin/README.md index f7c5cc148..6d4ad1865 100644 --- a/collectors/freeipmi.plugin/README.md +++ b/collectors/freeipmi.plugin/README.md @@ -87,7 +87,7 @@ The plugin supports a few options. To see them, run: options ipmi_si kipmid_max_busy_us=10 For more information: - https://github.com/ktsaou/netdata/tree/master/plugins/freeipmi.plugin + https://github.com/netdata/netdata/tree/master/collectors/freeipmi.plugin ``` diff --git a/collectors/freeipmi.plugin/freeipmi_plugin.c b/collectors/freeipmi.plugin/freeipmi_plugin.c index a1cff3af0..7fc012d38 100644 --- a/collectors/freeipmi.plugin/freeipmi_plugin.c +++ b/collectors/freeipmi.plugin/freeipmi_plugin.c @@ -1624,7 +1624,7 @@ int main (int argc, char **argv) { " options ipmi_si kipmid_max_busy_us=10\n" "\n" " For more information:\n" - " https://github.com/ktsaou/netdata/tree/master/plugins/freeipmi.plugin\n" + " https://github.com/netdata/netdata/tree/master/collectors/freeipmi.plugin\n" "\n" , VERSION , netdata_update_every diff --git a/collectors/macos.plugin/Makefile.am b/collectors/macos.plugin/Makefile.am index babdcf0df..19554bed8 100644 --- a/collectors/macos.plugin/Makefile.am +++ b/collectors/macos.plugin/Makefile.am @@ -2,3 +2,7 @@ AUTOMAKE_OPTIONS = subdir-objects MAINTAINERCLEANFILES = $(srcdir)/Makefile.in + +dist_noinst_DATA = \ + README.md \ + $(NULL) diff --git a/collectors/macos.plugin/Makefile.in b/collectors/macos.plugin/Makefile.in index 6247dda70..d5979211d 100644 --- a/collectors/macos.plugin/Makefile.in +++ b/collectors/macos.plugin/Makefile.in @@ -15,6 +15,7 @@ @SET_MAKE@ # SPDX-License-Identifier: GPL-3.0-or-later + VPATH = @srcdir@ am__is_gnu_make = test -n '$(MAKEFILE_LIST)' && test -n '$(MAKELEVEL)' am__make_running_with_option = \ @@ -80,7 +81,8 @@ POST_UNINSTALL = : build_triplet = @build@ host_triplet = @host@ subdir = collectors/macos.plugin -DIST_COMMON = $(srcdir)/Makefile.in $(srcdir)/Makefile.am +DIST_COMMON = $(srcdir)/Makefile.in $(srcdir)/Makefile.am \ + $(dist_noinst_DATA) ACLOCAL_M4 = $(top_srcdir)/aclocal.m4 am__aclocal_m4_deps = $(top_srcdir)/build/m4/ax_c___atomic.m4 \ $(top_srcdir)/build/m4/ax_c__generic.m4 \ @@ -117,6 +119,7 @@ am__can_run_installinfo = \ n|no|NO) false;; \ *) (install-info --version) >/dev/null 2>&1;; \ esac +DATA = $(dist_noinst_DATA) am__tagged_files = $(HEADERS) $(SOURCES) $(TAGS_FILES) $(LISP) DISTFILES = $(DIST_COMMON) $(DIST_SOURCES) $(TEXINFOS) $(EXTRA_DIST) ACLOCAL = @ACLOCAL@ @@ -267,6 +270,10 @@ varlibdir = @varlibdir@ webdir = @webdir@ AUTOMAKE_OPTIONS = subdir-objects MAINTAINERCLEANFILES = $(srcdir)/Makefile.in +dist_noinst_DATA = \ + README.md \ + $(NULL) + all: all-am .SUFFIXES: @@ -339,7 +346,7 @@ distdir: $(DISTFILES) done check-am: all-am check: check-am -all-am: Makefile +all-am: Makefile $(DATA) installdirs: install: install-am install-exec: install-exec-am diff --git a/collectors/macos.plugin/README.md b/collectors/macos.plugin/README.md new file mode 100644 index 000000000..ddbcc8f9b --- /dev/null +++ b/collectors/macos.plugin/README.md @@ -0,0 +1,3 @@ +# macos + +Collects resource usage and performance data on MacOS systems diff --git a/collectors/node.d.plugin/README.md b/collectors/node.d.plugin/README.md index dd977017d..af8708c7b 100644 --- a/collectors/node.d.plugin/README.md +++ b/collectors/node.d.plugin/README.md @@ -9,7 +9,21 @@ 5. Allows each **module** to have one or more data collection **jobs** 6. Each **job** is collecting one or more metrics from a single data source -# Motivation +## Pull Request Checklist for Node.js Plugins + +This is a generic checklist for submitting a new Node.js plugin for Netdata. It is by no means comprehensive. + +At minimum, to be buildable and testable, the PR needs to include: + +* The module itself, following proper naming conventions: `node.d/<module_dir>/<module_name>.node.js` +* A README.md file for the plugin. +* The configuration file for the module +* A basic configuration for the plugin in the appropriate global config file: `conf.d/node.d.conf`, which is also in JSON format. If the module should be enabled by default, add a section for it in the `modules` dictionary. +* A line for the plugin in the appropriate `Makefile.am` file: `node.d/Makefile.am` under `dist_node_DATA`. +* A line for the plugin configuration file in `conf.d/Makefile.am`: under `dist_nodeconfig_DATA` +* Optionally, chart information in `web/dashboard_info.js`. This generally involves specifying a name and icon for the section, and may include descriptions for the section or individual charts. + +## Motivation Node.js is perfect for asynchronous operations. It is very fast and quite common (actually the whole web is based on it). Since data collection is not a CPU intensive task, node.js is an ideal solution for it. diff --git a/collectors/plugins.d/README.md b/collectors/plugins.d/README.md index d3aa5b5b0..c5981803c 100644 --- a/collectors/plugins.d/README.md +++ b/collectors/plugins.d/README.md @@ -374,23 +374,23 @@ or do not output the line at all. ## Modular Plugins -1. **python**, use `python.d.plugin`, there are many examples in the [python.d directory](../python.d.plugin) +1. **python**, use `python.d.plugin`, there are many examples in the [python.d directory](../python.d.plugin/) python is ideal for netdata plugins. It is a simple, yet powerful way to collect data, it has a very small memory footprint, although it is not the most CPU efficient way to do it. -2. **node.js**, use `node.d.plugin`, there are a few examples in the [node.d directory](../node.d.plugin) +2. **node.js**, use `node.d.plugin`, there are a few examples in the [node.d directory](../node.d.plugin/) node.js is the fastest scripting language for collecting data. If your plugin needs to do a lot of work, compute values, etc, node.js is probably the best choice before moving to compiled code. Keep in mind though that node.js is not memory efficient; it will probably need more RAM compared to python. -3. **BASH**, use `charts.d.plugin`, there are many examples in the [charts.d directory](../charts.d.plugin) +3. **BASH**, use `charts.d.plugin`, there are many examples in the [charts.d directory](../charts.d.plugin/) BASH is the simplest scripting language for collecting values. It is the less efficient though in terms of CPU resources. You can use it to collect data quickly, but extensive use of it might use a lot of system resources. 4. **C** Of course, C is the most efficient way of collecting data. This is why netdata itself is written in C. - ---- + +## Properly Writing Plugins ## Writing Plugins Properly @@ -470,3 +470,4 @@ There are a few rules for writing plugins properly: 3. If you are not sure of memory leaks, exit every one hour. Netdata will re-start your process. 4. If possible, try to autodetect if your plugin should be enabled, without any configuration. + diff --git a/collectors/proc.plugin/README.md b/collectors/proc.plugin/README.md index 9d444f3d0..123065655 100644..100755 --- a/collectors/proc.plugin/README.md +++ b/collectors/proc.plugin/README.md @@ -1,4 +1,3 @@ - # proc.plugin - `/proc/net/dev` (all network interfaces for all their values) @@ -9,7 +8,7 @@ - `/proc/net/stat/nf_conntrack` (connection tracking performance) - `/proc/net/stat/synproxy` (synproxy performance) - `/proc/net/ip_vs/stats` (IPVS connection statistics) - - `/proc/stat` (CPU utilization) + - `/proc/stat` (CPU utilization and attributes) - `/proc/meminfo` (memory information) - `/proc/vmstat` (system performance) - `/proc/net/rpc/nfsd` (NFS server statistics for both v3 and v4 NFS servers) @@ -25,7 +24,7 @@ --- -# Monitoring Disks +## Monitoring Disks > Live demo of disk monitoring at: **[http://london.netdata.rocks](https://registry.my-netdata.io/#menu_disk)** @@ -33,75 +32,45 @@ Performance monitoring for Linux disks is quite complicated. The main reason is Hopefully, the Linux kernel provides many metrics that can provide deep insights of what our disks our doing. The kernel measures all these metrics on all layers of storage: **virtual disks**, **physical disks** and **partitions of disks**. -Let's see the list of metrics provided by netdata for each of the above: - -### I/O bandwidth/s (kb/s) - -The amount of data transferred from and to the disk. - -### I/O operations/s - -The number of I/O operations completed. - -### Queued I/O operations - -The number of currently queued I/O operations. For traditional disks that execute commands one after another, one of them is being run by the disk and the rest are just waiting in a queue. - -### Backlog size (time in ms) - -The expected duration of the currently queued I/O operations. - -### Utilization (time percentage) - -The percentage of time the disk was busy with something. This is a very interesting metric, since for most disks, that execute commands sequentially, **this is the key indication of congestion**. A sequential disk that is 100% of the available time busy, has no time to do anything more, so even if the bandwidth or the number of operations executed by the disk is low, its capacity has been reached. - -Of course, for newer disk technologies (like fusion cards) that are capable to execute multiple commands in parallel, this metric is just meaningless. - -### Average I/O operation time (ms) - -The average time for I/O requests issued to the device to be served. This includes the time spent by the requests in queue and the time spent servicing them. - -### Average I/O operation size (kb) - -The average amount of data of the completed I/O operations. - -### Average Service Time (ms) - -The average service time for completed I/O operations. This metric is calculated using the total busy time of the disk and the number of completed operations. If the disk is able to execute multiple parallel operations the reporting average service time will be misleading. - -### Merged I/O operations/s - -The Linux kernel is capable of merging I/O operations. So, if two requests to read data from the disk are adjacent, the Linux kernel may merge them to one before giving them to disk. This metric measures the number of operations that have been merged by the Linux kernel. - -### Total I/O time - -The sum of the duration of all completed I/O operations. This number can exceed the interval if the disk is able to execute multiple I/O operations in parallel. - -### Space usage - -For mounted disks, netdata will provide a chart for their space, with 3 dimensions: - -1. free -2. used -3. reserved for root - -### inode usage - -For mounted disks, netdata will provide a chart for their inodes (number of file and directories), with 3 dimensions: - -1. free -2. used -3. reserved for root - ---- - -## disk names +### Monitored disk metrics + +- I/O bandwidth/s (kb/s) + The amount of data transferred from and to the disk. +- I/O operations/s + The number of I/O operations completed. +- Queued I/O operations + The number of currently queued I/O operations. For traditional disks that execute commands one after another, one of them is being run by the disk and the rest are just waiting in a queue. +- Backlog size (time in ms) + The expected duration of the currently queued I/O operations. +- Utilization (time percentage) + The percentage of time the disk was busy with something. This is a very interesting metric, since for most disks, that execute commands sequentially, **this is the key indication of congestion**. A sequential disk that is 100% of the available time busy, has no time to do anything more, so even if the bandwidth or the number of operations executed by the disk is low, its capacity has been reached. + Of course, for newer disk technologies (like fusion cards) that are capable to execute multiple commands in parallel, this metric is just meaningless. +- Average I/O operation time (ms) + The average time for I/O requests issued to the device to be served. This includes the time spent by the requests in queue and the time spent servicing them. +- Average I/O operation size (kb) + The average amount of data of the completed I/O operations. +- Average Service Time (ms) + The average service time for completed I/O operations. This metric is calculated using the total busy time of the disk and the number of completed operations. If the disk is able to execute multiple parallel operations the reporting average service time will be misleading. +- Merged I/O operations/s + The Linux kernel is capable of merging I/O operations. So, if two requests to read data from the disk are adjacent, the Linux kernel may merge them to one before giving them to disk. This metric measures the number of operations that have been merged by the Linux kernel. +- Total I/O time + The sum of the duration of all completed I/O operations. This number can exceed the interval if the disk is able to execute multiple I/O operations in parallel. +- Space usage + For mounted disks, netdata will provide a chart for their space, with 3 dimensions: + 1. free + 2. used + 3. reserved for root +- inode usage + For mounted disks, netdata will provide a chart for their inodes (number of file and directories), with 3 dimensions: + 1. free + 2. used + 3. reserved for root + +### disk names netdata will automatically set the name of disks on the dashboard, from the mount point they are mounted, of course only when they are mounted. Changes in mount points are not currently detected (you will have to restart netdata to change the name of the disk). ---- - -## performance metrics +### performance metrics By default netdata will enable monitoring metrics only when they are not zero. If they are constantly zero they are ignored. Metrics that will start having values, after netdata is started, will be detected and charts will be automatically added to the dashboard (a refresh of the dashboard is needed for them to appear though). @@ -198,3 +167,76 @@ So, to disable performance metrics for all loop devices you could add `performan performance metrics for disks with major 7 = no ``` +## Monitoring CPUs + +The `/proc/stat` module monitors CPU utilization, interrupts, context switches, processes started/running, thermal throttling, frequency, and idle states. It gathers this information from multiple files. + +If more than 50 cores are present in a system then CPU thermal throttling, frequency, and idle state charts are disabled. + +#### configuration + +`keep per core files open` option in the `[plugin:proc:/proc/stat]` configuration section allows reducing the number of file operations on multiple files. + +### CPU frequency + +The module shows the current CPU frequency as set by the `cpufreq` kernel +module. + +**Requirement:** +You need to have `CONFIG_CPU_FREQ` and (optionally) `CONFIG_CPU_FREQ_STAT` +enabled in your kernel. + +`cpufreq` interface provides two different ways of getting the information through `/sys/devices/system/cpu/cpu*/cpufreq/scaling_cur_freq` and `/sys/devices/system/cpu/cpu*/cpufreq/stats/time_in_state` files. The latter is more accurate so it is preferred in the module. `scaling_cur_freq` represents only the current CPU frequency, and doesn't account for any state changes which happen between updates. The module switches back and forth between these two methods if governor is changed. + +It produces one chart with multiple lines (one line per core). + +#### configuration + +`scaling_cur_freq filename to monitor` and `time_in_state filename to monitor` in the `[plugin:proc:/proc/stat]` configuration section + +### CPU idle states + +The module monitors the usage of CPU idle states. + +**Requirement:** +Your kernel needs to have `CONFIG_CPU_IDLE` enabled. + +It produces one stacked chart per CPU, showing the percentage of time spent in +each state. + +#### configuration + +`schedstat filename to monitor`, `cpuidle name filename to monitor`, and `cpuidle time filename to monitor` in the `[plugin:proc:/proc/stat]` configuration section + +## Linux Anti-DDoS + + + +--- +SYNPROXY is a TCP SYN packets proxy. It can be used to protect any TCP server (like a web server) from SYN floods and similar DDos attacks. + +SYNPROXY is a netfilter module, in the Linux kernel (since version 3.12). It is optimized to handle millions of packets per second utilizing all CPUs available without any concurrency locking between the connections. + +The net effect of this, is that the real servers will not notice any change during the attack. The valid TCP connections will pass through and served, while the attack will be stopped at the firewall. + +To use SYNPROXY on your firewall, please follow our setup guides: + + - **[Working with SYNPROXY](https://github.com/firehol/firehol/wiki/Working-with-SYNPROXY)** + - **[Working with SYNPROXY and traps](https://github.com/firehol/firehol/wiki/Working-with-SYNPROXY-and-traps)** + +### Real-time monitoring of Linux Anti-DDoS + +netdata is able to monitor in real-time (per second updates) the operation of the Linux Anti-DDoS protection. + +It visualizes 4 charts: + +1. TCP SYN Packets received on ports operated by SYNPROXY +2. TCP Cookies (valid, invalid, retransmits) +3. Connections Reopened +4. Entries used + +Example image: + + + +See Linux Anti-DDoS in action at: **[netdata demo site (with SYNPROXY enabled)](https://registry.my-netdata.io/#menu_netfilter_submenu_synproxy)** diff --git a/collectors/proc.plugin/proc_net_dev.c b/collectors/proc.plugin/proc_net_dev.c index 97cbc060a..1e426e977 100644 --- a/collectors/proc.plugin/proc_net_dev.c +++ b/collectors/proc.plugin/proc_net_dev.c @@ -66,7 +66,7 @@ static struct netdev { kernel_uint_t tcollisions; kernel_uint_t tcarrier; kernel_uint_t tcompressed; - kernel_uint_t speed_max; + kernel_uint_t speed; // charts RRDSET *st_bandwidth; @@ -96,6 +96,10 @@ static struct netdev { RRDDIM *rd_tcarrier; RRDDIM *rd_tcompressed; + usec_t speed_last_collected_usec; + char *filename_speed; + RRDSETVAR *chart_var_speed; + struct netdev *next; } *netdev_root = NULL, *netdev_last_used = NULL; @@ -139,7 +143,7 @@ static void netdev_charts_release(struct netdev *d) { d->rd_tcompressed = NULL; } -static void netdev_free_strings(struct netdev *d) { +static void netdev_free_chart_strings(struct netdev *d) { freez((void *)d->chart_type_net_bytes); freez((void *)d->chart_type_net_compressed); freez((void *)d->chart_type_net_drops); @@ -161,9 +165,10 @@ static void netdev_free_strings(struct netdev *d) { static void netdev_free(struct netdev *d) { netdev_charts_release(d); - netdev_free_strings(d); + netdev_free_chart_strings(d); freez((void *)d->name); + freez((void *)d->filename_speed); freez((void *)d); netdev_added--; } @@ -265,7 +270,7 @@ static inline void netdev_rename_cgroup(struct netdev *d, struct netdev_rename * info("CGROUP: renaming network interface '%s' as '%s' under '%s'", r->host_device, r->container_device, r->container_name); netdev_charts_release(d); - netdev_free_strings(d); + netdev_free_chart_strings(d); char buffer[RRD_ID_LENGTH_MAX + 1]; @@ -435,15 +440,21 @@ int do_proc_net_dev(int update_every, usec_t dt) { static procfile *ff = NULL; static int enable_new_interfaces = -1; static int do_bandwidth = -1, do_packets = -1, do_errors = -1, do_drops = -1, do_fifo = -1, do_compressed = -1, do_events = -1; - static char *path_to_sys_devices_virtual_net = NULL; - static char *path_to_sys_net_speed = NULL; + static char *path_to_sys_devices_virtual_net = NULL, *path_to_sys_class_net_speed = NULL, *proc_net_dev_filename = NULL; + static long long int dt_to_refresh_speed = 0; if(unlikely(enable_new_interfaces == -1)) { char filename[FILENAME_MAX + 1]; + snprintfz(filename, FILENAME_MAX, "%s%s", netdata_configured_host_prefix, (*netdata_configured_host_prefix)?"/proc/1/net/dev":"/proc/net/dev"); + proc_net_dev_filename = config_get(CONFIG_SECTION_PLUGIN_PROC_NETDEV, "filename to monitor", filename); + snprintfz(filename, FILENAME_MAX, "%s%s", netdata_configured_host_prefix, "/sys/devices/virtual/net/%s"); path_to_sys_devices_virtual_net = config_get(CONFIG_SECTION_PLUGIN_PROC_NETDEV, "path to get virtual interfaces", filename); + snprintfz(filename, FILENAME_MAX, "%s%s", netdata_configured_host_prefix, "/sys/class/net/%s/speed"); + path_to_sys_class_net_speed = config_get(CONFIG_SECTION_PLUGIN_PROC_NETDEV, "path to get net device speed", filename); + enable_new_interfaces = config_get_boolean_ondemand(CONFIG_SECTION_PLUGIN_PROC_NETDEV, "enable new interfaces detected at runtime", CONFIG_BOOLEAN_AUTO); do_bandwidth = config_get_boolean_ondemand(CONFIG_SECTION_PLUGIN_PROC_NETDEV, "bandwidth for all interfaces", CONFIG_BOOLEAN_AUTO); @@ -455,12 +466,13 @@ int do_proc_net_dev(int update_every, usec_t dt) { do_events = config_get_boolean_ondemand(CONFIG_SECTION_PLUGIN_PROC_NETDEV, "frames, collisions, carrier counters for all interfaces", CONFIG_BOOLEAN_AUTO); disabled_list = simple_pattern_create(config_get(CONFIG_SECTION_PLUGIN_PROC_NETDEV, "disable by default interfaces matching", "lo fireqos* *-ifb"), NULL, SIMPLE_PATTERN_EXACT); + + dt_to_refresh_speed = config_get_number(CONFIG_SECTION_PLUGIN_PROC_NETDEV, "refresh interface speed every seconds", 10) * USEC_PER_SEC; + if(dt_to_refresh_speed < 0) dt_to_refresh_speed = 0; } if(unlikely(!ff)) { - char filename[FILENAME_MAX + 1]; - snprintfz(filename, FILENAME_MAX, "%s%s", netdata_configured_host_prefix, (*netdata_configured_host_prefix)?"/proc/1/net/dev":"/proc/net/dev"); - ff = procfile_open(config_get(CONFIG_SECTION_PLUGIN_PROC_NETDEV, "filename to monitor", filename), " \t,:|", PROCFILE_FLAG_DEFAULT); + ff = procfile_open(proc_net_dev_filename, " \t,|", PROCFILE_FLAG_DEFAULT); if(unlikely(!ff)) return 1; } @@ -481,7 +493,11 @@ int do_proc_net_dev(int update_every, usec_t dt) { // require 17 words on each line if(unlikely(procfile_linewords(ff, l) < 17)) continue; - struct netdev *d = get_netdev(procfile_lineword(ff, l, 0)); + char *name = procfile_lineword(ff, l, 0); + size_t len = strlen(name); + if(name[len - 1] == ':') name[len - 1] = '\0'; + + struct netdev *d = get_netdev(name); d->updated = 1; netdev_found++; @@ -505,12 +521,10 @@ int do_proc_net_dev(int update_every, usec_t dt) { else d->virtual = 0; - // set nic speed if present if(likely(!d->virtual)) { - snprintfz(buffer, FILENAME_MAX, "%s/sys/class/net/%s/speed", netdata_configured_host_prefix, d->name); - path_to_sys_net_speed = config_get(CONFIG_SECTION_PLUGIN_PROC_NETDEV, "path to get net device speed", buffer); - int ret = read_single_number_file(path_to_sys_net_speed, (unsigned long long*)&d->speed_max); - if(ret) error("Cannot read '%s'.", path_to_sys_net_speed); + // set the filename to get the interface speed + snprintfz(buffer, FILENAME_MAX, path_to_sys_class_net_speed, d->name); + d->filename_speed = strdupz(buffer); } snprintfz(buffer, FILENAME_MAX, "plugin:proc:/proc/net/dev:%s", d->name); @@ -574,6 +588,17 @@ int do_proc_net_dev(int update_every, usec_t dt) { d->tcarrier = str2kernel_uint_t(procfile_lineword(ff, l, 15)); } + //info("PROC_NET_DEV: %s speed %zu, bytes %zu/%zu, packets %zu/%zu/%zu, errors %zu/%zu, drops %zu/%zu, fifo %zu/%zu, compressed %zu/%zu, rframe %zu, tcollisions %zu, tcarrier %zu" + // , d->name, d->speed + // , d->rbytes, d->tbytes + // , d->rpackets, d->tpackets, d->rmulticast + // , d->rerrors, d->terrors + // , d->rdrops, d->tdrops + // , d->rfifo, d->tfifo + // , d->rcompressed, d->tcompressed + // , d->rframe, d->tcollisions, d->tcarrier + // ); + // -------------------------------------------------------------------- if(unlikely((d->do_bandwidth == CONFIG_BOOLEAN_AUTO && (d->rbytes || d->tbytes)))) @@ -597,9 +622,6 @@ int do_proc_net_dev(int update_every, usec_t dt) { , RRDSET_TYPE_AREA ); - RRDSETVAR *nic_speed_max = rrdsetvar_custom_chart_variable_create(d->st_bandwidth, "nic_speed_max"); - if(nic_speed_max) rrdsetvar_custom_chart_variable_set(nic_speed_max, (calculated_number)d->speed_max); - d->rd_rbytes = rrddim_add(d->st_bandwidth, "received", NULL, 8, BITS_IN_A_KILOBIT, RRD_ALGORITHM_INCREMENTAL); d->rd_tbytes = rrddim_add(d->st_bandwidth, "sent", NULL, -8, BITS_IN_A_KILOBIT, RRD_ALGORITHM_INCREMENTAL); @@ -616,6 +638,35 @@ int do_proc_net_dev(int update_every, usec_t dt) { rrddim_set_by_pointer(d->st_bandwidth, d->rd_rbytes, (collected_number)d->rbytes); rrddim_set_by_pointer(d->st_bandwidth, d->rd_tbytes, (collected_number)d->tbytes); rrdset_done(d->st_bandwidth); + + // update the interface speed + if(d->filename_speed) { + d->speed_last_collected_usec += dt; + + if(unlikely(d->speed_last_collected_usec >= (usec_t)dt_to_refresh_speed)) { + + if(unlikely(!d->chart_var_speed)) { + d->chart_var_speed = rrdsetvar_custom_chart_variable_create(d->st_bandwidth, "nic_speed_max"); + if(!d->chart_var_speed) { + error("Cannot create interface %s chart variable 'nic_speed_max'. Will not update its speed anymore.", d->name); + freez(d->filename_speed); + d->filename_speed = NULL; + } + } + + if(d->filename_speed && d->chart_var_speed) { + if(read_single_number_file(d->filename_speed, (unsigned long long *) &d->speed)) { + error("Cannot refresh interface %s speed by reading '%s'. Will not update its speed anymore.", d->name, d->filename_speed); + freez(d->filename_speed); + d->filename_speed = NULL; + } + else { + rrdsetvar_custom_chart_variable_set(d->chart_var_speed, (calculated_number) d->speed); + d->speed_last_collected_usec = 0; + } + } + } + } } // -------------------------------------------------------------------- diff --git a/collectors/proc.plugin/proc_net_stat_conntrack.c b/collectors/proc.plugin/proc_net_stat_conntrack.c index f5257c0a0..642e33f8e 100644 --- a/collectors/proc.plugin/proc_net_stat_conntrack.c +++ b/collectors/proc.plugin/proc_net_stat_conntrack.c @@ -50,7 +50,7 @@ int do_proc_net_stat_conntrack(int update_every, usec_t dt) { if(!do_sockets && !read_full) return 1; - rrdvar_max = rrdvar_custom_host_variable_create(localhost, "netfilter.conntrack.max"); + rrdvar_max = rrdvar_custom_host_variable_create(localhost, "netfilter_conntrack_max"); } if(likely(read_full)) { diff --git a/collectors/proc.plugin/proc_stat.c b/collectors/proc.plugin/proc_stat.c index fb77df647..931b415a5 100644..100755 --- a/collectors/proc.plugin/proc_stat.c +++ b/collectors/proc.plugin/proc_stat.c @@ -12,9 +12,23 @@ struct per_core_single_number_file { RRDDIM *rd; }; +struct last_ticks { + collected_number frequency; + collected_number ticks; +}; + +// This is an extension of struct per_core_single_number_file at CPU_FREQ_INDEX. +// Either scaling_cur_freq or time_in_state file is used at one time. +struct per_core_time_in_state_file { + const char *filename; + procfile *ff; + size_t last_ticks_len; + struct last_ticks *last_ticks; +}; + #define CORE_THROTTLE_COUNT_INDEX 0 #define PACKAGE_THROTTLE_COUNT_INDEX 1 -#define SCALING_CUR_FREQ_INDEX 2 +#define CPU_FREQ_INDEX 2 #define PER_CORE_FILES 3 struct cpu_chart { @@ -33,6 +47,8 @@ struct cpu_chart { RRDDIM *rd_guest_nice; struct per_core_single_number_file files[PER_CORE_FILES]; + + struct per_core_time_in_state_file time_in_state_files; }; static int keep_per_core_fds_open = CONFIG_BOOLEAN_YES; @@ -87,7 +103,6 @@ static int read_per_core_files(struct cpu_chart *all_cpu_charts, size_t len, siz f->found = 1; f->value = str2ll(buf, NULL); - // info("read '%s', parsed as " COLLECTED_NUMBER_FORMAT, buf, f->value); if(likely(f->value != 0)) files_nonzero++; } @@ -101,6 +116,112 @@ static int read_per_core_files(struct cpu_chart *all_cpu_charts, size_t len, siz return (int)files_nonzero; } +static int read_per_core_time_in_state_files(struct cpu_chart *all_cpu_charts, size_t len, size_t index) { + size_t x, files_read = 0, files_nonzero = 0; + + for(x = 0; x < len ; x++) { + struct per_core_single_number_file *f = &all_cpu_charts[x].files[index]; + struct per_core_time_in_state_file *tsf = &all_cpu_charts[x].time_in_state_files; + + f->found = 0; + + if(unlikely(!tsf->filename)) + continue; + + if(unlikely(!tsf->ff)) { + tsf->ff = procfile_open(tsf->filename, " \t:", PROCFILE_FLAG_DEFAULT); + if(unlikely(!tsf->ff)) + { + error("Cannot open file '%s'", tsf->filename); + continue; + } + } + + tsf->ff = procfile_readall(tsf->ff); + if(unlikely(!tsf->ff)) { + error("Cannot read file '%s'", tsf->filename); + procfile_close(tsf->ff); + tsf->ff = NULL; + continue; + } + else { + // successful read + + size_t lines = procfile_lines(tsf->ff), l; + size_t words; + unsigned long long total_ticks_since_last = 0, avg_freq = 0; + + // Check if there is at least one frequency in time_in_state + if (procfile_word(tsf->ff, 0)[0] == '\0') { + if(unlikely(keep_per_core_fds_open != CONFIG_BOOLEAN_YES)) { + procfile_close(tsf->ff); + tsf->ff = NULL; + } + // TODO: Is there a better way to avoid spikes than calculating the average over + // the whole period under schedutil governor? + // freez(tsf->last_ticks); + // tsf->last_ticks = NULL; + // tsf->last_ticks_len = 0; + continue; + } + + if (unlikely(tsf->last_ticks_len < lines || tsf->last_ticks == NULL)) { + tsf->last_ticks = reallocz(tsf->last_ticks, sizeof(struct last_ticks) * lines); + memset(tsf->last_ticks, 0, sizeof(struct last_ticks) * lines); + tsf->last_ticks_len = lines; + } + + f->value = 0; + + for(l = 0; l < lines - 1 ;l++) { + unsigned long long frequency = 0, ticks = 0, ticks_since_last = 0; + + words = procfile_linewords(tsf->ff, l); + if(unlikely(words < 2)) { + error("Cannot read time_in_state line. Expected 2 params, read %zu.", words); + continue; + } + frequency = str2ull(procfile_lineword(tsf->ff, l, 0)); + ticks = str2ull(procfile_lineword(tsf->ff, l, 1)); + + // It is assumed that frequencies are static and sorted + ticks_since_last = ticks - tsf->last_ticks[l].ticks; + tsf->last_ticks[l].frequency = frequency; + tsf->last_ticks[l].ticks = ticks; + + total_ticks_since_last += ticks_since_last; + avg_freq += frequency * ticks_since_last; + + } + + if (likely(total_ticks_since_last)) { + avg_freq /= total_ticks_since_last; + f->value = avg_freq; + } + + if(unlikely(keep_per_core_fds_open != CONFIG_BOOLEAN_YES)) { + procfile_close(tsf->ff); + tsf->ff = NULL; + } + } + + files_read++; + + f->found = 1; + + if(likely(f->value != 0)) + files_nonzero++; + } + + if(unlikely(files_read == 0)) + return -1; + + if(unlikely(files_nonzero == 0)) + return 0; + + return (int)files_nonzero; +} + static void chart_per_core_files(struct cpu_chart *all_cpu_charts, size_t len, size_t index, RRDSET *st, collected_number multiplier, collected_number divisor, RRD_ALGORITHM algorithm) { size_t x; for(x = 0; x < len ; x++) { @@ -122,10 +243,11 @@ int do_proc_stat(int update_every, usec_t dt) { static struct cpu_chart *all_cpu_charts = NULL; static size_t all_cpu_charts_size = 0; static procfile *ff = NULL; - static int do_cpu = -1, do_cpu_cores = -1, do_interrupts = -1, do_context = -1, do_forks = -1, do_processes = -1, do_core_throttle_count = -1, do_package_throttle_count = -1, do_scaling_cur_freq = -1; + static int do_cpu = -1, do_cpu_cores = -1, do_interrupts = -1, do_context = -1, do_forks = -1, do_processes = -1, do_core_throttle_count = -1, do_package_throttle_count = -1, do_cpu_freq = -1; static uint32_t hash_intr, hash_ctxt, hash_processes, hash_procs_running, hash_procs_blocked; - static char *core_throttle_count_filename = NULL, *package_throttle_count_filename = NULL, *scaling_cur_freq_filename = NULL; + static char *core_throttle_count_filename = NULL, *package_throttle_count_filename = NULL, *scaling_cur_freq_filename = NULL, *time_in_state_filename = NULL; static RRDVAR *cpus_var = NULL; + static int accurate_freq_avail = 0, accurate_freq_is_used = 0; size_t cores_found = (size_t)processors; if(unlikely(do_cpu == -1)) { @@ -137,25 +259,25 @@ int do_proc_stat(int update_every, usec_t dt) { do_processes = config_get_boolean("plugin:proc:/proc/stat", "processes running", CONFIG_BOOLEAN_YES); // give sane defaults based on the number of processors - if(processors > 50) { + if(unlikely(processors > 50)) { // the system has too many processors keep_per_core_fds_open = CONFIG_BOOLEAN_NO; do_core_throttle_count = CONFIG_BOOLEAN_NO; do_package_throttle_count = CONFIG_BOOLEAN_NO; - do_scaling_cur_freq = CONFIG_BOOLEAN_NO; + do_cpu_freq = CONFIG_BOOLEAN_NO; } else { // the system has a reasonable number of processors keep_per_core_fds_open = CONFIG_BOOLEAN_YES; do_core_throttle_count = CONFIG_BOOLEAN_AUTO; do_package_throttle_count = CONFIG_BOOLEAN_NO; - do_scaling_cur_freq = CONFIG_BOOLEAN_NO; + do_cpu_freq = CONFIG_BOOLEAN_YES; } keep_per_core_fds_open = config_get_boolean("plugin:proc:/proc/stat", "keep per core files open", keep_per_core_fds_open); do_core_throttle_count = config_get_boolean_ondemand("plugin:proc:/proc/stat", "core_throttle_count", do_core_throttle_count); do_package_throttle_count = config_get_boolean_ondemand("plugin:proc:/proc/stat", "package_throttle_count", do_package_throttle_count); - do_scaling_cur_freq = config_get_boolean_ondemand("plugin:proc:/proc/stat", "scaling_cur_freq", do_scaling_cur_freq); + do_cpu_freq = config_get_boolean_ondemand("plugin:proc:/proc/stat", "cpu frequency", do_cpu_freq); hash_intr = simple_hash("intr"); hash_ctxt = simple_hash("ctxt"); @@ -172,6 +294,9 @@ int do_proc_stat(int update_every, usec_t dt) { snprintfz(filename, FILENAME_MAX, "%s%s", netdata_configured_host_prefix, "/sys/devices/system/cpu/%s/cpufreq/scaling_cur_freq"); scaling_cur_freq_filename = config_get("plugin:proc:/proc/stat", "scaling_cur_freq filename to monitor", filename); + + snprintfz(filename, FILENAME_MAX, "%s%s", netdata_configured_host_prefix, "/sys/devices/system/cpu/%s/cpufreq/stats/time_in_state"); + time_in_state_filename = config_get("plugin:proc:/proc/stat", "time_in_state filename to monitor", filename); } if(unlikely(!ff)) { @@ -202,7 +327,7 @@ int do_proc_stat(int update_every, usec_t dt) { } size_t core = (row_key[3] == '\0') ? 0 : str2ul(&row_key[3]) + 1; - if(core > 0) cores_found = core; + if(likely(core > 0)) cores_found = core; if(likely((core == 0 && do_cpu) || (core > 0 && do_cpu_cores))) { char *id; @@ -227,7 +352,7 @@ int do_proc_stat(int update_every, usec_t dt) { char *title, *type, *context, *family; long priority; - if(core >= all_cpu_charts_size) { + if(unlikely(core >= all_cpu_charts_size)) { size_t old_cpu_charts_size = all_cpu_charts_size; all_cpu_charts_size = core + 1; all_cpu_charts = reallocz(all_cpu_charts, sizeof(struct cpu_chart) * all_cpu_charts_size); @@ -238,7 +363,7 @@ int do_proc_stat(int update_every, usec_t dt) { if(unlikely(!cpu_chart->st)) { cpu_chart->id = strdupz(id); - if(core == 0) { + if(unlikely(core == 0)) { title = "Total CPU utilization"; type = "system"; context = "system.cpu"; @@ -252,9 +377,6 @@ int do_proc_stat(int update_every, usec_t dt) { family = "utilization"; priority = NETDATA_CHART_PRIO_CPU_PER_CORE; - // TODO: check for /sys/devices/system/cpu/cpu*/cpufreq/scaling_cur_freq - // TODO: check for /sys/devices/system/cpu/cpu*/cpufreq/stats/time_in_state - char filename[FILENAME_MAX + 1]; struct stat stbuf; @@ -276,12 +398,23 @@ int do_proc_stat(int update_every, usec_t dt) { } } - if(do_scaling_cur_freq != CONFIG_BOOLEAN_NO) { + if(do_cpu_freq != CONFIG_BOOLEAN_NO) { + snprintfz(filename, FILENAME_MAX, scaling_cur_freq_filename, id); + + if (stat(filename, &stbuf) == 0) { + cpu_chart->files[CPU_FREQ_INDEX].filename = strdupz(filename); + cpu_chart->files[CPU_FREQ_INDEX].fd = -1; + do_cpu_freq = CONFIG_BOOLEAN_YES; + } + + snprintfz(filename, FILENAME_MAX, time_in_state_filename, id); + if (stat(filename, &stbuf) == 0) { - cpu_chart->files[SCALING_CUR_FREQ_INDEX].filename = strdupz(filename); - cpu_chart->files[SCALING_CUR_FREQ_INDEX].fd = -1; - do_scaling_cur_freq = CONFIG_BOOLEAN_YES; + cpu_chart->time_in_state_files.filename = strdupz(filename); + cpu_chart->time_in_state_files.ff = NULL; + do_cpu_freq = CONFIG_BOOLEAN_YES; + accurate_freq_avail = 1; } } } @@ -532,21 +665,40 @@ int do_proc_stat(int update_every, usec_t dt) { } } - if(likely(do_scaling_cur_freq != CONFIG_BOOLEAN_NO)) { - int r = read_per_core_files(&all_cpu_charts[1], all_cpu_charts_size - 1, SCALING_CUR_FREQ_INDEX); - if(likely(r != -1 && (do_scaling_cur_freq == CONFIG_BOOLEAN_YES || r > 0))) { - do_scaling_cur_freq = CONFIG_BOOLEAN_YES; + if(likely(do_cpu_freq != CONFIG_BOOLEAN_NO)) { + char filename[FILENAME_MAX + 1]; + int r = 0; + + if (accurate_freq_avail) { + r = read_per_core_time_in_state_files(&all_cpu_charts[1], all_cpu_charts_size - 1, CPU_FREQ_INDEX); + if(r > 0 && !accurate_freq_is_used) { + accurate_freq_is_used = 1; + snprintfz(filename, FILENAME_MAX, time_in_state_filename, "cpu*"); + info("cpufreq is using %s", filename); + } + } + if (r < 1) { + r = read_per_core_files(&all_cpu_charts[1], all_cpu_charts_size - 1, CPU_FREQ_INDEX); + if(accurate_freq_is_used) { + accurate_freq_is_used = 0; + snprintfz(filename, FILENAME_MAX, scaling_cur_freq_filename, "cpu*"); + info("cpufreq fell back to %s", filename); + } + } + + if(likely(r != -1 && (do_cpu_freq == CONFIG_BOOLEAN_YES || r > 0))) { + do_cpu_freq = CONFIG_BOOLEAN_YES; static RRDSET *st_scaling_cur_freq = NULL; if(unlikely(!st_scaling_cur_freq)) st_scaling_cur_freq = rrdset_create_localhost( "cpu" - , "scaling_cur_freq" + , "cpufreq" , NULL , "cpufreq" - , "cpu.scaling_cur_freq" - , "Per CPU Core, Current CPU Scaling Frequency" + , "cpufreq.cpufreq" + , "Current CPU Frequency" , "MHz" , PLUGIN_PROC_NAME , PLUGIN_PROC_MODULE_STAT_NAME @@ -557,7 +709,7 @@ int do_proc_stat(int update_every, usec_t dt) { else rrdset_next(st_scaling_cur_freq); - chart_per_core_files(&all_cpu_charts[1], all_cpu_charts_size - 1, SCALING_CUR_FREQ_INDEX, st_scaling_cur_freq, 1, 1000, RRD_ALGORITHM_ABSOLUTE); + chart_per_core_files(&all_cpu_charts[1], all_cpu_charts_size - 1, CPU_FREQ_INDEX, st_scaling_cur_freq, 1, 1000, RRD_ALGORITHM_ABSOLUTE); rrdset_done(st_scaling_cur_freq); } } diff --git a/collectors/python.d.plugin/Makefile.am b/collectors/python.d.plugin/Makefile.am index 5f214e436..984050c42 100644 --- a/collectors/python.d.plugin/Makefile.am +++ b/collectors/python.d.plugin/Makefile.am @@ -74,9 +74,11 @@ include monit/Makefile.inc include mysql/Makefile.inc include nginx/Makefile.inc include nginx_plus/Makefile.inc +include nvidia_smi/Makefile.inc include nsd/Makefile.inc include ntpd/Makefile.inc include ovpn_status_log/Makefile.inc +include openldap/Makefile.inc include phpfpm/Makefile.inc include portcheck/Makefile.inc include postfix/Makefile.inc @@ -95,6 +97,7 @@ include spigotmc/Makefile.inc include springboot/Makefile.inc include squid/Makefile.inc include tomcat/Makefile.inc +include tor/Makefile.inc include traefik/Makefile.inc include unbound/Makefile.inc include uwsgi/Makefile.inc diff --git a/collectors/python.d.plugin/Makefile.in b/collectors/python.d.plugin/Makefile.in index ca2743d58..495606896 100644 --- a/collectors/python.d.plugin/Makefile.in +++ b/collectors/python.d.plugin/Makefile.in @@ -400,6 +400,24 @@ # IT IS INCLUDED BY ITS PARENT'S Makefile.am # IT IS REQUIRED TO REFERENCE ALL FILES RELATIVE TO THE PARENT +# SPDX-License-Identifier: GPL-3.0-or-later + +# THIS IS NOT A COMPLETE Makefile +# IT IS INCLUDED BY ITS PARENT'S Makefile.am +# IT IS REQUIRED TO REFERENCE ALL FILES RELATIVE TO THE PARENT + +# SPDX-License-Identifier: GPL-3.0-or-later + +# THIS IS NOT A COMPLETE Makefile +# IT IS INCLUDED BY ITS PARENT'S Makefile.am +# IT IS REQUIRED TO REFERENCE ALL FILES RELATIVE TO THE PARENT + +# SPDX-License-Identifier: GPL-3.0-or-later + +# THIS IS NOT A COMPLETE Makefile +# IT IS INCLUDED BY ITS PARENT'S Makefile.am +# IT IS REQUIRED TO REFERENCE ALL FILES RELATIVE TO THE PARENT + VPATH = @srcdir@ am__is_gnu_make = test -n '$(MAKEFILE_LIST)' && test -n '$(MAKELEVEL)' @@ -489,10 +507,12 @@ DIST_COMMON = $(top_srcdir)/build/subst.inc \ $(srcdir)/memcached/Makefile.inc \ $(srcdir)/mongodb/Makefile.inc $(srcdir)/monit/Makefile.inc \ $(srcdir)/mysql/Makefile.inc $(srcdir)/nginx/Makefile.inc \ - $(srcdir)/nginx_plus/Makefile.inc $(srcdir)/nsd/Makefile.inc \ + $(srcdir)/nginx_plus/Makefile.inc \ + $(srcdir)/nvidia_smi/Makefile.inc $(srcdir)/nsd/Makefile.inc \ $(srcdir)/ntpd/Makefile.inc \ $(srcdir)/ovpn_status_log/Makefile.inc \ - $(srcdir)/phpfpm/Makefile.inc $(srcdir)/portcheck/Makefile.inc \ + $(srcdir)/openldap/Makefile.inc $(srcdir)/phpfpm/Makefile.inc \ + $(srcdir)/portcheck/Makefile.inc \ $(srcdir)/postfix/Makefile.inc $(srcdir)/postgres/Makefile.inc \ $(srcdir)/powerdns/Makefile.inc \ $(srcdir)/proxysql/Makefile.inc $(srcdir)/puppet/Makefile.inc \ @@ -503,14 +523,14 @@ DIST_COMMON = $(top_srcdir)/build/subst.inc \ $(srcdir)/smartd_log/Makefile.inc \ $(srcdir)/spigotmc/Makefile.inc \ $(srcdir)/springboot/Makefile.inc $(srcdir)/squid/Makefile.inc \ - $(srcdir)/tomcat/Makefile.inc $(srcdir)/traefik/Makefile.inc \ - $(srcdir)/unbound/Makefile.inc $(srcdir)/uwsgi/Makefile.inc \ - $(srcdir)/varnish/Makefile.inc $(srcdir)/w1sensor/Makefile.inc \ - $(srcdir)/web_log/Makefile.inc $(srcdir)/Makefile.in \ - $(srcdir)/Makefile.am $(dist_plugins_SCRIPTS) \ - $(dist_python_SCRIPTS) $(dist_bases_DATA) \ - $(dist_bases_framework_services_DATA) $(dist_libconfig_DATA) \ - $(dist_noinst_DATA) $(dist_python_DATA) \ + $(srcdir)/tomcat/Makefile.inc $(srcdir)/tor/Makefile.inc \ + $(srcdir)/traefik/Makefile.inc $(srcdir)/unbound/Makefile.inc \ + $(srcdir)/uwsgi/Makefile.inc $(srcdir)/varnish/Makefile.inc \ + $(srcdir)/w1sensor/Makefile.inc $(srcdir)/web_log/Makefile.inc \ + $(srcdir)/Makefile.in $(srcdir)/Makefile.am \ + $(dist_plugins_SCRIPTS) $(dist_python_SCRIPTS) \ + $(dist_bases_DATA) $(dist_bases_framework_services_DATA) \ + $(dist_libconfig_DATA) $(dist_noinst_DATA) $(dist_python_DATA) \ $(dist_python_urllib3_DATA) \ $(dist_python_urllib3_backports_DATA) \ $(dist_python_urllib3_contrib_DATA) \ @@ -903,6 +923,12 @@ dist_plugins_SCRIPTS = \ # do not install these files, but include them in the distribution # do not install these files, but include them in the distribution + +# do not install these files, but include them in the distribution + +# do not install these files, but include them in the distribution + +# do not install these files, but include them in the distribution dist_noinst_DATA = python.d.plugin.in README.md $(NULL) \ adaptec_raid/README.md adaptec_raid/Makefile.inc \ apache/README.md apache/Makefile.inc beanstalk/README.md \ @@ -931,26 +957,29 @@ dist_noinst_DATA = python.d.plugin.in README.md $(NULL) \ memcached/Makefile.inc mongodb/README.md mongodb/Makefile.inc \ monit/README.md monit/Makefile.inc mysql/README.md \ mysql/Makefile.inc nginx/README.md nginx/Makefile.inc \ - nginx_plus/README.md nginx_plus/Makefile.inc nsd/README.md \ + nginx_plus/README.md nginx_plus/Makefile.inc \ + nvidia_smi/README.md nvidia_smi/Makefile.inc nsd/README.md \ nsd/Makefile.inc ntpd/README.md ntpd/Makefile.inc \ ovpn_status_log/README.md ovpn_status_log/Makefile.inc \ - phpfpm/README.md phpfpm/Makefile.inc portcheck/README.md \ - portcheck/Makefile.inc postfix/README.md postfix/Makefile.inc \ - postgres/README.md postgres/Makefile.inc powerdns/README.md \ - powerdns/Makefile.inc proxysql/README.md proxysql/Makefile.inc \ - puppet/README.md puppet/Makefile.inc rabbitmq/README.md \ - rabbitmq/Makefile.inc redis/README.md redis/Makefile.inc \ - rethinkdbs/README.md rethinkdbs/Makefile.inc \ - retroshare/README.md retroshare/Makefile.inc samba/README.md \ - samba/Makefile.inc sensors/README.md sensors/Makefile.inc \ - smartd_log/README.md smartd_log/Makefile.inc \ - spigotmc/README.md spigotmc/Makefile.inc springboot/README.md \ + openldap/README.md openldap/Makefile.inc phpfpm/README.md \ + phpfpm/Makefile.inc portcheck/README.md portcheck/Makefile.inc \ + postfix/README.md postfix/Makefile.inc postgres/README.md \ + postgres/Makefile.inc powerdns/README.md powerdns/Makefile.inc \ + proxysql/README.md proxysql/Makefile.inc puppet/README.md \ + puppet/Makefile.inc rabbitmq/README.md rabbitmq/Makefile.inc \ + redis/README.md redis/Makefile.inc rethinkdbs/README.md \ + rethinkdbs/Makefile.inc retroshare/README.md \ + retroshare/Makefile.inc samba/README.md samba/Makefile.inc \ + sensors/README.md sensors/Makefile.inc smartd_log/README.md \ + smartd_log/Makefile.inc spigotmc/README.md \ + spigotmc/Makefile.inc springboot/README.md \ springboot/Makefile.inc squid/README.md squid/Makefile.inc \ - tomcat/README.md tomcat/Makefile.inc traefik/README.md \ - traefik/Makefile.inc unbound/README.md unbound/Makefile.inc \ - uwsgi/README.md uwsgi/Makefile.inc varnish/README.md \ - varnish/Makefile.inc w1sensor/README.md w1sensor/Makefile.inc \ - web_log/README.md web_log/Makefile.inc + tomcat/README.md tomcat/Makefile.inc tor/README.md \ + tor/Makefile.inc traefik/README.md traefik/Makefile.inc \ + unbound/README.md unbound/Makefile.inc uwsgi/README.md \ + uwsgi/Makefile.inc varnish/README.md varnish/Makefile.inc \ + w1sensor/README.md w1sensor/Makefile.inc web_log/README.md \ + web_log/Makefile.inc dist_python_SCRIPTS = \ $(NULL) @@ -1082,6 +1111,12 @@ dist_python_SCRIPTS = \ # install these files # install these files + +# install these files + +# install these files + +# install these files dist_python_DATA = $(NULL) adaptec_raid/adaptec_raid.chart.py \ apache/apache.chart.py beanstalk/beanstalk.chart.py \ bind_rndc/bind_rndc.chart.py boinc/boinc.chart.py \ @@ -1101,17 +1136,19 @@ dist_python_DATA = $(NULL) adaptec_raid/adaptec_raid.chart.py \ mdstat/mdstat.chart.py megacli/megacli.chart.py \ memcached/memcached.chart.py mongodb/mongodb.chart.py \ monit/monit.chart.py mysql/mysql.chart.py nginx/nginx.chart.py \ - nginx_plus/nginx_plus.chart.py nsd/nsd.chart.py \ - ntpd/ntpd.chart.py ovpn_status_log/ovpn_status_log.chart.py \ - phpfpm/phpfpm.chart.py portcheck/portcheck.chart.py \ - postfix/postfix.chart.py postgres/postgres.chart.py \ - powerdns/powerdns.chart.py proxysql/proxysql.chart.py \ - puppet/puppet.chart.py rabbitmq/rabbitmq.chart.py \ - redis/redis.chart.py rethinkdbs/rethinkdbs.chart.py \ - retroshare/retroshare.chart.py samba/samba.chart.py \ - sensors/sensors.chart.py smartd_log/smartd_log.chart.py \ - spigotmc/spigotmc.chart.py springboot/springboot.chart.py \ - squid/squid.chart.py tomcat/tomcat.chart.py \ + nginx_plus/nginx_plus.chart.py nvidia_smi/nvidia_smi.chart.py \ + nsd/nsd.chart.py ntpd/ntpd.chart.py \ + ovpn_status_log/ovpn_status_log.chart.py \ + openldap/openldap.chart.py phpfpm/phpfpm.chart.py \ + portcheck/portcheck.chart.py postfix/postfix.chart.py \ + postgres/postgres.chart.py powerdns/powerdns.chart.py \ + proxysql/proxysql.chart.py puppet/puppet.chart.py \ + rabbitmq/rabbitmq.chart.py redis/redis.chart.py \ + rethinkdbs/rethinkdbs.chart.py retroshare/retroshare.chart.py \ + samba/samba.chart.py sensors/sensors.chart.py \ + smartd_log/smartd_log.chart.py spigotmc/spigotmc.chart.py \ + springboot/springboot.chart.py squid/squid.chart.py \ + tomcat/tomcat.chart.py tor/tor.chart.py \ traefik/traefik.chart.py unbound/unbound.chart.py \ uwsgi/uwsgi.chart.py varnish/varnish.chart.py \ w1sensor/w1sensor.chart.py web_log/web_log.chart.py @@ -1138,8 +1175,9 @@ dist_pythonconfig_DATA = $(top_srcdir)/installer/.keep $(NULL) \ litespeed/litespeed.conf logind/logind.conf mdstat/mdstat.conf \ megacli/megacli.conf memcached/memcached.conf \ mongodb/mongodb.conf monit/monit.conf mysql/mysql.conf \ - nginx/nginx.conf nginx_plus/nginx_plus.conf nsd/nsd.conf \ - ntpd/ntpd.conf ovpn_status_log/ovpn_status_log.conf \ + nginx/nginx.conf nginx_plus/nginx_plus.conf \ + nvidia_smi/nvidia_smi.conf nsd/nsd.conf ntpd/ntpd.conf \ + ovpn_status_log/ovpn_status_log.conf openldap/openldap.conf \ phpfpm/phpfpm.conf portcheck/portcheck.conf \ postfix/postfix.conf postgres/postgres.conf \ powerdns/powerdns.conf proxysql/proxysql.conf \ @@ -1148,8 +1186,8 @@ dist_pythonconfig_DATA = $(top_srcdir)/installer/.keep $(NULL) \ samba/samba.conf sensors/sensors.conf \ smartd_log/smartd_log.conf spigotmc/spigotmc.conf \ springboot/springboot.conf squid/squid.conf tomcat/tomcat.conf \ - traefik/traefik.conf unbound/unbound.conf uwsgi/uwsgi.conf \ - varnish/varnish.conf w1sensor/w1sensor.conf \ + tor/tor.conf traefik/traefik.conf unbound/unbound.conf \ + uwsgi/uwsgi.conf varnish/varnish.conf w1sensor/w1sensor.conf \ web_log/web_log.conf pythonmodulesdir = $(pythondir)/python_modules dist_pythonmodules_DATA = \ @@ -1296,7 +1334,7 @@ all: all-am .SUFFIXES: .SUFFIXES: .in -$(srcdir)/Makefile.in: @MAINTAINER_MODE_TRUE@ $(srcdir)/Makefile.am $(top_srcdir)/build/subst.inc $(srcdir)/adaptec_raid/Makefile.inc $(srcdir)/apache/Makefile.inc $(srcdir)/beanstalk/Makefile.inc $(srcdir)/bind_rndc/Makefile.inc $(srcdir)/boinc/Makefile.inc $(srcdir)/ceph/Makefile.inc $(srcdir)/chrony/Makefile.inc $(srcdir)/couchdb/Makefile.inc $(srcdir)/cpufreq/Makefile.inc $(srcdir)/cpuidle/Makefile.inc $(srcdir)/dnsdist/Makefile.inc $(srcdir)/dns_query_time/Makefile.inc $(srcdir)/dockerd/Makefile.inc $(srcdir)/dovecot/Makefile.inc $(srcdir)/elasticsearch/Makefile.inc $(srcdir)/example/Makefile.inc $(srcdir)/exim/Makefile.inc $(srcdir)/fail2ban/Makefile.inc $(srcdir)/freeradius/Makefile.inc $(srcdir)/go_expvar/Makefile.inc $(srcdir)/haproxy/Makefile.inc $(srcdir)/hddtemp/Makefile.inc $(srcdir)/httpcheck/Makefile.inc $(srcdir)/icecast/Makefile.inc $(srcdir)/ipfs/Makefile.inc $(srcdir)/isc_dhcpd/Makefile.inc $(srcdir)/linux_power_supply/Makefile.inc $(srcdir)/litespeed/Makefile.inc $(srcdir)/logind/Makefile.inc $(srcdir)/mdstat/Makefile.inc $(srcdir)/megacli/Makefile.inc $(srcdir)/memcached/Makefile.inc $(srcdir)/mongodb/Makefile.inc $(srcdir)/monit/Makefile.inc $(srcdir)/mysql/Makefile.inc $(srcdir)/nginx/Makefile.inc $(srcdir)/nginx_plus/Makefile.inc $(srcdir)/nsd/Makefile.inc $(srcdir)/ntpd/Makefile.inc $(srcdir)/ovpn_status_log/Makefile.inc $(srcdir)/phpfpm/Makefile.inc $(srcdir)/portcheck/Makefile.inc $(srcdir)/postfix/Makefile.inc $(srcdir)/postgres/Makefile.inc $(srcdir)/powerdns/Makefile.inc $(srcdir)/proxysql/Makefile.inc $(srcdir)/puppet/Makefile.inc $(srcdir)/rabbitmq/Makefile.inc $(srcdir)/redis/Makefile.inc $(srcdir)/rethinkdbs/Makefile.inc $(srcdir)/retroshare/Makefile.inc $(srcdir)/samba/Makefile.inc $(srcdir)/sensors/Makefile.inc $(srcdir)/smartd_log/Makefile.inc $(srcdir)/spigotmc/Makefile.inc $(srcdir)/springboot/Makefile.inc $(srcdir)/squid/Makefile.inc $(srcdir)/tomcat/Makefile.inc $(srcdir)/traefik/Makefile.inc $(srcdir)/unbound/Makefile.inc $(srcdir)/uwsgi/Makefile.inc $(srcdir)/varnish/Makefile.inc $(srcdir)/w1sensor/Makefile.inc $(srcdir)/web_log/Makefile.inc $(am__configure_deps) +$(srcdir)/Makefile.in: @MAINTAINER_MODE_TRUE@ $(srcdir)/Makefile.am $(top_srcdir)/build/subst.inc $(srcdir)/adaptec_raid/Makefile.inc $(srcdir)/apache/Makefile.inc $(srcdir)/beanstalk/Makefile.inc $(srcdir)/bind_rndc/Makefile.inc $(srcdir)/boinc/Makefile.inc $(srcdir)/ceph/Makefile.inc $(srcdir)/chrony/Makefile.inc $(srcdir)/couchdb/Makefile.inc $(srcdir)/cpufreq/Makefile.inc $(srcdir)/cpuidle/Makefile.inc $(srcdir)/dnsdist/Makefile.inc $(srcdir)/dns_query_time/Makefile.inc $(srcdir)/dockerd/Makefile.inc $(srcdir)/dovecot/Makefile.inc $(srcdir)/elasticsearch/Makefile.inc $(srcdir)/example/Makefile.inc $(srcdir)/exim/Makefile.inc $(srcdir)/fail2ban/Makefile.inc $(srcdir)/freeradius/Makefile.inc $(srcdir)/go_expvar/Makefile.inc $(srcdir)/haproxy/Makefile.inc $(srcdir)/hddtemp/Makefile.inc $(srcdir)/httpcheck/Makefile.inc $(srcdir)/icecast/Makefile.inc $(srcdir)/ipfs/Makefile.inc $(srcdir)/isc_dhcpd/Makefile.inc $(srcdir)/linux_power_supply/Makefile.inc $(srcdir)/litespeed/Makefile.inc $(srcdir)/logind/Makefile.inc $(srcdir)/mdstat/Makefile.inc $(srcdir)/megacli/Makefile.inc $(srcdir)/memcached/Makefile.inc $(srcdir)/mongodb/Makefile.inc $(srcdir)/monit/Makefile.inc $(srcdir)/mysql/Makefile.inc $(srcdir)/nginx/Makefile.inc $(srcdir)/nginx_plus/Makefile.inc $(srcdir)/nvidia_smi/Makefile.inc $(srcdir)/nsd/Makefile.inc $(srcdir)/ntpd/Makefile.inc $(srcdir)/ovpn_status_log/Makefile.inc $(srcdir)/openldap/Makefile.inc $(srcdir)/phpfpm/Makefile.inc $(srcdir)/portcheck/Makefile.inc $(srcdir)/postfix/Makefile.inc $(srcdir)/postgres/Makefile.inc $(srcdir)/powerdns/Makefile.inc $(srcdir)/proxysql/Makefile.inc $(srcdir)/puppet/Makefile.inc $(srcdir)/rabbitmq/Makefile.inc $(srcdir)/redis/Makefile.inc $(srcdir)/rethinkdbs/Makefile.inc $(srcdir)/retroshare/Makefile.inc $(srcdir)/samba/Makefile.inc $(srcdir)/sensors/Makefile.inc $(srcdir)/smartd_log/Makefile.inc $(srcdir)/spigotmc/Makefile.inc $(srcdir)/springboot/Makefile.inc $(srcdir)/squid/Makefile.inc $(srcdir)/tomcat/Makefile.inc $(srcdir)/tor/Makefile.inc $(srcdir)/traefik/Makefile.inc $(srcdir)/unbound/Makefile.inc $(srcdir)/uwsgi/Makefile.inc $(srcdir)/varnish/Makefile.inc $(srcdir)/w1sensor/Makefile.inc $(srcdir)/web_log/Makefile.inc $(am__configure_deps) @for dep in $?; do \ case '$(am__configure_deps)' in \ *$$dep*) \ @@ -1317,7 +1355,7 @@ Makefile: $(srcdir)/Makefile.in $(top_builddir)/config.status echo ' cd $(top_builddir) && $(SHELL) ./config.status $(subdir)/$@ $(am__depfiles_maybe)'; \ cd $(top_builddir) && $(SHELL) ./config.status $(subdir)/$@ $(am__depfiles_maybe);; \ esac; -$(top_srcdir)/build/subst.inc $(srcdir)/adaptec_raid/Makefile.inc $(srcdir)/apache/Makefile.inc $(srcdir)/beanstalk/Makefile.inc $(srcdir)/bind_rndc/Makefile.inc $(srcdir)/boinc/Makefile.inc $(srcdir)/ceph/Makefile.inc $(srcdir)/chrony/Makefile.inc $(srcdir)/couchdb/Makefile.inc $(srcdir)/cpufreq/Makefile.inc $(srcdir)/cpuidle/Makefile.inc $(srcdir)/dnsdist/Makefile.inc $(srcdir)/dns_query_time/Makefile.inc $(srcdir)/dockerd/Makefile.inc $(srcdir)/dovecot/Makefile.inc $(srcdir)/elasticsearch/Makefile.inc $(srcdir)/example/Makefile.inc $(srcdir)/exim/Makefile.inc $(srcdir)/fail2ban/Makefile.inc $(srcdir)/freeradius/Makefile.inc $(srcdir)/go_expvar/Makefile.inc $(srcdir)/haproxy/Makefile.inc $(srcdir)/hddtemp/Makefile.inc $(srcdir)/httpcheck/Makefile.inc $(srcdir)/icecast/Makefile.inc $(srcdir)/ipfs/Makefile.inc $(srcdir)/isc_dhcpd/Makefile.inc $(srcdir)/linux_power_supply/Makefile.inc $(srcdir)/litespeed/Makefile.inc $(srcdir)/logind/Makefile.inc $(srcdir)/mdstat/Makefile.inc $(srcdir)/megacli/Makefile.inc $(srcdir)/memcached/Makefile.inc $(srcdir)/mongodb/Makefile.inc $(srcdir)/monit/Makefile.inc $(srcdir)/mysql/Makefile.inc $(srcdir)/nginx/Makefile.inc $(srcdir)/nginx_plus/Makefile.inc $(srcdir)/nsd/Makefile.inc $(srcdir)/ntpd/Makefile.inc $(srcdir)/ovpn_status_log/Makefile.inc $(srcdir)/phpfpm/Makefile.inc $(srcdir)/portcheck/Makefile.inc $(srcdir)/postfix/Makefile.inc $(srcdir)/postgres/Makefile.inc $(srcdir)/powerdns/Makefile.inc $(srcdir)/proxysql/Makefile.inc $(srcdir)/puppet/Makefile.inc $(srcdir)/rabbitmq/Makefile.inc $(srcdir)/redis/Makefile.inc $(srcdir)/rethinkdbs/Makefile.inc $(srcdir)/retroshare/Makefile.inc $(srcdir)/samba/Makefile.inc $(srcdir)/sensors/Makefile.inc $(srcdir)/smartd_log/Makefile.inc $(srcdir)/spigotmc/Makefile.inc $(srcdir)/springboot/Makefile.inc $(srcdir)/squid/Makefile.inc $(srcdir)/tomcat/Makefile.inc $(srcdir)/traefik/Makefile.inc $(srcdir)/unbound/Makefile.inc $(srcdir)/uwsgi/Makefile.inc $(srcdir)/varnish/Makefile.inc $(srcdir)/w1sensor/Makefile.inc $(srcdir)/web_log/Makefile.inc: +$(top_srcdir)/build/subst.inc $(srcdir)/adaptec_raid/Makefile.inc $(srcdir)/apache/Makefile.inc $(srcdir)/beanstalk/Makefile.inc $(srcdir)/bind_rndc/Makefile.inc $(srcdir)/boinc/Makefile.inc $(srcdir)/ceph/Makefile.inc $(srcdir)/chrony/Makefile.inc $(srcdir)/couchdb/Makefile.inc $(srcdir)/cpufreq/Makefile.inc $(srcdir)/cpuidle/Makefile.inc $(srcdir)/dnsdist/Makefile.inc $(srcdir)/dns_query_time/Makefile.inc $(srcdir)/dockerd/Makefile.inc $(srcdir)/dovecot/Makefile.inc $(srcdir)/elasticsearch/Makefile.inc $(srcdir)/example/Makefile.inc $(srcdir)/exim/Makefile.inc $(srcdir)/fail2ban/Makefile.inc $(srcdir)/freeradius/Makefile.inc $(srcdir)/go_expvar/Makefile.inc $(srcdir)/haproxy/Makefile.inc $(srcdir)/hddtemp/Makefile.inc $(srcdir)/httpcheck/Makefile.inc $(srcdir)/icecast/Makefile.inc $(srcdir)/ipfs/Makefile.inc $(srcdir)/isc_dhcpd/Makefile.inc $(srcdir)/linux_power_supply/Makefile.inc $(srcdir)/litespeed/Makefile.inc $(srcdir)/logind/Makefile.inc $(srcdir)/mdstat/Makefile.inc $(srcdir)/megacli/Makefile.inc $(srcdir)/memcached/Makefile.inc $(srcdir)/mongodb/Makefile.inc $(srcdir)/monit/Makefile.inc $(srcdir)/mysql/Makefile.inc $(srcdir)/nginx/Makefile.inc $(srcdir)/nginx_plus/Makefile.inc $(srcdir)/nvidia_smi/Makefile.inc $(srcdir)/nsd/Makefile.inc $(srcdir)/ntpd/Makefile.inc $(srcdir)/ovpn_status_log/Makefile.inc $(srcdir)/openldap/Makefile.inc $(srcdir)/phpfpm/Makefile.inc $(srcdir)/portcheck/Makefile.inc $(srcdir)/postfix/Makefile.inc $(srcdir)/postgres/Makefile.inc $(srcdir)/powerdns/Makefile.inc $(srcdir)/proxysql/Makefile.inc $(srcdir)/puppet/Makefile.inc $(srcdir)/rabbitmq/Makefile.inc $(srcdir)/redis/Makefile.inc $(srcdir)/rethinkdbs/Makefile.inc $(srcdir)/retroshare/Makefile.inc $(srcdir)/samba/Makefile.inc $(srcdir)/sensors/Makefile.inc $(srcdir)/smartd_log/Makefile.inc $(srcdir)/spigotmc/Makefile.inc $(srcdir)/springboot/Makefile.inc $(srcdir)/squid/Makefile.inc $(srcdir)/tomcat/Makefile.inc $(srcdir)/tor/Makefile.inc $(srcdir)/traefik/Makefile.inc $(srcdir)/unbound/Makefile.inc $(srcdir)/uwsgi/Makefile.inc $(srcdir)/varnish/Makefile.inc $(srcdir)/w1sensor/Makefile.inc $(srcdir)/web_log/Makefile.inc: $(top_builddir)/config.status: $(top_srcdir)/configure $(CONFIG_STATUS_DEPENDENCIES) cd $(top_builddir) && $(MAKE) $(AM_MAKEFLAGS) am--refresh diff --git a/collectors/python.d.plugin/README.md b/collectors/python.d.plugin/README.md index df24cd18f..673fc2c99 100644 --- a/collectors/python.d.plugin/README.md +++ b/collectors/python.d.plugin/README.md @@ -9,6 +9,20 @@ 5. Allows each **module** to have one or more data collection **jobs** 6. Each **job** is collecting one or more metrics from a single data source +## Pull Request Checklist for Python Plugins + +This is a generic checklist for submitting a new Python plugin for Netdata. It is by no means comprehensive. + +At minimum, to be buildable and testable, the PR needs to include: + +* The module itself, following proper naming conventions: `python.d/<module_dir>/<module_name>.chart.py` +* A README.md file for the plugin under `python.d/<module_dir>`. +* The configuration file for the module: `conf.d/python.d/<module_name>.conf`. Python config files are in YAML format, and should include comments describing what options are present. The instructions are also needed in the configuration section of the README.md +* A basic configuration for the plugin in the appropriate global config file: `conf.d/python.d.conf`, which is also in YAML format. Either add a line that reads `# <module_name>: yes` if the module is to be enabled by default, or one that reads `<module_name>: no` if it is to be disabled by default. +* A line for the plugin in `python.d/Makefile.am` under `dist_python_DATA`. +* A line for the plugin configuration file in `conf.d/Makefile.am`, under `dist_pythonconfig_DATA` +* Optionally, chart information in `web/dashboard_info.js`. This generally involves specifying a name and icon for the section, and may include descriptions for the section or individual charts. + ## Disclaimer @@ -60,7 +74,7 @@ Writing new python module is simple. You just need to remember to include 5 majo - **_get_data** method - all code needs to be compatible with Python 2 (**≥ 2.7**) *and* 3 (**≥ 3.1**) -If you plan to submit the module in a PR, make sure and go through the [PR checklist for new modules](https://github.com/netdata/netdata/wiki/New-Module-PR-Checklist) beforehand to make sure you have updated all the files you need to. +If you plan to submit the module in a PR, make sure and go through the [PR checklist for new modules](#pull-request-checklist-for-python-plugins) beforehand to make sure you have updated all the files you need to. ### Global variables `ORDER` and `CHART` @@ -195,4 +209,4 @@ Sockets are accessed in non-blocking mode with 15 second timeout. After every execution of `_get_raw_data` socket is closed, to prevent this module needs to set `_keep_alive` variable to `True` and implement custom `_check_raw_data` method. -`_check_raw_data` should take raw data and return `True` if all data is received otherwise it should return `False`. Also it should do it in fast and efficient way.
\ No newline at end of file +`_check_raw_data` should take raw data and return `True` if all data is received otherwise it should return `False`. Also it should do it in fast and efficient way. diff --git a/collectors/python.d.plugin/beanstalk/beanstalk.conf b/collectors/python.d.plugin/beanstalk/beanstalk.conf index 940801877..3b11d9192 100644 --- a/collectors/python.d.plugin/beanstalk/beanstalk.conf +++ b/collectors/python.d.plugin/beanstalk/beanstalk.conf @@ -72,7 +72,7 @@ # autodetection_retry: 0 # the JOB's re-check interval in seconds # chart_cleanup: 10 # the JOB's chart cleanup interval in iterations # -# Additionally to the above, apache also supports the following: +# Additionally to the above, beanstalk also supports the following: # # host: 'host' # Server ip address or hostname. Default: 127.0.0.1 # port: port # Beanstalkd port. Default: diff --git a/collectors/python.d.plugin/elasticsearch/README.md b/collectors/python.d.plugin/elasticsearch/README.md index 75e17015b..7ce6c0b74 100644 --- a/collectors/python.d.plugin/elasticsearch/README.md +++ b/collectors/python.d.plugin/elasticsearch/README.md @@ -49,8 +49,8 @@ Sample: ```yaml local: - host : 'ipaddress' # Server ip address or hostname - port : 'password' # Port on which elasticsearch listed + host : 'ipaddress' # Elasticsearch server ip address or hostname + port : 'port' # Port on which elasticsearch listens cluster_health : True/False # Calls to cluster health elasticsearch API. Enabled by default. cluster_stats : True/False # Calls to cluster stats elasticsearch API. Enabled by default. ``` diff --git a/collectors/python.d.plugin/go_expvar/README.md b/collectors/python.d.plugin/go_expvar/README.md index 6309c195f..e3356e1f1 100644 --- a/collectors/python.d.plugin/go_expvar/README.md +++ b/collectors/python.d.plugin/go_expvar/README.md @@ -192,7 +192,7 @@ See [this issue](https://github.com/netdata/netdata/pull/1902#issuecomment-28449 Please see these two links to the official netdata documentation for more information about the values: - [External plugins - charts](../../plugins.d/#chart) -- [Chart variables](https://github.com/netdata/netdata/wiki/How-to-write-new-module#global-variables-order-and-chart) +- [Chart variables](../#global-variables-order-and-chart) **Line definitions** diff --git a/collectors/python.d.plugin/go_expvar/go_expvar.conf b/collectors/python.d.plugin/go_expvar/go_expvar.conf index ba8922d2e..af89158aa 100644 --- a/collectors/python.d.plugin/go_expvar/go_expvar.conf +++ b/collectors/python.d.plugin/go_expvar/go_expvar.conf @@ -76,7 +76,7 @@ # # Please visit the module wiki page for more information on how to use the extra_charts variable: # -# https://github.com/netdata/netdata/wiki/Monitoring-Go-Applications#monitoring-custom-vars-with-go_expvar +# https://github.com/netdata/netdata/tree/master/collectors/python.d.plugin/go_expvar # # Configuration example # --------------------- diff --git a/collectors/python.d.plugin/nvidia_smi/Makefile.inc b/collectors/python.d.plugin/nvidia_smi/Makefile.inc new file mode 100644 index 000000000..c23bd2517 --- /dev/null +++ b/collectors/python.d.plugin/nvidia_smi/Makefile.inc @@ -0,0 +1,12 @@ +# SPDX-License-Identifier: GPL-3.0-or-later + +# THIS IS NOT A COMPLETE Makefile +# IT IS INCLUDED BY ITS PARENT'S Makefile.am +# IT IS REQUIRED TO REFERENCE ALL FILES RELATIVE TO THE PARENT + +# install these files +dist_python_DATA += nvidia_smi/nvidia_smi.chart.py +dist_pythonconfig_DATA += nvidia_smi/nvidia_smi.conf + +# do not install these files, but include them in the distribution +dist_noinst_DATA += nvidia_smi/README.md nvidia_smi/Makefile.inc diff --git a/collectors/python.d.plugin/nvidia_smi/README.md b/collectors/python.d.plugin/nvidia_smi/README.md new file mode 100644 index 000000000..06acfc297 --- /dev/null +++ b/collectors/python.d.plugin/nvidia_smi/README.md @@ -0,0 +1,39 @@ +# nvidia_smi + +This module monitors the `nvidia-smi` cli tool. + +**Requirements and Notes:** + + * You must have the `nvidia-smi` tool installed and your NVIDIA GPU(s) must support the tool. Mostly the newer high end models used for AI / ML and Crypto or Pro range, read more about [nvidia_smi](https://developer.nvidia.com/nvidia-system-management-interface). + + * You must enable this plugin as its disabled by default due to minor performance issues. + + * On some systems when the GPU is idle the `nvidia-smi` tool unloads and there is added latency again when it is next queried. If you are running GPUs under constant workload this isn't likely to be an issue. + + * Currently the `nvidia-smi` tool is being queried via cli. Updating the plugin to use the nvidia c/c++ API directly should resolve this issue. See discussion here: https://github.com/netdata/netdata/pull/4357 + + * Contributions are welcome. + + * Make sure `netdata` user can execute `/usr/bin/nvidia-smi` or wherever your binary is. + + * `poll_seconds` is how often in seconds the tool is polled for as an integer. + +It produces: + +1. Per GPU + * GPU utilization + * memory allocation + * memory utilization + * fan speed + * power usage + * temperature + * clock speed + * PCI bandwidth + +### configuration + +Sample: + +```yaml +poll_seconds: 1 +```
\ No newline at end of file diff --git a/collectors/python.d.plugin/nvidia_smi/nvidia_smi.chart.py b/collectors/python.d.plugin/nvidia_smi/nvidia_smi.chart.py new file mode 100644 index 000000000..c3fff6219 --- /dev/null +++ b/collectors/python.d.plugin/nvidia_smi/nvidia_smi.chart.py @@ -0,0 +1,361 @@ +# -*- coding: utf-8 -*- +# Description: nvidia-smi netdata python.d module +# Original Author: Steven Noonan (tycho) +# Author: Ilya Mashchenko (l2isbad) + +import subprocess +import threading +import xml.etree.ElementTree as et + +from bases.collection import find_binary +from bases.FrameworkServices.SimpleService import SimpleService + +disabled_by_default = True + + +NVIDIA_SMI = 'nvidia-smi' + +EMPTY_ROW = '' +EMPTY_ROW_LIMIT = 500 +POLLER_BREAK_ROW = '</nvidia_smi_log>' + +PCI_BANDWIDTH = 'pci_bandwidth' +FAN_SPEED = 'fan_speed' +GPU_UTIL = 'gpu_utilization' +MEM_UTIL = 'mem_utilization' +ENCODER_UTIL = 'encoder_utilization' +MEM_ALLOCATED = 'mem_allocated' +TEMPERATURE = 'temperature' +CLOCKS = 'clocks' +POWER = 'power' + +ORDER = [ + PCI_BANDWIDTH, + FAN_SPEED, + GPU_UTIL, + MEM_UTIL, + ENCODER_UTIL, + MEM_ALLOCATED, + TEMPERATURE, + CLOCKS, + POWER, +] + + +def gpu_charts(gpu): + fam = gpu.full_name() + + charts = { + PCI_BANDWIDTH: { + 'options': [None, 'PCI Express Bandwidth Utilization', 'KB/s', fam, 'nvidia_smi.pci_bandwidth', 'area'], + 'lines': [ + ['rx_util', 'rx', 'absolute', 1, 1], + ['tx_util', 'tx', 'absolute', 1, -1], + ] + }, + FAN_SPEED: { + 'options': [None, 'Fan Speed', '%', fam, 'nvidia_smi.fan_speed', 'line'], + 'lines': [ + ['fan_speed', 'speed'], + ] + }, + GPU_UTIL: { + 'options': [None, 'GPU Utilization', '%', fam, 'nvidia_smi.gpu_utilization', 'line'], + 'lines': [ + ['gpu_util', 'utilization'], + ] + }, + MEM_UTIL: { + 'options': [None, 'Memory Bandwidth Utilization', '%', fam, 'nvidia_smi.mem_utilization', 'line'], + 'lines': [ + ['memory_util', 'utilization'], + ] + }, + ENCODER_UTIL: { + 'options': [None, 'Encoder/Decoder Utilization', '%', fam, 'nvidia_smi.encoder_utilization', 'line'], + 'lines': [ + ['encoder_util', 'encoder'], + ['decoder_util', 'decoder'], + ] + }, + MEM_ALLOCATED: { + 'options': [None, 'Memory Allocated', 'MB', fam, 'nvidia_smi.memory_allocated', 'line'], + 'lines': [ + ['fb_memory_usage', 'used'], + ] + }, + TEMPERATURE: { + 'options': [None, 'Temperature', 'celsius', fam, 'nvidia_smi.temperature', 'line'], + 'lines': [ + ['gpu_temp', 'temp'], + ] + }, + CLOCKS: { + 'options': [None, 'Clock Frequencies', 'MHz', fam, 'nvidia_smi.clocks', 'line'], + 'lines': [ + ['graphics_clock', 'graphics'], + ['video_clock', 'video'], + ['sm_clock', 'sm'], + ['mem_clock', 'mem'], + ] + }, + POWER: { + 'options': [None, 'Power Utilization', 'Watts', fam, 'nvidia_smi.power', 'line'], + 'lines': [ + ['power_draw', 'power', 1, 100], + ] + }, + } + + idx = gpu.num + + order = ['gpu{0}_{1}'.format(idx, v) for v in ORDER] + charts = dict(('gpu{0}_{1}'.format(idx, k), v) for k, v in charts.items()) + + for chart in charts.values(): + for line in chart['lines']: + line[0] = 'gpu{0}_{1}'.format(idx, line[0]) + + return order, charts + + +class NvidiaSMI: + def __init__(self): + self.command = find_binary(NVIDIA_SMI) + self.active_proc = None + + def run_once(self): + proc = subprocess.Popen([self.command, '-x', '-q'], stdout=subprocess.PIPE) + stdout, _ = proc.communicate() + return stdout + + def run_loop(self, interval): + if self.active_proc: + self.kill() + proc = subprocess.Popen([self.command, '-x', '-q', '-l', str(interval)], stdout=subprocess.PIPE) + self.active_proc = proc + return proc.stdout + + def kill(self): + if self.active_proc: + self.active_proc.kill() + self.active_proc = None + + +class NvidiaSMIPoller(threading.Thread): + def __init__(self, poll_interval): + threading.Thread.__init__(self) + self.daemon = True + + self.smi = NvidiaSMI() + self.interval = poll_interval + + self.lock = threading.RLock() + self.last_data = str() + self.exit = False + self.empty_rows = 0 + self.rows = list() + + def has_smi(self): + return bool(self.smi.command) + + def run_once(self): + return self.smi.run_once() + + def run(self): + out = self.smi.run_loop(self.interval) + + for row in out: + if self.exit or self.empty_rows > EMPTY_ROW_LIMIT: + break + self.process_row(row) + self.smi.kill() + + def process_row(self, row): + row = row.decode() + self.empty_rows += (row == EMPTY_ROW) + self.rows.append(row) + + if POLLER_BREAK_ROW in row: + self.lock.acquire() + self.last_data = '\n'.join(self.rows) + self.lock.release() + + self.rows = list() + self.empty_rows = 0 + + def is_started(self): + return self.ident is not None + + def shutdown(self): + self.exit = True + + def data(self): + self.lock.acquire() + data = self.last_data + self.lock.release() + return data + + +def handle_attr_error(method): + def on_call(*args, **kwargs): + try: + return method(*args, **kwargs) + except AttributeError: + return None + return on_call + + +class GPU: + def __init__(self, num, root): + self.num = num + self.root = root + + def id(self): + return self.root.get('id') + + def name(self): + return self.root.find('product_name').text + + def full_name(self): + return 'gpu{0} {1}'.format(self.num, self.name()) + + @handle_attr_error + def rx_util(self): + return self.root.find('pci').find('rx_util').text.split()[0] + + @handle_attr_error + def tx_util(self): + return self.root.find('pci').find('tx_util').text.split()[0] + + @handle_attr_error + def fan_speed(self): + return self.root.find('fan_speed').text.split()[0] + + @handle_attr_error + def gpu_util(self): + return self.root.find('utilization').find('gpu_util').text.split()[0] + + @handle_attr_error + def memory_util(self): + return self.root.find('utilization').find('memory_util').text.split()[0] + + @handle_attr_error + def encoder_util(self): + return self.root.find('utilization').find('encoder_util').text.split()[0] + + @handle_attr_error + def decoder_util(self): + return self.root.find('utilization').find('decoder_util').text.split()[0] + + @handle_attr_error + def fb_memory_usage(self): + return self.root.find('fb_memory_usage').find('used').text.split()[0] + + @handle_attr_error + def temperature(self): + return self.root.find('temperature').find('gpu_temp').text.split()[0] + + @handle_attr_error + def graphics_clock(self): + return self.root.find('clocks').find('graphics_clock').text.split()[0] + + @handle_attr_error + def video_clock(self): + return self.root.find('clocks').find('video_clock').text.split()[0] + + @handle_attr_error + def sm_clock(self): + return self.root.find('clocks').find('sm_clock').text.split()[0] + + @handle_attr_error + def mem_clock(self): + return self.root.find('clocks').find('mem_clock').text.split()[0] + + @handle_attr_error + def power_draw(self): + return float(self.root.find('power_readings').find('power_draw').text.split()[0]) * 100 + + def data(self): + data = { + 'rx_util': self.rx_util(), + 'tx_util': self.tx_util(), + 'fan_speed': self.fan_speed(), + 'gpu_util': self.gpu_util(), + 'memory_util': self.memory_util(), + 'encoder_util': self.encoder_util(), + 'decoder_util': self.decoder_util(), + 'fb_memory_usage': self.fb_memory_usage(), + 'gpu_temp': self.temperature(), + 'graphics_clock': self.graphics_clock(), + 'video_clock': self.video_clock(), + 'sm_clock': self.sm_clock(), + 'mem_clock': self.mem_clock(), + 'power_draw': self.power_draw(), + } + + return dict(('gpu{0}_{1}'.format(self.num, k), v) for k, v in data.items() if v is not None) + + +class Service(SimpleService): + def __init__(self, configuration=None, name=None): + super(Service, self).__init__(configuration=configuration, name=name) + self.order = list() + self.definitions = dict() + + poll = int(configuration.get('poll_seconds', 1)) + self.poller = NvidiaSMIPoller(poll) + + def get_data(self): + if not self.poller.is_alive(): + self.debug('poller is off') + return None + + last_data = self.poller.data() + + parsed = self.parse_xml(last_data) + if parsed is None: + return None + + data = dict() + for idx, root in enumerate(parsed.findall('gpu')): + data.update(GPU(idx, root).data()) + + return data or None + + def check(self): + if not self.poller.has_smi(): + self.error("couldn't find '{0}' binary".format(NVIDIA_SMI)) + return False + + raw_data = self.poller.run_once() + if not raw_data: + self.error("failed to invoke '{0}' binary".format(NVIDIA_SMI)) + return False + + parsed = self.parse_xml(raw_data) + if parsed is None: + return False + + gpus = parsed.findall('gpu') + if not gpus: + return False + + self.create_charts(gpus) + self.poller.start() + + return True + + def parse_xml(self, data): + try: + return et.fromstring(data) + except et.ParseError as error: + self.error(error) + + return None + + def create_charts(self, gpus): + for idx, root in enumerate(gpus): + order, charts = gpu_charts(GPU(idx, root)) + self.order.extend(order) + self.definitions.update(charts) diff --git a/collectors/python.d.plugin/nvidia_smi/nvidia_smi.conf b/collectors/python.d.plugin/nvidia_smi/nvidia_smi.conf new file mode 100644 index 000000000..e1bcf3faf --- /dev/null +++ b/collectors/python.d.plugin/nvidia_smi/nvidia_smi.conf @@ -0,0 +1,68 @@ +# netdata python.d.plugin configuration for nvidia_smi +# +# This file is in YaML format. Generally the format is: +# +# name: value +# +# There are 2 sections: +# - global variables +# - one or more JOBS +# +# JOBS allow you to collect values from multiple sources. +# Each source will have its own set of charts. +# +# JOB parameters have to be indented (using spaces only, example below). + +# ---------------------------------------------------------------------- +# Global Variables +# These variables set the defaults for all JOBs, however each JOB +# may define its own, overriding the defaults. + +# update_every sets the default data collection frequency. +# If unset, the python.d.plugin default is used. +# update_every: 1 + +# priority controls the order of charts at the netdata dashboard. +# Lower numbers move the charts towards the top of the page. +# If unset, the default for python.d.plugin is used. +# priority: 60000 + +# retries sets the number of retries to be made in case of failures. +# If unset, the default for python.d.plugin is used. +# Attempts to restore the service are made once every update_every +# and only if the module has collected values in the past. +# retries: 60 + +# autodetection_retry sets the job re-check interval in seconds. +# The job is not deleted if check fails. +# Attempts to start the job are made once every autodetection_retry. +# This feature is disabled by default. +# autodetection_retry: 0 + +# ---------------------------------------------------------------------- +# JOBS (data collection sources) +# +# The default JOBS share the same *name*. JOBS with the same name +# are mutually exclusive. Only one of them will be allowed running at +# any time. This allows autodetection to try several alternatives and +# pick the one that works. +# +# Any number of jobs is supported. +# +# All python.d.plugin JOBS (for all its modules) support a set of +# predefined parameters. These are: +# +# job_name: +# name: myname # the JOB's name as it will appear at the +# # dashboard (by default is the job_name) +# # JOBs sharing a name are mutually exclusive +# update_every: 1 # the JOB's data collection frequency +# priority: 60000 # the JOB's order on the dashboard +# retries: 60 # the JOB's number of restoration attempts +# autodetection_retry: 0 # the JOB's re-check interval in seconds +# +# Additionally to the above, example also supports the following: +# +# poll_seconds: SECONDS # default is 1. Sets the frequency of seconds the nvidia-smi tool is polled. +# +# ---------------------------------------------------------------------- diff --git a/collectors/python.d.plugin/openldap/Makefile.inc b/collectors/python.d.plugin/openldap/Makefile.inc new file mode 100644 index 000000000..dc947e214 --- /dev/null +++ b/collectors/python.d.plugin/openldap/Makefile.inc @@ -0,0 +1,13 @@ +# SPDX-License-Identifier: GPL-3.0-or-later + +# THIS IS NOT A COMPLETE Makefile +# IT IS INCLUDED BY ITS PARENT'S Makefile.am +# IT IS REQUIRED TO REFERENCE ALL FILES RELATIVE TO THE PARENT + +# install these files +dist_python_DATA += openldap/openldap.chart.py +dist_pythonconfig_DATA += openldap/openldap.conf + +# do not install these files, but include them in the distribution +dist_noinst_DATA += openldap/README.md openldap/Makefile.inc + diff --git a/collectors/python.d.plugin/openldap/README.md b/collectors/python.d.plugin/openldap/README.md new file mode 100644 index 000000000..938535bca --- /dev/null +++ b/collectors/python.d.plugin/openldap/README.md @@ -0,0 +1,57 @@ +# openldap + +This module provides statistics information from openldap (slapd) server. +Statistics are taken from LDAP monitoring interface. Manual page, slapd-monitor(5) is available. + +**Requirement:** +* Follow instructions from https://www.openldap.org/doc/admin24/monitoringslapd.html to activate monitoring interface. +* Install python ldap module `pip install ldap` or `yum install python-ldap` +* Modify openldap.conf with your credentials + +### Module gives information with following charts: + +1. **connections** + * total connections number + +2. **Bytes** + * sent + +3. **operations** + * completed + * initiated + +4. **referrals** + * sent + +5. **entries** + * sent + +6. **ldap operations** + * bind + * search + * unbind + * add + * delete + * modify + * compare + +7. **waiters** + * read + * write + + + +### configuration + +Sample: + +```yaml +openldap: + name : 'local' + username : "cn=monitor,dc=superb,dc=eu" + password : "testpass" + server : 'localhost' + port : 389 +``` + +--- diff --git a/collectors/python.d.plugin/openldap/openldap.chart.py b/collectors/python.d.plugin/openldap/openldap.chart.py new file mode 100644 index 000000000..6342d3863 --- /dev/null +++ b/collectors/python.d.plugin/openldap/openldap.chart.py @@ -0,0 +1,204 @@ +# -*- coding: utf-8 -*- +# Description: openldap netdata python.d module +# Author: Manolis Kartsonakis (ekartsonakis) +# SPDX-License-Identifier: GPL-3.0+ + +try: + import ldap + HAS_LDAP = True +except ImportError: + HAS_LDAP = False + +from bases.FrameworkServices.SimpleService import SimpleService + +# default module values (can be overridden per job in `config`) +priority = 60000 + +DEFAULT_SERVER = 'localhost' +DEFAULT_PORT = '389' +DEFAULT_TIMEOUT = 1 + +ORDER = [ + 'total_connections', + 'bytes_sent', + 'operations', + 'referrals_sent', + 'entries_sent', + 'ldap_operations', + 'waiters' +] + +CHARTS = { + 'total_connections': { + 'options': [None, 'Total Connections', 'connections/s', 'ldap', 'openldap.total_connections', 'line'], + 'lines': [ + ['total_connections', 'connections', 'incremental'] + ] + }, + 'bytes_sent': { + 'options': [None, 'Traffic', 'KB/s', 'ldap', 'openldap.traffic_stats', 'line'], + 'lines': [ + ['bytes_sent', 'sent', 'incremental', 1, 1024] + ] + }, + 'operations': { + 'options': [None, 'Operations Status', 'ops/s', 'ldap', 'openldap.operations_status', 'line'], + 'lines': [ + ['completed_operations', 'completed', 'incremental'], + ['initiated_operations', 'initiated', 'incremental'] + ] + }, + 'referrals_sent': { + 'options': [None, 'Referrals', 'referals/s', 'ldap', 'openldap.referrals', 'line'], + 'lines': [ + ['referrals_sent', 'sent', 'incremental'] + ] + }, + 'entries_sent': { + 'options': [None, 'Entries', 'entries/s', 'ldap', 'openldap.entries', 'line'], + 'lines': [ + ['entries_sent', 'sent', 'incremental'] + ] + }, + 'ldap_operations': { + 'options': [None, 'Operations', 'ops/s', 'ldap', 'openldap.ldap_operations', 'line'], + 'lines': [ + ['bind_operations', 'bind', 'incremental'], + ['search_operations', 'search', 'incremental'], + ['unbind_operations', 'unbind', 'incremental'], + ['add_operations', 'add', 'incremental'], + ['delete_operations', 'delete', 'incremental'], + ['modify_operations', 'modify', 'incremental'], + ['compare_operations', 'compare', 'incremental'] + ] + }, + 'waiters': { + 'options': [None, 'Waiters', 'waiters/s', 'ldap', 'openldap.waiters', 'line'], + 'lines': [ + ['write_waiters', 'write', 'incremental'], + ['read_waiters', 'read', 'incremental'] + ] + }, +} + +# Stuff to gather - make tuples of DN dn and attrib to get +SEARCH_LIST = { + 'total_connections': ( + 'cn=Total,cn=Connections,cn=Monitor', 'monitorCounter', + ), + 'bytes_sent': ( + 'cn=Bytes,cn=Statistics,cn=Monitor', 'monitorCounter', + ), + 'completed_operations': ( + 'cn=Operations,cn=Monitor', 'monitorOpCompleted', + ), + 'initiated_operations': ( + 'cn=Operations,cn=Monitor', 'monitorOpInitiated', + ), + 'referrals_sent': ( + 'cn=Referrals,cn=Statistics,cn=Monitor', 'monitorCounter', + ), + 'entries_sent': ( + 'cn=Entries,cn=Statistics,cn=Monitor', 'monitorCounter', + ), + 'bind_operations': ( + 'cn=Bind,cn=Operations,cn=Monitor', 'monitorOpCompleted', + ), + 'unbind_operations': ( + 'cn=Unbind,cn=Operations,cn=Monitor', 'monitorOpCompleted', + ), + 'add_operations': ( + 'cn=Add,cn=Operations,cn=Monitor', 'monitorOpInitiated', + ), + 'delete_operations': ( + 'cn=Delete,cn=Operations,cn=Monitor', 'monitorOpCompleted', + ), + 'modify_operations': ( + 'cn=Modify,cn=Operations,cn=Monitor', 'monitorOpCompleted', + ), + 'compare_operations': ( + 'cn=Compare,cn=Operations,cn=Monitor', 'monitorOpCompleted', + ), + 'search_operations': ( + 'cn=Search,cn=Operations,cn=Monitor', 'monitorOpCompleted', + ), + 'write_waiters': ( + 'cn=Write,cn=Waiters,cn=Monitor', 'monitorCounter', + ), + 'read_waiters': ( + 'cn=Read,cn=Waiters,cn=Monitor', 'monitorCounter', + ), +} + + +class Service(SimpleService): + def __init__(self, configuration=None, name=None): + SimpleService.__init__(self, configuration=configuration, name=name) + self.order = ORDER + self.definitions = CHARTS + + self.server = configuration.get('server', DEFAULT_SERVER) + self.port = configuration.get('port', DEFAULT_PORT) + self.username = configuration.get('username') + self.password = configuration.get('password') + self.timeout = configuration.get('timeout', DEFAULT_TIMEOUT) + + self.alive = False + self.conn = None + + def disconnect(self): + if self.conn: + self.conn.unbind() + self.conn = None + self.alive = False + + def connect(self): + try: + self.conn = ldap.initialize('ldap://%s:%s' % (self.server, self.port)) + self.conn.set_option(ldap.OPT_NETWORK_TIMEOUT, self.timeout) + if self.username and self.password: + self.conn.simple_bind(self.username, self.password) + except ldap.LDAPError as error: + self.error(error) + return False + + self.alive = True + return True + + def reconnect(self): + self.disconnect() + return self.connect() + + def check(self): + if not HAS_LDAP: + self.error("'python-ldap' package is needed") + return None + + return self.connect() and self.get_data() + + def get_data(self): + if not self.alive and not self.reconnect(): + return None + + data = dict() + for key in SEARCH_LIST: + dn = SEARCH_LIST[key][0] + attr = SEARCH_LIST[key][1] + try: + num = self.conn.search(dn, ldap.SCOPE_BASE, 'objectClass=*', [attr, ]) + result_type, result_data = self.conn.result(num, 1) + except ldap.LDAPError as error: + self.error("Empty result. Check bind username/password. Message: ",error) + self.alive = False + return None + + try: + if result_type == 101: + val = int(result_data[0][1].values()[0][0]) + except (ValueError, IndexError) as error: + self.debug(error) + continue + + data[key] = val + + return data diff --git a/collectors/python.d.plugin/openldap/openldap.conf b/collectors/python.d.plugin/openldap/openldap.conf new file mode 100644 index 000000000..662cc58c4 --- /dev/null +++ b/collectors/python.d.plugin/openldap/openldap.conf @@ -0,0 +1,74 @@ +# netdata python.d.plugin configuration for openldap +# +# This file is in YaML format. Generally the format is: +# +# name: value +# +# There are 2 sections: +# - global variables +# - one or more JOBS +# +# JOBS allow you to collect values from multiple sources. +# Each source will have its own set of charts. +# +# JOB parameters have to be indented (using spaces only, example below). + +# ---------------------------------------------------------------------- +# Global Variables +# These variables set the defaults for all JOBs, however each JOB +# may define its own, overriding the defaults. + +# update_every sets the default data collection frequency. +# If unset, the python.d.plugin default is used. +# postfix is slow, so once every 10 seconds +update_every: 10 + +# priority controls the order of charts at the netdata dashboard. +# Lower numbers move the charts towards the top of the page. +# If unset, the default for python.d.plugin is used. +# priority: 60000 + +# retries sets the number of retries to be made in case of failures. +# If unset, the default for python.d.plugin is used. +# Attempts to restore the service are made once every update_every +# and only if the module has collected values in the past. +# retries: 60 + +# autodetection_retry sets the job re-check interval in seconds. +# The job is not deleted if check fails. +# Attempts to start the job are made once every autodetection_retry. +# This feature is disabled by default. +# autodetection_retry: 0 + +# ---------------------------------------------------------------------- +# JOBS (data collection sources) +# +# The default JOBS share the same *name*. JOBS with the same name +# are mutually exclusive. Only one of them will be allowed running at +# any time. This allows autodetection to try several alternatives and +# pick the one that works. +# +# Any number of jobs is supported. +# +# All python.d.plugin JOBS (for all its modules) support a set of +# predefined parameters. These are: +# +# job_name: +# name: myname # the JOB's name as it will appear at the +# # dashboard (by default is the job_name) +# # JOBs sharing a name are mutually exclusive +# update_every: 1 # the JOB's data collection frequency +# priority: 60000 # the JOB's order on the dashboard +# retries: 60 # the JOB's number of restoration attempts +# autodetection_retry: 0 # the JOB's re-check interval in seconds +# +# ---------------------------------------------------------------------- +# OPENLDAP EXTRA PARAMETERS + +# Set here your LDAP connection settings + +#username : "cn=admin,dc=example,dc=com" # The bind user with right to access monitor statistics +#password : "yourpass" # The password for the binded user +#server : 'localhost' # The listening address of the LDAP server +#port : 389 # The listening port of the LDAP server +#timeout : 1 # Seconds to timeout if no connection exists
\ No newline at end of file diff --git a/collectors/python.d.plugin/python.d.conf b/collectors/python.d.plugin/python.d.conf index 97f4cb8d5..40c8c033f 100644 --- a/collectors/python.d.plugin/python.d.conf +++ b/collectors/python.d.plugin/python.d.conf @@ -67,11 +67,13 @@ logind: no # mysql: yes # nginx: yes # nginx_plus: yes +# nvidia_smi: yes # nginx_log has been replaced by web_log nginx_log: no # nsd: yes # ntpd: yes +# openldap: yes # ovpn_status_log: yes # phpfpm: yes # postfix: yes @@ -90,8 +92,9 @@ nginx_log: no # springboot: yes # squid: yes # tomcat: yes +# tor: yes unbound: no # uwsgi: yes # varnish: yes # w1sensor: yes -# web_log: yes +# web_log: yes
\ No newline at end of file diff --git a/collectors/python.d.plugin/python.d.plugin b/collectors/python.d.plugin/python.d.plugin index 264c3383d..efff22734 100644 --- a/collectors/python.d.plugin/python.d.plugin +++ b/collectors/python.d.plugin/python.d.plugin @@ -56,7 +56,7 @@ BASE_CONFIG = {'update_every': os.getenv('NETDATA_UPDATE_EVERY', 1), MODULE_EXTENSION = '.chart.py' -OBSOLETE_MODULES = ['apache_cache', 'gunicorn_log', 'nginx_log'] +OBSOLETE_MODULES = ['apache_cache', 'gunicorn_log', 'nginx_log', 'cpufreq'] def module_ok(m): diff --git a/collectors/python.d.plugin/python.d.plugin.in b/collectors/python.d.plugin/python.d.plugin.in index 7ac03fd99..8b55ad41b 100755 --- a/collectors/python.d.plugin/python.d.plugin.in +++ b/collectors/python.d.plugin/python.d.plugin.in @@ -56,7 +56,7 @@ BASE_CONFIG = {'update_every': os.getenv('NETDATA_UPDATE_EVERY', 1), MODULE_EXTENSION = '.chart.py' -OBSOLETE_MODULES = ['apache_cache', 'gunicorn_log', 'nginx_log'] +OBSOLETE_MODULES = ['apache_cache', 'gunicorn_log', 'nginx_log', 'cpufreq'] def module_ok(m): diff --git a/collectors/python.d.plugin/python_modules/third_party/lm_sensors.py b/collectors/python.d.plugin/python_modules/third_party/lm_sensors.py index f10cd6209..f873eac83 100644 --- a/collectors/python.d.plugin/python_modules/third_party/lm_sensors.py +++ b/collectors/python.d.plugin/python_modules/third_party/lm_sensors.py @@ -17,11 +17,79 @@ import ctypes.util _libc = cdll.LoadLibrary(ctypes.util.find_library("c")) # see https://github.com/paroj/sensors.py/issues/1 _libc.free.argtypes = [c_void_p] + _hdl = cdll.LoadLibrary(ctypes.util.find_library("sensors")) version = c_char_p.in_dll(_hdl, "libsensors_version").value.decode("ascii") +class SensorsError(Exception): + pass + + +class ErrorWildcards(SensorsError): + pass + + +class ErrorNoEntry(SensorsError): + pass + + +class ErrorAccessRead(SensorsError, OSError): + pass + + +class ErrorKernel(SensorsError, OSError): + pass + + +class ErrorDivZero(SensorsError, ZeroDivisionError): + pass + + +class ErrorChipName(SensorsError): + pass + + +class ErrorBusName(SensorsError): + pass + + +class ErrorParse(SensorsError): + pass + + +class ErrorAccessWrite(SensorsError, OSError): + pass + + +class ErrorIO(SensorsError, IOError): + pass + + +class ErrorRecursion(SensorsError): + pass + + +_ERR_MAP = { + 1: ErrorWildcards, + 2: ErrorNoEntry, + 3: ErrorAccessRead, + 4: ErrorKernel, + 5: ErrorDivZero, + 6: ErrorChipName, + 7: ErrorBusName, + 8: ErrorParse, + 9: ErrorAccessWrite, + 10: ErrorIO, + 11: ErrorRecursion +} + + +def raise_sensor_error(errno, message=''): + raise _ERR_MAP[abs(errno)](message) + + class bus_id(Structure): _fields_ = [("type", c_short), ("nr", c_short)] @@ -65,8 +133,8 @@ class subfeature(Structure): _hdl.sensors_get_detected_chips.restype = POINTER(chip_name) _hdl.sensors_get_features.restype = POINTER(feature) _hdl.sensors_get_all_subfeatures.restype = POINTER(subfeature) -_hdl.sensors_get_label.restype = c_void_p # return pointer instead of str so we can free it -_hdl.sensors_get_adapter_name.restype = c_char_p # docs do not say whether to free this or not +_hdl.sensors_get_label.restype = c_void_p # return pointer instead of str so we can free it +_hdl.sensors_get_adapter_name.restype = c_char_p # docs do not say whether to free this or not _hdl.sensors_strerror.restype = c_char_p ### RAW API ### @@ -78,8 +146,9 @@ COMPUTE_MAPPING = 4 def init(cfg_file=None): file = _libc.fopen(cfg_file.encode("utf-8"), "r") if cfg_file is not None else None - if _hdl.sensors_init(file) != 0: - raise Exception("sensors_init failed") + result = _hdl.sensors_init(file) + if result != 0: + raise_sensor_error(result, "sensors_init failed") if file is not None: _libc.fclose(file) @@ -94,7 +163,7 @@ def parse_chip_name(orig_name): err = _hdl.sensors_parse_chip_name(orig_name.encode("utf-8"), byref(ret)) if err < 0: - raise Exception(strerror(err)) + raise_sensor_error(err, strerror(err)) return ret @@ -129,7 +198,7 @@ def chip_snprintf_name(chip, buffer_size=200): err = _hdl.sensors_snprintf_chip_name(ret, buffer_size, byref(chip)) if err < 0: - raise Exception(strerror(err)) + raise_sensor_error(err, strerror(err)) return ret.value.decode("utf-8") @@ -140,7 +209,7 @@ def do_chip_sets(chip): """ err = _hdl.sensors_do_chip_sets(byref(chip)) if err < 0: - raise Exception(strerror(err)) + raise_sensor_error(err, strerror(err)) def get_adapter_name(bus): @@ -178,7 +247,7 @@ def get_value(chip, subfeature_nr): val = c_double() err = _hdl.sensors_get_value(byref(chip), subfeature_nr, byref(val)) if err < 0: - raise Exception(strerror(err)) + raise_sensor_error(err, strerror(err)) return val.value @@ -189,7 +258,7 @@ def set_value(chip, subfeature_nr, value): val = c_double(value) err = _hdl.sensors_set_value(byref(chip), subfeature_nr, byref(val)) if err < 0: - raise Exception(strerror(err)) + raise_sensor_error(err, strerror(err)) ### Convenience API ### @@ -213,7 +282,7 @@ class ChipIterator: if self.match is not None: free_chip_name(self.match) - def next(self): # python2 compability + def next(self): # python2 compability return self.__next__() @@ -233,7 +302,7 @@ class FeatureIterator: return feature - def next(self): # python2 compability + def next(self): # python2 compability return self.__next__() @@ -254,5 +323,5 @@ class SubFeatureIterator: return subfeature - def next(self): # python2 compability + def next(self): # python2 compability return self.__next__() diff --git a/collectors/python.d.plugin/sensors/sensors.chart.py b/collectors/python.d.plugin/sensors/sensors.chart.py index 69d2bfe99..d70af3b05 100644 --- a/collectors/python.d.plugin/sensors/sensors.chart.py +++ b/collectors/python.d.plugin/sensors/sensors.chart.py @@ -3,13 +3,22 @@ # Author: Pawel Krupa (paulfantom) # SPDX-License-Identifier: GPL-3.0-or-later -from bases.FrameworkServices.SimpleService import SimpleService from third_party import lm_sensors as sensors +from bases.FrameworkServices.SimpleService import SimpleService + # default module values (can be overridden per job in `config`) # update_every = 2 -ORDER = ['temperature', 'fan', 'voltage', 'current', 'power', 'energy', 'humidity'] +ORDER = [ + 'temperature', + 'fan', + 'voltage', + 'current', + 'power', + 'energy', + 'humidity', +] # This is a prototype of chart definition which is used to dynamically create self.definitions CHARTS = { @@ -94,16 +103,22 @@ class Service(SimpleService): prefix = sensors.chip_snprintf_name(chip) for feature in sensors.FeatureIterator(chip): sfi = sensors.SubFeatureIterator(chip, feature) + val = None for sf in sfi: - val = sensors.get_value(chip, sf.number) - break + try: + val = sensors.get_value(chip, sf.number) + break + except sensors.SensorsError: + continue + if val is None: + continue type_name = TYPE_MAP[feature.type] if type_name in LIMITS: limit = LIMITS[type_name] if val < limit[0] or val > limit[1]: continue data[prefix + '_' + str(feature.name.decode())] = int(val * 1000) - except Exception as error: + except sensors.SensorsError as error: self.error(error) return None @@ -117,8 +132,14 @@ class Service(SimpleService): continue for feature in sensors.FeatureIterator(chip): sfi = sensors.SubFeatureIterator(chip, feature) - vals = [sensors.get_value(chip, sf.number) for sf in sfi] - if vals[0] == 0: + vals = list() + for sf in sfi: + try: + vals.append(sensors.get_value(chip, sf.number)) + except sensors.SensorsError as error: + self.error('{0}: {1}'.format(sf.name, error)) + continue + if not vals or vals[0] == 0: continue if TYPE_MAP[feature.type] == sensor: # create chart @@ -137,7 +158,7 @@ class Service(SimpleService): def check(self): try: sensors.init() - except Exception as error: + except sensors.SensorsError as error: self.error(error) return False diff --git a/collectors/python.d.plugin/smartd_log/README.md b/collectors/python.d.plugin/smartd_log/README.md index 121a63573..a31ad0c7a 100644 --- a/collectors/python.d.plugin/smartd_log/README.md +++ b/collectors/python.d.plugin/smartd_log/README.md @@ -2,29 +2,92 @@ Module monitor `smartd` log files to collect HDD/SSD S.M.A.R.T attributes. -It produces following charts (you can add additional attributes in the module configuration file): +**Requirements:** +* `smartmontools` -1. **Read Error Rate** attribute 1 +It produces following charts for SCSI devices: -2. **Start/Stop Count** attribute 4 +1. **Read Error Corrected** -3. **Reallocated Sectors Count** attribute 5 +2. **Read Error Uncorrected** -4. **Seek Error Rate** attribute 7 +3. **Write Error Corrected** -5. **Power-On Hours Count** attribute 9 +4. **Write Error Uncorrected** -6. **Power Cycle Count** attribute 12 +5. **Verify Error Corrected** -7. **Load/Unload Cycles** attribute 193 +6. **Verify Error Uncorrected** -8. **Temperature** attribute 194 +7. **Temperature** -9. **Current Pending Sectors** attribute 197 -10. **Off-Line Uncorrectable** attribute 198 +For ATA devices: +1. **Read Error Rate** -11. **Write Error Rate** attribute 200 +2. **Seek Error Rate** + +3. **Soft Read Error Rate** + +4. **Write Error Rate** + +5. **SATA Interface Downshift** + +6. **UDMA CRC Error Count** + +7. **Throughput Performance** + +8. **Seek Time Performance** + +9. **Start/Stop Count** + +10. **Power-On Hours Count** + +11. **Power Cycle Count** + +12. **Unexpected Power Loss** + +13. **Spin-Up Time** + +14. **Spin-up Retries** + +15. **Calibration Retries** + +16. **Temperature** + +17. **Reallocated Sectors Count** + +18. **Reserved Block Count** + +19. **Program Fail Count** + +20. **Erase Fail Count** + +21. **Wear Leveller Worst Case Erase Count** + +22. **Unused Reserved NAND Blocks** + +23. **Reallocation Event Count** + +24. **Current Pending Sector Count** + +25. **Offline Uncorrectable Sector Count** + +26. **Percent Lifetime Used** + +### prerequisite +`smartd` must be running with `-A` option to write smartd attribute information to files. + +For this you need to set `smartd_opts` (or `SMARTD_ARGS`, check _smartd.service_ content) in `/etc/default/smartmontools`: + + +``` +# dump smartd attrs info every 600 seconds +smartd_opts="-A /var/log/smartd/ -i 600" +``` + + +`smartd` appends logs at every run. It's strongly recommended to use `logrotate` for smartd files. ### configuration @@ -33,6 +96,6 @@ local: log_path : '/var/log/smartd/' ``` -If no configuration is given, module will attempt to read log files in /var/log/smartd/ directory. +If no configuration is given, module will attempt to read log files in `/var/log/smartd/` directory. --- diff --git a/collectors/python.d.plugin/smartd_log/smartd_log.chart.py b/collectors/python.d.plugin/smartd_log/smartd_log.chart.py index 21dbccecc..13762fabe 100644 --- a/collectors/python.d.plugin/smartd_log/smartd_log.chart.py +++ b/collectors/python.d.plugin/smartd_log/smartd_log.chart.py @@ -6,182 +6,537 @@ import os import re -from collections import namedtuple +from copy import deepcopy from time import time from bases.collection import read_last_line from bases.FrameworkServices.SimpleService import SimpleService -# charts order (can be overridden if you want less charts, or different order) -ORDER = ['1', '4', '5', '7', '9', '12', '193', '194', '197', '198', '200'] - -SMART_ATTR = { - '1': 'Read Error Rate', - '2': 'Throughput Performance', - '3': 'Spin-Up Time', - '4': 'Start/Stop Count', - '5': 'Reallocated Sectors Count', - '6': 'Read Channel Margin', - '7': 'Seek Error Rate', - '8': 'Seek Time Performance', - '9': 'Power-On Hours Count', - '10': 'Spin-up Retries', - '11': 'Calibration Retries', - '12': 'Power Cycle Count', - '13': 'Soft Read Error Rate', - '100': 'Erase/Program Cycles', - '103': 'Translation Table Rebuild', - '108': 'Unknown (108)', - '170': 'Reserved Block Count', - '171': 'Program Fail Count', - '172': 'Erase Fail Count', - '173': 'Wear Leveller Worst Case Erase Count', - '174': 'Unexpected Power Loss', - '175': 'Program Fail Count', - '176': 'Erase Fail Count', - '177': 'Wear Leveling Count', - '178': 'Used Reserved Block Count', - '179': 'Used Reserved Block Count', - '180': 'Unused Reserved Block Count', - '181': 'Program Fail Count', - '182': 'Erase Fail Count', - '183': 'SATA Downshifts', - '184': 'End-to-End error', - '185': 'Head Stability', - '186': 'Induced Op-Vibration Detection', - '187': 'Reported Uncorrectable Errors', - '188': 'Command Timeout', - '189': 'High Fly Writes', - '190': 'Temperature', - '191': 'G-Sense Errors', - '192': 'Power-Off Retract Cycles', - '193': 'Load/Unload Cycles', - '194': 'Temperature', - '195': 'Hardware ECC Recovered', - '196': 'Reallocation Events', - '197': 'Current Pending Sectors', - '198': 'Off-line Uncorrectable', - '199': 'UDMA CRC Error Rate', - '200': 'Write Error Rate', - '201': 'Soft Read Errors', - '202': 'Data Address Mark Errors', - '203': 'Run Out Cancel', - '204': 'Soft ECC Corrections', - '205': 'Thermal Asperity Rate', - '206': 'Flying Height', - '207': 'Spin High Current', - '209': 'Offline Seek Performance', - '220': 'Disk Shift', - '221': 'G-Sense Error Rate', - '222': 'Loaded Hours', - '223': 'Load/Unload Retries', - '224': 'Load Friction', - '225': 'Load/Unload Cycles', - '226': 'Load-in Time', - '227': 'Torque Amplification Count', - '228': 'Power-Off Retracts', - '230': 'GMR Head Amplitude', - '231': 'Temperature', - '232': 'Available Reserved Space', - '233': 'Media Wearout Indicator', - '240': 'Head Flying Hours', - '241': 'Total LBAs Written', - '242': 'Total LBAs Read', - '250': 'Read Error Retry Rate' -} - -LIMIT = namedtuple('LIMIT', ['min', 'max']) - -LIMITS = { - '194': LIMIT(0, 200) -} -RESCAN_INTERVAL = 60 - -REGEX = re.compile( +INCREMENTAL = 'incremental' +ABSOLUTE = 'absolute' + +ATA = 'ata' +SCSI = 'scsi' +CSV = '.csv' + +DEF_RESCAN_INTERVAL = 60 +DEF_AGE = 30 +DEF_PATH = '/var/log/smartd' + +ATTR1 = '1' +ATTR2 = '2' +ATTR3 = '3' +ATTR4 = '4' +ATTR5 = '5' +ATTR7 = '7' +ATTR8 = '8' +ATTR9 = '9' +ATTR10 = '10' +ATTR11 = '11' +ATTR12 = '12' +ATTR13 = '13' +ATTR170 = '170' +ATTR171 = '171' +ATTR172 = '172' +ATTR173 = '173' +ATTR174 = '174' +ATTR180 = '180' +ATTR183 = '183' +ATTR190 = '190' +ATTR194 = '194' +ATTR196 = '196' +ATTR197 = '197' +ATTR198 = '198' +ATTR199 = '199' +ATTR202 = '202' +ATTR206 = '206' +ATTR_READ_ERR_COR = 'read-total-err-corrected' +ATTR_READ_ERR_UNC = 'read-total-unc-errors' +ATTR_WRITE_ERR_COR = 'write-total-err-corrected' +ATTR_WRITE_ERR_UNC = 'write-total-unc-errors' +ATTR_VERIFY_ERR_COR = 'verify-total-err-corrected' +ATTR_VERIFY_ERR_UNC = 'verify-total-unc-errors' +ATTR_TEMPERATURE = 'temperature' + + +RE_ATA = re.compile( '(\d+);' # attribute '(\d+);' # normalized value '(\d+)', # raw value re.X ) +RE_SCSI = re.compile( + '([a-z-]+);' # attribute + '([0-9.]+)', # raw value + re.X +) -def chart_template(chart_name): - units, attr_id = chart_name.split('_')[-2:] - title = '{value_type} {description}'.format(value_type=units.capitalize(), - description=SMART_ATTR[attr_id]) - family = SMART_ATTR[attr_id].lower() - - return { - chart_name: { - 'options': [None, title, units, family, 'smartd_log.' + chart_name, 'line'], - 'lines': [] - } +ORDER = [ + # errors + 'read_error_rate', + 'seek_error_rate', + 'soft_read_error_rate', + 'write_error_rate', + 'read_total_err_corrected', + 'read_total_unc_errors', + 'write_total_err_corrected', + 'write_total_unc_errors', + 'verify_total_err_corrected', + 'verify_total_unc_errors', + # external failure + 'sata_interface_downshift', + 'udma_crc_error_count', + # performance + 'throughput_performance', + 'seek_time_performance', + # power + 'start_stop_count', + 'power_on_hours_count', + 'power_cycle_count', + 'unexpected_power_loss', + # spin + 'spin_up_time', + 'spin_up_retries', + 'calibration_retries', + # temperature + 'airflow_temperature_celsius', + 'temperature_celsius', + # wear + 'reallocated_sectors_count', + 'reserved_block_count', + 'program_fail_count', + 'erase_fail_count', + 'wear_leveller_worst_case_erase_count', + 'unused_reserved_nand_blocks', + 'reallocation_event_count', + 'current_pending_sector_count', + 'offline_uncorrectable_sector_count', + 'percent_lifetime_used', +] + +CHARTS = { + 'read_error_rate': { + 'options': [None, 'Read Error Rate', 'value', 'errors', 'smartd_log.read_error_rate', 'line'], + 'lines': [], + 'attrs': [ATTR1], + 'algo': ABSOLUTE, + }, + 'seek_error_rate': { + 'options': [None, 'Seek Error Rate', 'value', 'errors', 'smartd_log.seek_error_rate', 'line'], + 'lines': [], + 'attrs': [ATTR7], + 'algo': ABSOLUTE, + }, + 'soft_read_error_rate': { + 'options': [None, 'Soft Read Error Rate', 'errors', 'errors', 'smartd_log.soft_read_error_rate', 'line'], + 'lines': [], + 'attrs': [ATTR13], + 'algo': INCREMENTAL, + }, + 'write_error_rate': { + 'options': [None, 'Write Error Rate', 'value', 'errors', 'smartd_log.write_error_rate', 'line'], + 'lines': [], + 'attrs': [ATTR206], + 'algo': ABSOLUTE, + }, + 'read_total_err_corrected': { + 'options': [None, 'Read Error Corrected', 'errors', 'errors', 'smartd_log.read_total_err_corrected', 'line'], + 'lines': [], + 'attrs': [ATTR_READ_ERR_COR], + 'algo': INCREMENTAL, + }, + 'read_total_unc_errors': { + 'options': [None, 'Read Error Uncorrected', 'errors', 'errors', 'smartd_log.read_total_unc_errors', 'line'], + 'lines': [], + 'attrs': [ATTR_READ_ERR_UNC], + 'algo': INCREMENTAL, + }, + 'write_total_err_corrected': { + 'options': [None, 'Write Error Corrected', 'errors', 'errors', 'smartd_log.read_total_err_corrected', 'line'], + 'lines': [], + 'attrs': [ATTR_WRITE_ERR_COR], + 'algo': INCREMENTAL, + }, + 'write_total_unc_errors': { + 'options': [None, 'Write Error Uncorrected', 'errors', 'errors', 'smartd_log.write_total_unc_errors', 'line'], + 'lines': [], + 'attrs': [ATTR_WRITE_ERR_UNC], + 'algo': INCREMENTAL, + }, + 'verify_total_err_corrected': { + 'options': [None, 'Verify Error Corrected', 'errors', 'errors', 'smartd_log.verify_total_err_corrected', + 'line'], + 'lines': [], + 'attrs': [ATTR_VERIFY_ERR_COR], + 'algo': INCREMENTAL, + }, + 'verify_total_unc_errors': { + 'options': [None, 'Verify Error Uncorrected', 'errors', 'errors', 'smartd_log.verify_total_unc_errors', 'line'], + 'lines': [], + 'attrs': [ATTR_VERIFY_ERR_UNC], + 'algo': INCREMENTAL, + }, + 'sata_interface_downshift': { + 'options': [None, 'SATA Interface Downshift', 'events', 'external failure', + 'smartd_log.sata_interface_downshift', 'line'], + 'lines': [], + 'attrs': [ATTR183], + 'algo': INCREMENTAL, + }, + 'udma_crc_error_count': { + 'options': [None, 'UDMA CRC Error Count', 'errors', 'external failure', 'smartd_log.udma_crc_error_count', + 'line'], + 'lines': [], + 'attrs': [ATTR199], + 'algo': INCREMENTAL, + }, + 'throughput_performance': { + 'options': [None, 'Throughput Performance', 'value', 'performance', 'smartd_log.throughput_performance', + 'line'], + 'lines': [], + 'attrs': [ATTR2], + 'algo': ABSOLUTE, + }, + 'seek_time_performance': { + 'options': [None, 'Seek Time Performance', 'value', 'performance', 'smartd_log.seek_time_performance', 'line'], + 'lines': [], + 'attrs': [ATTR8], + 'algo': ABSOLUTE, + }, + 'start_stop_count': { + 'options': [None, 'Start/Stop Count', 'events', 'power', 'smartd_log.start_stop_count', 'line'], + 'lines': [], + 'attrs': [ATTR4], + 'algo': ABSOLUTE, + }, + 'power_on_hours_count': { + 'options': [None, 'Power-On Hours Count', 'hours', 'power', 'smartd_log.power_on_hours_count', 'line'], + 'lines': [], + 'attrs': [ATTR9], + 'algo': ABSOLUTE, + }, + 'power_cycle_count': { + 'options': [None, 'Power Cycle Count', 'events', 'power', 'smartd_log.power_cycle_count', 'line'], + 'lines': [], + 'attrs': [ATTR12], + 'algo': ABSOLUTE, + }, + 'unexpected_power_loss': { + 'options': [None, 'Unexpected Power Loss', 'events', 'power', 'smartd_log.unexpected_power_loss', 'line'], + 'lines': [], + 'attrs': [ATTR174], + 'algo': ABSOLUTE, + }, + 'spin_up_time': { + 'options': [None, 'Spin-Up Time', 'ms', 'spin', 'smartd_log.spin_up_time', 'line'], + 'lines': [], + 'attrs': [ATTR3], + 'algo': ABSOLUTE, + }, + 'spin_up_retries': { + 'options': [None, 'Spin-up Retries', 'retries', 'spin', 'smartd_log.spin_up_retries', 'line'], + 'lines': [], + 'attrs': [ATTR10], + 'algo': INCREMENTAL, + }, + 'calibration_retries': { + 'options': [None, 'Calibration Retries', 'retries', 'spin', 'smartd_log.calibration_retries', 'line'], + 'lines': [], + 'attrs': [ATTR11], + 'algo': INCREMENTAL, + }, + 'airflow_temperature_celsius': { + 'options': [None, 'Airflow Temperature Celsius', 'celsius', 'temperature', + 'smartd_log.airflow_temperature_celsius', 'line'], + 'lines': [], + 'attrs': [ATTR190], + 'algo': ABSOLUTE, + }, + 'temperature_celsius': { + 'options': [None, 'Temperature', 'celsius', 'temperature', 'smartd_log.temperature_celsius', 'line'], + 'lines': [], + 'attrs': [ATTR194, ATTR_TEMPERATURE], + 'algo': ABSOLUTE, + }, + 'reallocated_sectors_count': { + 'options': [None, 'Reallocated Sectors Count', 'sectors', 'wear', 'smartd_log.reallocated_sectors_count', + 'line'], + 'lines': [], + 'attrs': [ATTR5], + 'algo': INCREMENTAL, + }, + 'reserved_block_count': { + 'options': [None, 'Reserved Block Count', '%', 'wear', 'smartd_log.reserved_block_count', 'line'], + 'lines': [], + 'attrs': [ATTR170], + 'algo': ABSOLUTE, + }, + 'program_fail_count': { + 'options': [None, 'Program Fail Count', 'errors', 'wear', 'smartd_log.program_fail_count', 'line'], + 'lines': [], + 'attrs': [ATTR171], + 'algo': INCREMENTAL, + }, + 'erase_fail_count': { + 'options': [None, 'Erase Fail Count', 'failures', 'wear', 'smartd_log.erase_fail_count', 'line'], + 'lines': [], + 'attrs': [ATTR172], + 'algo': INCREMENTAL, + }, + 'wear_leveller_worst_case_erase_count': { + 'options': [None, 'Wear Leveller Worst Case Erase Count', 'erases', 'wear', + 'smartd_log.wear_leveller_worst_case_erase_count', 'line'], + 'lines': [], + 'attrs': [ATTR173], + 'algo': ABSOLUTE, + }, + 'unused_reserved_nand_blocks': { + 'options': [None, 'Unused Reserved NAND Blocks', 'blocks', 'wear', 'smartd_log.unused_reserved_nand_blocks', + 'line'], + 'lines': [], + 'attrs': [ATTR180], + 'algo': ABSOLUTE, + }, + 'reallocation_event_count': { + 'options': [None, 'Reallocation Event Count', 'events', 'wear', 'smartd_log.reallocation_event_count', 'line'], + 'lines': [], + 'attrs': [ATTR196], + 'algo': INCREMENTAL, + }, + 'current_pending_sector_count': { + 'options': [None, 'Current Pending Sector Count', 'sectors', 'wear', 'smartd_log.current_pending_sector_count', + 'line'], + 'lines': [], + 'attrs': [ATTR197], + 'algo': ABSOLUTE, + }, + 'offline_uncorrectable_sector_count': { + 'options': [None, 'Offline Uncorrectable Sector Count', 'sectors', 'wear', + 'smartd_log.offline_uncorrectable_sector_count', 'line'], + 'lines': [], + 'attrs': [ATTR198], + 'algo': ABSOLUTE, + + }, + 'percent_lifetime_used': { + 'options': [None, 'Percent Lifetime Used', '%', 'wear', 'smartd_log.percent_lifetime_used', 'line'], + 'lines': [], + 'attrs': [ATTR202], + 'algo': ABSOLUTE, } +} + +# NOTE: 'parse_temp' decodes ATA 194 raw value. Not heavily tested. Written by @Ferroin +# C code: +# https://github.com/smartmontools/smartmontools/blob/master/smartmontools/atacmds.cpp#L2051 +# +# Calling 'parse_temp' on the raw value will return a 4-tuple, containing +# * temperature +# * minimum +# * maximum +# * over-temperature count +# substituting None for values it can't decode. +# +# Example: +# >>> parse_temp(42952491042) +# >>> (34, 10, 43, None) +# +# +# def check_temp_word(i): +# if i <= 0x7F: +# return 0x11 +# elif i <= 0xFF: +# return 0x01 +# elif 0xFF80 <= i: +# return 0x10 +# return 0x00 +# +# +# def check_temp_range(t, b0, b1): +# if b0 > b1: +# t0, t1 = b1, b0 +# else: +# t0, t1 = b0, b1 +# +# if all([ +# -60 <= t0, +# t0 <= t, +# t <= t1, +# t1 <= 120, +# not (t0 == -1 and t1 <= 0) +# ]): +# return t0, t1 +# return None, None +# +# +# def parse_temp(raw): +# byte = list() +# word = list() +# for i in range(0, 6): +# byte.append(0xFF & (raw >> (i * 8))) +# for i in range(0, 3): +# word.append(0xFFFF & (raw >> (i * 16))) +# +# ctwd = check_temp_word(word[0]) +# +# if not word[2]: +# if ctwd and not word[1]: +# # byte[0] is temp, no other data +# return byte[0], None, None, None +# +# if ctwd and all(check_temp_range(byte[0], byte[2], byte[3])): +# # byte[0] is temp, byte[2] is max or min, byte[3] is min or max +# trange = check_temp_range(byte[0], byte[2], byte[3]) +# return byte[0], trange[0], trange[1], None +# +# if ctwd and all(check_temp_range(byte[0], byte[1], byte[2])): +# # byte[0] is temp, byte[1] is max or min, byte[2] is min or max +# trange = check_temp_range(byte[0], byte[1], byte[2]) +# return byte[0], trange[0], trange[1], None +# +# return None, None, None, None +# +# if ctwd: +# if all( +# [ +# ctwd & check_temp_word(word[1]) & check_temp_word(word[2]) != 0x00, +# all(check_temp_range(byte[0], byte[2], byte[4])), +# ] +# ): +# # byte[0] is temp, byte[2] is max or min, byte[4] is min or max +# trange = check_temp_range(byte[0], byte[2], byte[4]) +# return byte[0], trange[0], trange[1], None +# else: +# trange = check_temp_range(byte[0], byte[2], byte[3]) +# if word[2] < 0x7FFF and all(trange) and trange[1] >= 40: +# # byte[0] is temp, byte[2] is max or min, byte[3] is min or max, word[2] is overtemp count +# return byte[0], trange[0], trange[1], word[2] +# # no data +# return None, None, None, None + + +CHARTED_ATTRS = dict((attr, k) for k, v in CHARTS.items() for attr in v['attrs']) + + +class BaseAtaSmartAttribute: + def __init__(self, name, normalized_value, raw_value): + self.name = name + self.normalized_value = normalized_value + self.raw_value = raw_value + + def value(self): + raise NotImplementedError + + +class AtaRaw(BaseAtaSmartAttribute): + def value(self): + return self.raw_value + + +class AtaNormalized(BaseAtaSmartAttribute): + def value(self): + return self.normalized_value + + +class Ata9(BaseAtaSmartAttribute): + def value(self): + value = int(self.raw_value) + if value > 1e6: + return value & 0xFFFF + return value + + +class Ata190(BaseAtaSmartAttribute): + def value(self): + return 100 - int(self.normalized_value) + + +class BaseSCSISmartAttribute: + def __init__(self, name, raw_value): + self.name = name + self.raw_value = raw_value + + def value(self): + raise NotImplementedError + + +class SCSIRaw(BaseSCSISmartAttribute): + def value(self): + return self.raw_value + + +def ata_attribute_factory(value): + name = value[0] + + if name == ATTR9: + return Ata9(*value) + elif name == ATTR190: + return Ata190(*value) + elif name in [ + ATTR1, + ATTR7, + ATTR194, + ATTR202, + ATTR206, + ]: + return AtaNormalized(*value) + + return AtaRaw(*value) -def handle_os_error(method): - def on_call(*args): - try: - return method(*args) - except OSError: - return None - return on_call +def scsi_attribute_factory(value): + return SCSIRaw(*value) -class SmartAttribute(object): - def __init__(self, idx, normalized, raw): - self.id = idx - self.normalized = normalized - self._raw = raw +def attribute_factory(value): + name = value[0] + if name.isdigit(): + return ata_attribute_factory(value) + return scsi_attribute_factory(value) - @property - def raw(self): - if self.id in LIMITS: - limit = LIMITS[self.id] - if limit.min <= int(self._raw) <= limit.max: - return self._raw - return None - return self._raw - @raw.setter - def raw(self, value): - self._raw = value +def handle_error(*errors): + def on_method(method): + def on_call(*args): + try: + return method(*args) + except errors: + return None + return on_call + return on_method class DiskLogFile: - def __init__(self, path): - self.path = path - self.size = os.path.getsize(path) + def __init__(self, full_path): + self.path = full_path + self.size = os.path.getsize(full_path) - @handle_os_error + @handle_error(OSError) def is_changed(self): - new_size = os.path.getsize(self.path) - old_size, self.size = self.size, new_size - - return new_size != old_size and new_size + return self.size != os.path.getsize(self.path) - @staticmethod - @handle_os_error - def is_valid(log_file, exclude): - return all([log_file.endswith('.csv'), - not [p for p in exclude if p in log_file], - os.access(log_file, os.R_OK), - os.path.getsize(log_file)]) + @handle_error(OSError) + def is_active(self, current_time, limit): + return (current_time - os.path.getmtime(self.path)) / 60 < limit + @handle_error(OSError) + def read(self): + self.size = os.path.getsize(self.path) + return read_last_line(self.path) -class Disk: - def __init__(self, full_path, age): - self.log_file = DiskLogFile(full_path) - self.name = os.path.basename(full_path).split('.')[-3] - self.age = int(age) - self.status = True - self.attributes = dict() - self.get_attributes() +class BaseDisk: + def __init__(self, name, log_file): + self.name = re.sub(r'_+', '_', name) + self.log_file = log_file + self.attrs = list() + self.alive = True + self.charted = False def __eq__(self, other): - if isinstance(other, Disk): + if isinstance(other, BaseDisk): return self.name == other.name return self.name == other @@ -191,163 +546,179 @@ class Disk: def __hash__(self): return hash(repr(self)) - @handle_os_error - def is_active(self): - return (time() - os.path.getmtime(self.log_file.path)) / 60 < self.age + def parser(self, data): + raise NotImplementedError - @handle_os_error - def get_attributes(self): - last_line = read_last_line(self.log_file.path) - self.attributes = dict((attr, SmartAttribute(attr, normalized, raw)) for attr, normalized, raw - in REGEX.findall(last_line)) - return True + @handle_error(TypeError) + def populate_attrs(self): + self.attrs = list() + line = self.log_file.read() + for value in self.parser(line): + self.attrs.append(attribute_factory(value)) + + return len(self.attrs) def data(self): data = dict() - for attr in self.attributes.values(): - data['_'.join([self.name, 'normalized', attr.id])] = attr.normalized - if attr.raw is not None: - data['_'.join([self.name, 'raw', attr.id])] = attr.raw + for attr in self.attrs: + data['{0}_{1}'.format(self.name, attr.name)] = attr.value() return data -class Service(SimpleService): - def __init__(self, configuration=None, name=None): - SimpleService.__init__(self, configuration=configuration, name=name) - self.log_path = self.configuration.get('log_path', '/var/log/smartd') - self.raw = self.configuration.get('raw_values', True) - self.exclude = self.configuration.get('exclude_disks', str()).split() - self.age = self.configuration.get('age', 30) +class ATADisk(BaseDisk): + def parser(self, data): + return RE_ATA.findall(data) - self.runs = 0 - self.disks = list() - self.order = list() - self.definitions = dict() - def check(self): - self.disks = self.scan() +class SCSIDisk(BaseDisk): + def parser(self, data): + return RE_SCSI.findall(data) - if not self.disks: - return None - user_defined_sa = self.configuration.get('smart_attributes') +class Service(SimpleService): + def __init__(self, configuration=None, name=None): + SimpleService.__init__(self, configuration=configuration, name=name) + self.order = ORDER + self.definitions = deepcopy(CHARTS) - if user_defined_sa: - order = user_defined_sa.split() or ORDER - else: - order = ORDER + self.log_path = configuration.get('log_path', DEF_PATH) + self.age = configuration.get('age', DEF_AGE) + self.exclude = configuration.get('exclude_disks', str()).split() - self.create_charts(order) + self.disks = list() + self.runs = 0 - return True + def check(self): + return self.scan() > 0 def get_data(self): self.runs += 1 - if self.runs % RESCAN_INTERVAL == 0: - self.cleanup_and_rescan() + if self.runs % DEF_RESCAN_INTERVAL == 0: + self.cleanup() + self.scan() data = dict() for disk in self.disks: - - if not disk.status: + if not disk.alive: continue + if not disk.charted: + self.add_disk_to_charts(disk) + changed = disk.log_file.is_changed() - # True = changed, False = unchanged, None = Exception if changed is None: - disk.status = False + disk.alive = False continue - if changed: - success = disk.get_attributes() - if not success: - disk.status = False - continue + if changed and disk.populate_attrs() is None: + disk.alive = False + continue data.update(disk.data()) - return data or None - - def create_charts(self, order): - for attr in order: - raw_name, normalized_name = 'attr_id_raw_' + attr, 'attr_id_normalized_' + attr - raw, normalized = chart_template(raw_name), chart_template(normalized_name) - self.order.extend([normalized_name, raw_name]) - self.definitions.update(raw) - self.definitions.update(normalized) - - for disk in self.disks: - if attr not in disk.attributes: - self.debug("'{disk}' has no attribute '{attr_id}'".format(disk=disk.name, - attr_id=attr)) - continue - normalized[normalized_name]['lines'].append(['_'.join([disk.name, 'normalized', attr]), disk.name]) - - if not self.raw: - continue - - if disk.attributes[attr].raw is not None: - raw[raw_name]['lines'].append(['_'.join([disk.name, 'raw', attr]), disk.name]) - continue - self.debug("'{disk}' attribute '{attr_id}' value not in {limits}".format(disk=disk.name, - attr_id=attr, - limits=LIMITS[attr])) - - def cleanup_and_rescan(self): - self.cleanup() - new_disks = self.scan(only_new=True) - - for disk in new_disks: - valid = False - - for chart in self.charts: - value_type, idx = chart.id.split('_')[2:] - - if idx in disk.attributes: - valid = True - dimension_id = '_'.join([disk.name, value_type, idx]) - - if dimension_id in chart: - chart.hide_dimension(dimension_id=dimension_id, reverse=True) - else: - chart.add_dimension([dimension_id, disk.name]) - if valid: - self.disks.append(disk) + return data def cleanup(self): - for disk in self.disks: + current_time = time() + for disk in self.disks[:]: + if any( + [ + not disk.alive, + not disk.log_file.is_active(current_time, self.age), + ] + ): + self.disks.remove(disk.name) + self.remove_disk_from_charts(disk) + + def scan(self): + self.debug('scanning {0}'.format(self.log_path)) + current_time = time() + + for full_name in os.listdir(self.log_path): + disk = self.create_disk_from_file(full_name, current_time) + if not disk: + continue + self.disks.append(disk) + + return len(self.disks) + + def create_disk_from_file(self, full_name, current_time): + name = os.path.basename(full_name).split('.')[-3] + path = os.path.join(self.log_path, full_name) + + if name in self.disks: + return None + + if [p for p in self.exclude if p in name]: + return None + + if not full_name.endswith(CSV): + self.debug('skipping {0}: not a csv file'.format(full_name)) + return None + + if not os.access(path, os.R_OK): + self.debug('skipping {0}: not readable'.format(full_name)) + return None + + if os.path.getsize(path) == 0: + self.debug('skipping {0}: zero size'.format(full_name)) + return None + + if (current_time - os.path.getmtime(path)) / 60 > self.age: + self.debug('skipping {0}: haven\'t been updated for last {1} minutes'.format(full_name, self.age)) + return None + + if ATA in full_name: + disk = ATADisk(name, DiskLogFile(path)) + elif SCSI in full_name: + disk = SCSIDisk(name, DiskLogFile(path)) + else: + self.debug('skipping {0}: unknown type'.format(full_name)) + return None + + disk.populate_attrs() + if not disk.attrs: + self.error('skipping {0}: parsing failed'.format(full_name)) + return None + + self.debug('added {0}'.format(full_name)) + return disk + + def add_disk_to_charts(self, disk): + if len(self.charts) == 0 or disk.charted: + return + disk.charted = True + + for attr in disk.attrs: + chart_id = CHARTED_ATTRS.get(attr.name) + + if not chart_id or chart_id not in self.charts: + continue + + chart = self.charts[chart_id] + dim = [ + '{0}_{1}'.format(disk.name, attr.name), + disk.name, + CHARTS[chart_id]['algo'], + ] + + if dim[0] in self.charts[chart_id].dimensions: + chart.hide_dimension(dim[0], reverse=True) + else: + chart.add_dimension(dim) + + def remove_disk_from_charts(self, disk): + if len(self.charts) == 0 or not disk.charted: + return + + for attr in disk.attrs: + chart_id = CHARTED_ATTRS.get(attr.name) + + if not chart_id or chart_id not in self.charts: + continue - if not disk.is_active(): - disk.status = False - if not disk.status: - for chart in self.charts: - dimension_id = '_'.join([disk.name, chart.id[8:]]) - chart.hide_dimension(dimension_id=dimension_id) - - self.disks = [disk for disk in self.disks if disk.status] - - def scan(self, only_new=None): - new_disks = list() - for f in os.listdir(self.log_path): - full_path = os.path.join(self.log_path, f) - - if DiskLogFile.is_valid(full_path, self.exclude): - disk = Disk(full_path, self.age) - - active = disk.is_active() - if active is None: - continue - if active: - if not only_new: - new_disks.append(disk) - else: - if disk not in self.disks: - new_disks.append(disk) - else: - if not only_new: - self.debug("'{disk}' not updated in the last {age} minutes, " - "skipping it.".format(disk=disk.name, age=self.age)) - return new_disks + # TODO: can't delete dimension + self.charts[chart_id].hide_dimension('{0}_{1}'.format(disk.name, attr.name)) diff --git a/collectors/python.d.plugin/smartd_log/smartd_log.conf b/collectors/python.d.plugin/smartd_log/smartd_log.conf index 3fab3f1c0..ab7f45b0f 100644 --- a/collectors/python.d.plugin/smartd_log/smartd_log.conf +++ b/collectors/python.d.plugin/smartd_log/smartd_log.conf @@ -63,28 +63,7 @@ # # Additionally to the above, smartd_log also supports the following: # -# log_path: '/path/to/smartdlogs' # path to smartd log files. Default is /var/log/smartd -# raw_values: yes # enable/disable raw values charts. Enabled by default. -# smart_attributes: '1 2 3 4 44' # smart attributes charts. Default are ['1', '4', '5', '7', '9', '12', '193', '194', '197', '198', '200']. -# exclude_disks: 'PATTERN1 PATTERN2' # space separated patterns. If the pattern is in the drive name, the module will not collect data for it. -# -# ---------------------------------------------------------------------- -# Additional information -# Plugin reads smartd log files (-A option). -# You need to add (man smartd) to /etc/default/smartmontools '-i 600 -A /var/log/smartd/' to pass additional options to smartd on startup -# Then restart smartd service and check /path/log/smartdlogs -# ls /var/log/smartd/ -# CDC_WD10EZEX_00BN5A0-WD_WCC3F7FLVZS9.ata.csv WDC_WD10EZEX_00BN5A0-WD_WCC3F7FLVZS9.ata.csv ZDC_WD10EZEX_00BN5A0-WD_WCC3F7FLVZS9.ata.csv -# -# Smartd APPEND logs at every run. Its NOT RECOMMENDED to set '-i' option below 60 sec. -# STRONGLY RECOMMENDED to create smartd conf file for logrotate -# -# RAW vs NORMALIZED values -# "Normalized value", commonly referred to as just "value". This is a most universal measurement, on the scale from 0 (bad) to some maximum (good) value. -# Maximum values are typically 100, 200 or 253. Rule of thumb is: high values are good, low values are bad. -# -# "Raw value" - the value of the attribute as it is tracked by the device, before any normalization takes place. -# Some raw numbers provide valuable insight when properly interpreted. These cases will be discussed later on. -# Raw values are typically listed in hexadecimal numbers. The raw value has different structure for different vendors and is often not meaningful as a decimal number. +# log_path: '/path/to/smartd_logs' # path to smartd log files. Default is /var/log/smartd +# exclude_disks: 'PATTERN1 PATTERN2' # space separated patterns. If the pattern is in the drive name, the module will not collect data for it. # # ---------------------------------------------------------------------- diff --git a/collectors/python.d.plugin/springboot/README.md b/collectors/python.d.plugin/springboot/README.md index 008436a4f..a1817cc2b 100644 --- a/collectors/python.d.plugin/springboot/README.md +++ b/collectors/python.d.plugin/springboot/README.md @@ -1,40 +1,10 @@ # springboot This module will monitor one or more Java Spring-boot applications depending on configuration. - -It produces following charts: - -1. **Response Codes** in requests/s - * 1xx - * 2xx - * 3xx - * 4xx - * 5xx - * others - -2. **Threads** - * daemon - * total - -3. **GC Time** in milliseconds and **GC Operations** in operations/s - * Copy - * MarkSweep - * ... - -4. **Heap Mmeory Usage** in KB - * used - * committed - -### configuration - -Please see the [Monitoring Java Spring Boot Applications](https://github.com/netdata/netdata/wiki/Monitoring-Java-Spring-Boot-Applications) page for detailed info about module configuration. - ---- - -# Monitoring Java Spring Boot Applications - Netdata can be used to monitor running Java [Spring Boot](https://spring.io/) applications that expose their metrics with the use of the **Spring Boot Actuator** included in Spring Boot library. +## Configuration + The Spring Boot Actuator exposes these metrics over HTTP and is very easy to use: * add `org.springframework.boot:spring-boot-starter-actuator` to your application dependencies * set `endpoints.metrics.sensitive=false` in your `application.properties` @@ -93,7 +63,30 @@ public class HeapPoolMetrics implements PublicMetrics { Please refer [Spring Boot Actuator: Production-ready features](https://docs.spring.io/spring-boot/docs/current/reference/html/production-ready.html) and [81. Actuator - Part IX. ‘How-to’ guides](https://docs.spring.io/spring-boot/docs/current/reference/html/howto-actuator.html) for more information. -## Using netdata springboot module +## Charts + +1. **Response Codes** in requests/s + * 1xx + * 2xx + * 3xx + * 4xx + * 5xx + * others + +2. **Threads** + * daemon + * total + +3. **GC Time** in milliseconds and **GC Operations** in operations/s + * Copy + * MarkSweep + * ... + +4. **Heap Mmeory Usage** in KB + * used + * committed + +## Usage The springboot module is enabled by default. It looks up `http://localhost:8080/metrics` and `http://127.0.0.1:8080/metrics` to detect Spring Boot application by default. You can change it by editing `/etc/netdata/python.d/springboot.conf` (to edit it on your system run `/etc/netdata/edit-config python.d/springboot.conf`). @@ -126,4 +119,4 @@ You can disable the default charts by set `defaults.<chart-id>: false`. The dimension name of extras charts should replace `.` to `_`. -Please check [springboot.conf](springboot.conf) for more examples.
\ No newline at end of file +Please check [springboot.conf](springboot.conf) for more examples. diff --git a/collectors/python.d.plugin/tor/Makefile.inc b/collectors/python.d.plugin/tor/Makefile.inc new file mode 100644 index 000000000..5a45f9b79 --- /dev/null +++ b/collectors/python.d.plugin/tor/Makefile.inc @@ -0,0 +1,13 @@ +# SPDX-License-Identifier: GPL-3.0-or-later + +# THIS IS NOT A COMPLETE Makefile +# IT IS INCLUDED BY ITS PARENT'S Makefile.am +# IT IS REQUIRED TO REFERENCE ALL FILES RELATIVE TO THE PARENT + +# install these files +dist_python_DATA += tor/tor.chart.py +dist_pythonconfig_DATA += tor/tor.conf + +# do not install these files, but include them in the distribution +dist_noinst_DATA += tor/README.md tor/Makefile.inc + diff --git a/collectors/python.d.plugin/tor/README.md b/collectors/python.d.plugin/tor/README.md new file mode 100644 index 000000000..4a8833730 --- /dev/null +++ b/collectors/python.d.plugin/tor/README.md @@ -0,0 +1,46 @@ +# tor + +Module connects to tor control port to collect traffic statistics. + +**Requirements:** +* `tor` program +* `stem` python package + +It produces only one chart: + +1. **Traffic** + * read + * write + +### configuration + +Needs only `control_port` + +Here is an example for local server: + +```yaml +update_every : 1 +priority : 60000 + +local_tcp: + name: 'local' + control_port: 9051 + +local_socket: + name: 'local' + control_port: '/var/run/tor/control' +``` + +### prerequisite + +Add to `/etc/tor/torrc`: + +``` +ControlPort 9051 +``` + +For more options please read the manual. + +Without configuration, module attempts to connect to `127.0.0.1:9051`. + +--- diff --git a/collectors/python.d.plugin/tor/tor.chart.py b/collectors/python.d.plugin/tor/tor.chart.py new file mode 100644 index 000000000..b77632bd4 --- /dev/null +++ b/collectors/python.d.plugin/tor/tor.chart.py @@ -0,0 +1,108 @@ +# -*- coding: utf-8 -*- +# Description: adaptec_raid netdata python.d module +# Author: Federico Ceratto <federico.ceratto@gmail.com> +# Author: Ilya Mashchenko (l2isbad) +# SPDX-License-Identifier: GPL-3.0-or-later + + +from bases.FrameworkServices.SimpleService import SimpleService + +try: + import stem + import stem.connection + import stem.control + STEM_AVAILABLE = True +except ImportError: + STEM_AVAILABLE = False + + +DEF_PORT = 'default' + +ORDER = [ + 'traffic', +] + +CHARTS = { + 'traffic': { + 'options': [None, 'Tor Traffic', 'KB/s', 'traffic', 'tor.traffic', 'area'], + 'lines': [ + ['read', 'read', 'incremental', 1, 1024], + ['write', 'write', 'incremental', 1, -1024], + ] + } +} + + +class Service(SimpleService): + """Provide netdata service for Tor""" + def __init__(self, configuration=None, name=None): + super(Service, self).__init__(configuration=configuration, name=name) + self.order = ORDER + self.definitions = CHARTS + + self.port = self.configuration.get('control_port', DEF_PORT) + self.password = self.configuration.get('password') + + self.use_socket = isinstance(self.port, str) and self.port != DEF_PORT and not self.port.isdigit() + self.conn = None + self.alive = False + + def check(self): + if not STEM_AVAILABLE: + self.error('the stem library is missing') + return False + + return self.connect() + + def get_data(self): + if not self.alive and not self.reconnect(): + return None + + data = dict() + + try: + data['read'] = self.conn.get_info('traffic/read') + data['write'] = self.conn.get_info('traffic/written') + except stem.ControllerError as error: + self.debug(error) + self.alive = False + + return data or None + + def authenticate(self): + try: + self.conn.authenticate(password=self.password) + except stem.connection.AuthenticationFailure as error: + self.error('authentication error: {0}'.format(error)) + return False + return True + + def connect_via_port(self): + try: + self.conn = stem.control.Controller.from_port(port=self.port) + except (stem.SocketError, ValueError) as error: + self.error(error) + + def connect_via_socket(self): + try: + self.conn = stem.control.Controller.from_socket_file(path=self.port) + except (stem.SocketError, ValueError) as error: + self.error(error) + + def connect(self): + if self.conn: + self.conn.close() + self.conn = None + + if self.use_socket: + self.connect_via_socket() + else: + self.connect_via_port() + + if self.conn and self.authenticate(): + self.alive = True + + return self.alive + + def reconnect(self): + return self.connect() diff --git a/collectors/python.d.plugin/tor/tor.conf b/collectors/python.d.plugin/tor/tor.conf new file mode 100644 index 000000000..8245414fb --- /dev/null +++ b/collectors/python.d.plugin/tor/tor.conf @@ -0,0 +1,79 @@ +# netdata python.d.plugin configuration for tor +# +# This file is in YaML format. Generally the format is: +# +# name: value +# +# There are 2 sections: +# - global variables +# - one or more JOBS +# +# JOBS allow you to collect values from multiple sources. +# Each source will have its own set of charts. +# +# JOB parameters have to be indented (using spaces only, example below). + +# ---------------------------------------------------------------------- +# Global Variables +# These variables set the defaults for all JOBs, however each JOB +# may define its own, overriding the defaults. + +# update_every sets the default data collection frequency. +# If unset, the python.d.plugin default is used. +# update_every: 1 + +# priority controls the order of charts at the netdata dashboard. +# Lower numbers move the charts towards the top of the page. +# If unset, the default for python.d.plugin is used. +# priority: 60000 + +# retries sets the number of retries to be made in case of failures. +# If unset, the default for python.d.plugin is used. +# Attempts to restore the service are made once every update_every +# and only if the module has collected values in the past. +# retries: 60 + +# autodetection_retry sets the job re-check interval in seconds. +# The job is not deleted if check fails. +# Attempts to start the job are made once every autodetection_retry. +# This feature is disabled by default. +# autodetection_retry: 0 + +# ---------------------------------------------------------------------- +# JOBS (data collection sources) +# +# The default JOBS share the same *name*. JOBS with the same name +# are mutually exclusive. Only one of them will be allowed running at +# any time. This allows autodetection to try several alternatives and +# pick the one that works. +# +# Any number of jobs is supported. +# +# All python.d.plugin JOBS (for all its modules) support a set of +# predefined parameters. These are: +# +# job_name: +# name: myname # the JOB's name as it will appear at the +# # dashboard (by default is the job_name) +# # JOBs sharing a name are mutually exclusive +# update_every: 1 # the JOB's data collection frequency +# priority: 60000 # the JOB's order on the dashboard +# retries: 10 # the JOB's number of restoration attempts +# autodetection_retry: 0 # the JOB's re-check interval in seconds +# +# Additionally to the above, tor plugin also supports the following: +# +# control_port: 'port' # tor control port +# password: 'password' # tor control password +# +# ---------------------------------------------------------------------- +# AUTO-DETECTION JOBS +# only one of them will run (they have the same name) +# +# local_tcp: +# name: 'local' +# control_port: 9051 +# +# local_socket: +# name: 'local' +# control_port: '/var/run/tor/control' diff --git a/collectors/python.d.plugin/web_log/README.md b/collectors/python.d.plugin/web_log/README.md index 6e8ea1dd5..e25a03fb3 100644 --- a/collectors/python.d.plugin/web_log/README.md +++ b/collectors/python.d.plugin/web_log/README.md @@ -1,17 +1,86 @@ # web_log -Tails the apache/nginx/lighttpd/gunicorn log files to collect real-time web-server statistics. +## Motivation -It produces following charts: +Web server log files exist for more than 20 years. All web servers of all kinds, from all vendors, [since the time NCSA httpd was powering the web](https://en.wikipedia.org/wiki/NCSA_HTTPd), produce log files, saving in real-time all accesses to web sites and APIs. -1. **Response by type** requests/s +Yet, after the appearance of google analytics and similar services, and the recent rise of APM (Application Performance Monitoring) with sophisticated time-series databases that collect and analyze metrics at the application level, all these web server log files are mostly just filling our disks, rotated every night without any use whatsoever. + +netdata turns this "useless" log file, into a powerful performance and health monitoring tool, capable of detecting, **in real-time**, most common web server problems, such as: + +- too many redirects (i.e. **oops!** *this should not redirect clients to itself*) +- too many bad requests (i.e. **oops!** *a few files were not uploaded*) +- too many internal server errors (i.e. **oops!** *this release crashes too much*) +- unreasonably too many requests (i.e. **oops!** *we are under attack*) +- unreasonably few requests (i.e. **oops!** *call the network guys*) +- unreasonably slow responses (i.e. **oops!** *the database is slow again*) +- too few successful responses (i.e. **oops!** *help us God!*) + +## Usage + +If netdata is installed on a system running a web server, it will detect it and it will automatically present a series of charts, with information obtained from the web server API, like these (*these do not come from the web server log file*): + + +*[**netdata**](https://my-netdata.io/) charts based on metrics collected by querying the `nginx` API (i.e. `/stab_status`).* + +> [**netdata**](https://my-netdata.io/) supports `apache`, `nginx`, `lighttpd` and `tomcat`. To obtain real-time information from a web server API, the web server needs to expose it. For directions on configuring your web server, check the config files for each web server. There is a directory with a config file for each web server under [`/etc/netdata/python.d/`](../). + +## Configuration + +[**netdata**](https://my-netdata.io/) has a powerful `web_log` plugin, capable of incrementally parsing any number of web server log files. This plugin is automatically started with [**netdata**](https://my-netdata.io/) and comes, pre-configured, for finding web server log files on popular distributions. Its configuration is at [`/etc/netdata/python.d/web_log.conf`](web_log.conf), like this: + + +```yaml +nginx_log: + name : 'nginx_log' + path : '/var/log/nginx/access.log' + +apache_log: + name : 'apache_log' + path : '/var/log/apache/other_vhosts_access.log' + categories: + cacti : 'cacti.*' + observium : 'observium' +``` + +Theodule has preconfigured jobs for nginx, apache and gunicorn on various distros. +You can add one such section, for each of your web server log files. + +> **Important**<br/>Keep in mind [**netdata**](https://my-netdata.io/) runs as user `netdata`. So, make sure user `netdata` has access to the logs directory and can read the log file. + +## Charts + +Once you have all log files configured and [**netdata**](https://my-netdata.io/) restarted, **for each log file** you will get a section at the [**netdata**](https://my-netdata.io/) dashboard, with the following charts. + +### responses by status + +In this chart we tried to provide a meaningful status for all responses. So: + +- `success` counts all the valid responses (i.e. `1xx` informational, `2xx` successful and `304` not modified). +- `error` are `5xx` internal server errors. These are very bad, they mean your web site or API is facing difficulties. +- `redirect` are `3xx` responses, except `304`. All `3xx` are redirects, but `304` means "not modified" - it tells the browsers the content they already have is still valid and can be used as-is. So, we decided to account it as a successful response. +- `bad` are bad requests that cannot be served. +- `other` as all the other, non-standard, types of responses. + + + +### Responses by type + +Then, we group all responses by code family, without interpreting their meaning. +**Response by type** requests/s * success (1xx, 2xx, 304) * error (5xx) * redirect (3xx except 304) * bad (4xx) * other (all other responses) -2. **Response by code family** requests/s + + +### Responses by code family + +Here we show all the response codes in detail. + +**Response by code family** requests/s * 1xx (informational) * 2xx (successful) * 3xx (redirect) @@ -19,46 +88,114 @@ It produces following charts: * 5xx (internal server errors) * other (non-standart responses) * unmatched (the lines in the log file that are not matched) + + + + +>**Important**<br/>If your application is using hundreds of non-standard response codes, your browser may become slow while viewing this chart, so we have added a configuration [option to disable this chart](https://github.com/netdata/netdata/blob/419cd0a237275e5eeef3f92dcded84e735ee6c58/conf.d/python.d/web_log.conf#L63). + +### Detailed Response Codes -3. **Detailed Response Codes** requests/s (number of responses for each response code family individually) +Number of responses for each response code family individually (requests/s) -4. **Bandwidth** KB/s +### bandwidth + +This is a nice view of the traffic the web server is receiving and is sending. + +What is important to know for this chart, is that the bandwidth used for each request and response is accounted at the time the log is written. Since [**netdata**](https://my-netdata.io/) refreshes this chart every single second, you may have unrealistic spikes is the size of the requests or responses is too big. The reason is simple: a response may have needed 1 minute to be completed, but all the bandwidth used during that minute for the specific response will be accounted at the second the log line is written. + +As the legend on the chart suggests, you can use FireQoS to setup QoS on the web server ports and IPs to accurately measure the bandwidth the web server is using. Actually, [there may be a few more reasons to install QoS on your servers](../../tc.plugin/#tcplugin)... + +**Bandwidth** KB/s * received (bandwidth of requests) * send (bandwidth of responses) + + + +> **Important**<br/>Most web servers do not log the request size by default.<br/>So, [unless you have configured your web server to log the size of requests](https://github.com/netdata/netdata/blob/419cd0a237275e5eeef3f92dcded84e735ee6c58/conf.d/python.d/web_log.conf#L76-L89), the `received` dimension will be always zero. -5. **Timings** ms (request processing time) +### timings + +[**netdata**](https://my-netdata.io/) will also render the `minimum`, `average` and `maximum` time the web server needed to respond to requests. + +Keep in mind most web servers timings start at the reception of the full request, until the dispatch of the last byte of the response. So, they include network latencies of responses, but they do not include network latencies of requests. + +**Timings** ms (request processing time) * min (bandwidth of requests) * max (bandwidth of responses) * average (bandwidth of responses) + + -6. **Request per url** requests/s (configured by user) +> **Important**<br/>Most web servers do not log timing information by default.<br/>So, [unless you have configured your web server to also log timings](https://github.com/netdata/netdata/blob/419cd0a237275e5eeef3f92dcded84e735ee6c58/conf.d/python.d/web_log.conf#L76-L89), this chart will not exist. -7. **Http Methods** requests/s (requests per http method) +### URL patterns -8. **Http Versions** requests/s (requests per http version) +This is a very interesting chart. It is configured entirely by you. -9. **IP protocols** requests/s (requests per ip protocol version) +[**netdata**](https://my-netdata.io/) can map the URLs found in the log file into categories. You can define these categories, by providing names and regular expressions in `web_log.conf`. -10. **Current Poll Unique Client IPs** unique ips/s (unique client IPs per data collection iteration) +So, this configuration: -11. **All Time Unique Client IPs** unique ips/s (unique client IPs since the last restart of netdata) +```yaml +nginx_netdata: # name the charts + path: '/var/log/nginx/access.log' # web server log file + categories: + badges : '^/api/v1/badge\.svg' + charts : '^/api/v1/(data|chart|charts)' + registry : '^/api/v1/registry' + alarms : '^/api/v1/alarm' + allmetrics : '^/api/v1/allmetrics' + api_other : '^/api/' + netdata_conf: '^/netdata.conf' + api_old : '^/(data|datasource|graph|list|all\.json)' +``` +Produces the following chart. The `categories` section is matched in the order given. So, pay attention to the order you give your patterns. -### configuration + -```yaml -nginx_log: - name : 'nginx_log' - path : '/var/log/nginx/access.log' +### HTTP versions -apache_log: - name : 'apache_log' - path : '/var/log/apache/other_vhosts_access.log' - categories: - cacti : 'cacti.*' - observium : 'observium' -``` +This chart breaks down requests by HTTP version used. + + + +### IP versions + +This one provides requests per IP version used by the clients (`IPv4`, `IPv6`). + + + +### Unique clients + +The last charts are about the unique IPs accessing your web server. + +**Current Poll Unique Client IPs** unique ips/s. This one counts the unique IPs for each data collection iteration (i.e. **unique clients per second**). + + + +**All Time Unique Client IPs** unique ips/s. Counts the unique IPs, since the last [**netdata**](https://my-netdata.io/) restart. + + + +>**Important**<br/>To provide this information `web_log` plugin keeps in memory all the IPs seen by the web server. Although this does not require so much memory, if you have a web server with several million unique client IPs, we suggest to [disable this chart](https://github.com/netdata/netdata/blob/419cd0a237275e5eeef3f92dcded84e735ee6c58/conf.d/python.d/web_log.conf#L64). + + +## Alarms + +The magic of [**netdata**](https://my-netdata.io/) is that all metrics are collected per second, and all metrics can be used or correlated to provide real-time alarms. Out of the box, [**netdata**](https://my-netdata.io/) automatically attaches the [following alarms](../../../health/health.d/web_log.conf) to all `web_log` charts (i.e. to all log files configured, individually): + +alarm|description|minimum<br/>requests|warning|critical +:-------|-------|:------:|:-----:|:------: +`1m_redirects`|The ratio of HTTP redirects (3xx except 304) over all the requests, during the last minute.<br/> <br/>*Detects if the site or the web API is suffering from too many or circular redirects.*<br/> <br/>(i.e. **oops!** *this should not redirect clients to itself*)|120/min|> 20%|> 30% +`1m_bad_requests`|The ratio of HTTP bad requests (4xx) over all the requests, during the last minute.<br/> <br/>*Detects if the site or the web API is receiving too many bad requests, including `404`, not found.*<br/> <br/>(i.e. **oops!** *a few files were not uploaded*)|120/min|> 30%|> 50% +`1m_internal_errors`|The ratio of HTTP internal server errors (5xx), over all the requests, during the last minute.<br/> <br/>*Detects if the site is facing difficulties to serve requests.*<br/> <br/>(i.e. **oops!** *this release crashes too much*)|120/min|> 2%|> 5% +`5m_requests_ratio`|The percentage of successful web requests of the last 5 minutes, compared with the previous 5 minutes.<br/> <br/>*Detects if the site or the web API is suddenly getting too many or too few requests.*<br/> <br/>(i.e. too many = **oops!** *we are under attack*)<br/>(i.e. too few = **oops!** *call the network guys*)|120/5min|> double or < half|> 4x or < 1/4x +`web_slow`|The average time to respond to requests, over the last 1 minute, compared to the average of last 10 minutes.<br/> <br/>*Detects if the site or the web API is suddenly a lot slower.*<br/> <br/>(i.e. **oops!** *the database is slow again*)|120/min|> 2x|> 4x +`1m_successful`|The ratio of successful HTTP responses (1xx, 2xx, 304) over all the requests, during the last minute.<br/> <br/>*Detects if the site or the web API is performing within limits.*<br/> <br/>(i.e. **oops!** *help us God!*)|120/min|< 85%|< 75% + +The column `minimum requests` state the minimum number of requests required for the alarm to be evaluated. We found that when the site is receiving requests above this rate, these alarms are pretty accurate (i.e. no false-positives). -Module has preconfigured jobs for nginx, apache and gunicorn on various distros. +[**netdata**](https://my-netdata.io/) alarms are user configurable. Sample config files can be found under directory `health/health.d` of the netdata github repository. So, even [`web_log` alarms can be adapted to your needs](../../../health/health.d/web_log.conf). ---- diff --git a/collectors/tc.plugin/README.md b/collectors/tc.plugin/README.md index 6670c491f..a8b151de3 100644 --- a/collectors/tc.plugin/README.md +++ b/collectors/tc.plugin/README.md @@ -18,75 +18,69 @@ dynamically creates. ## Motivation -One category of metrics missing in Linux monitoring, is bandwidth consumption for each open -socket (inbound and outbound traffic). So, you cannot tell how much bandwidth your web server, -your database server, your backup, your ssh sessions, etc are using. +One category of metrics missing in Linux monitoring, is bandwidth consumption for each open socket (inbound and outbound traffic). So, you cannot tell how much bandwidth your web server, your database server, your backup, your ssh sessions, etc are using. -To solve this problem, the most *adventurous* Linux monitoring tools install kernel modules to -capture all traffic, analyze it and provide reports per application. A lot of work, CPU intensive -and with a great degree of risk (due to the kernel modules involved which might affect the -stability of the whole system). Not to mention that such solutions are probably better suited -for a core linux router in your network. +To solve this problem, the most *adventurous* Linux monitoring tools install kernel modules to capture all traffic, analyze it and provide reports per application. A lot of work, CPU intensive and with a great degree of risk (due to the kernel modules involved which might affect the stability of the whole system). Not to mention that such solutions are probably better suited for a core linux router in your network. -Others use NFACCT, the netfilter accounting module which is already part of the Linux firewall. -However, this would require configuring a firewall on every system you want to measure bandwidth. +Others use NFACCT, the netfilter accounting module which is already part of the Linux firewall. However, this would require configuring a firewall on every system you want to measure bandwidth (just FYI, I do install a firewall on every server - and I strongly advise you to do so too - but configuring accounting on all servers seems overkill when you don't really need it for billing purposes). -QoS monitoring attempts to solve this in a much cleaner way. +**There is however a much simpler approach**. -## Introduction to QoS +## QoS -One of the features the Linux kernel has, but it is rarely used, is its ability to -**apply QoS on traffic**. Even most interesting is that it can apply QoS to **both inbound and -outbound traffic**. +One of the features the Linux kernel has, but it is rarely used, is its ability to **apply QoS on traffic**. Even most interesting is that it can apply QoS to **both inbound and outbound traffic**. QoS is about 2 features: 1. **Classify traffic** - Classification is the process of organizing traffic in groups, called **classes**. - Classification can evaluate every aspect of network packets, like source and destination ports, - source and destination IPs, netfilter marks, etc. + Classification is the process of organizing traffic in groups, called **classes**. Classification can evaluate every aspect of network packets, like source and destination ports, source and destination IPs, netfilter marks, etc. - When you classify traffic, you just assign a label to it. For example **I call `web server` - traffic, the traffic from my server's tcp/80, tcp/443 and to my server's tcp/80, tcp/443, - while I call `web surfing` all other tcp/80 and tcp/443 traffic**. You can use any combinations - you like. There is no limit. + When you classify traffic, you just assign a label to it. Of course classes have some properties themselves (like queuing mechanisms), but let's say it is that simple: **a label**. For example **I call `web server` traffic, the traffic from my server's tcp/80, tcp/443 and to my server's tcp/80, tcp/443, while I call `web surfing` all other tcp/80 and tcp/443 traffic**. You can use any combinations you like. There is no limit. 2. **Apply traffic shaping rules to these classes** - Traffic shaping is used to control how network interface bandwidth should be shared among the - classes. Of course we are not interested for this feature to just monitor the traffic. - Classification will be enough for monitoring everything. + Traffic shaping is used to control how network interface bandwidth should be shared among the classes. Normally, you need to do this, when there is not enough bandwidth to satisfy all the demand, or when you want to control the supply of bandwidth to certain services. Of course classification is sufficient for monitoring traffic, but traffic shaping is also quite important, as we will explain in the next section. -The key reasons of applying QoS on all servers (even cloud ones) are: +## Why you want QoS - - **ensure administrative tasks (like ssh, dns, etc) will always have a small but guaranteed - bandwidth.** QoS can guarantee that services like ssh, dns, ntp, etc will always have a small - supply of bandwidth. So, no matter what happens, you will be able to ssh to your server and - DNS will always work. +1. **Monitoring the bandwidth used by services** - - **ensure other administrative tasks will not monopolize all the available bandwidth.** - Services like backups, file copies, database dumps, etc can easily monopolize all the - available bandwidth. It is common for example a nightly backup, or a huge file transfer - to negatively influence the end-user experience. QoS can fix that. + netdata provides wonderful real-time charts, like this one (wait to see the orange `rsync` part): - - **ensure each end-user connection will get a fair cut of the available bandwidth.** - Several QoS queuing disciplines in Linux do this automatically, without any configuration from you. - The result is that new sockets are favored over older ones, so that users will get a snappier - experience, while others are transferring large amounts of traffic. - - - **protect the servers from DDoS attacks.** - When your system is under a DDoS attack, it will get a lot more bandwidth compared to the one it - can handle and probably your applications will crash. Setting a limit on the inbound traffic using - QoS, will protect your servers (throttle the requests) and depending on the size of the attack may - allow your legitimate users to access the server, while the attack is taking place. +  +2. **Ensure sensitive administrative tasks will not starve for bandwidth** -Once **traffic classification** is applied, netdata can visualize the bandwidth consumption per -class in real-time (no configuration is needed for netdata - it will figure it out). + Have you tried to ssh to a server when the network is congested? If you have, you already know it does not work very well. QoS can guarantee that services like ssh, dns, ntp, etc will always have a small supply of bandwidth. So, no matter what happens, you will be able to ssh to your server and DNS will always work. -QoS, is extremely light. You will configure it once, and this is it. It will not bother you again -and it will not use any noticeable CPU resources, especially on application and database servers. +3. **Ensure administrative tasks will not monopolize all the bandwidth** + + Services like backups, file copies, database dumps, etc can easily monopolize all the available bandwidth. It is common for example a nightly backup, or a huge file transfer to negatively influence the end-user experience. QoS can fix that. + +4. **Ensure each end-user connection will get a fair cut of the available bandwidth.** + + Several QoS queuing disciplines in Linux do this automatically, without any configuration from you. The result is that new sockets are favored over older ones, so that users will get a snappier experience, while others are transferring large amounts of traffic. + +5. **Protect the servers from DDoS attacks.** + + When your system is under a DDoS attack, it will get a lot more bandwidth compared to the one it can handle and probably your applications will crash. Setting a limit on the inbound traffic using QoS, will protect your servers (throttle the requests) and depending on the size of the attack may allow your legitimate users to access the server, while the attack is taking place. + + Using QoS together with a [SYNPROXY](../proc.plugin/README.md#linux-anti-ddos) will provide a great degree of protection against most DDoS attacks. Actually when I wrote that article, a few folks tried to DDoS the netdata demo site to see in real-time the SYNPROXY operation. They did not do it right, but anyway a great deal of requests reached the netdata server. What saved netdata was QoS. The netdata demo server has QoS installed, so the requests were throttled and the server did not even reach the point of resource starvation. Read about it [here](../proc.plugin/README.md#linux-anti-ddos). + +On top of all these, QoS is extremely light. You will configure it once, and this is it. It will not bother you again and it will not use any noticeable CPU resources, especially on application and database servers. + + - ensure administrative tasks (like ssh, dns, etc) will always have a small but guaranteed bandwidth. So, no matter what happens, I will be able to ssh to my server and DNS will work. + + - ensure other administrative tasks will not monopolize all the available bandwidth. So, my nightly backup will not hurt my users, a developer that is copying files over the net will not get all the available bandwidth, etc. + + - ensure each end-user connection will get a fair cut of the available bandwidth. + +Once **traffic classification** is applied, we can use **[netdata](https://github.com/netdata/netdata)** to visualize the bandwidth consumption per class in real-time (no configuration is needed for netdata - it will figure it out). + +QoS, is extremely light. You will configure it once, and this is it. It will not bother you again and it will not use any noticeable CPU resources, especially on application and database servers. + +--- ## QoS in Linux? Have you lost your mind? @@ -94,28 +88,35 @@ Yes I know... but no, I have not! Of course, `tc` is probably **the most undocumented, complicated and unfriendly** command in Linux. -For example, for matching a simple port range in `tc`, e.g. all the high ports, from 1025 to 65535 -inclusive, you have to match these: +For example, do you know that for matching a simple port range in `tc`, e.g. all the high ports, from 1025 to 65535 inclusive, you have to match these: ``` -1025/0xffff 1026/0xfffe 1028/0xfffc 1032/0xfff8 1040/0xfff0 -1056/0xffe0 1088/0xffc0 1152/0xff80 1280/0xff00 1536/0xfe00 -2048/0xf800 4096/0xf000 8192/0xe000 16384/0xc000 32768/0x8000 +1025/0xffff +1026/0xfffe +1028/0xfffc +1032/0xfff8 +1040/0xfff0 +1056/0xffe0 +1088/0xffc0 +1152/0xff80 +1280/0xff00 +1536/0xfe00 +2048/0xf800 +4096/0xf000 +8192/0xe000 +16384/0xc000 +32768/0x8000 ``` I know what you are thinking right now! **And I agree!** -This is why I wrote **[FireQOS](https://firehol.org/tutorial/fireqos-new-user/)**, a tool to -simplify QoS management in Linux. +This is why I wrote **[FireQOS](https://firehol.org/tutorial/fireqos-new-user/)**, a tool to simplify QoS management in Linux. -The **[FireHOL](https://firehol.org/)** package already distributes **[FireQOS](https://firehol.org/tutorial/fireqos-new-user/)**. -Check the **[FireQOS tutorial](https://firehol.org/tutorial/fireqos-new-user/)** -to learn how to write your own QoS configuration. +The **[FireHOL](https://firehol.org/)** package already distributes **[FireQOS](https://firehol.org/tutorial/fireqos-new-user/)**. Check the **[FireQOS tutorial](https://firehol.org/tutorial/fireqos-new-user/)** to learn how to write your own QoS configuration. -With **[FireQOS](https://firehol.org/tutorial/fireqos-new-user/)**, it is **really simple for everyone -to use QoS in Linux**. Just install the package `firehol`. It should already be available for your -distribution. If not, check the **[FireHOL Installation Guide](https://firehol.org/installing/)**. -After that, you will have the `fireqos` command. +With **[FireQOS](https://firehol.org/tutorial/fireqos-new-user/)**, it is **really simple for everyone to use QoS in Linux**. Just install the package `firehol`. It should already be available for your distribution. If not, check the **[FireHOL Installation Guide](https://firehol.org/installing/)**. After that, you will have the `fireqos` command which uses a configuration like the following: + +## QoS Configuration This is the file `/etc/firehol/fireqos.conf` we use at the netdata demo site: @@ -157,14 +158,9 @@ This is the file `/etc/firehol/fireqos.conf` we use at the netdata demo site: match input src 10.2.3.5 ``` -Nothing more is needed. You just run `fireqos start` to apply this configuration, restart netdata -and you have real-time visualization of the bandwidth consumption of your applications. FireQOS is -not a daemon. It will just convert the configuration to `tc` commands. It will run them and it will -exit. +Nothing more is needed. You just run `fireqos start` to apply this configuration, restart netdata and you have real-time visualization of the bandwidth consumption of your applications. FireQOS is not a daemon. It will just convert the configuration to `tc` commands. It will run them and it will exit. -**IMPORTANT**: If you copy this configuration to apply it to your system, please adapt the -speeds - experiment in non-production environments to learn the tool, before applying it on -your servers. +**IMPORTANT**: If you copy this configuration to apply it to your system, please adapt the speeds - experiment in non-production environments to learn the tool, before applying it on your servers. And this is what you are going to get: @@ -174,10 +170,11 @@ And this is what you are going to get: ## More examples: -This is QoS from a linux router. Check these features: +This is QoS from my home linux router. Check these features: 1. It is real-time (per second updates) 2. QoS really works in Linux - check that the `background` traffic is squeezed when `surfing` needs it.  + diff --git a/collectors/tc.plugin/tc-qos-helper.sh b/collectors/tc.plugin/tc-qos-helper.sh index b49d1f509..a1a2b9145 100644 --- a/collectors/tc.plugin/tc-qos-helper.sh +++ b/collectors/tc.plugin/tc-qos-helper.sh @@ -100,7 +100,7 @@ if [ ! -d "${fireqos_run_dir}" ] warning "Although FireQoS is installed on this system as '${fireqos}', I cannot find/read its installation configuration at '${fireqos_exec_dir}/install.config'." fi else - warning "FireQoS is not installed on this system. Use FireQoS to apply traffic QoS and expose the class names to netdata. Check https://github.com/netdata/netdata/wiki/You-should-install-QoS-on-all-your-servers" + warning "FireQoS is not installed on this system. Use FireQoS to apply traffic QoS and expose the class names to netdata. Check https://github.com/netdata/netdata/tree/master/collectors/tc.plugin#tcplugin" fi fi diff --git a/collectors/tc.plugin/tc-qos-helper.sh.in b/collectors/tc.plugin/tc-qos-helper.sh.in index 6f6b0a591..a15eab899 100755 --- a/collectors/tc.plugin/tc-qos-helper.sh.in +++ b/collectors/tc.plugin/tc-qos-helper.sh.in @@ -100,7 +100,7 @@ if [ ! -d "${fireqos_run_dir}" ] warning "Although FireQoS is installed on this system as '${fireqos}', I cannot find/read its installation configuration at '${fireqos_exec_dir}/install.config'." fi else - warning "FireQoS is not installed on this system. Use FireQoS to apply traffic QoS and expose the class names to netdata. Check https://github.com/netdata/netdata/wiki/You-should-install-QoS-on-all-your-servers" + warning "FireQoS is not installed on this system. Use FireQoS to apply traffic QoS and expose the class names to netdata. Check https://github.com/netdata/netdata/tree/master/collectors/tc.plugin#tcplugin" fi fi @@ -1,6 +1,6 @@ #! /bin/sh # Guess values for system-dependent variables and create Makefiles. -# Generated by GNU Autoconf 2.69 for netdata 1.11.0_rolling. +# Generated by GNU Autoconf 2.69 for netdata 1.11.1_rolling. # # # Copyright (C) 1992-1996, 1998-2012 Free Software Foundation, Inc. @@ -577,8 +577,8 @@ MAKEFLAGS= # Identity of this package. PACKAGE_NAME='netdata' PACKAGE_TARNAME='netdata' -PACKAGE_VERSION='1.11.0_rolling' -PACKAGE_STRING='netdata 1.11.0_rolling' +PACKAGE_VERSION='1.11.1_rolling' +PACKAGE_STRING='netdata 1.11.1_rolling' PACKAGE_BUGREPORT='' PACKAGE_URL='' @@ -1376,7 +1376,7 @@ if test "$ac_init_help" = "long"; then # Omit some internal or obsolete options to make the list less imposing. # This message is too long to be a string in the A/UX 3.1 sh. cat <<_ACEOF -\`configure' configures netdata 1.11.0_rolling to adapt to many kinds of systems. +\`configure' configures netdata 1.11.1_rolling to adapt to many kinds of systems. Usage: $0 [OPTION]... [VAR=VALUE]... @@ -1446,7 +1446,7 @@ fi if test -n "$ac_init_help"; then case $ac_init_help in - short | recursive ) echo "Configuration of netdata 1.11.0_rolling:";; + short | recursive ) echo "Configuration of netdata 1.11.1_rolling:";; esac cat <<\_ACEOF @@ -1589,7 +1589,7 @@ fi test -n "$ac_init_help" && exit $ac_status if $ac_init_version; then cat <<\_ACEOF -netdata configure 1.11.0_rolling +netdata configure 1.11.1_rolling generated by GNU Autoconf 2.69 Copyright (C) 2012 Free Software Foundation, Inc. @@ -2367,7 +2367,7 @@ cat >config.log <<_ACEOF This file contains any messages produced by compilers while running configure, to aid debugging if configure makes a mistake. -It was created by netdata $as_me 1.11.0_rolling, which was +It was created by netdata $as_me 1.11.1_rolling, which was generated by GNU Autoconf 2.69. Invocation command line was $ $0 $@ @@ -2752,7 +2752,7 @@ $as_echo "$as_me: ***************** MAINTAINER MODE *****************" >&6;} PACKAGE_BUILT_DATE=$(date '+%d %b %Y') fi -PACKAGE_RPM_VERSION="1.10.1" +PACKAGE_RPM_VERSION="1.11.0" @@ -3283,7 +3283,7 @@ fi # Define the identity of the package. PACKAGE='netdata' - VERSION='1.11.0_rolling' + VERSION='1.11.1_rolling' cat >>confdefs.h <<_ACEOF @@ -8658,7 +8658,7 @@ cat >>$CONFIG_STATUS <<\_ACEOF || ac_write_fail=1 # report actual input values of CONFIG_FILES etc. instead of their # values after options handling. ac_log=" -This file was extended by netdata $as_me 1.11.0_rolling, which was +This file was extended by netdata $as_me 1.11.1_rolling, which was generated by GNU Autoconf 2.69. Invocation command line was CONFIG_FILES = $CONFIG_FILES @@ -8724,7 +8724,7 @@ _ACEOF cat >>$CONFIG_STATUS <<_ACEOF || ac_write_fail=1 ac_cs_config="`$as_echo "$ac_configure_args" | sed 's/^ //; s/[\\""\`\$]/\\\\&/g'`" ac_cs_version="\\ -netdata config.status 1.11.0_rolling +netdata config.status 1.11.1_rolling configured by $0, generated by GNU Autoconf 2.69, with options \\"\$ac_cs_config\\" diff --git a/configure.ac b/configure.ac index 2a7337379..06e3bf7af 100644 --- a/configure.ac +++ b/configure.ac @@ -5,8 +5,8 @@ AC_PREREQ(2.60) define([VERSION_MAJOR], [1]) -define([VERSION_MINOR], [10]) -define([VERSION_FIX], [1]) +define([VERSION_MINOR], [11]) +define([VERSION_FIX], [0]) define([VERSION_NUMBER], VERSION_MAJOR[.]VERSION_MINOR[.]VERSION_FIX) define([VERSION_SUFFIX], [_rolling]) diff --git a/contrib/debian/changelog b/contrib/debian/changelog index 730844070..ee5e82ebd 100644 --- a/contrib/debian/changelog +++ b/contrib/debian/changelog @@ -1,3 +1,3 @@ -netdata (1.11.0~rolling) UNRELEASED; urgency=medium +netdata (1.11.1~rolling) UNRELEASED; urgency=medium * Latest release - -- Netdata Team <> Fri, 02 Nov 2018 14:25:18 +0000 + -- Netdata Team <> Thu, 22 Nov 2018 20:33:40 +0000 diff --git a/contrib/debian/netdata.docs b/contrib/debian/netdata.docs index 56631abf1..1b763b1ba 100644 --- a/contrib/debian/netdata.docs +++ b/contrib/debian/netdata.docs @@ -1 +1 @@ -ChangeLog +CHANGELOG.md diff --git a/contrib/debian/rules b/contrib/debian/rules index ec4ec4182..c19323960 100755 --- a/contrib/debian/rules +++ b/contrib/debian/rules @@ -54,16 +54,14 @@ override_dh_install: debian/netdata.postinst override_dh_installdocs: dh_installdocs - # Docs should not be under /usr/lib - # - mv $(TOP)/usr/lib/$(DEB_HOST_MULTIARCH)/netdata/plugins.d/README.md \ - $(TOP)/usr/share/doc/netdata/README.plugins.md - mv $(TOP)/usr/lib/$(DEB_HOST_MULTIARCH)/netdata/charts.d/README.md \ - $(TOP)/usr/share/doc/netdata/README.charts.md - - # This doc is currently empty, so no point installing it. - # - rm $(TOP)/usr/lib/$(DEB_HOST_MULTIARCH)/netdata/node.d/README.md + find . \ + -name README.md \ + -not -path './.travis/*' \ + -not -path './debian/*' \ + -exec cp \ + --parents \ + --target $(TOP)/usr/share/doc/netdata/ \ + {} \; override_dh_fixperms: dh_fixperms diff --git a/daemon/Makefile.am b/daemon/Makefile.am index bdd02774c..bffc864dd 100644 --- a/daemon/Makefile.am +++ b/daemon/Makefile.am @@ -5,4 +5,5 @@ MAINTAINERCLEANFILES= $(srcdir)/Makefile.in dist_noinst_DATA = \ README.md \ + config/README.md \ $(NULL) diff --git a/daemon/Makefile.in b/daemon/Makefile.in index 8c7ad21a5..7111dfa1a 100644 --- a/daemon/Makefile.in +++ b/daemon/Makefile.in @@ -272,6 +272,7 @@ AUTOMAKE_OPTIONS = subdir-objects MAINTAINERCLEANFILES = $(srcdir)/Makefile.in dist_noinst_DATA = \ README.md \ + config/README.md \ $(NULL) all: all-am diff --git a/daemon/README.md b/daemon/README.md index 2a5ebfa0c..305fc961d 100644 --- a/daemon/README.md +++ b/daemon/README.md @@ -1,6 +1,87 @@ -# Netdata daemon +# Running the Netdata Daemon +## Starting netdata +- You can start netdata by executing it with `/usr/sbin/netdata` (the installer will also start it). + +- You can stop netdata by killing it with `killall netdata`. + You can stop and start netdata at any point. Netdata saves on exit its round robbin + database to `/var/cache/netdata` so that it will continue from where it stopped the last time. + +Access to the web site, for all graphs, is by default on port `19999`, so go to: + + ``` + http://127.0.0.1:19999/ + ``` + +You can get the running config file at any time, by accessing `http://127.0.0.1:19999/netdata.conf`. + +### Starting netdata at boot + +In the `system` directory you can find scripts and configurations for the various distros. + +#### systemd + +The installer already installs `netdata.service` if it detects a systemd system. + +To install `netdata.service` by hand, run: + +```sh +# stop netdata +killall netdata + +# copy netdata.service to systemd +cp system/netdata.service /etc/systemd/system/ + +# let systemd know there is a new service +systemctl daemon-reload + +# enable netdata at boot +systemctl enable netdata + +# start netdata +systemctl start netdata +``` + +#### init.d + +In the system directory you can find `netdata-lsb`. Copy it to the proper place according to your distribution documentation. For Ubuntu, this can be done via running the following commands as root. + +```sh +# copy the netdata startup file to /etc/init.d +cp system/netdata-lsb /etc/init.d/netdata + +# make sure it is executable +chmod +x /etc/init.d/netdata + +# enable it +update-rc.d netdata defaults +``` + +#### openrc (gentoo) + +In the `system` directory you can find `netdata-openrc`. Copy it to the proper place according to your distribution documentation. + +#### CentOS / Red Hat Enterprise Linux + +For older versions of RHEL/CentOS that don't have systemd, an init script is included in the system directory. This can be installed by running the following commands as root. + +```sh +# copy the netdata startup file to /etc/init.d +cp system/netdata-init-d /etc/init.d/netdata + +# make sure it is executable +chmod +x /etc/init.d/netdata + +# enable it +chkconfig --add netdata +``` + +_There have been some recent work on the init script, see PR https://github.com/netdata/netdata/pull/403_ + +#### other systems + +You can start netdata by running it from `/etc/rc.local` or equivalent. ## Command line options @@ -32,7 +113,7 @@ The command line options of the netdata 1.10.0 version are the following: Source Code: https://github.com/netdata/netdata Wiki / Docs: https://github.com/netdata/netdata/wiki Support : https://github.com/netdata/netdata/issues - License : https://github.com/netdata/netdata/blob/master/LICENSE.md + License : https://github.com/netdata/netdata/blob/master/LICENSE Twitter : https://twitter.com/linuxnetdata Facebook : https://www.facebook.com/linuxnetdata/ @@ -387,7 +468,7 @@ When you compile netdata with debugging: 1. compiler optimizations for your CPU are disabled (netdata will run somewhat slower) -2. a lot of code is added all over netdata, to log debug messages to `/var/log/netdata/debug.log`. However, nothing is printed by default. netdata allows you to select which sections of netdata you want to trace. Tracing is activated via the config option `debug flags`. It accepts a hex number, to enable or disable specific sections. You can find the options supported at [log.h](https://github.com/netdata/netdata/blob/master/libnetdata/log/log.h). They are the `D_*` defines. The value `0xffffffffffffffff` will enable all possible debug flags. +2. a lot of code is added all over netdata, to log debug messages to `/var/log/netdata/debug.log`. However, nothing is printed by default. netdata allows you to select which sections of netdata you want to trace. Tracing is activated via the config option `debug flags`. It accepts a hex number, to enable or disable specific sections. You can find the options supported at [log.h](../libnetdata/log/log.h). They are the `D_*` defines. The value `0xffffffffffffffff` will enable all possible debug flags. Once netdata is compiled with debugging and tracing is enabled for a few sections, the file `/var/log/netdata/debug.log` will contain the messages. diff --git a/daemon/config/README.md b/daemon/config/README.md new file mode 100755 index 000000000..5cd7844a2 --- /dev/null +++ b/daemon/config/README.md @@ -0,0 +1,175 @@ +# Configuration Guide + +Configuration files are placed in `/etc/netdata`. + +## Netdata Daemon + +The daemon configuration file is read from `/etc/netdata/netdata.conf`. + +In this file you can configure all aspects of netdata. Netdata provides configuration settings for plugins and charts found when started. You can find all these settings, with their default values, by accessing the URL `https://netdata.server.hostname:19999/netdata.conf`. For example check the configuration file of [netdata.firehol.org](http://netdata.firehol.org/netdata.conf). + +The configuration file has sections stated with `[section]`. There will be the following sections: + +1. `[global]` for global netdata daemon options +2. `[plugins]` for controlling which plugins the netdata will use +3. `[plugin:NAME]` one such section for each plugin enabled +4. `[CHART_NAME]` once such section for each chart defined + +The configuration file is a `name = value` dictionary. Netdata will not complain if you set options unknown to it. When you check the running configuration by accessing the URL `/netdata.conf` on your netdata server, netdata will add a comment on settings it does not currently use. + +### [global] section options + + +setting | default | info +:------:|:-------:|:---- +hostname|auto-detected|The hostname of the computer running netdata. +history|3600|The number of entries the netdata daemon will by default keep in memory for each chart dimension. This setting can also be configured per chart. Check [Memory Requirements](../../database/#netdata-database) for more information. +config directory|`/etc/netdata`|The directory configuration files are kept. +plugins directory|`/usr/libexec/netdata/plugins.d`|The directory plugin programs are kept. This setting supports multiple directories, space separated. If any directory path contains spaces, enclose it in single or double quotes. +web files directory|`/usr/share/netdata/web`|The directory the web static files are kept. +cache directory|`/var/cache/netdata`|The directory the memory database will be stored if and when netdata exits. Netdata will re-read the database when it will start again, to continue from the same point. +log directory|`/var/log/netdata`|The directory in which the [log files](../#log-files) are kept. +host access prefix|*empty*|This is used in docker environments where /proc, /sys, etc have to be accessed via another path. You may also have to set SYS_PTRACE capability on the docker for this work. Check [issue 43](https://github.com/netdata/netdata/issues/43). +debug flags|0x00000000|Bitmap of debug options to enable. For more information check [Tracing Options](../#debugging). +memory deduplication (ksm)|yes|When set to `yes`, netdata will offer its in-memory round robin database to kernel same page merging (KSM) for deduplication. For more information check [[Memory Deduplication - Kernel Same Page Merging - KSM]] +debug log|`/var/log/netdata/debug.log`|The filename to save debug information. This file will not be created is debugging is not enabled. You can also set it to `syslog` to send the debug messages to syslog, or `none` to disable this log. For more information check [Tracing Options](../#debugging). +error log|`/var/log/netdata/error.log`|The filename to save error messages for netdata daemon and all plugins (`stderr` is sent here for all netdata programs, including the plugins). You can also set it to `syslog` to send the errors to syslog, or `none` to disable this log. +access log|`/var/log/netdata/access.log`|The filename to save the log of web clients accessing netdata charts. You can also set it to `syslog` to send the access log to syslog, or `none` to disable this log. +memory mode|save|When set to `save` netdata will save its round robin database on exit and load it on startup. When set to `map` the cache files will be updated in real time (check `man mmap` - do not set this on systems with heavy load or slow disks - the disks will continuously sync the in-memory database of netdata). When set to `ram` the round robin database will be temporary and it will be lost when netdata exits. +update every|1|The frequency in seconds, for data collection. For more information see [Performance](../../doc/Performance.md#netdata-performance). +run as user|`netdata`|The user netdata will run as. +web files owner|`netdata`|The user that owns the web static files. Netdata will refuse to serve a file that is not owned by this user, even if it has read access to that file. If the user given is not found, netdata will only serve files owned by user given in `run as user`. +http port listen backlog|100|The port backlog. Check `man 2 listen`. +default port|19999|The default port to listen for web clients. +bind to|`*`|The IP address and port to listen to. This is a space separated list of IPv4 or IPv6 address and ports. The default will bind to all IP addresses. Example: `bind to = 127.0.0.1:19999 10.11.12.1:19998 [::1]:19999`. +disconnect idle web clients after seconds|60|The time in seconds to disconnect web clients after being totally idle. +enable web responses gzip compression|yes|When set to `yes`, netdata web responses will be GZIP compressed, if the web client accepts such responses. + +##### netdata process priority + +By default, netdata runs with the `idle` process scheduler, which assigns CPU resources to netdata, only when the system has such resources to spare. + +The following `netdata.conf` settings control this: + +``` +[global] + process scheduling policy = idle + process scheduling priority = 0 + process nice level = 19 +``` + +The policies supported by netdata are `idle` (the netdata default), `other` (also as `nice`), `batch`, `rr`, `fifo`. netdata also recognizes `keep` and `none` to keep the current settings without changing them. + +For `other`, `nice` and `batch`, the setting `process nice level = 19` is activated to configure the nice level of netdata. Nice gets values -20 (highest) to 19 (lowest). + +For `rr` and `fifo`, the setting `process scheduling priority = 0` is activated to configure the priority of the relative scheduling policy. Priority gets values 1 (lowest) to 99 (highest). + +For the details of each scheduler, see `man sched_setscheduler` and `man sched`. + +When netdata is running under systemd, it can only lower its priority (the default is `other` with `nice level = 0`). If you want to make netdata to get more CPU than that, you will need to set in `netdata.conf`: + +``` +[global] + process scheduling policy = keep +``` + +and edit `/etc/systemd/system/netdata.service` and add: + +``` +CPUSchedulingPolicy=other | batch | idle | fifo | rr +CPUSchedulingPriority=99 +Nice=-10 +``` + + +### [plugins] section options + +In this section there will be a boolean (`yes`/`no`) option for each plugin. Additionally, there will be the following options: + +setting | default | info +:------:|:-------:|:---- +checks|no|This is a debugging plugin for the internal latency of netdata. +enable running new plugins|yes|When set to `yes`, netdata will enable plugins not configured specifically for them. Setting this to `no` will disable all plugins you have not set to `yes` explicitly. +check for new plugins every|60|The time in seconds to check for new plugins in the plugins directory. This allows having other applications dynamically creating plugins for netdata. + +## Netdata Plugins + +The configuration options for plugins appear in sections following the pattern `[plugin:NAME]`. + +### Internal Plugins + +Most internal plugins will provide additional options. Check [Internal Plugins](../../collectors/) for more information. + + +### External Plugins + +External plugins will have only 2 options at `netdata.conf`: + +setting | default | info +:------:|:-------:|:---- +update every|the value of `[global].update every` setting|The frequency in seconds the plugin should collect values. For more information check [Performance](../../doc/Performance.md#netdata-performance). +command options|*empty*|Additional command line options to pass to the plugin. + +External plugins that need additional configuration may support a dedicated file in `/etc/netdata`. Check their documentation. + +--- + +## A note about netdata.conf + +This config file is not needed by default. You can just touch it (to be empty) to get rid of the error message displayed when missing. + +The whole idea came up when I was evaluating the documentation involved in maintaining a complex configuration system. My intention was to give configuration options for everything imaginable. But then, documenting all these options would require a tremendous amount of time, users would have to search through endless pages for the option they need, etc. + +I concluded then that configuring software like that is a waste for time and effort. Of course there must be plenty of configuration options, but the implementation itself should require a lot less effort for both the devs and the users. + +So, I did this: + +1. No configuration is required to run netdata +2. There are plenty of options to tweak +3. There is minimal documentation (or no at all) + +### Why this works? + +The configuration file is a `name = value` dictionary with `[sections]`. Write whatever you like there as long as it follows this simple format. + +Netdata loads this dictionary and then when the code needs a value from it, it just looks up the `name` in the dictionary at the proper `section`. In all places, in the code, there are both the `names` and their `default values`, so if something is not found in the configuration file, the default is used. The lookup is made using B-Trees and hashes (no string comparisons), so they are super fast. Also the `names` of the settings can be `my super duper setting that once set to yes, will turn the world upside down = no` - so goodbye to most of the documentation involved. + +Next, netdata can generate a valid configuration for the user to edit. No need to remember anything. Just get the configuration from the server (`/netdata.conf` on your netdata server), edit it and save it. + +Last, what about options you believe you have set, but you misspelled? When you get the configuration file from the server, there will be a comment above all `name = value` pairs the server does not use. So you know that whatever you wrote there, is not used. + +### limiting access to netdata.conf + +netdata v1.9+ limit by default access to `http://your.netdata.ip:19999/netdata.conf` to private IP addresses. This is controlled by this settings: + +``` +[web] + allow netdata.conf from = localhost fd* 10.* 192.168.* 172.16.* 172.17.* 172.18.* 172.19.* 172.20.* 172.21.* 172.22.* 172.23.* 172.24.* 172.25.* 172.26.* 172.27.* 172.28.* 172.29.* 172.30.* 172.31.* +``` + +The IPs listed are all the private IPv4 addresses, including link local IPv6 addresses. + +> Keep in mind that connections to netdata API ports are filtered by `[web].allow connections from`. So, IPs allowed by `[web].allow netdata.conf from` should also be allowed by `[web].allow connections from`. + + +## netdata simple patterns + +Unix prefers regular expressions. But they are just too hard, too cryptic to use, write and understand. + +So, netdata supports [simple patterns](../../libnetdata/simple_pattern/). + +## Applying changes + +After `netdata.conf` has been modified, netdata needs to be restarted for changes to apply: + +```bash +sudo service netdata restart +``` + +If the above does not work, try the following: + +```bash +sudo killall netdata; sleep 10; sudo netdata +``` + +Please note that your data history will be lost if you have modified `history` parameter in section `[global]`. diff --git a/daemon/unit_test.c b/daemon/unit_test.c index 9978647b4..a92a50a11 100644 --- a/daemon/unit_test.c +++ b/daemon/unit_test.c @@ -130,13 +130,17 @@ int check_storage_number(calculated_number n, int debug) { p, pdiff, pcdiff ); if(len != strlen(buffer)) fprintf(stderr, "ERROR: printed number %s is reported to have length %zu but it has %zu\n", buffer, len, strlen(buffer)); - if(dcdiff > ACCURACY_LOSS) fprintf(stderr, "WARNING: packing number " CALCULATED_NUMBER_FORMAT " has accuracy loss " CALCULATED_NUMBER_FORMAT " %%\n", n, dcdiff); - if(pcdiff > ACCURACY_LOSS) fprintf(stderr, "WARNING: re-parsing the packed, unpacked and printed number " CALCULATED_NUMBER_FORMAT " has accuracy loss " CALCULATED_NUMBER_FORMAT " %%\n", n, pcdiff); + + if(dcdiff > ACCURACY_LOSS_ACCEPTED_PERCENT) + fprintf(stderr, "WARNING: packing number " CALCULATED_NUMBER_FORMAT " has accuracy loss " CALCULATED_NUMBER_FORMAT " %%\n", n, dcdiff); + + if(pcdiff > ACCURACY_LOSS_ACCEPTED_PERCENT) + fprintf(stderr, "WARNING: re-parsing the packed, unpacked and printed number " CALCULATED_NUMBER_FORMAT " has accuracy loss " CALCULATED_NUMBER_FORMAT " %%\n", n, pcdiff); } if(len != strlen(buffer)) return 1; - if(dcdiff > ACCURACY_LOSS) return 3; - if(pcdiff > ACCURACY_LOSS) return 4; + if(dcdiff > ACCURACY_LOSS_ACCEPTED_PERCENT) return 3; + if(pcdiff > ACCURACY_LOSS_ACCEPTED_PERCENT) return 4; return 0; } @@ -159,6 +163,9 @@ void benchmark_storage_number(int loop, int multiplier) { storage_number s; unsigned long long user, system, total, mine, their; + calculated_number storage_number_positive_min = unpack_storage_number(STORAGE_NUMBER_POSITIVE_MIN_RAW); + calculated_number storage_number_positive_max = unpack_storage_number(STORAGE_NUMBER_POSITIVE_MAX_RAW); + char buffer[100]; struct rusage now, last; @@ -181,11 +188,11 @@ void benchmark_storage_number(int loop, int multiplier) { } fprintf(stderr, "\nNETDATA FLOATING POINT\n"); - fprintf(stderr, "MIN POSITIVE VALUE " CALCULATED_NUMBER_FORMAT "\n", storage_number_min(1)); - fprintf(stderr, "MAX POSITIVE VALUE " CALCULATED_NUMBER_FORMAT "\n", (calculated_number)STORAGE_NUMBER_POSITIVE_MAX); - fprintf(stderr, "MIN NEGATIVE VALUE " CALCULATED_NUMBER_FORMAT "\n", (calculated_number)STORAGE_NUMBER_NEGATIVE_MIN); - fprintf(stderr, "MAX NEGATIVE VALUE " CALCULATED_NUMBER_FORMAT "\n", -storage_number_min(1)); - fprintf(stderr, "Maximum accuracy loss: " CALCULATED_NUMBER_FORMAT "%%\n\n\n", (calculated_number)ACCURACY_LOSS); + fprintf(stderr, "MIN POSITIVE VALUE " CALCULATED_NUMBER_FORMAT "\n", unpack_storage_number(STORAGE_NUMBER_POSITIVE_MIN_RAW)); + fprintf(stderr, "MAX POSITIVE VALUE " CALCULATED_NUMBER_FORMAT "\n", unpack_storage_number(STORAGE_NUMBER_POSITIVE_MAX_RAW)); + fprintf(stderr, "MIN NEGATIVE VALUE " CALCULATED_NUMBER_FORMAT "\n", unpack_storage_number(STORAGE_NUMBER_NEGATIVE_MIN_RAW)); + fprintf(stderr, "MAX NEGATIVE VALUE " CALCULATED_NUMBER_FORMAT "\n", unpack_storage_number(STORAGE_NUMBER_NEGATIVE_MAX_RAW)); + fprintf(stderr, "Maximum accuracy loss accepted: " CALCULATED_NUMBER_FORMAT "%%\n\n\n", (calculated_number)ACCURACY_LOSS_ACCEPTED_PERCENT); // ------------------------------------------------------------------------ @@ -194,11 +201,11 @@ void benchmark_storage_number(int loop, int multiplier) { // do the job for(j = 1; j < 11 ;j++) { - n = STORAGE_NUMBER_POSITIVE_MIN * j; + n = storage_number_positive_min * j; for(i = 0; i < loop ;i++) { n *= multiplier; - if(n > STORAGE_NUMBER_POSITIVE_MAX) n = STORAGE_NUMBER_POSITIVE_MIN; + if(n > storage_number_positive_max) n = storage_number_positive_min; print_calculated_number(buffer, n); } @@ -219,11 +226,11 @@ void benchmark_storage_number(int loop, int multiplier) { // do the job for(j = 1; j < 11 ;j++) { - n = STORAGE_NUMBER_POSITIVE_MIN * j; + n = storage_number_positive_min * j; for(i = 0; i < loop ;i++) { n *= multiplier; - if(n > STORAGE_NUMBER_POSITIVE_MAX) n = STORAGE_NUMBER_POSITIVE_MIN; + if(n > storage_number_positive_max) n = storage_number_positive_min; snprintfz(buffer, 100, CALCULATED_NUMBER_FORMAT, n); } } @@ -250,13 +257,13 @@ void benchmark_storage_number(int loop, int multiplier) { // do the job for(j = 1; j < 11 ;j++) { - n = STORAGE_NUMBER_POSITIVE_MIN * j; + n = storage_number_positive_min * j; for(i = 0; i < loop ;i++) { n *= multiplier; - if(n > STORAGE_NUMBER_POSITIVE_MAX) n = STORAGE_NUMBER_POSITIVE_MIN; + if(n > storage_number_positive_max) n = storage_number_positive_min; - s = pack_storage_number(n, 1); + s = pack_storage_number(n, SN_EXISTS); d = unpack_storage_number(s); print_calculated_number(buffer, d); } @@ -282,7 +289,7 @@ void benchmark_storage_number(int loop, int multiplier) { } static int check_storage_number_exists() { - uint32_t flags = SN_EXISTS; + uint32_t flags; for(flags = 0; flags < 7 ; flags++) { @@ -309,10 +316,12 @@ static int check_storage_number_exists() { return 0; } -int unit_test_storage() -{ +int unit_test_storage() { if(check_storage_number_exists()) return 0; + calculated_number storage_number_positive_min = unpack_storage_number(STORAGE_NUMBER_POSITIVE_MIN_RAW); + calculated_number storage_number_negative_max = unpack_storage_number(STORAGE_NUMBER_NEGATIVE_MAX_RAW); + calculated_number c, a = 0; int i, j, g, r = 0; @@ -325,14 +334,15 @@ int unit_test_storage() a += 0.0000001; c = a * g; for(i = 0; i < 21 ;i++, c *= 10) { - if(c > 0 && c < STORAGE_NUMBER_POSITIVE_MIN) continue; - if(c < 0 && c > STORAGE_NUMBER_NEGATIVE_MAX) continue; + if(c > 0 && c < storage_number_positive_min) continue; + if(c < 0 && c > storage_number_negative_max) continue; if(check_storage_number(c, 1)) return 1; } } } + // if(check_storage_number(858993459.1234567, 1)) return 1; benchmark_storage_number(1000000, 2); return r; } @@ -575,28 +585,36 @@ struct test test4 = { }; // -------------------------------------------------------------------------------------------------------------------- -// test5 +// test5 - 32 bit overflows struct feed_values test5_feed[] = { - { 500000, 1000 }, - { 1000000, 2000 }, - { 1000000, 2000 }, - { 1000000, 2000 }, - { 1000000, 3000 }, - { 1000000, 2000 }, - { 1000000, 2000 }, - { 1000000, 2000 }, - { 1000000, 2000 }, - { 1000000, 2000 }, + { 0, 0x00000000FFFFFFFFULL / 3 * 0 }, + { 1000000, 0x00000000FFFFFFFFULL / 3 * 1 }, + { 1000000, 0x00000000FFFFFFFFULL / 3 * 2 }, + { 1000000, 0x00000000FFFFFFFFULL / 3 * 0 }, + { 1000000, 0x00000000FFFFFFFFULL / 3 * 1 }, + { 1000000, 0x00000000FFFFFFFFULL / 3 * 2 }, + { 1000000, 0x00000000FFFFFFFFULL / 3 * 0 }, + { 1000000, 0x00000000FFFFFFFFULL / 3 * 1 }, + { 1000000, 0x00000000FFFFFFFFULL / 3 * 2 }, + { 1000000, 0x00000000FFFFFFFFULL / 3 * 0 }, }; calculated_number test5_results[] = { - 1000, 500, 0, 500, 500, 0, 0, 0, 0 + 0x00000000FFFFFFFFULL / 3, + 0x00000000FFFFFFFFULL / 3, + 0x00000000FFFFFFFFULL / 3, + 0x00000000FFFFFFFFULL / 3, + 0x00000000FFFFFFFFULL / 3, + 0x00000000FFFFFFFFULL / 3, + 0x00000000FFFFFFFFULL / 3, + 0x00000000FFFFFFFFULL / 3, + 0x00000000FFFFFFFFULL / 3, }; struct test test5 = { "test5", // name - "test incremental values ups and downs", + "test 32-bit incremental values overflow", 1, // update_every 1, // multiplier 1, // divisor @@ -610,6 +628,135 @@ struct test test5 = { }; // -------------------------------------------------------------------------------------------------------------------- +// test5b - 16 bit overflows + +struct feed_values test5b_feed[] = { + { 0, 0x000000000000FFFFULL / 3 * 0 }, + { 1000000, 0x000000000000FFFFULL / 3 * 1 }, + { 1000000, 0x000000000000FFFFULL / 3 * 2 }, + { 1000000, 0x000000000000FFFFULL / 3 * 0 }, + { 1000000, 0x000000000000FFFFULL / 3 * 1 }, + { 1000000, 0x000000000000FFFFULL / 3 * 2 }, + { 1000000, 0x000000000000FFFFULL / 3 * 0 }, + { 1000000, 0x000000000000FFFFULL / 3 * 1 }, + { 1000000, 0x000000000000FFFFULL / 3 * 2 }, + { 1000000, 0x000000000000FFFFULL / 3 * 0 }, +}; + +calculated_number test5b_results[] = { + 0x000000000000FFFFULL / 3, + 0x000000000000FFFFULL / 3, + 0x000000000000FFFFULL / 3, + 0x000000000000FFFFULL / 3, + 0x000000000000FFFFULL / 3, + 0x000000000000FFFFULL / 3, + 0x000000000000FFFFULL / 3, + 0x000000000000FFFFULL / 3, + 0x000000000000FFFFULL / 3, +}; + +struct test test5b = { + "test5b", // name + "test 16-bit incremental values overflow", + 1, // update_every + 1, // multiplier + 1, // divisor + RRD_ALGORITHM_INCREMENTAL, // algorithm + 10, // feed entries + 9, // result entries + test5b_feed, // feed + test5b_results, // results + NULL, // feed2 + NULL // results2 +}; + +// -------------------------------------------------------------------------------------------------------------------- +// test5c - 8 bit overflows + +struct feed_values test5c_feed[] = { + { 0, 0x00000000000000FFULL / 3 * 0 }, + { 1000000, 0x00000000000000FFULL / 3 * 1 }, + { 1000000, 0x00000000000000FFULL / 3 * 2 }, + { 1000000, 0x00000000000000FFULL / 3 * 0 }, + { 1000000, 0x00000000000000FFULL / 3 * 1 }, + { 1000000, 0x00000000000000FFULL / 3 * 2 }, + { 1000000, 0x00000000000000FFULL / 3 * 0 }, + { 1000000, 0x00000000000000FFULL / 3 * 1 }, + { 1000000, 0x00000000000000FFULL / 3 * 2 }, + { 1000000, 0x00000000000000FFULL / 3 * 0 }, +}; + +calculated_number test5c_results[] = { + 0x00000000000000FFULL / 3, + 0x00000000000000FFULL / 3, + 0x00000000000000FFULL / 3, + 0x00000000000000FFULL / 3, + 0x00000000000000FFULL / 3, + 0x00000000000000FFULL / 3, + 0x00000000000000FFULL / 3, + 0x00000000000000FFULL / 3, + 0x00000000000000FFULL / 3, +}; + +struct test test5c = { + "test5c", // name + "test 8-bit incremental values overflow", + 1, // update_every + 1, // multiplier + 1, // divisor + RRD_ALGORITHM_INCREMENTAL, // algorithm + 10, // feed entries + 9, // result entries + test5c_feed, // feed + test5c_results, // results + NULL, // feed2 + NULL // results2 +}; + +// -------------------------------------------------------------------------------------------------------------------- +// test5d - 64 bit overflows + +struct feed_values test5d_feed[] = { + { 0, 0xFFFFFFFFFFFFFFFFULL / 3 * 0 }, + { 1000000, 0xFFFFFFFFFFFFFFFFULL / 3 * 1 }, + { 1000000, 0xFFFFFFFFFFFFFFFFULL / 3 * 2 }, + { 1000000, 0xFFFFFFFFFFFFFFFFULL / 3 * 0 }, + { 1000000, 0xFFFFFFFFFFFFFFFFULL / 3 * 1 }, + { 1000000, 0xFFFFFFFFFFFFFFFFULL / 3 * 2 }, + { 1000000, 0xFFFFFFFFFFFFFFFFULL / 3 * 0 }, + { 1000000, 0xFFFFFFFFFFFFFFFFULL / 3 * 1 }, + { 1000000, 0xFFFFFFFFFFFFFFFFULL / 3 * 2 }, + { 1000000, 0xFFFFFFFFFFFFFFFFULL / 3 * 0 }, +}; + +calculated_number test5d_results[] = { + 0xFFFFFFFFFFFFFFFFULL / 3, + 0xFFFFFFFFFFFFFFFFULL / 3, + 0xFFFFFFFFFFFFFFFFULL / 3, + 0xFFFFFFFFFFFFFFFFULL / 3, + 0xFFFFFFFFFFFFFFFFULL / 3, + 0xFFFFFFFFFFFFFFFFULL / 3, + 0xFFFFFFFFFFFFFFFFULL / 3, + 0xFFFFFFFFFFFFFFFFULL / 3, + 0xFFFFFFFFFFFFFFFFULL / 3, +}; + +struct test test5d = { + "test5d", // name + "test 64-bit incremental values overflow", + 1, // update_every + 1, // multiplier + 1, // divisor + RRD_ALGORITHM_INCREMENTAL, // algorithm + 10, // feed entries + 9, // result entries + test5d_feed, // feed + test5d_results, // results + NULL, // feed2 + NULL // results2 +}; + +// -------------------------------------------------------------------------------------------------------------------- // test6 struct feed_values test6_feed[] = { @@ -1131,7 +1278,7 @@ int run_test(struct test *test) unsigned long max = (st->counter < test->result_entries)?st->counter:test->result_entries; for(c = 0 ; c < max ; c++) { calculated_number v = unpack_storage_number(rd->values[c]); - calculated_number n = test->results[c]; + calculated_number n = unpack_storage_number(pack_storage_number(test->results[c], SN_EXISTS)); int same = (calculated_number_round(v * 10000000.0) == calculated_number_round(n * 10000000.0))?1:0; fprintf(stderr, " %s/%s: checking position %lu (at %lu secs), expecting value " CALCULATED_NUMBER_FORMAT ", found " CALCULATED_NUMBER_FORMAT ", %s\n", test->name, rd->name, c+1, @@ -1267,6 +1414,15 @@ int run_all_mockup_tests(void) if(run_test(&test5)) return 1; + if(run_test(&test5b)) + return 1; + + if(run_test(&test5c)) + return 1; + + if(run_test(&test5d)) + return 1; + if(run_test(&test6)) return 1; diff --git a/database/README.md b/database/README.md index 8f5e3a6df..68156f8a4 100644 --- a/database/README.md +++ b/database/README.md @@ -1,4 +1,4 @@ -# netdata database +# Netdata database Although `netdata` does all its calculations using `long double`, it stores all values using a [custom-made 32-bit number](../libnetdata/storage_number/). @@ -26,17 +26,17 @@ Currently netdata supports 5 memory modes: 1. `ram`, data are purely in memory. Data are never saved on disk. This mode uses `mmap()` and supports [KSM](#ksm). - + 2. `save`, (the default) data are only in RAM while netdata runs and are saved to / loaded from disk on netdata restart. It also uses `mmap()` and supports [KSM](#ksm). - + 3. `map`, data are in memory mapped files. This works like the swap. Keep in mind though, this will have a constant write on your disk. When netdata writes data on its memory, the Linux kernel marks the related memory pages as dirty and automatically starts updating them on disk. Unfortunately we cannot control how frequently this works. The Linux kernel uses exactly the same algorithm it uses for its swap memory. Check below for additional information on running a dedicated central netdata server. This mode uses `mmap()` but does not support [KSM](#ksm). - + 4. `none`, without a database (collected metrics can only be streamed to another netdata). 5. `alloc`, like `ram` but it uses `calloc()` and does not support [KSM](#ksm). This mode is the @@ -73,9 +73,9 @@ by netdata. Of course experiment a bit. On very weak devices you might have to u You can also disable [data collection plugins](../collectors) you don't need. Disabling such plugins will also free both CPU and RAM resources. -## running a dedicated central netdata server +## Running a dedicated central netdata server -netdata allows streaming data between netdata nodes. This allows us to have a central netdata +Netdata allows streaming data between netdata nodes. This allows us to have a central netdata server that will maintain the entire database for all nodes, and will also run health checks/alarms for all nodes. @@ -166,7 +166,7 @@ netdata, each byte at the in-memory database will be updated just once per day). KSM is a solution that will provide 60+% memory savings to netdata. -#### Enable KSM in kernel +### Enable KSM in kernel You need to run a kernel compiled with: @@ -186,7 +186,7 @@ The files that `CONFIG_KSM=y` offers include: So, by default `ksmd` is just disabled. It will not harm performance and the user/admin can control the CPU resources he/she is willing `ksmd` to use. -#### Run `ksmd` kernel daemon +### Run `ksmd` kernel daemon To activate / run `ksmd` you need to run: diff --git a/database/rrd.h b/database/rrd.h index 19eb100cd..24705ebb1 100644 --- a/database/rrd.h +++ b/database/rrd.h @@ -176,7 +176,9 @@ struct rrddim { char *cache_filename; // the filename we load/save from/to this set size_t collections_counter; // the number of times we added values to this rrdim - size_t unused[10]; + size_t unused[9]; + + collected_number collected_value_max; // the absolute maximum of the collected value unsigned int updated:1; // 1 when the dimension has been updated since the last processing unsigned int exposed:1; // 1 when set what have sent this dimension to the central netdata diff --git a/database/rrdcalctemplate.h b/database/rrdcalctemplate.h index 2235ecaa1..b8996bc14 100644 --- a/database/rrdcalctemplate.h +++ b/database/rrdcalctemplate.h @@ -58,7 +58,7 @@ struct rrdcalctemplate { struct rrdcalctemplate *next; }; -#define RRDCALCTEMPLATE_HAS_CALCULATION(rt) ((rt)->after) +#define RRDCALCTEMPLATE_HAS_DB_LOOKUP(rt) ((rt)->after) extern void rrdcalctemplate_link_matching(RRDSET *st); diff --git a/database/rrddim.c b/database/rrddim.c index 95e485106..e98f702fe 100644 --- a/database/rrddim.c +++ b/database/rrddim.c @@ -239,6 +239,7 @@ RRDDIM *rrddim_add_custom(RRDSET *st, const char *id, const char *name, collecte rd->last_calculated_value = 0; rd->collected_value = 0; rd->last_collected_value = 0; + rd->collected_value_max = 0; rd->collected_volume = 0; rd->stored_volume = 0; rd->last_stored_value = 0; @@ -380,6 +381,9 @@ inline collected_number rrddim_set_by_pointer(RRDSET *st, RRDDIM *rd, collected_ rd->collections_counter++; + collected_number v = (value >= 0) ? value : -value; + if(unlikely(v > rd->collected_value_max)) rd->collected_value_max = v; + // fprintf(stderr, "%s.%s %llu " COLLECTED_NUMBER_FORMAT " dt %0.6f" " rate " CALCULATED_NUMBER_FORMAT "\n", st->name, rd->name, st->usec_since_last_update, value, (float)((double)st->usec_since_last_update / (double)1000000), (calculated_number)((value - rd->last_collected_value) * (calculated_number)rd->multiplier / (calculated_number)rd->divisor * 1000000.0 / (calculated_number)st->usec_since_last_update)); return rd->last_collected_value; diff --git a/database/rrdset.c b/database/rrdset.c index 3f5ba73b6..d74ac91ab 100644 --- a/database/rrdset.c +++ b/database/rrdset.c @@ -1080,7 +1080,7 @@ static inline size_t rrdset_done_interpolate( , get_storage_number_flags(rd->values[current_entry]) , t1 , accuracy - , (accuracy > ACCURACY_LOSS) ? " **TOO BIG** " : "" + , (accuracy > ACCURACY_LOSS_ACCEPTED_PERCENT) ? " **TOO BIG** " : "" ); rd->collected_volume += t1; @@ -1093,7 +1093,7 @@ static inline size_t rrdset_done_interpolate( , rd->stored_volume , rd->collected_volume , accuracy - , (accuracy > ACCURACY_LOSS) ? " **TOO BIG** " : "" + , (accuracy > ACCURACY_LOSS_ACCEPTED_PERCENT) ? " **TOO BIG** " : "" ); } #endif @@ -1381,13 +1381,29 @@ void rrdset_done(RRDSET *st) { if(!(rrddim_flag_check(rd, RRDDIM_FLAG_DONT_DETECT_RESETS_OR_OVERFLOWS))) storage_flags = SN_EXISTS_RESET; - rd->last_collected_value = rd->collected_value; - } + uint64_t last = (uint64_t)rd->last_collected_value; + uint64_t new = (uint64_t)rd->collected_value; + uint64_t max = (uint64_t)rd->collected_value_max; + uint64_t cap = 0; + + if(max > 0x00000000FFFFFFFFULL) cap = 0xFFFFFFFFFFFFFFFFULL; + else if(max > 0x000000000000FFFFULL) cap = 0x00000000FFFFFFFFULL; + else if(max > 0x00000000000000FFULL) cap = 0x000000000000FFFFULL; + else cap = 0x00000000000000FFULL; + + uint64_t delta = cap - last + new; - rd->calculated_value += - (calculated_number)(rd->collected_value - rd->last_collected_value) - * (calculated_number)rd->multiplier - / (calculated_number)rd->divisor; + rd->calculated_value += + (calculated_number) delta + * (calculated_number) rd->multiplier + / (calculated_number) rd->divisor; + } + else { + rd->calculated_value += + (calculated_number) (rd->collected_value - rd->last_collected_value) + * (calculated_number) rd->multiplier + / (calculated_number) rd->divisor; + } #ifdef NETDATA_INTERNAL_CHECKS rrdset_debug(st, "%s: CALC INC PRE " diff --git a/diagrams/Makefile.am b/diagrams/Makefile.am index 04f99c8fd..685241e4f 100644 --- a/diagrams/Makefile.am +++ b/diagrams/Makefile.am @@ -1,4 +1,5 @@ # SPDX-License-Identifier: GPL-3.0-or-later + MAINTAINERCLEANFILES= $(srcdir)/Makefile.in dist_noinst_DATA = \ @@ -7,6 +8,15 @@ dist_noinst_DATA = \ netdata-for-ephemeral-nodes.xml \ netdata-proxies-example.xml \ netdata-overview.xml \ + data_structures/netdata_config.svg \ + data_structures/README.md \ + data_structures/registry.svg \ + data_structures/rrd.svg \ + data_structures/web.svg \ + data_structures/src/netdata_config.xml \ + data_structures/src/registry.xml \ + data_structures/src/rrd.xml \ + data_structures/src/web.xml \ $(NULL) dist_noinst_SCRIPTS = \ diff --git a/diagrams/Makefile.in b/diagrams/Makefile.in index 5f75902de..5c7ed2ac9 100644 --- a/diagrams/Makefile.in +++ b/diagrams/Makefile.in @@ -14,6 +14,8 @@ @SET_MAKE@ +# SPDX-License-Identifier: GPL-3.0-or-later + VPATH = @srcdir@ am__is_gnu_make = test -n '$(MAKEFILE_LIST)' && test -n '$(MAKELEVEL)' @@ -268,8 +270,6 @@ top_builddir = @top_builddir@ top_srcdir = @top_srcdir@ varlibdir = @varlibdir@ webdir = @webdir@ - -# SPDX-License-Identifier: GPL-3.0-or-later MAINTAINERCLEANFILES = $(srcdir)/Makefile.in dist_noinst_DATA = \ config.puml \ @@ -277,6 +277,15 @@ dist_noinst_DATA = \ netdata-for-ephemeral-nodes.xml \ netdata-proxies-example.xml \ netdata-overview.xml \ + data_structures/netdata_config.svg \ + data_structures/README.md \ + data_structures/registry.svg \ + data_structures/rrd.svg \ + data_structures/web.svg \ + data_structures/src/netdata_config.xml \ + data_structures/src/registry.xml \ + data_structures/src/rrd.xml \ + data_structures/src/web.xml \ $(NULL) dist_noinst_SCRIPTS = \ diff --git a/diagrams/data_structures/README.md b/diagrams/data_structures/README.md new file mode 100755 index 000000000..d8d694835 --- /dev/null +++ b/diagrams/data_structures/README.md @@ -0,0 +1,11 @@ +# Data structures
+
+These are the main internal data structures of `netdata`. Created with `draw.io`.
+
+
+
+
+
+
+
+
diff --git a/diagrams/data_structures/netdata_config.svg b/diagrams/data_structures/netdata_config.svg new file mode 100755 index 000000000..5b2ed8da9 --- /dev/null +++ b/diagrams/data_structures/netdata_config.svg @@ -0,0 +1,2 @@ +<!DOCTYPE svg PUBLIC "-//W3C//DTD SVG 1.1//EN" "http://www.w3.org/Graphics/SVG/1.1/DTD/svg11.dtd"> +<svg xmlns="http://www.w3.org/2000/svg" xmlns:xlink="http://www.w3.org/1999/xlink" version="1.1" width="905px" height="511px" viewBox="-0.5 -0.5 905 511" style="background-color: rgb(255, 255, 255);"><defs><clipPath id="mx-clip-7-34-132-26-0"><rect x="7" y="34" width="132" height="26"/></clipPath><clipPath id="mx-clip-7-60-132-26-0"><rect x="7" y="60" width="132" height="26"/></clipPath><clipPath id="mx-clip-7-86-132-26-0"><rect x="7" y="86" width="132" height="26"/></clipPath><clipPath id="mx-clip-167-154-202-26-0"><rect x="167" y="154" width="202" height="26"/></clipPath><clipPath id="mx-clip-167-180-202-26-0"><rect x="167" y="180" width="202" height="26"/></clipPath><clipPath id="mx-clip-167-206-202-26-0"><rect x="167" y="206" width="202" height="26"/></clipPath><clipPath id="mx-clip-167-232-202-26-0"><rect x="167" y="232" width="202" height="26"/></clipPath><clipPath id="mx-clip-167-258-202-26-0"><rect x="167" y="258" width="202" height="26"/></clipPath><clipPath id="mx-clip-167-284-202-26-0"><rect x="167" y="284" width="202" height="26"/></clipPath><clipPath id="mx-clip-167-310-202-26-0"><rect x="167" y="310" width="202" height="26"/></clipPath><clipPath id="mx-clip-517-68-132-26-0"><rect x="517" y="68" width="132" height="26"/></clipPath><clipPath id="mx-clip-517-94-132-26-0"><rect x="517" y="94" width="132" height="26"/></clipPath><clipPath id="mx-clip-597-181-162-26-0"><rect x="597" y="181" width="162" height="26"/></clipPath><clipPath id="mx-clip-597-207-162-26-0"><rect x="597" y="207" width="162" height="26"/></clipPath><clipPath id="mx-clip-737-271-132-26-0"><rect x="737" y="271" width="132" height="26"/></clipPath><clipPath id="mx-clip-737-297-132-26-0"><rect x="737" y="297" width="132" height="26"/></clipPath><clipPath id="mx-clip-427-353-142-26-0"><rect x="427" y="353" width="142" height="26"/></clipPath><clipPath id="mx-clip-427-379-142-26-0"><rect x="427" y="379" width="142" height="26"/></clipPath><clipPath id="mx-clip-427-405-142-26-0"><rect x="427" y="405" width="142" height="26"/></clipPath><clipPath id="mx-clip-427-431-142-26-0"><rect x="427" y="431" width="142" height="26"/></clipPath><clipPath id="mx-clip-427-457-142-26-0"><rect x="427" y="457" width="142" height="26"/></clipPath><clipPath id="mx-clip-427-483-142-26-0"><rect x="427" y="483" width="142" height="26"/></clipPath></defs><path d="M 3 29 L 3 3 L 143 3 L 143 29" fill="none" stroke="#000000" stroke-miterlimit="10" pointer-events="none"/><path d="M 3 29 L 3 107 L 143 107 L 143 29" fill="#ffffff" stroke="#000000" stroke-miterlimit="10" pointer-events="none"/><path d="M 3 29 L 143 29" fill="none" stroke="#000000" stroke-miterlimit="10" pointer-events="none"/><g fill="#000000" font-family="Helvetica" text-anchor="middle" font-size="12px"><text x="72.5" y="20.5">struct config</text></g><g fill="#000000" font-family="Helvetica" clip-path="url(#mx-clip-7-34-132-26-0)" font-size="12px"><text x="8.5" y="46.5">struct section *sections</text></g><g fill="#000000" font-family="Helvetica" clip-path="url(#mx-clip-7-60-132-26-0)" font-size="12px"><text x="8.5" y="72.5">netdata_mutex_t mutex</text></g><g fill="#000000" font-family="Helvetica" clip-path="url(#mx-clip-7-86-132-26-0)" font-size="12px"><text x="8.5" y="98.5">avl_tree_lock index</text></g><path d="M 163 149 L 163 123 L 373 123 L 373 149" fill="none" stroke="#000000" stroke-miterlimit="10" pointer-events="none"/><path d="M 163 149 L 163 331 L 373 331 L 373 149" fill="#ffffff" stroke="#000000" stroke-miterlimit="10" pointer-events="none"/><path d="M 163 149 L 373 149" fill="none" stroke="#000000" stroke-miterlimit="10" pointer-events="none"/><g fill="#000000" font-family="Helvetica" text-anchor="middle" font-size="12px"><text x="267.5" y="140.5">struct section</text></g><g fill="#000000" font-family="Helvetica" clip-path="url(#mx-clip-167-154-202-26-0)" font-size="12px"><text x="168.5" y="166.5">avl avl</text></g><g fill="#000000" font-family="Helvetica" clip-path="url(#mx-clip-167-180-202-26-0)" font-size="12px"><text x="168.5" y="192.5">uint32_t hash</text></g><g fill="#000000" font-family="Helvetica" clip-path="url(#mx-clip-167-206-202-26-0)" font-size="12px"><text x="168.5" y="218.5">char *name</text></g><path d="M 373 240 L 393 240 L 393 103 L 268 103 L 268 116.63" fill="none" stroke="#000000" stroke-miterlimit="10" pointer-events="none"/><path d="M 268 121.88 L 264.5 114.88 L 268 116.63 L 271.5 114.88 Z" fill="#000000" stroke="#000000" stroke-miterlimit="10" pointer-events="none"/><g fill="#000000" font-family="Helvetica" clip-path="url(#mx-clip-167-232-202-26-0)" font-size="12px"><text x="168.5" y="244.5">struct section *next</text></g><g fill="#000000" font-family="Helvetica" clip-path="url(#mx-clip-167-258-202-26-0)" font-size="12px"><text x="168.5" y="270.5">struct config_option *values</text></g><g fill="#000000" font-family="Helvetica" clip-path="url(#mx-clip-167-284-202-26-0)" font-size="12px"><text x="168.5" y="296.5">avl_tree_lock values_index</text></g><g fill="#000000" font-family="Helvetica" clip-path="url(#mx-clip-167-310-202-26-0)" font-size="12px"><text x="168.5" y="322.5">netdata_mutex_t mutex</text></g><path d="M 513 63 L 513 37 L 653 37 L 653 63" fill="none" stroke="#000000" stroke-miterlimit="10" pointer-events="none"/><path d="M 513 63 L 513 115 L 653 115 L 653 63" fill="#ffffff" stroke="#000000" stroke-miterlimit="10" pointer-events="none"/><path d="M 513 63 L 653 63" fill="none" stroke="#000000" stroke-miterlimit="10" pointer-events="none"/><g fill="#000000" font-family="Helvetica" text-anchor="middle" font-size="12px"><text x="582.5" y="54.5">struct avl_tree_lock</text></g><g fill="#000000" font-family="Helvetica" clip-path="url(#mx-clip-517-68-132-26-0)" font-size="12px"><text x="518.5" y="80.5">avl_tree avl_tree</text></g><g fill="#000000" font-family="Helvetica" clip-path="url(#mx-clip-517-94-132-26-0)" font-size="12px"><text x="518.5" y="106.5">netdata_mutex_t mutex</text></g><path d="M 593 176 L 593 150 L 763 150 L 763 176" fill="none" stroke="#000000" stroke-miterlimit="10" pointer-events="none"/><path d="M 593 176 L 593 228 L 763 228 L 763 176" fill="#ffffff" stroke="#000000" stroke-miterlimit="10" pointer-events="none"/><path d="M 593 176 L 763 176" fill="none" stroke="#000000" stroke-miterlimit="10" pointer-events="none"/><g fill="#000000" font-family="Helvetica" text-anchor="middle" font-size="12px"><text x="677.5" y="167.5">struct avl_tree</text></g><g fill="#000000" font-family="Helvetica" clip-path="url(#mx-clip-597-181-162-26-0)" font-size="12px"><text x="598.5" y="193.5">avl *root</text></g><g fill="#000000" font-family="Helvetica" clip-path="url(#mx-clip-597-207-162-26-0)" font-size="12px"><text x="598.5" y="219.5">int (*compar)(void *a, void *b)</text></g><path d="M 143 42 L 268 42 L 268 116.63" fill="none" stroke="#000000" stroke-miterlimit="10" pointer-events="none"/><path d="M 268 121.88 L 264.5 114.88 L 268 116.63 L 271.5 114.88 Z" fill="#000000" stroke="#000000" stroke-miterlimit="10" pointer-events="none"/><g transform="translate(217.5,36.5)"><switch><foreignObject style="overflow:visible;" pointer-events="all" width="57" height="11" requiredFeatures="http://www.w3.org/TR/SVG11/feature#Extensibility"><div xmlns="http://www.w3.org/1999/xhtml" style="display: inline-block; font-size: 11px; font-family: Helvetica; color: rgb(0, 0, 0); line-height: 1.2; vertical-align: top; white-space: nowrap; text-align: center;"><div xmlns="http://www.w3.org/1999/xhtml" style="display:inline-block;text-align:inherit;text-decoration:inherit;background-color:#ffffff;">linked list of</div></div></foreignObject><text x="29" y="11" fill="#000000" text-anchor="middle" font-size="11px" font-family="Helvetica">linked list of</text></switch></g><path d="M 653 76 L 678 76 L 678 143.63" fill="none" stroke="#000000" stroke-miterlimit="10" pointer-events="none"/><path d="M 678 148.88 L 674.5 141.88 L 678 143.63 L 681.5 141.88 Z" fill="#000000" stroke="#000000" stroke-miterlimit="10" pointer-events="none"/><path d="M 733 266 L 733 240 L 873 240 L 873 266" fill="none" stroke="#000000" stroke-miterlimit="10" pointer-events="none"/><path d="M 733 266 L 733 318 L 873 318 L 873 266" fill="#ffffff" stroke="#000000" stroke-miterlimit="10" pointer-events="none"/><path d="M 733 266 L 873 266" fill="none" stroke="#000000" stroke-miterlimit="10" pointer-events="none"/><g fill="#000000" font-family="Helvetica" text-anchor="middle" font-size="12px"><text x="802.5" y="257.5">struct avl</text></g><path d="M 873 279 L 893 279 L 893 220 L 803 220 L 803 233.63" fill="none" stroke="#000000" stroke-miterlimit="10" pointer-events="none"/><path d="M 803 238.88 L 799.5 231.88 L 803 233.63 L 806.5 231.88 Z" fill="#000000" stroke="#000000" stroke-miterlimit="10" pointer-events="none"/><g fill="#000000" font-family="Helvetica" clip-path="url(#mx-clip-737-271-132-26-0)" font-size="12px"><text x="738.5" y="283.5">struct avl *avl_link[2]</text></g><g fill="#000000" font-family="Helvetica" clip-path="url(#mx-clip-737-297-132-26-0)" font-size="12px"><text x="738.5" y="309.5">signed char avl_balance</text></g><path d="M 763 189 L 803 189 L 803 233.63" fill="none" stroke="#000000" stroke-miterlimit="10" pointer-events="none"/><path d="M 803 238.88 L 799.5 231.88 L 803 233.63 L 806.5 231.88 Z" fill="#000000" stroke="#000000" stroke-miterlimit="10" pointer-events="none"/><path d="M 423 348 L 423 322 L 573 322 L 573 348" fill="none" stroke="#000000" stroke-miterlimit="10" pointer-events="none"/><path d="M 423 348 L 423 504 L 573 504 L 573 348" fill="#ffffff" stroke="#000000" stroke-miterlimit="10" pointer-events="none"/><path d="M 423 348 L 573 348" fill="none" stroke="#000000" stroke-miterlimit="10" pointer-events="none"/><g fill="#000000" font-family="Helvetica" text-anchor="middle" font-size="12px"><text x="497.5" y="339.5">struct config_options</text></g><g fill="#000000" font-family="Helvetica" clip-path="url(#mx-clip-427-353-142-26-0)" font-size="12px"><text x="428.5" y="365.5">avl avl</text></g><g fill="#000000" font-family="Helvetica" clip-path="url(#mx-clip-427-379-142-26-0)" font-size="12px"><text x="428.5" y="391.5">uint8_t flags</text></g><g fill="#000000" font-family="Helvetica" clip-path="url(#mx-clip-427-405-142-26-0)" font-size="12px"><text x="428.5" y="417.5">uint32_t hash</text></g><g fill="#000000" font-family="Helvetica" clip-path="url(#mx-clip-427-431-142-26-0)" font-size="12px"><text x="428.5" y="443.5">char *name</text></g><g fill="#000000" font-family="Helvetica" clip-path="url(#mx-clip-427-457-142-26-0)" font-size="12px"><text x="428.5" y="469.5">char *value</text></g><path d="M 573 491 L 593 491 L 593 302 L 498 302 L 498 315.63" fill="none" stroke="#000000" stroke-miterlimit="10" pointer-events="none"/><path d="M 498 320.88 L 494.5 313.88 L 498 315.63 L 501.5 313.88 Z" fill="#000000" stroke="#000000" stroke-miterlimit="10" pointer-events="none"/><g fill="#000000" font-family="Helvetica" clip-path="url(#mx-clip-427-483-142-26-0)" font-size="12px"><text x="428.5" y="495.5">struct *config_option_next</text></g><path d="M 143 94 L 268 94 L 268 116.63" fill="none" stroke="#000000" stroke-miterlimit="10" pointer-events="none"/><path d="M 268 121.88 L 264.5 114.88 L 268 116.63 L 271.5 114.88 Z" fill="#000000" stroke="#000000" stroke-miterlimit="10" pointer-events="none"/><g transform="translate(195.5,88.5)"><switch><foreignObject style="overflow:visible;" pointer-events="all" width="48" height="11" requiredFeatures="http://www.w3.org/TR/SVG11/feature#Extensibility"><div xmlns="http://www.w3.org/1999/xhtml" style="display: inline-block; font-size: 11px; font-family: Helvetica; color: rgb(0, 0, 0); line-height: 1.2; vertical-align: top; white-space: nowrap; text-align: center;"><div xmlns="http://www.w3.org/1999/xhtml" style="display:inline-block;text-align:inherit;text-decoration:inherit;background-color:#ffffff;">avl tree of</div></div></foreignObject><text x="24" y="11" fill="#000000" text-anchor="middle" font-size="11px" font-family="Helvetica">avl tree of</text></switch></g><path d="M 373 292 L 498 292 L 498 315.63" fill="none" stroke="#000000" stroke-miterlimit="10" pointer-events="none"/><path d="M 498 320.88 L 494.5 313.88 L 498 315.63 L 501.5 313.88 Z" fill="#000000" stroke="#000000" stroke-miterlimit="10" pointer-events="none"/><g transform="translate(426.5,286.5)"><switch><foreignObject style="overflow:visible;" pointer-events="all" width="48" height="11" requiredFeatures="http://www.w3.org/TR/SVG11/feature#Extensibility"><div xmlns="http://www.w3.org/1999/xhtml" style="display: inline-block; font-size: 11px; font-family: Helvetica; color: rgb(0, 0, 0); line-height: 1.2; vertical-align: top; white-space: nowrap; text-align: center;"><div xmlns="http://www.w3.org/1999/xhtml" style="display:inline-block;text-align:inherit;text-decoration:inherit;background-color:#ffffff;">avl tree of</div></div></foreignObject><text x="24" y="11" fill="#000000" text-anchor="middle" font-size="11px" font-family="Helvetica">avl tree of</text></switch></g><path d="M 373 266 L 498 266 L 498 315.63" fill="none" stroke="#000000" stroke-miterlimit="10" pointer-events="none"/><path d="M 498 320.88 L 494.5 313.88 L 498 315.63 L 501.5 313.88 Z" fill="#000000" stroke="#000000" stroke-miterlimit="10" pointer-events="none"/><g transform="translate(435.5,260.5)"><switch><foreignObject style="overflow:visible;" pointer-events="all" width="57" height="11" requiredFeatures="http://www.w3.org/TR/SVG11/feature#Extensibility"><div xmlns="http://www.w3.org/1999/xhtml" style="display: inline-block; font-size: 11px; font-family: Helvetica; color: rgb(0, 0, 0); line-height: 1.2; vertical-align: top; white-space: nowrap; text-align: center;"><div xmlns="http://www.w3.org/1999/xhtml" style="display:inline-block;text-align:inherit;text-decoration:inherit;background-color:#ffffff;">linked list of</div></div></foreignObject><text x="29" y="11" fill="#000000" text-anchor="middle" font-size="11px" font-family="Helvetica">linked list of</text></switch></g></svg>
\ No newline at end of file diff --git a/diagrams/data_structures/registry.svg b/diagrams/data_structures/registry.svg new file mode 100755 index 000000000..2363e664a --- /dev/null +++ b/diagrams/data_structures/registry.svg @@ -0,0 +1,2 @@ +<!DOCTYPE svg PUBLIC "-//W3C//DTD SVG 1.1//EN" "http://www.w3.org/Graphics/SVG/1.1/DTD/svg11.dtd"> +<svg xmlns="http://www.w3.org/2000/svg" xmlns:xlink="http://www.w3.org/1999/xlink" version="1.1" width="1377px" height="1061px" viewBox="-0.5 -0.5 1377 1061" style="background-color: rgb(255, 255, 255);"><defs><clipPath id="mx-clip-7-39-202-26-0"><rect x="7" y="39" width="202" height="26"/></clipPath><clipPath id="mx-clip-7-91-202-26-0"><rect x="7" y="91" width="202" height="26"/></clipPath><clipPath id="mx-clip-7-117-202-26-0"><rect x="7" y="117" width="202" height="26"/></clipPath><clipPath id="mx-clip-7-143-202-26-0"><rect x="7" y="143" width="202" height="26"/></clipPath><clipPath id="mx-clip-7-169-202-26-0"><rect x="7" y="169" width="202" height="26"/></clipPath><clipPath id="mx-clip-7-195-202-26-0"><rect x="7" y="195" width="202" height="26"/></clipPath><clipPath id="mx-clip-7-221-202-26-0"><rect x="7" y="221" width="202" height="26"/></clipPath><clipPath id="mx-clip-7-247-202-26-0"><rect x="7" y="247" width="202" height="26"/></clipPath><clipPath id="mx-clip-7-299-202-26-0"><rect x="7" y="299" width="202" height="26"/></clipPath><clipPath id="mx-clip-7-325-202-26-0"><rect x="7" y="325" width="202" height="26"/></clipPath><clipPath id="mx-clip-7-351-202-26-0"><rect x="7" y="351" width="202" height="26"/></clipPath><clipPath id="mx-clip-7-377-202-26-0"><rect x="7" y="377" width="202" height="26"/></clipPath><clipPath id="mx-clip-7-403-202-26-0"><rect x="7" y="403" width="202" height="26"/></clipPath><clipPath id="mx-clip-7-455-202-26-0"><rect x="7" y="455" width="202" height="26"/></clipPath><clipPath id="mx-clip-7-481-202-26-0"><rect x="7" y="481" width="202" height="26"/></clipPath><clipPath id="mx-clip-7-507-202-26-0"><rect x="7" y="507" width="202" height="26"/></clipPath><clipPath id="mx-clip-7-533-202-26-0"><rect x="7" y="533" width="202" height="26"/></clipPath><clipPath id="mx-clip-7-559-202-26-0"><rect x="7" y="559" width="202" height="26"/></clipPath><clipPath id="mx-clip-7-585-202-26-0"><rect x="7" y="585" width="202" height="26"/></clipPath><clipPath id="mx-clip-7-611-202-26-0"><rect x="7" y="611" width="202" height="26"/></clipPath><clipPath id="mx-clip-7-637-202-26-0"><rect x="7" y="637" width="202" height="26"/></clipPath><clipPath id="mx-clip-7-689-202-26-0"><rect x="7" y="689" width="202" height="26"/></clipPath><clipPath id="mx-clip-7-715-202-26-0"><rect x="7" y="715" width="202" height="26"/></clipPath><clipPath id="mx-clip-7-741-202-26-0"><rect x="7" y="741" width="202" height="26"/></clipPath><clipPath id="mx-clip-7-767-202-26-0"><rect x="7" y="767" width="202" height="26"/></clipPath><clipPath id="mx-clip-7-793-202-26-0"><rect x="7" y="793" width="202" height="26"/></clipPath><clipPath id="mx-clip-7-819-202-26-0"><rect x="7" y="819" width="202" height="26"/></clipPath><clipPath id="mx-clip-7-845-202-26-0"><rect x="7" y="845" width="202" height="26"/></clipPath><clipPath id="mx-clip-7-871-202-26-0"><rect x="7" y="871" width="202" height="26"/></clipPath><clipPath id="mx-clip-7-897-202-26-0"><rect x="7" y="897" width="202" height="26"/></clipPath><clipPath id="mx-clip-897-52-202-26-0"><rect x="897" y="52" width="202" height="26"/></clipPath><clipPath id="mx-clip-897-78-202-26-0"><rect x="897" y="78" width="202" height="26"/></clipPath><clipPath id="mx-clip-897-104-202-26-0"><rect x="897" y="104" width="202" height="26"/></clipPath><clipPath id="mx-clip-897-130-202-26-0"><rect x="897" y="130" width="202" height="26"/></clipPath><clipPath id="mx-clip-942-513-162-26-0"><rect x="942" y="513" width="162" height="26"/></clipPath><clipPath id="mx-clip-942-539-162-26-0"><rect x="942" y="539" width="162" height="26"/></clipPath><clipPath id="mx-clip-1062-626-132-26-0"><rect x="1062" y="626" width="132" height="26"/></clipPath><clipPath id="mx-clip-1062-652-132-26-0"><rect x="1062" y="652" width="132" height="26"/></clipPath><clipPath id="mx-clip-1027-286-202-26-0"><rect x="1027" y="286" width="202" height="26"/></clipPath><clipPath id="mx-clip-1027-312-202-26-0"><rect x="1027" y="312" width="202" height="26"/></clipPath><clipPath id="mx-clip-1027-338-202-26-0"><rect x="1027" y="338" width="202" height="26"/></clipPath><clipPath id="mx-clip-1027-364-202-26-0"><rect x="1027" y="364" width="202" height="26"/></clipPath><clipPath id="mx-clip-1167-130-202-26-0"><rect x="1167" y="130" width="202" height="26"/></clipPath><clipPath id="mx-clip-1167-156-202-26-0"><rect x="1167" y="156" width="202" height="26"/></clipPath><clipPath id="mx-clip-1167-182-202-26-0"><rect x="1167" y="182" width="202" height="26"/></clipPath><clipPath id="mx-clip-1167-208-202-26-0"><rect x="1167" y="208" width="202" height="26"/></clipPath><clipPath id="mx-clip-377-61-202-26-0"><rect x="377" y="61" width="202" height="26"/></clipPath><clipPath id="mx-clip-377-87-202-26-0"><rect x="377" y="87" width="202" height="26"/></clipPath><clipPath id="mx-clip-377-113-202-26-0"><rect x="377" y="113" width="202" height="26"/></clipPath><clipPath id="mx-clip-377-139-202-26-0"><rect x="377" y="139" width="202" height="26"/></clipPath><clipPath id="mx-clip-377-165-202-26-0"><rect x="377" y="165" width="202" height="26"/></clipPath><clipPath id="mx-clip-527-286-202-26-0"><rect x="527" y="286" width="202" height="26"/></clipPath><clipPath id="mx-clip-527-312-202-26-0"><rect x="527" y="312" width="202" height="26"/></clipPath><clipPath id="mx-clip-527-338-202-26-0"><rect x="527" y="338" width="202" height="26"/></clipPath><clipPath id="mx-clip-527-364-202-26-0"><rect x="527" y="364" width="202" height="26"/></clipPath><clipPath id="mx-clip-527-390-202-26-0"><rect x="527" y="390" width="202" height="26"/></clipPath><clipPath id="mx-clip-527-416-202-26-0"><rect x="527" y="416" width="202" height="26"/></clipPath><clipPath id="mx-clip-527-442-202-26-0"><rect x="527" y="442" width="202" height="26"/></clipPath><clipPath id="mx-clip-527-468-202-26-0"><rect x="527" y="468" width="202" height="26"/></clipPath><clipPath id="mx-clip-677-929-202-26-0"><rect x="677" y="929" width="202" height="26"/></clipPath><clipPath id="mx-clip-677-955-202-26-0"><rect x="677" y="955" width="202" height="26"/></clipPath><clipPath id="mx-clip-677-981-202-26-0"><rect x="677" y="981" width="202" height="26"/></clipPath><clipPath id="mx-clip-677-1007-202-26-0"><rect x="677" y="1007" width="202" height="26"/></clipPath><clipPath id="mx-clip-677-1033-202-26-0"><rect x="677" y="1033" width="202" height="26"/></clipPath><clipPath id="mx-clip-317-587-202-26-0"><rect x="317" y="587" width="202" height="26"/></clipPath><clipPath id="mx-clip-317-613-202-26-0"><rect x="317" y="613" width="202" height="26"/></clipPath><clipPath id="mx-clip-317-639-202-26-0"><rect x="317" y="639" width="202" height="26"/></clipPath><clipPath id="mx-clip-317-665-202-26-0"><rect x="317" y="665" width="202" height="26"/></clipPath><clipPath id="mx-clip-317-691-202-26-0"><rect x="317" y="691" width="202" height="26"/></clipPath><clipPath id="mx-clip-317-717-202-26-0"><rect x="317" y="717" width="202" height="26"/></clipPath><clipPath id="mx-clip-547-704-202-26-0"><rect x="547" y="704" width="202" height="26"/></clipPath><clipPath id="mx-clip-547-730-202-26-0"><rect x="547" y="730" width="202" height="26"/></clipPath><clipPath id="mx-clip-547-756-202-26-0"><rect x="547" y="756" width="202" height="26"/></clipPath><clipPath id="mx-clip-547-782-202-26-0"><rect x="547" y="782" width="202" height="26"/></clipPath><clipPath id="mx-clip-547-808-202-26-0"><rect x="547" y="808" width="202" height="26"/></clipPath></defs><path d="M 213 827 L 213 801 L 253 801 L 253 10 L 478 10 L 478 23.63" fill="none" stroke="#000000" stroke-miterlimit="10" pointer-events="none"/><path d="M 478 28.88 L 474.5 21.88 L 478 23.63 L 481.5 21.88 Z" fill="#000000" stroke="#000000" stroke-miterlimit="10" pointer-events="none"/><g transform="translate(223.5,310.5)"><switch><foreignObject style="overflow:visible;" pointer-events="all" width="59" height="11" requiredFeatures="http://www.w3.org/TR/SVG11/feature#Extensibility"><div xmlns="http://www.w3.org/1999/xhtml" style="display: inline-block; font-size: 11px; font-family: Helvetica; color: rgb(0, 0, 0); line-height: 1.2; vertical-align: top; white-space: nowrap; text-align: center;"><div xmlns="http://www.w3.org/1999/xhtml" style="display:inline-block;text-align:inherit;text-decoration:inherit;background-color:#ffffff;">dictionary of</div></div></foreignObject><text x="30" y="11" fill="#000000" text-anchor="middle" font-size="11px" font-family="Helvetica">dictionary of</text></switch></g><path d="M 213 879 L 778 878 L 778 891.63" fill="none" stroke="#000000" stroke-miterlimit="10" pointer-events="none"/><path d="M 778 896.88 L 774.5 889.88 L 778 891.63 L 781.5 889.88 Z" fill="#000000" stroke="#000000" stroke-miterlimit="10" pointer-events="none"/><g transform="translate(480.5,872.5)"><switch><foreignObject style="overflow:visible;" pointer-events="all" width="48" height="11" requiredFeatures="http://www.w3.org/TR/SVG11/feature#Extensibility"><div xmlns="http://www.w3.org/1999/xhtml" style="display: inline-block; font-size: 11px; font-family: Helvetica; color: rgb(0, 0, 0); line-height: 1.2; vertical-align: top; white-space: nowrap; text-align: center;"><div xmlns="http://www.w3.org/1999/xhtml" style="display:inline-block;text-align:inherit;text-decoration:inherit;background-color:#ffffff;">avl tree of</div></div></foreignObject><text x="24" y="11" fill="#000000" text-anchor="middle" font-size="11px" font-family="Helvetica">avl tree of</text></switch></g><path d="M 3 33.5 L 3 7.5 L 213 7.5 L 213 33.5" fill="none" stroke="#000000" stroke-miterlimit="10" pointer-events="none"/><path d="M 3 33.5 L 3 917.5 L 213 917.5 L 213 33.5" fill="#ffffff" stroke="#000000" stroke-miterlimit="10" pointer-events="none"/><path d="M 3 33.5 L 213 33.5" fill="none" stroke="#000000" stroke-miterlimit="10" pointer-events="none"/><g fill="#000000" font-family="Helvetica" text-anchor="middle" font-size="12px"><text x="107.5" y="25">struct registry</text></g><g fill="#000000" font-family="Helvetica" clip-path="url(#mx-clip-7-39-202-26-0)" font-size="12px"><text x="8.5" y="51">int enabled</text></g><path d="M 3 85.5 L 3 59.5 L 213 59.5 L 213 85.5" fill="none" stroke="#000000" stroke-miterlimit="10" pointer-events="none"/><path d="M 3 85.5 L 3 267.5 L 213 267.5 L 213 85.5" fill="#ffffff" stroke="#000000" stroke-miterlimit="10" pointer-events="none"/><path d="M 3 85.5 L 213 85.5" fill="none" stroke="#000000" stroke-miterlimit="10" pointer-events="none"/><g fill="#000000" font-family="Helvetica" text-anchor="middle" font-size="12px"><text x="107.5" y="77">entries counters</text></g><g fill="#000000" font-family="Helvetica" clip-path="url(#mx-clip-7-91-202-26-0)" font-size="12px"><text x="8.5" y="103">unsigned long long persons_count</text></g><g fill="#000000" font-family="Helvetica" clip-path="url(#mx-clip-7-117-202-26-0)" font-size="12px"><text x="8.5" y="129">unsigned long long machines_count</text></g><g fill="#000000" font-family="Helvetica" clip-path="url(#mx-clip-7-143-202-26-0)" font-size="12px"><text x="8.5" y="155">unsigned long long usages count</text></g><g fill="#000000" font-family="Helvetica" clip-path="url(#mx-clip-7-169-202-26-0)" font-size="12px"><text x="8.5" y="181">unsigned long long urls_count</text></g><g fill="#000000" font-family="Helvetica" clip-path="url(#mx-clip-7-195-202-26-0)" font-size="12px"><text x="8.5" y="207">unsigned long long persons_urls_count</text></g><g fill="#000000" font-family="Helvetica" clip-path="url(#mx-clip-7-221-202-26-0)" font-size="12px"><text x="8.5" y="233">unsigned long long machines_urls_count</text></g><g fill="#000000" font-family="Helvetica" clip-path="url(#mx-clip-7-247-202-26-0)" font-size="12px"><text x="8.5" y="259">unsigned long long log_count</text></g><path d="M 3 293.5 L 3 267.5 L 213 267.5 L 213 293.5" fill="none" stroke="#000000" stroke-miterlimit="10" pointer-events="none"/><path d="M 3 293.5 L 3 423.5 L 213 423.5 L 213 293.5" fill="#ffffff" stroke="#000000" stroke-miterlimit="10" pointer-events="none"/><path d="M 3 293.5 L 213 293.5" fill="none" stroke="#000000" stroke-miterlimit="10" pointer-events="none"/><g fill="#000000" font-family="Helvetica" text-anchor="middle" font-size="12px"><text x="107.5" y="285">memory counters</text></g><g fill="#000000" font-family="Helvetica" clip-path="url(#mx-clip-7-299-202-26-0)" font-size="12px"><text x="8.5" y="311">unsigned long long persons memory</text></g><g fill="#000000" font-family="Helvetica" clip-path="url(#mx-clip-7-325-202-26-0)" font-size="12px"><text x="8.5" y="337">unsigned long long machines_memory</text></g><g fill="#000000" font-family="Helvetica" clip-path="url(#mx-clip-7-351-202-26-0)" font-size="12px"><text x="8.5" y="363">unsigned long long urls_memory</text></g><g fill="#000000" font-family="Helvetica" clip-path="url(#mx-clip-7-377-202-26-0)" font-size="12px"><text x="8.5" y="389">unsigned long long persons_urls_memory</text></g><g fill="#000000" font-family="Helvetica" clip-path="url(#mx-clip-7-403-202-26-0)" font-size="12px"><text x="8.5" y="415">unsigned long longmachines_urls_memory</text></g><path d="M 3 449.5 L 3 423.5 L 213 423.5 L 213 449.5" fill="none" stroke="#000000" stroke-miterlimit="10" pointer-events="none"/><path d="M 3 449.5 L 3 657.5 L 213 657.5 L 213 449.5" fill="#ffffff" stroke="#000000" stroke-miterlimit="10" pointer-events="none"/><path d="M 3 449.5 L 213 449.5" fill="none" stroke="#000000" stroke-miterlimit="10" pointer-events="none"/><g fill="#000000" font-family="Helvetica" text-anchor="middle" font-size="12px"><text x="107.5" y="441">configuration</text></g><g fill="#000000" font-family="Helvetica" clip-path="url(#mx-clip-7-455-202-26-0)" font-size="12px"><text x="8.5" y="467">unsigned long long save_registry_every_entries</text></g><g fill="#000000" font-family="Helvetica" clip-path="url(#mx-clip-7-481-202-26-0)" font-size="12px"><text x="8.5" y="493">char *registry_domain</text></g><g fill="#000000" font-family="Helvetica" clip-path="url(#mx-clip-7-507-202-26-0)" font-size="12px"><text x="8.5" y="519">char *hostname</text></g><g fill="#000000" font-family="Helvetica" clip-path="url(#mx-clip-7-533-202-26-0)" font-size="12px"><text x="8.5" y="545">char *registry_to_announce</text></g><g fill="#000000" font-family="Helvetica" clip-path="url(#mx-clip-7-559-202-26-0)" font-size="12px"><text x="8.5" y="571">time_t persons_expiration</text></g><g fill="#000000" font-family="Helvetica" clip-path="url(#mx-clip-7-585-202-26-0)" font-size="12px"><text x="8.5" y="597">int verify_cookies_redirects</text></g><g fill="#000000" font-family="Helvetica" clip-path="url(#mx-clip-7-611-202-26-0)" font-size="12px"><text x="8.5" y="623">size_t max_url_length</text></g><g fill="#000000" font-family="Helvetica" clip-path="url(#mx-clip-7-637-202-26-0)" font-size="12px"><text x="8.5" y="649">size_t max_name_length</text></g><path d="M 3 683.5 L 3 657.5 L 213 657.5 L 213 683.5" fill="none" stroke="#000000" stroke-miterlimit="10" pointer-events="none"/><path d="M 3 683.5 L 3 787.5 L 213 787.5 L 213 683.5" fill="#ffffff" stroke="#000000" stroke-miterlimit="10" pointer-events="none"/><path d="M 3 683.5 L 213 683.5" fill="none" stroke="#000000" stroke-miterlimit="10" pointer-events="none"/><g fill="#000000" font-family="Helvetica" text-anchor="middle" font-size="12px"><text x="107.5" y="675">path names</text></g><g fill="#000000" font-family="Helvetica" clip-path="url(#mx-clip-7-689-202-26-0)" font-size="12px"><text x="8.5" y="701">char *pathname</text></g><g fill="#000000" font-family="Helvetica" clip-path="url(#mx-clip-7-715-202-26-0)" font-size="12px"><text x="8.5" y="727">char *db_filename</text></g><g fill="#000000" font-family="Helvetica" clip-path="url(#mx-clip-7-741-202-26-0)" font-size="12px"><text x="8.5" y="753">char *log_filename</text></g><g fill="#000000" font-family="Helvetica" clip-path="url(#mx-clip-7-767-202-26-0)" font-size="12px"><text x="8.5" y="779">char *machine_guid_filename</text></g><g fill="#000000" font-family="Helvetica" clip-path="url(#mx-clip-7-793-202-26-0)" font-size="12px"><text x="8.5" y="805">FILE *log_fp</text></g><g fill="#000000" font-family="Helvetica" clip-path="url(#mx-clip-7-819-202-26-0)" font-size="12px"><text x="8.5" y="831">DICTIONARY *persons</text></g><g fill="#000000" font-family="Helvetica" clip-path="url(#mx-clip-7-845-202-26-0)" font-size="12px"><text x="8.5" y="857">DICTIONARY *machines</text></g><g fill="#000000" font-family="Helvetica" clip-path="url(#mx-clip-7-871-202-26-0)" font-size="12px"><text x="8.5" y="883">avl_tree registry_urls_root_index</text></g><g fill="#000000" font-family="Helvetica" clip-path="url(#mx-clip-7-897-202-26-0)" font-size="12px"><text x="8.5" y="909">netdata_mutex_t lock</text></g><path d="M 893 46.5 L 893 20.5 L 1103 20.5 L 1103 46.5" fill="none" stroke="#000000" stroke-miterlimit="10" pointer-events="none"/><path d="M 893 46.5 L 893 150.5 L 1103 150.5 L 1103 46.5" fill="#ffffff" stroke="#000000" stroke-miterlimit="10" pointer-events="none"/><path d="M 893 46.5 L 1103 46.5" fill="none" stroke="#000000" stroke-miterlimit="10" pointer-events="none"/><g fill="#000000" font-family="Helvetica" text-anchor="middle" font-size="12px"><text x="997.5" y="38">DICTIONARY</text></g><g fill="#000000" font-family="Helvetica" clip-path="url(#mx-clip-897-52-202-26-0)" font-size="12px"><text x="898.5" y="64">avl_tree values_index</text></g><g fill="#000000" font-family="Helvetica" clip-path="url(#mx-clip-897-78-202-26-0)" font-size="12px"><text x="898.5" y="90">uint8_t flags</text></g><g fill="#000000" font-family="Helvetica" clip-path="url(#mx-clip-897-104-202-26-0)" font-size="12px"><text x="898.5" y="116">struct dictionary_stats *stats</text></g><g fill="#000000" font-family="Helvetica" clip-path="url(#mx-clip-897-130-202-26-0)" font-size="12px"><text x="898.5" y="142">netdata_rwlock_t *rwlock</text></g><path d="M 938 507.5 L 938 481.5 L 1108 481.5 L 1108 507.5" fill="none" stroke="#000000" stroke-miterlimit="10" pointer-events="none"/><path d="M 938 507.5 L 938 559.5 L 1108 559.5 L 1108 507.5" fill="#ffffff" stroke="#000000" stroke-miterlimit="10" pointer-events="none"/><path d="M 938 507.5 L 1108 507.5" fill="none" stroke="#000000" stroke-miterlimit="10" pointer-events="none"/><g fill="#000000" font-family="Helvetica" text-anchor="middle" font-size="12px"><text x="1022.5" y="499">struct avl_tree</text></g><g fill="#000000" font-family="Helvetica" clip-path="url(#mx-clip-942-513-162-26-0)" font-size="12px"><text x="943.5" y="525">avl *root</text></g><g fill="#000000" font-family="Helvetica" clip-path="url(#mx-clip-942-539-162-26-0)" font-size="12px"><text x="943.5" y="551">int (*compar)(void *a, void *b)</text></g><path d="M 1058 620.5 L 1058 594.5 L 1198 594.5 L 1198 620.5" fill="none" stroke="#000000" stroke-miterlimit="10" pointer-events="none"/><path d="M 1058 620.5 L 1058 672.5 L 1198 672.5 L 1198 620.5" fill="#ffffff" stroke="#000000" stroke-miterlimit="10" pointer-events="none"/><path d="M 1058 620.5 L 1198 620.5" fill="none" stroke="#000000" stroke-miterlimit="10" pointer-events="none"/><g fill="#000000" font-family="Helvetica" text-anchor="middle" font-size="12px"><text x="1127.5" y="612">struct avl</text></g><path d="M 1198 634 L 1218 634 L 1218 575 L 1128 575 L 1128 588.63" fill="none" stroke="#000000" stroke-miterlimit="10" pointer-events="none"/><path d="M 1128 593.88 L 1124.5 586.88 L 1128 588.63 L 1131.5 586.88 Z" fill="#000000" stroke="#000000" stroke-miterlimit="10" pointer-events="none"/><g fill="#000000" font-family="Helvetica" clip-path="url(#mx-clip-1062-626-132-26-0)" font-size="12px"><text x="1063.5" y="638">struct avl *avl_link[2]</text></g><g fill="#000000" font-family="Helvetica" clip-path="url(#mx-clip-1062-652-132-26-0)" font-size="12px"><text x="1063.5" y="664">signed char avl_balance</text></g><path d="M 1108 521 L 1128 521 L 1128 588.63" fill="none" stroke="#000000" stroke-miterlimit="10" pointer-events="none"/><path d="M 1128 593.88 L 1124.5 586.88 L 1128 588.63 L 1131.5 586.88 Z" fill="#000000" stroke="#000000" stroke-miterlimit="10" pointer-events="none"/><path d="M 1023 280.5 L 1023 254.5 L 1233 254.5 L 1233 280.5" fill="none" stroke="#000000" stroke-miterlimit="10" pointer-events="none"/><path d="M 1023 280.5 L 1023 384.5 L 1233 384.5 L 1233 280.5" fill="#ffffff" stroke="#000000" stroke-miterlimit="10" pointer-events="none"/><path d="M 1023 280.5 L 1233 280.5" fill="none" stroke="#000000" stroke-miterlimit="10" pointer-events="none"/><g fill="#000000" font-family="Helvetica" text-anchor="middle" font-size="12px"><text x="1127.5" y="272">struct dictionary_stats</text></g><g fill="#000000" font-family="Helvetica" clip-path="url(#mx-clip-1027-286-202-26-0)" font-size="12px"><text x="1028.5" y="298">unsigned long long inserts</text></g><g fill="#000000" font-family="Helvetica" clip-path="url(#mx-clip-1027-312-202-26-0)" font-size="12px"><text x="1028.5" y="324">unsigned long long deletes</text></g><g fill="#000000" font-family="Helvetica" clip-path="url(#mx-clip-1027-338-202-26-0)" font-size="12px"><text x="1028.5" y="350">unsigned long long searches</text></g><g fill="#000000" font-family="Helvetica" clip-path="url(#mx-clip-1027-364-202-26-0)" font-size="12px"><text x="1028.5" y="376">unsigned long long entries</text></g><path d="M 1103 112 L 1128 112 L 1128 248.63" fill="none" stroke="#000000" stroke-miterlimit="10" pointer-events="none"/><path d="M 1128 253.88 L 1124.5 246.88 L 1128 248.63 L 1131.5 246.88 Z" fill="#000000" stroke="#000000" stroke-miterlimit="10" pointer-events="none"/><path d="M 1163 124.5 L 1163 98.5 L 1373 98.5 L 1373 124.5" fill="none" stroke="#000000" stroke-miterlimit="10" pointer-events="none"/><path d="M 1163 124.5 L 1163 228.5 L 1373 228.5 L 1373 124.5" fill="#ffffff" stroke="#000000" stroke-miterlimit="10" pointer-events="none"/><path d="M 1163 124.5 L 1373 124.5" fill="none" stroke="#000000" stroke-miterlimit="10" pointer-events="none"/><g fill="#000000" font-family="Helvetica" text-anchor="middle" font-size="12px"><text x="1267.5" y="116">NAME_VALUE</text></g><g fill="#000000" font-family="Helvetica" clip-path="url(#mx-clip-1167-130-202-26-0)" font-size="12px"><text x="1168.5" y="142">avl avl</text></g><g fill="#000000" font-family="Helvetica" clip-path="url(#mx-clip-1167-156-202-26-0)" font-size="12px"><text x="1168.5" y="168">uint32_t hash</text></g><g fill="#000000" font-family="Helvetica" clip-path="url(#mx-clip-1167-182-202-26-0)" font-size="12px"><text x="1168.5" y="194">char *name</text></g><g fill="#000000" font-family="Helvetica" clip-path="url(#mx-clip-1167-208-202-26-0)" font-size="12px"><text x="1168.5" y="220">void *value</text></g><path d="M 373 55.5 L 373 29.5 L 583 29.5 L 583 55.5" fill="none" stroke="#000000" stroke-miterlimit="10" pointer-events="none"/><path d="M 373 55.5 L 373 185.5 L 583 185.5 L 583 55.5" fill="#ffffff" stroke="#000000" stroke-miterlimit="10" pointer-events="none"/><path d="M 373 55.5 L 583 55.5" fill="none" stroke="#000000" stroke-miterlimit="10" pointer-events="none"/><g fill="#000000" font-family="Helvetica" text-anchor="middle" font-size="12px"><text x="477.5" y="47">REGISTRY_PERSON</text></g><g fill="#000000" font-family="Helvetica" clip-path="url(#mx-clip-377-61-202-26-0)" font-size="12px"><text x="378.5" y="73">char guid[GUID_LEN + 1]</text></g><g fill="#000000" font-family="Helvetica" clip-path="url(#mx-clip-377-87-202-26-0)" font-size="12px"><text x="378.5" y="99">avl_tree person_urls</text></g><g fill="#000000" font-family="Helvetica" clip-path="url(#mx-clip-377-113-202-26-0)" font-size="12px"><text x="378.5" y="125">uint32_t fist_t</text></g><g fill="#000000" font-family="Helvetica" clip-path="url(#mx-clip-377-139-202-26-0)" font-size="12px"><text x="378.5" y="151">uint32_t last_t</text></g><g fill="#000000" font-family="Helvetica" clip-path="url(#mx-clip-377-165-202-26-0)" font-size="12px"><text x="378.5" y="177">uint32_t usages</text></g><path d="M 523 280.5 L 523 254.5 L 733 254.5 L 733 280.5" fill="none" stroke="#000000" stroke-miterlimit="10" pointer-events="none"/><path d="M 523 280.5 L 523 488.5 L 733 488.5 L 733 280.5" fill="#ffffff" stroke="#000000" stroke-miterlimit="10" pointer-events="none"/><path d="M 523 280.5 L 733 280.5" fill="none" stroke="#000000" stroke-miterlimit="10" pointer-events="none"/><g fill="#000000" font-family="Helvetica" text-anchor="middle" font-size="12px"><text x="627.5" y="272">REGISTRY_PERSON_URL</text></g><g fill="#000000" font-family="Helvetica" clip-path="url(#mx-clip-527-286-202-26-0)" font-size="12px"><text x="528.5" y="298">avl avl</text></g><g fill="#000000" font-family="Helvetica" clip-path="url(#mx-clip-527-312-202-26-0)" font-size="12px"><text x="528.5" y="324">REGISTRY_URL *url</text></g><g fill="#000000" font-family="Helvetica" clip-path="url(#mx-clip-527-338-202-26-0)" font-size="12px"><text x="528.5" y="350">REGISTRY_MACHINE *machine</text></g><g fill="#000000" font-family="Helvetica" clip-path="url(#mx-clip-527-364-202-26-0)" font-size="12px"><text x="528.5" y="376">uint8_t flags</text></g><g fill="#000000" font-family="Helvetica" clip-path="url(#mx-clip-527-390-202-26-0)" font-size="12px"><text x="528.5" y="402">uint32_t first_t</text></g><g fill="#000000" font-family="Helvetica" clip-path="url(#mx-clip-527-416-202-26-0)" font-size="12px"><text x="528.5" y="428">uint32_t last_t</text></g><g fill="#000000" font-family="Helvetica" clip-path="url(#mx-clip-527-442-202-26-0)" font-size="12px"><text x="528.5" y="454">uint32_t usages</text></g><g fill="#000000" font-family="Helvetica" clip-path="url(#mx-clip-527-468-202-26-0)" font-size="12px"><text x="528.5" y="480">char machine_name[1]</text></g><path d="M 673 924 L 673 898 L 883 898 L 883 924" fill="none" stroke="#000000" stroke-miterlimit="10" pointer-events="none"/><path d="M 673 924 L 673 1054 L 883 1054 L 883 924" fill="#ffffff" stroke="#000000" stroke-miterlimit="10" pointer-events="none"/><path d="M 673 924 L 883 924" fill="none" stroke="#000000" stroke-miterlimit="10" pointer-events="none"/><g fill="#000000" font-family="Helvetica" text-anchor="middle" font-size="12px"><text x="777.5" y="915.5">REGISTRY_URL</text></g><g fill="#000000" font-family="Helvetica" clip-path="url(#mx-clip-677-929-202-26-0)" font-size="12px"><text x="678.5" y="941.5">avl avl</text></g><g fill="#000000" font-family="Helvetica" clip-path="url(#mx-clip-677-955-202-26-0)" font-size="12px"><text x="678.5" y="967.5">uint32_t hash</text></g><g fill="#000000" font-family="Helvetica" clip-path="url(#mx-clip-677-981-202-26-0)" font-size="12px"><text x="678.5" y="993.5">uint32_t links</text></g><g fill="#000000" font-family="Helvetica" clip-path="url(#mx-clip-677-1007-202-26-0)" font-size="12px"><text x="678.5" y="1019.5">uint16_t len</text></g><g fill="#000000" font-family="Helvetica" clip-path="url(#mx-clip-677-1033-202-26-0)" font-size="12px"><text x="678.5" y="1045.5">char url[1]</text></g><path d="M 733 320 L 778 320 L 778 891.63" fill="none" stroke="#000000" stroke-miterlimit="10" pointer-events="none"/><path d="M 778 896.88 L 774.5 889.88 L 778 891.63 L 781.5 889.88 Z" fill="#000000" stroke="#000000" stroke-miterlimit="10" pointer-events="none"/><path d="M 313 581.5 L 313 555.5 L 523 555.5 L 523 581.5" fill="none" stroke="#000000" stroke-miterlimit="10" pointer-events="none"/><path d="M 313 581.5 L 313 737.5 L 523 737.5 L 523 581.5" fill="#ffffff" stroke="#000000" stroke-miterlimit="10" pointer-events="none"/><path d="M 313 581.5 L 523 581.5" fill="none" stroke="#000000" stroke-miterlimit="10" pointer-events="none"/><g fill="#000000" font-family="Helvetica" text-anchor="middle" font-size="12px"><text x="417.5" y="573">REGISTRY_MACHINE</text></g><g fill="#000000" font-family="Helvetica" clip-path="url(#mx-clip-317-587-202-26-0)" font-size="12px"><text x="318.5" y="599">char guid[GUID_LEN + 1]</text></g><g fill="#000000" font-family="Helvetica" clip-path="url(#mx-clip-317-613-202-26-0)" font-size="12px"><text x="318.5" y="625">uint32_t links</text></g><g fill="#000000" font-family="Helvetica" clip-path="url(#mx-clip-317-639-202-26-0)" font-size="12px"><text x="318.5" y="651">DICTIONARY *machine_urls</text></g><g fill="#000000" font-family="Helvetica" clip-path="url(#mx-clip-317-665-202-26-0)" font-size="12px"><text x="318.5" y="677">uint32_t first_t</text></g><g fill="#000000" font-family="Helvetica" clip-path="url(#mx-clip-317-691-202-26-0)" font-size="12px"><text x="318.5" y="703">uint32_t last_t</text></g><g fill="#000000" font-family="Helvetica" clip-path="url(#mx-clip-317-717-202-26-0)" font-size="12px"><text x="318.5" y="729">uint32_t usages</text></g><path d="M 543 698.5 L 543 672.5 L 753 672.5 L 753 698.5" fill="none" stroke="#000000" stroke-miterlimit="10" pointer-events="none"/><path d="M 543 698.5 L 543 828.5 L 753 828.5 L 753 698.5" fill="#ffffff" stroke="#000000" stroke-miterlimit="10" pointer-events="none"/><path d="M 543 698.5 L 753 698.5" fill="none" stroke="#000000" stroke-miterlimit="10" pointer-events="none"/><g fill="#000000" font-family="Helvetica" text-anchor="middle" font-size="12px"><text x="647.5" y="690">REGISTRY_MACHINE_URL</text></g><g fill="#000000" font-family="Helvetica" clip-path="url(#mx-clip-547-704-202-26-0)" font-size="12px"><text x="548.5" y="716">REGISTRY_URL *url</text></g><g fill="#000000" font-family="Helvetica" clip-path="url(#mx-clip-547-730-202-26-0)" font-size="12px"><text x="548.5" y="742">uint8_t flags</text></g><g fill="#000000" font-family="Helvetica" clip-path="url(#mx-clip-547-756-202-26-0)" font-size="12px"><text x="548.5" y="768">uint32_t first_t</text></g><g fill="#000000" font-family="Helvetica" clip-path="url(#mx-clip-547-782-202-26-0)" font-size="12px"><text x="548.5" y="794">uint32_t last_t</text></g><g fill="#000000" font-family="Helvetica" clip-path="url(#mx-clip-547-808-202-26-0)" font-size="12px"><text x="548.5" y="820">uint32_t usages</text></g><path d="M 753 712 L 778 712 L 778 891.63" fill="none" stroke="#000000" stroke-miterlimit="10" pointer-events="none"/><path d="M 778 896.88 L 774.5 889.88 L 778 891.63 L 781.5 889.88 Z" fill="#000000" stroke="#000000" stroke-miterlimit="10" pointer-events="none"/><path d="M 523 647 L 648 647 L 648 666.63" fill="none" stroke="#000000" stroke-miterlimit="10" pointer-events="none"/><path d="M 648 671.88 L 644.5 664.88 L 648 666.63 L 651.5 664.88 Z" fill="#000000" stroke="#000000" stroke-miterlimit="10" pointer-events="none"/><g transform="translate(569.5,641.5)"><switch><foreignObject style="overflow:visible;" pointer-events="all" width="59" height="11" requiredFeatures="http://www.w3.org/TR/SVG11/feature#Extensibility"><div xmlns="http://www.w3.org/1999/xhtml" style="display: inline-block; font-size: 11px; font-family: Helvetica; color: rgb(0, 0, 0); line-height: 1.2; vertical-align: top; white-space: nowrap; text-align: center;"><div xmlns="http://www.w3.org/1999/xhtml" style="display:inline-block;text-align:inherit;text-decoration:inherit;background-color:#ffffff;">dictionary of</div></div></foreignObject><text x="30" y="11" fill="#000000" text-anchor="middle" font-size="11px" font-family="Helvetica">dictionary of</text></switch></g><path d="M 583 95 L 628 95 L 628 248.63" fill="none" stroke="#000000" stroke-miterlimit="10" pointer-events="none"/><path d="M 628 253.88 L 624.5 246.88 L 628 248.63 L 631.5 246.88 Z" fill="#000000" stroke="#000000" stroke-miterlimit="10" pointer-events="none"/><g transform="translate(603.5,147.5)"><switch><foreignObject style="overflow:visible;" pointer-events="all" width="48" height="11" requiredFeatures="http://www.w3.org/TR/SVG11/feature#Extensibility"><div xmlns="http://www.w3.org/1999/xhtml" style="display: inline-block; font-size: 11px; font-family: Helvetica; color: rgb(0, 0, 0); line-height: 1.2; vertical-align: top; white-space: nowrap; text-align: center;"><div xmlns="http://www.w3.org/1999/xhtml" style="display:inline-block;text-align:inherit;text-decoration:inherit;background-color:#ffffff;">avl tree of</div></div></foreignObject><text x="24" y="11" fill="#000000" text-anchor="middle" font-size="11px" font-family="Helvetica">avl tree of</text></switch></g><path d="M 1103 60 L 1268 60 L 1268 92.63" fill="none" stroke="#000000" stroke-miterlimit="10" pointer-events="none"/><path d="M 1268 97.88 L 1264.5 90.88 L 1268 92.63 L 1271.5 90.88 Z" fill="#000000" stroke="#000000" stroke-miterlimit="10" pointer-events="none"/><g transform="translate(1180.5,54.5)"><switch><foreignObject style="overflow:visible;" pointer-events="all" width="48" height="11" requiredFeatures="http://www.w3.org/TR/SVG11/feature#Extensibility"><div xmlns="http://www.w3.org/1999/xhtml" style="display: inline-block; font-size: 11px; font-family: Helvetica; color: rgb(0, 0, 0); line-height: 1.2; vertical-align: top; white-space: nowrap; text-align: center;"><div xmlns="http://www.w3.org/1999/xhtml" style="display:inline-block;text-align:inherit;text-decoration:inherit;background-color:#ffffff;">avl tree of</div></div></foreignObject><text x="24" y="11" fill="#000000" text-anchor="middle" font-size="11px" font-family="Helvetica">avl tree of</text></switch></g><path d="M 213 853 L 213 827 L 273 827 L 273 536 L 418 536 L 418 549.63" fill="none" stroke="#000000" stroke-miterlimit="10" pointer-events="none"/><path d="M 418 554.88 L 414.5 547.88 L 418 549.63 L 421.5 547.88 Z" fill="#000000" stroke="#000000" stroke-miterlimit="10" pointer-events="none"/><g transform="translate(243.5,636.5)"><switch><foreignObject style="overflow:visible;" pointer-events="all" width="59" height="11" requiredFeatures="http://www.w3.org/TR/SVG11/feature#Extensibility"><div xmlns="http://www.w3.org/1999/xhtml" style="display: inline-block; font-size: 11px; font-family: Helvetica; color: rgb(0, 0, 0); line-height: 1.2; vertical-align: top; white-space: nowrap; text-align: center;"><div xmlns="http://www.w3.org/1999/xhtml" style="display:inline-block;text-align:inherit;text-decoration:inherit;background-color:#ffffff;">dictionary of</div></div></foreignObject><text x="30" y="11" fill="#000000" text-anchor="middle" font-size="11px" font-family="Helvetica">dictionary of</text></switch></g><path d="M 733 346 L 753 346 L 753 518 L 418 518 L 418 549.63" fill="none" stroke="#000000" stroke-miterlimit="10" pointer-events="none"/><path d="M 418 554.88 L 414.5 547.88 L 418 549.63 L 421.5 547.88 Z" fill="#000000" stroke="#000000" stroke-miterlimit="10" pointer-events="none"/></svg>
\ No newline at end of file diff --git a/diagrams/data_structures/rrd.svg b/diagrams/data_structures/rrd.svg new file mode 100755 index 000000000..8b5014aa8 --- /dev/null +++ b/diagrams/data_structures/rrd.svg @@ -0,0 +1,2 @@ +<!DOCTYPE svg PUBLIC "-//W3C//DTD SVG 1.1//EN" "http://www.w3.org/Graphics/SVG/1.1/DTD/svg11.dtd"> +<svg xmlns="http://www.w3.org/2000/svg" xmlns:xlink="http://www.w3.org/1999/xlink" version="1.1" width="1787px" height="1646px" viewBox="-0.5 -0.5 1787 1646" style="background-color: rgb(255, 255, 255);"><defs><clipPath id="mx-clip-577-717-262-26-0"><rect x="577" y="717" width="262" height="26"/></clipPath><clipPath id="mx-clip-577-795-262-26-0"><rect x="577" y="795" width="262" height="26"/></clipPath><clipPath id="mx-clip-577-821-262-26-0"><rect x="577" y="821" width="262" height="26"/></clipPath><clipPath id="mx-clip-577-873-262-26-0"><rect x="577" y="873" width="262" height="26"/></clipPath><clipPath id="mx-clip-577-899-262-26-0"><rect x="577" y="899" width="262" height="26"/></clipPath><clipPath id="mx-clip-367-145-242-26-0"><rect x="367" y="145" width="242" height="26"/></clipPath><clipPath id="mx-clip-367-171-242-26-0"><rect x="367" y="171" width="242" height="26"/></clipPath><clipPath id="mx-clip-367-249-242-26-0"><rect x="367" y="249" width="242" height="26"/></clipPath><clipPath id="mx-clip-367-275-242-26-0"><rect x="367" y="275" width="242" height="26"/></clipPath><clipPath id="mx-clip-367-301-242-26-0"><rect x="367" y="301" width="242" height="26"/></clipPath><clipPath id="mx-clip-367-353-242-26-0"><rect x="367" y="353" width="242" height="26"/></clipPath><clipPath id="mx-clip-367-379-242-26-0"><rect x="367" y="379" width="242" height="26"/></clipPath><clipPath id="mx-clip-367-405-242-26-0"><rect x="367" y="405" width="242" height="26"/></clipPath><clipPath id="mx-clip-367-457-242-26-0"><rect x="367" y="457" width="242" height="26"/></clipPath><clipPath id="mx-clip-367-483-242-26-0"><rect x="367" y="483" width="242" height="26"/></clipPath><clipPath id="mx-clip-1247-165-172-26-0"><rect x="1247" y="165" width="172" height="26"/></clipPath><clipPath id="mx-clip-1247-191-172-26-0"><rect x="1247" y="191" width="172" height="26"/></clipPath><clipPath id="mx-clip-1247-217-172-26-0"><rect x="1247" y="217" width="172" height="26"/></clipPath><clipPath id="mx-clip-1247-243-172-26-0"><rect x="1247" y="243" width="172" height="26"/></clipPath><clipPath id="mx-clip-1247-269-172-26-0"><rect x="1247" y="269" width="172" height="26"/></clipPath><clipPath id="mx-clip-7-178-242-26-0"><rect x="7" y="178" width="242" height="26"/></clipPath><clipPath id="mx-clip-7-282-242-26-0"><rect x="7" y="282" width="242" height="26"/></clipPath><clipPath id="mx-clip-7-334-242-26-0"><rect x="7" y="334" width="242" height="26"/></clipPath><clipPath id="mx-clip-7-360-242-26-0"><rect x="7" y="360" width="242" height="26"/></clipPath><clipPath id="mx-clip-7-386-242-26-0"><rect x="7" y="386" width="242" height="26"/></clipPath><clipPath id="mx-clip-7-412-242-26-0"><rect x="7" y="412" width="242" height="26"/></clipPath><clipPath id="mx-clip-7-438-242-26-0"><rect x="7" y="438" width="242" height="26"/></clipPath><clipPath id="mx-clip-7-464-242-26-0"><rect x="7" y="464" width="242" height="26"/></clipPath><clipPath id="mx-clip-7-490-242-26-0"><rect x="7" y="490" width="242" height="26"/></clipPath><clipPath id="mx-clip-7-542-242-26-0"><rect x="7" y="542" width="242" height="26"/></clipPath><clipPath id="mx-clip-7-568-242-26-0"><rect x="7" y="568" width="242" height="26"/></clipPath><clipPath id="mx-clip-7-594-242-26-0"><rect x="7" y="594" width="242" height="26"/></clipPath><clipPath id="mx-clip-7-620-242-26-0"><rect x="7" y="620" width="242" height="26"/></clipPath><clipPath id="mx-clip-7-646-242-26-0"><rect x="7" y="646" width="242" height="26"/></clipPath><clipPath id="mx-clip-1617-477-162-26-0"><rect x="1617" y="477" width="162" height="26"/></clipPath><clipPath id="mx-clip-1617-503-162-26-0"><rect x="1617" y="503" width="162" height="26"/></clipPath><clipPath id="mx-clip-1617-529-162-26-0"><rect x="1617" y="529" width="162" height="26"/></clipPath><clipPath id="mx-clip-1617-555-162-26-0"><rect x="1617" y="555" width="162" height="26"/></clipPath><clipPath id="mx-clip-1617-581-162-26-0"><rect x="1617" y="581" width="162" height="26"/></clipPath><clipPath id="mx-clip-1617-607-162-26-0"><rect x="1617" y="607" width="162" height="26"/></clipPath><clipPath id="mx-clip-1617-633-162-26-0"><rect x="1617" y="633" width="162" height="26"/></clipPath><clipPath id="mx-clip-1317-555-212-26-0"><rect x="1317" y="555" width="212" height="26"/></clipPath><clipPath id="mx-clip-1317-581-212-26-0"><rect x="1317" y="581" width="212" height="26"/></clipPath><clipPath id="mx-clip-1317-607-212-26-0"><rect x="1317" y="607" width="212" height="26"/></clipPath><clipPath id="mx-clip-1317-633-212-26-0"><rect x="1317" y="633" width="212" height="26"/></clipPath><clipPath id="mx-clip-1317-659-212-26-0"><rect x="1317" y="659" width="212" height="26"/></clipPath><clipPath id="mx-clip-1317-685-212-26-0"><rect x="1317" y="685" width="212" height="26"/></clipPath><clipPath id="mx-clip-1317-711-212-26-0"><rect x="1317" y="711" width="212" height="26"/></clipPath><clipPath id="mx-clip-1317-737-212-26-0"><rect x="1317" y="737" width="212" height="26"/></clipPath><clipPath id="mx-clip-1317-763-212-26-0"><rect x="1317" y="763" width="212" height="26"/></clipPath><clipPath id="mx-clip-1317-789-212-26-0"><rect x="1317" y="789" width="212" height="26"/></clipPath><clipPath id="mx-clip-1317-815-212-26-0"><rect x="1317" y="815" width="212" height="26"/></clipPath><clipPath id="mx-clip-1317-841-212-26-0"><rect x="1317" y="841" width="212" height="26"/></clipPath><clipPath id="mx-clip-1317-867-212-26-0"><rect x="1317" y="867" width="212" height="26"/></clipPath><clipPath id="mx-clip-1317-893-212-26-0"><rect x="1317" y="893" width="212" height="26"/></clipPath><clipPath id="mx-clip-967-730-272-26-0"><rect x="967" y="730" width="272" height="26"/></clipPath><clipPath id="mx-clip-967-756-272-26-0"><rect x="967" y="756" width="272" height="26"/></clipPath><clipPath id="mx-clip-967-782-272-26-0"><rect x="967" y="782" width="272" height="26"/></clipPath><clipPath id="mx-clip-967-808-272-26-0"><rect x="967" y="808" width="272" height="26"/></clipPath><clipPath id="mx-clip-967-834-272-26-0"><rect x="967" y="834" width="272" height="26"/></clipPath><clipPath id="mx-clip-967-860-272-26-0"><rect x="967" y="860" width="272" height="26"/></clipPath><clipPath id="mx-clip-967-886-272-26-0"><rect x="967" y="886" width="272" height="26"/></clipPath><clipPath id="mx-clip-967-912-272-26-0"><rect x="967" y="912" width="272" height="26"/></clipPath><clipPath id="mx-clip-967-938-272-26-0"><rect x="967" y="938" width="272" height="26"/></clipPath><clipPath id="mx-clip-967-964-272-26-0"><rect x="967" y="964" width="272" height="26"/></clipPath><clipPath id="mx-clip-967-990-272-26-0"><rect x="967" y="990" width="272" height="26"/></clipPath><clipPath id="mx-clip-967-1016-272-26-0"><rect x="967" y="1016" width="272" height="26"/></clipPath><clipPath id="mx-clip-967-1042-272-26-0"><rect x="967" y="1042" width="272" height="26"/></clipPath><clipPath id="mx-clip-967-1068-272-26-0"><rect x="967" y="1068" width="272" height="26"/></clipPath><clipPath id="mx-clip-967-1094-272-26-0"><rect x="967" y="1094" width="272" height="26"/></clipPath><clipPath id="mx-clip-967-1120-272-26-0"><rect x="967" y="1120" width="272" height="26"/></clipPath><clipPath id="mx-clip-967-1146-272-26-0"><rect x="967" y="1146" width="272" height="26"/></clipPath><clipPath id="mx-clip-967-1172-272-26-0"><rect x="967" y="1172" width="272" height="26"/></clipPath><clipPath id="mx-clip-967-1198-272-26-0"><rect x="967" y="1198" width="272" height="26"/></clipPath><clipPath id="mx-clip-967-1224-272-26-0"><rect x="967" y="1224" width="272" height="26"/></clipPath><clipPath id="mx-clip-967-1250-272-26-0"><rect x="967" y="1250" width="272" height="26"/></clipPath><clipPath id="mx-clip-967-1276-272-26-0"><rect x="967" y="1276" width="272" height="26"/></clipPath><clipPath id="mx-clip-967-1302-272-26-0"><rect x="967" y="1302" width="272" height="26"/></clipPath><clipPath id="mx-clip-967-1328-272-26-0"><rect x="967" y="1328" width="272" height="26"/></clipPath><clipPath id="mx-clip-967-1354-272-26-0"><rect x="967" y="1354" width="272" height="26"/></clipPath><clipPath id="mx-clip-67-815-212-26-0"><rect x="67" y="815" width="212" height="26"/></clipPath><clipPath id="mx-clip-67-841-212-26-0"><rect x="67" y="841" width="212" height="26"/></clipPath><clipPath id="mx-clip-67-867-212-26-0"><rect x="67" y="867" width="212" height="26"/></clipPath><clipPath id="mx-clip-67-893-212-26-0"><rect x="67" y="893" width="212" height="26"/></clipPath><clipPath id="mx-clip-67-919-212-26-0"><rect x="67" y="919" width="212" height="26"/></clipPath><clipPath id="mx-clip-67-945-212-26-0"><rect x="67" y="945" width="212" height="26"/></clipPath><clipPath id="mx-clip-347-1068-132-26-0"><rect x="347" y="1068" width="132" height="26"/></clipPath><clipPath id="mx-clip-347-1094-132-26-0"><rect x="347" y="1094" width="132" height="26"/></clipPath><clipPath id="mx-clip-37-1117-212-26-0"><rect x="37" y="1117" width="212" height="26"/></clipPath><clipPath id="mx-clip-37-1143-212-26-0"><rect x="37" y="1143" width="212" height="26"/></clipPath><clipPath id="mx-clip-37-1169-212-26-0"><rect x="37" y="1169" width="212" height="26"/></clipPath><clipPath id="mx-clip-37-1221-212-26-0"><rect x="37" y="1221" width="212" height="26"/></clipPath><clipPath id="mx-clip-37-1247-212-26-0"><rect x="37" y="1247" width="212" height="26"/></clipPath><clipPath id="mx-clip-37-1273-212-26-0"><rect x="37" y="1273" width="212" height="26"/></clipPath><clipPath id="mx-clip-37-1299-212-26-0"><rect x="37" y="1299" width="212" height="26"/></clipPath><clipPath id="mx-clip-37-1325-212-26-0"><rect x="37" y="1325" width="212" height="26"/></clipPath><clipPath id="mx-clip-37-1351-212-26-0"><rect x="37" y="1351" width="212" height="26"/></clipPath><clipPath id="mx-clip-37-1377-212-26-0"><rect x="37" y="1377" width="212" height="26"/></clipPath><clipPath id="mx-clip-37-1403-212-26-0"><rect x="37" y="1403" width="212" height="26"/></clipPath><clipPath id="mx-clip-587-1065-242-26-0"><rect x="587" y="1065" width="242" height="26"/></clipPath><clipPath id="mx-clip-587-1091-242-26-0"><rect x="587" y="1091" width="242" height="26"/></clipPath><clipPath id="mx-clip-587-1117-242-26-0"><rect x="587" y="1117" width="242" height="26"/></clipPath><clipPath id="mx-clip-587-1143-242-26-0"><rect x="587" y="1143" width="242" height="26"/></clipPath><clipPath id="mx-clip-587-1169-242-26-0"><rect x="587" y="1169" width="242" height="26"/></clipPath><clipPath id="mx-clip-377-1280-162-26-0"><rect x="377" y="1280" width="162" height="26"/></clipPath><clipPath id="mx-clip-377-1306-162-26-0"><rect x="377" y="1306" width="162" height="26"/></clipPath><clipPath id="mx-clip-377-1332-162-26-0"><rect x="377" y="1332" width="162" height="26"/></clipPath><clipPath id="mx-clip-377-1358-162-26-0"><rect x="377" y="1358" width="162" height="26"/></clipPath><clipPath id="mx-clip-377-1384-162-26-0"><rect x="377" y="1384" width="162" height="26"/></clipPath><clipPath id="mx-clip-377-1410-162-26-0"><rect x="377" y="1410" width="162" height="26"/></clipPath><clipPath id="mx-clip-377-1436-162-26-0"><rect x="377" y="1436" width="162" height="26"/></clipPath><clipPath id="mx-clip-377-1462-162-26-0"><rect x="377" y="1462" width="162" height="26"/></clipPath><clipPath id="mx-clip-377-1488-162-26-0"><rect x="377" y="1488" width="162" height="26"/></clipPath><clipPath id="mx-clip-377-1514-162-26-0"><rect x="377" y="1514" width="162" height="26"/></clipPath><clipPath id="mx-clip-377-1540-162-26-0"><rect x="377" y="1540" width="162" height="26"/></clipPath><clipPath id="mx-clip-607-1280-132-26-0"><rect x="607" y="1280" width="132" height="26"/></clipPath><clipPath id="mx-clip-607-1306-132-26-0"><rect x="607" y="1306" width="132" height="26"/></clipPath><clipPath id="mx-clip-607-1332-132-26-0"><rect x="607" y="1332" width="132" height="26"/></clipPath><clipPath id="mx-clip-607-1358-132-26-0"><rect x="607" y="1358" width="132" height="26"/></clipPath><clipPath id="mx-clip-607-1384-132-26-0"><rect x="607" y="1384" width="132" height="26"/></clipPath><clipPath id="mx-clip-677-1462-172-26-0"><rect x="677" y="1462" width="172" height="26"/></clipPath><clipPath id="mx-clip-677-1488-172-26-0"><rect x="677" y="1488" width="172" height="26"/></clipPath><clipPath id="mx-clip-677-1514-172-26-0"><rect x="677" y="1514" width="172" height="26"/></clipPath><clipPath id="mx-clip-877-1566-142-26-0"><rect x="877" y="1566" width="142" height="26"/></clipPath><clipPath id="mx-clip-877-1592-142-26-0"><rect x="877" y="1592" width="142" height="26"/></clipPath><clipPath id="mx-clip-877-1618-142-26-0"><rect x="877" y="1618" width="142" height="26"/></clipPath></defs><path d="M 573 712 L 573 686 L 843 686 L 843 712" fill="none" stroke="#000000" stroke-miterlimit="10" pointer-events="none"/><path d="M 573 712 L 573 920 L 843 920 L 843 712" fill="#ffffff" stroke="#000000" stroke-miterlimit="10" pointer-events="none"/><path d="M 573 712 L 843 712" fill="none" stroke="#000000" stroke-miterlimit="10" pointer-events="none"/><g fill="#000000" font-family="Helvetica" text-anchor="middle" font-size="12px"><text x="707.5" y="703.5">RRDDIM</text></g><g fill="#000000" font-family="Helvetica" clip-path="url(#mx-clip-577-717-262-26-0)" font-size="12px"><text x="578.5" y="729.5">avl avl</text></g><path d="M 573 764 L 573 738 L 843 738 L 843 764" fill="none" stroke="#000000" stroke-miterlimit="10" pointer-events="none"/><path d="M 573 764 L 843 764" fill="none" stroke="#000000" stroke-miterlimit="10" pointer-events="none"/><g fill="#000000" font-family="Helvetica" text-anchor="middle" font-size="12px"><text x="707.5" y="754.5">... dimension definition</text></g><path d="M 573 790 L 573 764 L 843 764 L 843 790" fill="none" stroke="#000000" stroke-miterlimit="10" pointer-events="none"/><path d="M 573 790 L 843 790" fill="none" stroke="#000000" stroke-miterlimit="10" pointer-events="none"/><g fill="#000000" font-family="Helvetica" text-anchor="middle" font-size="12px"><text x="707.5" y="780.5">... temporary data</text></g><path d="M 843 803 L 863 803 L 863 660 L 708 660 L 708 679.63" fill="none" stroke="#000000" stroke-miterlimit="10" pointer-events="none"/><path d="M 708 684.88 L 704.5 677.88 L 708 679.63 L 711.5 677.88 Z" fill="#000000" stroke="#000000" stroke-miterlimit="10" pointer-events="none"/><g fill="#000000" font-family="Helvetica" clip-path="url(#mx-clip-577-795-262-26-0)" font-size="12px"><text x="578.5" y="807.5">struct rrddim *next</text></g><g fill="#000000" font-family="Helvetica" clip-path="url(#mx-clip-577-821-262-26-0)" font-size="12px"><text x="578.5" y="833.5">struct rrdsset *rrdset</text></g><path d="M 573 868 L 573 842 L 843 842 L 843 868" fill="none" stroke="#000000" stroke-miterlimit="10" pointer-events="none"/><path d="M 573 868 L 843 868" fill="none" stroke="#000000" stroke-miterlimit="10" pointer-events="none"/><g fill="#000000" font-family="Helvetica" text-anchor="middle" font-size="12px"><text x="707.5" y="858.5">... disk data checking</text></g><g fill="#000000" font-family="Helvetica" clip-path="url(#mx-clip-577-873-262-26-0)" font-size="12px"><text x="578.5" y="885.5">struct rrddimvar *variables</text></g><g fill="#000000" font-family="Helvetica" clip-path="url(#mx-clip-577-899-262-26-0)" font-size="12px"><text x="578.5" y="911.5">storage_number values[]</text></g><path d="M 363 139.79 L 363 113.79 L 613 113.79 L 613 139.79" fill="none" stroke="#000000" stroke-miterlimit="10" pointer-events="none"/><path d="M 363 139.79 L 363 503.79 L 613 503.79 L 613 139.79" fill="#ffffff" stroke="#000000" stroke-miterlimit="10" pointer-events="none"/><path d="M 363 139.79 L 613 139.79" fill="none" stroke="#000000" stroke-miterlimit="10" pointer-events="none"/><g fill="#000000" font-family="Helvetica" text-anchor="middle" font-size="12px"><text x="487.5" y="131.29">RRDSET</text></g><g fill="#000000" font-family="Helvetica" clip-path="url(#mx-clip-367-145-242-26-0)" font-size="12px"><text x="368.5" y="157.29">avl avl</text></g><g fill="#000000" font-family="Helvetica" clip-path="url(#mx-clip-367-171-242-26-0)" font-size="12px"><text x="368.5" y="183.29">avl avlname</text></g><path d="M 363 217.79 L 363 191.79 L 613 191.79 L 613 217.79" fill="none" stroke="#000000" stroke-miterlimit="10" pointer-events="none"/><path d="M 363 217.79 L 613 217.79" fill="none" stroke="#000000" stroke-miterlimit="10" pointer-events="none"/><g fill="#000000" font-family="Helvetica" text-anchor="middle" font-size="12px"><text x="487.5" y="208.29">... set configuration</text></g><path d="M 363 243.79 L 363 217.79 L 613 217.79 L 613 243.79" fill="none" stroke="#000000" stroke-miterlimit="10" pointer-events="none"/><path d="M 363 243.79 L 613 243.79" fill="none" stroke="#000000" stroke-miterlimit="10" pointer-events="none"/><g fill="#000000" font-family="Helvetica" text-anchor="middle" font-size="12px"><text x="487.5" y="234.29">... temporary data</text></g><g fill="#000000" font-family="Helvetica" clip-path="url(#mx-clip-367-249-242-26-0)" font-size="12px"><text x="368.5" y="261.29">RRDFAMILY *rrdfamily</text></g><g fill="#000000" font-family="Helvetica" clip-path="url(#mx-clip-367-275-242-26-0)" font-size="12px"><text x="368.5" y="287.29">RRDHOST *rrdhost</text></g><path d="M 613 309 L 633 309 L 633 66 L 488 66 L 488 107.63" fill="none" stroke="#000000" stroke-miterlimit="10" pointer-events="none"/><path d="M 488 112.88 L 484.5 105.88 L 488 107.63 L 491.5 105.88 Z" fill="#000000" stroke="#000000" stroke-miterlimit="10" pointer-events="none"/><g fill="#000000" font-family="Helvetica" clip-path="url(#mx-clip-367-301-242-26-0)" font-size="12px"><text x="368.5" y="313.29">struct rrdset *next</text></g><path d="M 363 347.79 L 363 321.79 L 613 321.79 L 613 347.79" fill="none" stroke="#000000" stroke-miterlimit="10" pointer-events="none"/><path d="M 363 347.79 L 613 347.79" fill="none" stroke="#000000" stroke-miterlimit="10" pointer-events="none"/><g fill="#000000" font-family="Helvetica" text-anchor="middle" font-size="12px"><text x="487.5" y="338.29">... local variables</text></g><g fill="#000000" font-family="Helvetica" clip-path="url(#mx-clip-367-353-242-26-0)" font-size="12px"><text x="368.5" y="365.29">avl_tree_lock rrdvar_root_index</text></g><g fill="#000000" font-family="Helvetica" clip-path="url(#mx-clip-367-379-242-26-0)" font-size="12px"><text x="368.5" y="391.29">RRDSETVAR *variables</text></g><g fill="#000000" font-family="Helvetica" clip-path="url(#mx-clip-367-405-242-26-0)" font-size="12px"><text x="368.5" y="417.29">RRDCALC *alarms</text></g><path d="M 363 451.79 L 363 425.79 L 613 425.79 L 613 451.79" fill="none" stroke="#000000" stroke-miterlimit="10" pointer-events="none"/><path d="M 363 451.79 L 613 451.79" fill="none" stroke="#000000" stroke-miterlimit="10" pointer-events="none"/><g fill="#000000" font-family="Helvetica" text-anchor="middle" font-size="12px"><text x="487.5" y="442.29">... disk data checking</text></g><g fill="#000000" font-family="Helvetica" clip-path="url(#mx-clip-367-457-242-26-0)" font-size="12px"><text x="368.5" y="469.29">avl_tree_lock dimensions_index</text></g><g fill="#000000" font-family="Helvetica" clip-path="url(#mx-clip-367-483-242-26-0)" font-size="12px"><text x="368.5" y="495.29">RRDDIM *dimensions</text></g><path d="M 253 550 L 308 550 L 308 94 L 488 94 L 488 107.63" fill="none" stroke="#000000" stroke-miterlimit="10" pointer-events="none"/><path d="M 488 112.88 L 484.5 105.88 L 488 107.63 L 491.5 105.88 Z" fill="#000000" stroke="#000000" stroke-miterlimit="10" pointer-events="none"/><g transform="translate(283.5,243.5)"><switch><foreignObject style="overflow:visible;" pointer-events="all" width="48" height="11" requiredFeatures="http://www.w3.org/TR/SVG11/feature#Extensibility"><div xmlns="http://www.w3.org/1999/xhtml" style="display: inline-block; font-size: 11px; font-family: Helvetica; color: rgb(0, 0, 0); line-height: 1.2; vertical-align: top; white-space: nowrap; text-align: center;"><div xmlns="http://www.w3.org/1999/xhtml" style="display:inline-block;text-align:inherit;text-decoration:inherit;background-color:#ffffff;">avl tree of</div></div></foreignObject><text x="24" y="11" fill="#000000" text-anchor="middle" font-size="11px" font-family="Helvetica">avl tree of</text></switch></g><path d="M 253 628 L 933 628 L 933 427 L 1698 427 L 1698 440.63" fill="none" stroke="#000000" stroke-miterlimit="10" pointer-events="none"/><path d="M 1698 445.88 L 1694.5 438.88 L 1698 440.63 L 1701.5 438.88 Z" fill="#000000" stroke="#000000" stroke-miterlimit="10" pointer-events="none"/><g transform="translate(908.5,469.5)"><switch><foreignObject style="overflow:visible;" pointer-events="all" width="48" height="11" requiredFeatures="http://www.w3.org/TR/SVG11/feature#Extensibility"><div xmlns="http://www.w3.org/1999/xhtml" style="display: inline-block; font-size: 11px; font-family: Helvetica; color: rgb(0, 0, 0); line-height: 1.2; vertical-align: top; white-space: nowrap; text-align: center;"><div xmlns="http://www.w3.org/1999/xhtml" style="display:inline-block;text-align:inherit;text-decoration:inherit;background-color:#ffffff;">avl tree of</div></div></foreignObject><text x="24" y="11" fill="#000000" text-anchor="middle" font-size="11px" font-family="Helvetica">avl tree of</text></switch></g><path d="M 253 602 L 930 602 C 930 598.1 936 598.1 936 602 L 936 602 L 1003 602 L 1003 430 C 1006.9 430 1006.9 424 1003 424 L 1003 424 L 1003 114 L 1333 114 L 1333 127.63" fill="none" stroke="#000000" stroke-miterlimit="10" pointer-events="none"/><path d="M 1333 132.88 L 1329.5 125.88 L 1333 127.63 L 1336.5 125.88 Z" fill="#000000" stroke="#000000" stroke-miterlimit="10" pointer-events="none"/><g transform="translate(978.5,552.5)"><switch><foreignObject style="overflow:visible;" pointer-events="all" width="48" height="11" requiredFeatures="http://www.w3.org/TR/SVG11/feature#Extensibility"><div xmlns="http://www.w3.org/1999/xhtml" style="display: inline-block; font-size: 11px; font-family: Helvetica; color: rgb(0, 0, 0); line-height: 1.2; vertical-align: top; white-space: nowrap; text-align: center;"><div xmlns="http://www.w3.org/1999/xhtml" style="display:inline-block;text-align:inherit;text-decoration:inherit;background-color:#ffffff;">avl tree of</div></div></foreignObject><text x="24" y="11" fill="#000000" text-anchor="middle" font-size="11px" font-family="Helvetica">avl tree of</text></switch></g><path d="M 1243 160 L 1243 134 L 1423 134 L 1423 160" fill="none" stroke="#000000" stroke-miterlimit="10" pointer-events="none"/><path d="M 1243 160 L 1243 290 L 1423 290 L 1423 160" fill="#ffffff" stroke="#000000" stroke-miterlimit="10" pointer-events="none"/><path d="M 1243 160 L 1423 160" fill="none" stroke="#000000" stroke-miterlimit="10" pointer-events="none"/><g fill="#000000" font-family="Helvetica" text-anchor="middle" font-size="12px"><text x="1332.5" y="151.5">RRDFAMILY</text></g><g fill="#000000" font-family="Helvetica" clip-path="url(#mx-clip-1247-165-172-26-0)" font-size="12px"><text x="1248.5" y="177.5">avl avl</text></g><g fill="#000000" font-family="Helvetica" clip-path="url(#mx-clip-1247-191-172-26-0)" font-size="12px"><text x="1248.5" y="203.5">const char *family</text></g><g fill="#000000" font-family="Helvetica" clip-path="url(#mx-clip-1247-217-172-26-0)" font-size="12px"><text x="1248.5" y="229.5">uint32_t hash_family</text></g><g fill="#000000" font-family="Helvetica" clip-path="url(#mx-clip-1247-243-172-26-0)" font-size="12px"><text x="1248.5" y="255.5">size_t use_count</text></g><g fill="#000000" font-family="Helvetica" clip-path="url(#mx-clip-1247-269-172-26-0)" font-size="12px"><text x="1248.5" y="281.5">avl_tree_lock rrdvar_root_index</text></g><path d="M 3 173 L 3 147 L 253 147 L 253 173" fill="none" stroke="#000000" stroke-miterlimit="10" pointer-events="none"/><path d="M 3 173 L 3 667 L 253 667 L 253 173" fill="#ffffff" stroke="#000000" stroke-miterlimit="10" pointer-events="none"/><path d="M 3 173 L 253 173" fill="none" stroke="#000000" stroke-miterlimit="10" pointer-events="none"/><g fill="#000000" font-family="Helvetica" text-anchor="middle" font-size="12px"><text x="127.5" y="164.5">RRDHOST</text></g><g fill="#000000" font-family="Helvetica" clip-path="url(#mx-clip-7-178-242-26-0)" font-size="12px"><text x="8.5" y="190.5">avl avl</text></g><path d="M 3 225 L 3 199 L 253 199 L 253 225" fill="none" stroke="#000000" stroke-miterlimit="10" pointer-events="none"/><path d="M 3 225 L 253 225" fill="none" stroke="#000000" stroke-miterlimit="10" pointer-events="none"/><g fill="#000000" font-family="Helvetica" text-anchor="middle" font-size="12px"><text x="127.5" y="215.5">... host information</text></g><path d="M 3 251 L 3 225 L 253 225 L 253 251" fill="none" stroke="#000000" stroke-miterlimit="10" pointer-events="none"/><path d="M 3 251 L 253 251" fill="none" stroke="#000000" stroke-miterlimit="10" pointer-events="none"/><g fill="#000000" font-family="Helvetica" text-anchor="middle" font-size="12px"><text x="127.5" y="241.5">... streaming</text></g><path d="M 3 277 L 3 251 L 253 251 L 253 277" fill="none" stroke="#000000" stroke-miterlimit="10" pointer-events="none"/><path d="M 3 277 L 253 277" fill="none" stroke="#000000" stroke-miterlimit="10" pointer-events="none"/><g fill="#000000" font-family="Helvetica" text-anchor="middle" font-size="12px"><text x="127.5" y="267.5">... health monitoring options</text></g><g fill="#000000" font-family="Helvetica" clip-path="url(#mx-clip-7-282-242-26-0)" font-size="12px"><text x="8.5" y="294.5">RRDCALC *alarms</text></g><path d="M 3 329 L 3 303 L 253 303 L 253 329" fill="none" stroke="#000000" stroke-miterlimit="10" pointer-events="none"/><path d="M 3 329 L 3 433 L 253 433 L 253 329" fill="#ffffff" stroke="#000000" stroke-miterlimit="10" pointer-events="none"/><path d="M 3 329 L 253 329" fill="none" stroke="#000000" stroke-miterlimit="10" pointer-events="none"/><g fill="#000000" font-family="Helvetica" text-anchor="middle" font-size="12px"><text x="127.5" y="320.5">... health monitoring options</text></g><g fill="#000000" font-family="Helvetica" clip-path="url(#mx-clip-7-334-242-26-0)" font-size="12px"><text x="8.5" y="346.5">ALARM_LOG health_log</text></g><g fill="#000000" font-family="Helvetica" clip-path="url(#mx-clip-7-360-242-26-0)" font-size="12px"><text x="8.5" y="372.5">uint32_t health_last_processed_id</text></g><g fill="#000000" font-family="Helvetica" clip-path="url(#mx-clip-7-386-242-26-0)" font-size="12px"><text x="8.5" y="398.5">uint32_t health_max_unique_id</text></g><g fill="#000000" font-family="Helvetica" clip-path="url(#mx-clip-7-412-242-26-0)" font-size="12px"><text x="8.5" y="424.5">uint32_t health_max_alarm_id</text></g><g fill="#000000" font-family="Helvetica" clip-path="url(#mx-clip-7-438-242-26-0)" font-size="12px"><text x="8.5" y="450.5">RRDCALCTEMPLATE *templates</text></g><g fill="#000000" font-family="Helvetica" clip-path="url(#mx-clip-7-464-242-26-0)" font-size="12px"><text x="8.5" y="476.5">RRDSET *rrdset_root</text></g><g fill="#000000" font-family="Helvetica" clip-path="url(#mx-clip-7-490-242-26-0)" font-size="12px"><text x="8.5" y="502.5">netdata_rwlock_t rrdhost_rwlock</text></g><path d="M 3 537 L 3 511 L 253 511 L 253 537" fill="none" stroke="#000000" stroke-miterlimit="10" pointer-events="none"/><path d="M 3 537 L 3 667 L 253 667 L 253 537" fill="#ffffff" stroke="#000000" stroke-miterlimit="10" pointer-events="none"/><path d="M 3 537 L 253 537" fill="none" stroke="#000000" stroke-miterlimit="10" pointer-events="none"/><g fill="#000000" font-family="Helvetica" text-anchor="middle" font-size="12px"><text x="127.5" y="528.5">... indexes</text></g><g fill="#000000" font-family="Helvetica" clip-path="url(#mx-clip-7-542-242-26-0)" font-size="12px"><text x="8.5" y="554.5">avl_tree_lock rrdset_root_index</text></g><g fill="#000000" font-family="Helvetica" clip-path="url(#mx-clip-7-568-242-26-0)" font-size="12px"><text x="8.5" y="580.5">avl_tree_lock rrdset_root_index_name</text></g><g fill="#000000" font-family="Helvetica" clip-path="url(#mx-clip-7-594-242-26-0)" font-size="12px"><text x="8.5" y="606.5">avl_tree_lock rrdfamily_root_index</text></g><g fill="#000000" font-family="Helvetica" clip-path="url(#mx-clip-7-620-242-26-0)" font-size="12px"><text x="8.5" y="632.5">avl_tree_lock rrdvar_root_index</text></g><g fill="#000000" font-family="Helvetica" clip-path="url(#mx-clip-7-646-242-26-0)" font-size="12px"><text x="8.5" y="658.5">struct rrdhost *next</text></g><path d="M 253 654 L 273 654 L 273 631 C 276.9 631 276.9 625 273 625 L 273 625 L 273 605 C 276.9 605 276.9 599 273 599 L 273 599 L 273 553 C 276.9 553 276.9 547 273 547 L 273 547 L 273 127 L 128 127 L 128 140.63" fill="none" stroke="#000000" stroke-miterlimit="10" pointer-events="none"/><path d="M 128 145.88 L 124.5 138.88 L 128 140.63 L 131.5 138.88 Z" fill="#000000" stroke="#000000" stroke-miterlimit="10" pointer-events="none"/><path d="M 1613 472 L 1613 447 L 1783 447 L 1783 472" fill="none" stroke="#000000" stroke-miterlimit="10" pointer-events="none"/><path d="M 1613 472 L 1613 654 L 1783 654 L 1783 472" fill="#ffffff" stroke="#000000" stroke-miterlimit="10" pointer-events="none"/><path d="M 1613 472 L 1783 472" fill="none" stroke="#000000" stroke-miterlimit="10" pointer-events="none"/><g fill="#000000" font-family="Helvetica" text-anchor="middle" font-size="12px"><text x="1697.5" y="464">RRDVAR</text></g><g fill="#000000" font-family="Helvetica" clip-path="url(#mx-clip-1617-477-162-26-0)" font-size="12px"><text x="1618.5" y="489.5">avl avl</text></g><g fill="#000000" font-family="Helvetica" clip-path="url(#mx-clip-1617-503-162-26-0)" font-size="12px"><text x="1618.5" y="515.5">char *name</text></g><g fill="#000000" font-family="Helvetica" clip-path="url(#mx-clip-1617-529-162-26-0)" font-size="12px"><text x="1618.5" y="541.5">uint32_t hash</text></g><g fill="#000000" font-family="Helvetica" clip-path="url(#mx-clip-1617-555-162-26-0)" font-size="12px"><text x="1618.5" y="567.5">RRDVAR_TYPE type</text></g><g fill="#000000" font-family="Helvetica" clip-path="url(#mx-clip-1617-581-162-26-0)" font-size="12px"><text x="1618.5" y="593.5">RRDVAR_OPTIONS options</text></g><g fill="#000000" font-family="Helvetica" clip-path="url(#mx-clip-1617-607-162-26-0)" font-size="12px"><text x="1618.5" y="619.5">void *value</text></g><g fill="#000000" font-family="Helvetica" clip-path="url(#mx-clip-1617-633-162-26-0)" font-size="12px"><text x="1618.5" y="645.5">time_t last_updated</text></g><path d="M 1313 550 L 1313 524 L 1533 524 L 1533 550" fill="none" stroke="#000000" stroke-miterlimit="10" pointer-events="none"/><path d="M 1313 550 L 1313 914 L 1533 914 L 1533 550" fill="#ffffff" stroke="#000000" stroke-miterlimit="10" pointer-events="none"/><path d="M 1313 550 L 1533 550" fill="none" stroke="#000000" stroke-miterlimit="10" pointer-events="none"/><g fill="#000000" font-family="Helvetica" text-anchor="middle" font-size="12px"><text x="1422.5" y="541.5">RRDSETVAR</text></g><g fill="#000000" font-family="Helvetica" clip-path="url(#mx-clip-1317-555-212-26-0)" font-size="12px"><text x="1318.5" y="567.5">char *variable</text></g><g fill="#000000" font-family="Helvetica" clip-path="url(#mx-clip-1317-581-212-26-0)" font-size="12px"><text x="1318.5" y="593.5">uint32_t hash</text></g><g fill="#000000" font-family="Helvetica" clip-path="url(#mx-clip-1317-607-212-26-0)" font-size="12px"><text x="1318.5" y="619.5">char *key_fullid</text></g><g fill="#000000" font-family="Helvetica" clip-path="url(#mx-clip-1317-633-212-26-0)" font-size="12px"><text x="1318.5" y="645.5">char *key_fullname</text></g><g fill="#000000" font-family="Helvetica" clip-path="url(#mx-clip-1317-659-212-26-0)" font-size="12px"><text x="1318.5" y="671.5">RRDVAR_TYPE type</text></g><g fill="#000000" font-family="Helvetica" clip-path="url(#mx-clip-1317-685-212-26-0)" font-size="12px"><text x="1318.5" y="697.5">void *value</text></g><g fill="#000000" font-family="Helvetica" clip-path="url(#mx-clip-1317-711-212-26-0)" font-size="12px"><text x="1318.5" y="723.5">RRDVAR_OPTIONS options</text></g><g fill="#000000" font-family="Helvetica" clip-path="url(#mx-clip-1317-737-212-26-0)" font-size="12px"><text x="1318.5" y="749.5">RRDVAR *var_local</text></g><g fill="#000000" font-family="Helvetica" clip-path="url(#mx-clip-1317-763-212-26-0)" font-size="12px"><text x="1318.5" y="775.5">RRDVAR *var_family</text></g><g fill="#000000" font-family="Helvetica" clip-path="url(#mx-clip-1317-789-212-26-0)" font-size="12px"><text x="1318.5" y="801.5">RRDVAR *var_host</text></g><g fill="#000000" font-family="Helvetica" clip-path="url(#mx-clip-1317-815-212-26-0)" font-size="12px"><text x="1318.5" y="827.5">RRDVAR *var_family_name</text></g><g fill="#000000" font-family="Helvetica" clip-path="url(#mx-clip-1317-841-212-26-0)" font-size="12px"><text x="1318.5" y="853.5">RRDVAR *var_host_name</text></g><g fill="#000000" font-family="Helvetica" clip-path="url(#mx-clip-1317-867-212-26-0)" font-size="12px"><text x="1318.5" y="879.5">struct rrdset *rrdset</text></g><path d="M 1533 901 L 1553 901 L 1553 504 L 1423 504 L 1423 517.63" fill="none" stroke="#000000" stroke-miterlimit="10" pointer-events="none"/><path d="M 1423 522.88 L 1419.5 515.88 L 1423 517.63 L 1426.5 515.88 Z" fill="#000000" stroke="#000000" stroke-miterlimit="10" pointer-events="none"/><g fill="#000000" font-family="Helvetica" clip-path="url(#mx-clip-1317-893-212-26-0)" font-size="12px"><text x="1318.5" y="905.5">struct rrdsetvar *next</text></g><path d="M 963 725 L 963 699 L 1243 699 L 1243 725" fill="none" stroke="#000000" stroke-miterlimit="10" pointer-events="none"/><path d="M 963 725 L 963 1375 L 1243 1375 L 1243 725" fill="#ffffff" stroke="#000000" stroke-miterlimit="10" pointer-events="none"/><path d="M 963 725 L 1243 725" fill="none" stroke="#000000" stroke-miterlimit="10" pointer-events="none"/><g fill="#000000" font-family="Helvetica" text-anchor="middle" font-size="12px"><text x="1102.5" y="716.5">RRDDIMVAR</text></g><g fill="#000000" font-family="Helvetica" clip-path="url(#mx-clip-967-730-272-26-0)" font-size="12px"><text x="968.5" y="742.5">char *prefix</text></g><g fill="#000000" font-family="Helvetica" clip-path="url(#mx-clip-967-756-272-26-0)" font-size="12px"><text x="968.5" y="768.5">char *suffix</text></g><g fill="#000000" font-family="Helvetica" clip-path="url(#mx-clip-967-782-272-26-0)" font-size="12px"><text x="968.5" y="794.5">char *key_id</text></g><g fill="#000000" font-family="Helvetica" clip-path="url(#mx-clip-967-808-272-26-0)" font-size="12px"><text x="968.5" y="820.5">char *key_name</text></g><g fill="#000000" font-family="Helvetica" clip-path="url(#mx-clip-967-834-272-26-0)" font-size="12px"><text x="968.5" y="846.5">char *key_contextid</text></g><g fill="#000000" font-family="Helvetica" clip-path="url(#mx-clip-967-860-272-26-0)" font-size="12px"><text x="968.5" y="872.5">char *key_contexname</text></g><g fill="#000000" font-family="Helvetica" clip-path="url(#mx-clip-967-886-272-26-0)" font-size="12px"><text x="968.5" y="898.5">char *key_fullidid</text></g><g fill="#000000" font-family="Helvetica" clip-path="url(#mx-clip-967-912-272-26-0)" font-size="12px"><text x="968.5" y="924.5">char *key_fullidname</text></g><g fill="#000000" font-family="Helvetica" clip-path="url(#mx-clip-967-938-272-26-0)" font-size="12px"><text x="968.5" y="950.5">char *key_fullnameid</text></g><g fill="#000000" font-family="Helvetica" clip-path="url(#mx-clip-967-964-272-26-0)" font-size="12px"><text x="968.5" y="976.5">char *key_fullnamename</text></g><g fill="#000000" font-family="Helvetica" clip-path="url(#mx-clip-967-990-272-26-0)" font-size="12px"><text x="968.5" y="1002.5">RRDVAR_TYPE type</text></g><g fill="#000000" font-family="Helvetica" clip-path="url(#mx-clip-967-1016-272-26-0)" font-size="12px"><text x="968.5" y="1028.5">void *value</text></g><g fill="#000000" font-family="Helvetica" clip-path="url(#mx-clip-967-1042-272-26-0)" font-size="12px"><text x="968.5" y="1054.5">RRDVAR_OPTIONS options</text></g><g fill="#000000" font-family="Helvetica" clip-path="url(#mx-clip-967-1068-272-26-0)" font-size="12px"><text x="968.5" y="1080.5">RRDVAR *var_local_id</text></g><g fill="#000000" font-family="Helvetica" clip-path="url(#mx-clip-967-1094-272-26-0)" font-size="12px"><text x="968.5" y="1106.5">RRDVAR *var_local_name</text></g><g fill="#000000" font-family="Helvetica" clip-path="url(#mx-clip-967-1120-272-26-0)" font-size="12px"><text x="968.5" y="1132.5">RRDVAR *var_family_id</text></g><g fill="#000000" font-family="Helvetica" clip-path="url(#mx-clip-967-1146-272-26-0)" font-size="12px"><text x="968.5" y="1158.5">RRDVAR *var_family_name</text></g><g fill="#000000" font-family="Helvetica" clip-path="url(#mx-clip-967-1172-272-26-0)" font-size="12px"><text x="968.5" y="1184.5">RRDVAR *var_family_contextid</text></g><g fill="#000000" font-family="Helvetica" clip-path="url(#mx-clip-967-1198-272-26-0)" font-size="12px"><text x="968.5" y="1210.5">RRDVAR *var_family_contextname</text></g><g fill="#000000" font-family="Helvetica" clip-path="url(#mx-clip-967-1224-272-26-0)" font-size="12px"><text x="968.5" y="1236.5">RRDVAR *var_host_chartidid</text></g><g fill="#000000" font-family="Helvetica" clip-path="url(#mx-clip-967-1250-272-26-0)" font-size="12px"><text x="968.5" y="1262.5">RRDVAR *var_host_chartidname</text></g><g fill="#000000" font-family="Helvetica" clip-path="url(#mx-clip-967-1276-272-26-0)" font-size="12px"><text x="968.5" y="1288.5">RRDVAR *var_host_chartnameid</text></g><g fill="#000000" font-family="Helvetica" clip-path="url(#mx-clip-967-1302-272-26-0)" font-size="12px"><text x="968.5" y="1314.5">RRDVAR *var_host_chartnamename</text></g><g fill="#000000" font-family="Helvetica" clip-path="url(#mx-clip-967-1328-272-26-0)" font-size="12px"><text x="968.5" y="1340.5">struct rrddim *rrddim</text></g><path d="M 1243 1362 L 1263 1362 L 1263 679 L 1103 679 L 1103 692.63" fill="none" stroke="#000000" stroke-miterlimit="10" pointer-events="none"/><path d="M 1103 697.88 L 1099.5 690.88 L 1103 692.63 L 1106.5 690.88 Z" fill="#000000" stroke="#000000" stroke-miterlimit="10" pointer-events="none"/><g fill="#000000" font-family="Helvetica" clip-path="url(#mx-clip-967-1354-272-26-0)" font-size="12px"><text x="968.5" y="1366.5">struct rrddimvar *next</text></g><path d="M 843 881 L 903 881 L 903 679 L 1103 679 L 1103 692.63" fill="none" stroke="#000000" stroke-miterlimit="10" pointer-events="none"/><path d="M 1103 697.88 L 1099.5 690.88 L 1103 692.63 L 1106.5 690.88 Z" fill="#000000" stroke="#000000" stroke-miterlimit="10" pointer-events="none"/><g transform="translate(874.5,694.5)"><switch><foreignObject style="overflow:visible;" pointer-events="all" width="57" height="11" requiredFeatures="http://www.w3.org/TR/SVG11/feature#Extensibility"><div xmlns="http://www.w3.org/1999/xhtml" style="display: inline-block; font-size: 11px; font-family: Helvetica; color: rgb(0, 0, 0); line-height: 1.2; vertical-align: top; white-space: nowrap; text-align: center;"><div xmlns="http://www.w3.org/1999/xhtml" style="display:inline-block;text-align:inherit;text-decoration:inherit;background-color:#ffffff;">linked list of</div></div></foreignObject><text x="29" y="11" fill="#000000" text-anchor="middle" font-size="11px" font-family="Helvetica">linked list of</text></switch></g><path d="M 843 829 L 843 739 L 860 739 C 860 735.1 866 735.1 866 739 L 866 739 L 893 739 L 893 631 C 896.9 631 896.9 625 893 625 L 893 625 L 893 605 C 896.9 605 896.9 599 893 599 L 893 599 L 893 89 L 636 89 C 636 85.1 630 85.1 630 89 L 630 89 L 488 89 L 488 89 L 488 107.63" fill="none" stroke="#000000" stroke-miterlimit="10" pointer-events="none"/><path d="M 488 112.88 L 484.5 105.88 L 488 107.63 L 491.5 105.88 Z" fill="#000000" stroke="#000000" stroke-miterlimit="10" pointer-events="none"/><path d="M 253 576 L 270 576 C 270 572.1 276 572.1 276 576 L 276 576 L 308 576 L 308 94 L 488 94 L 488 107.63" fill="none" stroke="#000000" stroke-miterlimit="10" pointer-events="none"/><path d="M 488 112.88 L 484.5 105.88 L 488 107.63 L 491.5 105.88 Z" fill="#000000" stroke="#000000" stroke-miterlimit="10" pointer-events="none"/><g transform="translate(283.5,256.5)"><switch><foreignObject style="overflow:visible;" pointer-events="all" width="48" height="11" requiredFeatures="http://www.w3.org/TR/SVG11/feature#Extensibility"><div xmlns="http://www.w3.org/1999/xhtml" style="display: inline-block; font-size: 11px; font-family: Helvetica; color: rgb(0, 0, 0); line-height: 1.2; vertical-align: top; white-space: nowrap; text-align: center;"><div xmlns="http://www.w3.org/1999/xhtml" style="display:inline-block;text-align:inherit;text-decoration:inherit;background-color:#ffffff;">avl tree of</div></div></foreignObject><text x="24" y="11" fill="#000000" text-anchor="middle" font-size="11px" font-family="Helvetica">avl tree of</text></switch></g><path d="M 613 465 L 708 465 L 708 599 C 711.9 599 711.9 605 708 605 L 708 605 L 708 625 C 711.9 625 711.9 631 708 631 L 708 631 L 708 679.63" fill="none" stroke="#000000" stroke-miterlimit="10" pointer-events="none"/><path d="M 708 684.88 L 704.5 677.88 L 708 679.63 L 711.5 677.88 Z" fill="#000000" stroke="#000000" stroke-miterlimit="10" pointer-events="none"/><g transform="translate(683.5,522.5)"><switch><foreignObject style="overflow:visible;" pointer-events="all" width="48" height="11" requiredFeatures="http://www.w3.org/TR/SVG11/feature#Extensibility"><div xmlns="http://www.w3.org/1999/xhtml" style="display: inline-block; font-size: 11px; font-family: Helvetica; color: rgb(0, 0, 0); line-height: 1.2; vertical-align: top; white-space: nowrap; text-align: center;"><div xmlns="http://www.w3.org/1999/xhtml" style="display:inline-block;text-align:inherit;text-decoration:inherit;background-color:#ffffff;">avl tree of</div></div></foreignObject><text x="24" y="11" fill="#000000" text-anchor="middle" font-size="11px" font-family="Helvetica">avl tree of</text></switch></g><path d="M 613 491 L 708 491 L 708 491 L 708 599 C 711.9 599 711.9 605 708 605 L 708 605 L 708 625 C 711.9 625 711.9 631 708 631 L 708 631 L 708 679.63" fill="none" stroke="#000000" stroke-miterlimit="10" pointer-events="none"/><path d="M 708 684.88 L 704.5 677.88 L 708 679.63 L 711.5 677.88 Z" fill="#000000" stroke="#000000" stroke-miterlimit="10" pointer-events="none"/><g transform="translate(679.5,535.5)"><switch><foreignObject style="overflow:visible;" pointer-events="all" width="57" height="11" requiredFeatures="http://www.w3.org/TR/SVG11/feature#Extensibility"><div xmlns="http://www.w3.org/1999/xhtml" style="display: inline-block; font-size: 11px; font-family: Helvetica; color: rgb(0, 0, 0); line-height: 1.2; vertical-align: top; white-space: nowrap; text-align: center;"><div xmlns="http://www.w3.org/1999/xhtml" style="display:inline-block;text-align:inherit;text-decoration:inherit;background-color:#ffffff;">linked list of</div></div></foreignObject><text x="29" y="11" fill="#000000" text-anchor="middle" font-size="11px" font-family="Helvetica">linked list of</text></switch></g><path d="M 613 387 L 890 387 C 890 383.1 896 383.1 896 387 L 896 387 L 1000 387 C 1000 383.1 1006 383.1 1006 387 L 1006 387 L 1423 387 L 1423 424 C 1426.9 424 1426.9 430 1423 430 L 1423 430 L 1423 517.63" fill="none" stroke="#000000" stroke-miterlimit="10" pointer-events="none"/><path d="M 1423 522.88 L 1419.5 515.88 L 1423 517.63 L 1426.5 515.88 Z" fill="#000000" stroke="#000000" stroke-miterlimit="10" pointer-events="none"/><g transform="translate(1058.5,381.5)"><switch><foreignObject style="overflow:visible;" pointer-events="all" width="57" height="11" requiredFeatures="http://www.w3.org/TR/SVG11/feature#Extensibility"><div xmlns="http://www.w3.org/1999/xhtml" style="display: inline-block; font-size: 11px; font-family: Helvetica; color: rgb(0, 0, 0); line-height: 1.2; vertical-align: top; white-space: nowrap; text-align: center;"><div xmlns="http://www.w3.org/1999/xhtml" style="display:inline-block;text-align:inherit;text-decoration:inherit;background-color:#ffffff;">linked list of</div></div></foreignObject><text x="29" y="11" fill="#000000" text-anchor="middle" font-size="11px" font-family="Helvetica">linked list of</text></switch></g><path d="M 613 361 L 890 361 C 890 357.1 896 357.1 896 361 L 896 361 L 1000 361 C 1000 357.1 1006 357.1 1006 361 L 1006 361 L 1698 361 L 1698 440.63" fill="none" stroke="#000000" stroke-miterlimit="10" pointer-events="none"/><path d="M 1698 445.88 L 1694.5 438.88 L 1698 440.63 L 1701.5 438.88 Z" fill="#000000" stroke="#000000" stroke-miterlimit="10" pointer-events="none"/><g transform="translate(1174.5,355.5)"><switch><foreignObject style="overflow:visible;" pointer-events="all" width="48" height="11" requiredFeatures="http://www.w3.org/TR/SVG11/feature#Extensibility"><div xmlns="http://www.w3.org/1999/xhtml" style="display: inline-block; font-size: 11px; font-family: Helvetica; color: rgb(0, 0, 0); line-height: 1.2; vertical-align: top; white-space: nowrap; text-align: center;"><div xmlns="http://www.w3.org/1999/xhtml" style="display:inline-block;text-align:inherit;text-decoration:inherit;background-color:#ffffff;">avl tree of</div></div></foreignObject><text x="24" y="11" fill="#000000" text-anchor="middle" font-size="11px" font-family="Helvetica">avl tree of</text></switch></g><path d="M 613 283 L 613 277 L 630 277 C 630 273.1 636 273.1 636 277 L 636 277 L 703 277 L 703 92 C 706.9 92 706.9 86 703 86 L 703 86 L 703 10 L 128 10 L 128 140.63" fill="none" stroke="#000000" stroke-miterlimit="10" pointer-events="none"/><path d="M 128 145.88 L 124.5 138.88 L 128 140.63 L 131.5 138.88 Z" fill="#000000" stroke="#000000" stroke-miterlimit="10" pointer-events="none"/><path d="M 613 257 L 630 257 C 630 253.1 636 253.1 636 257 L 636 257 L 700 257 C 700 253.1 706 253.1 706 257 L 706 257 L 890 257 C 890 253.1 896 253.1 896 257 L 896 257 L 1003 257 L 1003 257 L 1003 114 L 1333 114 L 1333 127.63" fill="none" stroke="#000000" stroke-miterlimit="10" pointer-events="none"/><path d="M 1333 132.88 L 1329.5 125.88 L 1333 127.63 L 1336.5 125.88 Z" fill="#000000" stroke="#000000" stroke-miterlimit="10" pointer-events="none"/><path d="M 63 810 L 63 784 L 283 784 L 283 810" fill="none" stroke="#000000" stroke-miterlimit="10" pointer-events="none"/><path d="M 63 810 L 63 966 L 283 966 L 283 810" fill="#ffffff" stroke="#000000" stroke-miterlimit="10" pointer-events="none"/><path d="M 63 810 L 283 810" fill="none" stroke="#000000" stroke-miterlimit="10" pointer-events="none"/><g fill="#000000" font-family="Helvetica" text-anchor="middle" font-size="12px"><text x="172.5" y="801.5">ALARM_LOG</text></g><g fill="#000000" font-family="Helvetica" clip-path="url(#mx-clip-67-815-212-26-0)" font-size="12px"><text x="68.5" y="827.5">uint32_t next_log_id</text></g><g fill="#000000" font-family="Helvetica" clip-path="url(#mx-clip-67-841-212-26-0)" font-size="12px"><text x="68.5" y="853.5">uint32_t next_alarm_id</text></g><g fill="#000000" font-family="Helvetica" clip-path="url(#mx-clip-67-867-212-26-0)" font-size="12px"><text x="68.5" y="879.5">unsigned int count</text></g><g fill="#000000" font-family="Helvetica" clip-path="url(#mx-clip-67-893-212-26-0)" font-size="12px"><text x="68.5" y="905.5">unsigned int max</text></g><g fill="#000000" font-family="Helvetica" clip-path="url(#mx-clip-67-919-212-26-0)" font-size="12px"><text x="68.5" y="931.5">ALARM_ENTRY *alarms</text></g><g fill="#000000" font-family="Helvetica" clip-path="url(#mx-clip-67-945-212-26-0)" font-size="12px"><text x="68.5" y="957.5">netdata_rwlock_t alarm_log_rwlock</text></g><path d="M 283 927 L 413 927 L 413 1030.63" fill="none" stroke="#000000" stroke-miterlimit="10" pointer-events="none"/><path d="M 413 1035.88 L 409.5 1028.88 L 413 1030.63 L 416.5 1028.88 Z" fill="#000000" stroke="#000000" stroke-miterlimit="10" pointer-events="none"/><g transform="translate(374.5,921.5)"><switch><foreignObject style="overflow:visible;" pointer-events="all" width="57" height="11" requiredFeatures="http://www.w3.org/TR/SVG11/feature#Extensibility"><div xmlns="http://www.w3.org/1999/xhtml" style="display: inline-block; font-size: 11px; font-family: Helvetica; color: rgb(0, 0, 0); line-height: 1.2; vertical-align: top; white-space: nowrap; text-align: center;"><div xmlns="http://www.w3.org/1999/xhtml" style="display:inline-block;text-align:inherit;text-decoration:inherit;background-color:#ffffff;">linked list of</div></div></foreignObject><text x="29" y="11" fill="#000000" text-anchor="middle" font-size="11px" font-family="Helvetica">linked list of</text></switch></g><path d="M 343 1063 L 343 1037 L 483 1037 L 483 1063" fill="none" stroke="#000000" stroke-miterlimit="10" pointer-events="none"/><path d="M 343 1063 L 343 1115 L 483 1115 L 483 1063" fill="#ffffff" stroke="#000000" stroke-miterlimit="10" pointer-events="none"/><path d="M 343 1063 L 483 1063" fill="none" stroke="#000000" stroke-miterlimit="10" pointer-events="none"/><g fill="#000000" font-family="Helvetica" text-anchor="middle" font-size="12px"><text x="412.5" y="1054.5">ALARM_ENTRY *</text></g><path d="M 483 1102 L 503 1102 L 503 1017 L 413 1017 L 413 1030.63" fill="none" stroke="#000000" stroke-miterlimit="10" pointer-events="none"/><path d="M 413 1035.88 L 409.5 1028.88 L 413 1030.63 L 416.5 1028.88 Z" fill="#000000" stroke="#000000" stroke-miterlimit="10" pointer-events="none"/><g fill="#000000" font-family="Helvetica" clip-path="url(#mx-clip-347-1068-132-26-0)" font-size="12px"><text x="348.5" y="1080.5">...</text></g><g fill="#000000" font-family="Helvetica" clip-path="url(#mx-clip-347-1094-132-26-0)" font-size="12px"><text x="348.5" y="1106.5">struct alarm_entry *next</text></g><path d="M 253 342 L 270 342 C 270 338.1 276 338.1 276 342 L 276 342 L 305 342 C 305 338.1 311 338.1 311 342 L 311 342 L 333 342 L 333 599 C 336.9 599 336.9 605 333 605 L 333 605 L 333 625 C 336.9 625 336.9 631 333 631 L 333 631 L 333 710 L 173 710 L 173 777.63" fill="none" stroke="#000000" stroke-miterlimit="10" pointer-events="none"/><path d="M 173 782.88 L 169.5 775.88 L 173 777.63 L 176.5 775.88 Z" fill="#000000" stroke="#000000" stroke-miterlimit="10" pointer-events="none"/><path d="M 33 1086 L 33 1060 L 253 1060 L 253 1086" fill="none" stroke="#000000" stroke-miterlimit="10" pointer-events="none"/><path d="M 33 1086 L 33 1424 L 253 1424 L 253 1086" fill="#ffffff" stroke="#000000" stroke-miterlimit="10" pointer-events="none"/><path d="M 33 1086 L 253 1086" fill="none" stroke="#000000" stroke-miterlimit="10" pointer-events="none"/><g fill="#000000" font-family="Helvetica" text-anchor="middle" font-size="12px"><text x="142.5" y="1077.5">RRDCALC</text></g><path d="M 33 1112 L 33 1086 L 253 1086 L 253 1112" fill="none" stroke="#000000" stroke-miterlimit="10" pointer-events="none"/><path d="M 33 1112 L 253 1112" fill="none" stroke="#000000" stroke-miterlimit="10" pointer-events="none"/><g fill="#000000" font-family="Helvetica" text-anchor="middle" font-size="12px"><text x="142.5" y="1102.5">...</text></g><g fill="#000000" font-family="Helvetica" clip-path="url(#mx-clip-37-1117-212-26-0)" font-size="12px"><text x="38.5" y="1129.5">EVAL_EXPRESSION *calculation</text></g><g fill="#000000" font-family="Helvetica" clip-path="url(#mx-clip-37-1143-212-26-0)" font-size="12px"><text x="38.5" y="1155.5">EVAL_EXPRESSION *warning</text></g><g fill="#000000" font-family="Helvetica" clip-path="url(#mx-clip-37-1169-212-26-0)" font-size="12px"><text x="38.5" y="1181.5">EVAL_EXPRESSION *critical</text></g><path d="M 33 1216 L 33 1190 L 253 1190 L 253 1216" fill="none" stroke="#000000" stroke-miterlimit="10" pointer-events="none"/><path d="M 33 1216 L 253 1216" fill="none" stroke="#000000" stroke-miterlimit="10" pointer-events="none"/><g fill="#000000" font-family="Helvetica" text-anchor="middle" font-size="12px"><text x="142.5" y="1206.5">...</text></g><g fill="#000000" font-family="Helvetica" clip-path="url(#mx-clip-37-1221-212-26-0)" font-size="12px"><text x="38.5" y="1233.5">RRDVAR *local</text></g><g fill="#000000" font-family="Helvetica" clip-path="url(#mx-clip-37-1247-212-26-0)" font-size="12px"><text x="38.5" y="1259.5">RRDVAR *family</text></g><g fill="#000000" font-family="Helvetica" clip-path="url(#mx-clip-37-1273-212-26-0)" font-size="12px"><text x="38.5" y="1285.5">RRDVAR *hostid</text></g><g fill="#000000" font-family="Helvetica" clip-path="url(#mx-clip-37-1299-212-26-0)" font-size="12px"><text x="38.5" y="1311.5">RRDVAR *hostname</text></g><g fill="#000000" font-family="Helvetica" clip-path="url(#mx-clip-37-1325-212-26-0)" font-size="12px"><text x="38.5" y="1337.5">struct rrdset *rrdset</text></g><g fill="#000000" font-family="Helvetica" clip-path="url(#mx-clip-37-1351-212-26-0)" font-size="12px"><text x="38.5" y="1363.5">struct rrdcalc *rrdset_next</text></g><g fill="#000000" font-family="Helvetica" clip-path="url(#mx-clip-37-1377-212-26-0)" font-size="12px"><text x="38.5" y="1389.5">struct rrdcalc *rrdset_prev</text></g><g fill="#000000" font-family="Helvetica" clip-path="url(#mx-clip-37-1403-212-26-0)" font-size="12px"><text x="38.5" y="1415.5">struct rrdcalc *next</text></g><path d="M 253 1359 L 273 1359 L 273 1040 L 143 1040 L 143 1053.63" fill="none" stroke="#000000" stroke-miterlimit="10" pointer-events="none"/><path d="M 143 1058.88 L 139.5 1051.88 L 143 1053.63 L 146.5 1051.88 Z" fill="#000000" stroke="#000000" stroke-miterlimit="10" pointer-events="none"/><path d="M 253 1385 L 273 1385 L 273 1040 L 143 1040 L 143 1053.63" fill="none" stroke="#000000" stroke-miterlimit="10" pointer-events="none"/><path d="M 143 1058.88 L 139.5 1051.88 L 143 1053.63 L 146.5 1051.88 Z" fill="#000000" stroke="#000000" stroke-miterlimit="10" pointer-events="none"/><path d="M 253 1411 L 273 1411 L 273 1040 L 143 1040 L 143 1053.63" fill="none" stroke="#000000" stroke-miterlimit="10" pointer-events="none"/><path d="M 143 1058.88 L 139.5 1051.88 L 143 1053.63 L 146.5 1051.88 Z" fill="#000000" stroke="#000000" stroke-miterlimit="10" pointer-events="none"/><path d="M 583 1060 L 583 1034 L 833 1034 L 833 1060" fill="none" stroke="#000000" stroke-miterlimit="10" pointer-events="none"/><path d="M 583 1060 L 583 1190 L 833 1190 L 833 1060" fill="#ffffff" stroke="#000000" stroke-miterlimit="10" pointer-events="none"/><path d="M 583 1060 L 833 1060" fill="none" stroke="#000000" stroke-miterlimit="10" pointer-events="none"/><g fill="#000000" font-family="Helvetica" text-anchor="middle" font-size="12px"><text x="707.5" y="1051.5">RRDCALCTEMPLATE *</text></g><g fill="#000000" font-family="Helvetica" clip-path="url(#mx-clip-587-1065-242-26-0)" font-size="12px"><text x="588.5" y="1077.5">...</text></g><g fill="#000000" font-family="Helvetica" clip-path="url(#mx-clip-587-1091-242-26-0)" font-size="12px"><text x="588.5" y="1103.5">EVAL_EXPRESSION *calculation</text></g><g fill="#000000" font-family="Helvetica" clip-path="url(#mx-clip-587-1117-242-26-0)" font-size="12px"><text x="588.5" y="1129.5">EVAL_EXPRESSION *warning</text></g><g fill="#000000" font-family="Helvetica" clip-path="url(#mx-clip-587-1143-242-26-0)" font-size="12px"><text x="588.5" y="1155.5">EVAL_EXPRESSION *critical</text></g><path d="M 833 1177 L 853 1177 L 853 1014 L 708 1014 L 708 1027.63" fill="none" stroke="#000000" stroke-miterlimit="10" pointer-events="none"/><path d="M 708 1032.88 L 704.5 1025.88 L 708 1027.63 L 711.5 1025.88 Z" fill="#000000" stroke="#000000" stroke-miterlimit="10" pointer-events="none"/><g fill="#000000" font-family="Helvetica" clip-path="url(#mx-clip-587-1169-242-26-0)" font-size="12px"><text x="588.5" y="1181.5">struct rrdcalctemplate *next</text></g><path d="M 253 290 L 270 290 C 270 286.1 276 286.1 276 290 L 276 290 L 293 290 L 293 339 C 296.9 339 296.9 345 293 345 L 293 345 L 293 547 C 296.9 547 296.9 553 293 553 L 293 553 L 293 573 C 296.9 573 296.9 579 293 579 L 293 579 L 293 599 C 296.9 599 296.9 605 293 605 L 293 605 L 293 625 C 296.9 625 296.9 631 293 631 L 293 631 L 293 682 L 143 682 L 143 1053.63" fill="none" stroke="#000000" stroke-miterlimit="10" pointer-events="none"/><path d="M 143 1058.88 L 139.5 1051.88 L 143 1053.63 L 146.5 1051.88 Z" fill="#000000" stroke="#000000" stroke-miterlimit="10" pointer-events="none"/><g transform="translate(216.5,676.5)"><switch><foreignObject style="overflow:visible;" pointer-events="all" width="57" height="11" requiredFeatures="http://www.w3.org/TR/SVG11/feature#Extensibility"><div xmlns="http://www.w3.org/1999/xhtml" style="display: inline-block; font-size: 11px; font-family: Helvetica; color: rgb(0, 0, 0); line-height: 1.2; vertical-align: top; white-space: nowrap; text-align: center;"><div xmlns="http://www.w3.org/1999/xhtml" style="display:inline-block;text-align:inherit;text-decoration:inherit;background-color:#ffffff;">linked list of</div></div></foreignObject><text x="29" y="11" fill="#000000" text-anchor="middle" font-size="11px" font-family="Helvetica">linked list of</text></switch></g><path d="M 253 1333 L 270 1333 C 270 1329.1 276 1329.1 276 1333 L 276 1333 L 323 1333 L 323 930 C 326.9 930 326.9 924 323 924 L 323 924 L 323 713 C 326.9 713 326.9 707 323 707 L 323 707 L 323 631 C 326.9 631 326.9 625 323 625 L 323 625 L 323 605 C 326.9 605 326.9 599 323 599 L 323 599 L 323 345 C 326.9 345 326.9 339 323 339 L 323 339 L 323 97 C 326.9 97 326.9 91 323 91 L 323 91 L 323 60 L 488 60 L 488 107.63" fill="none" stroke="#000000" stroke-miterlimit="10" pointer-events="none"/><path d="M 488 112.88 L 484.5 105.88 L 488 107.63 L 491.5 105.88 Z" fill="#000000" stroke="#000000" stroke-miterlimit="10" pointer-events="none"/><path d="M 613 413 L 613 407 L 633 407 L 633 462 C 636.9 462 636.9 468 633 468 L 633 468 L 633 488 C 636.9 488 636.9 494 633 494 L 633 494 L 633 599 C 636.9 599 636.9 605 633 605 L 633 605 L 633 625 C 636.9 625 636.9 631 633 631 L 633 631 L 633 670 L 336 670 C 336 666.1 330 666.1 330 670 L 330 670 L 326 670 C 326 666.1 320 666.1 320 670 L 320 670 L 296 670 C 296 666.1 290 666.1 290 670 L 290 670 L 173 670 L 173 679 C 176.9 679 176.9 685 173 685 L 173 685 L 173 777.63" fill="none" stroke="#000000" stroke-miterlimit="10" pointer-events="none"/><path d="M 173 782.88 L 169.5 775.88 L 173 777.63 L 176.5 775.88 Z" fill="#000000" stroke="#000000" stroke-miterlimit="10" pointer-events="none"/><g transform="translate(442.5,664.5)"><switch><foreignObject style="overflow:visible;" pointer-events="all" width="94" height="11" requiredFeatures="http://www.w3.org/TR/SVG11/feature#Extensibility"><div xmlns="http://www.w3.org/1999/xhtml" style="display: inline-block; font-size: 11px; font-family: Helvetica; color: rgb(0, 0, 0); line-height: 1.2; vertical-align: top; white-space: nowrap; text-align: center;"><div xmlns="http://www.w3.org/1999/xhtml" style="display:inline-block;text-align:inherit;text-decoration:inherit;background-color:#ffffff;">double linked list of</div></div></foreignObject><text x="47" y="11" fill="#000000" text-anchor="middle" font-size="11px" font-family="Helvetica">double linked list of</text></switch></g><path d="M 253 472 L 343 472 L 343 30 L 488 30 L 488 107.63" fill="none" stroke="#000000" stroke-miterlimit="10" pointer-events="none"/><path d="M 488 112.88 L 484.5 105.88 L 488 107.63 L 491.5 105.88 Z" fill="#000000" stroke="#000000" stroke-miterlimit="10" pointer-events="none"/><g transform="translate(314.5,175.5)"><switch><foreignObject style="overflow:visible;" pointer-events="all" width="57" height="11" requiredFeatures="http://www.w3.org/TR/SVG11/feature#Extensibility"><div xmlns="http://www.w3.org/1999/xhtml" style="display: inline-block; font-size: 11px; font-family: Helvetica; color: rgb(0, 0, 0); line-height: 1.2; vertical-align: top; white-space: nowrap; text-align: center;"><div xmlns="http://www.w3.org/1999/xhtml" style="display:inline-block;text-align:inherit;text-decoration:inherit;background-color:#ffffff;">linked list of</div></div></foreignObject><text x="29" y="11" fill="#000000" text-anchor="middle" font-size="11px" font-family="Helvetica">linked list of</text></switch></g><path d="M 253 446 L 353 446 L 353 800 L 523 800 L 523 970 L 708 970 L 708 1027.63" fill="none" stroke="#000000" stroke-miterlimit="10" pointer-events="none"/><path d="M 708 1032.88 L 704.5 1025.88 L 708 1027.63 L 711.5 1025.88 Z" fill="#000000" stroke="#000000" stroke-miterlimit="10" pointer-events="none"/><g transform="translate(392.5,794.5)"><switch><foreignObject style="overflow:visible;" pointer-events="all" width="57" height="11" requiredFeatures="http://www.w3.org/TR/SVG11/feature#Extensibility"><div xmlns="http://www.w3.org/1999/xhtml" style="display: inline-block; font-size: 11px; font-family: Helvetica; color: rgb(0, 0, 0); line-height: 1.2; vertical-align: top; white-space: nowrap; text-align: center;"><div xmlns="http://www.w3.org/1999/xhtml" style="display:inline-block;text-align:inherit;text-decoration:inherit;background-color:#ffffff;">linked list of</div></div></foreignObject><text x="29" y="11" fill="#000000" text-anchor="middle" font-size="11px" font-family="Helvetica">linked list of</text></switch></g><path d="M 373 1275 L 373 1249 L 543 1249 L 543 1275" fill="none" stroke="#000000" stroke-miterlimit="10" pointer-events="none"/><path d="M 373 1275 L 373 1561 L 543 1561 L 543 1275" fill="#ffffff" stroke="#000000" stroke-miterlimit="10" pointer-events="none"/><path d="M 373 1275 L 543 1275" fill="none" stroke="#000000" stroke-miterlimit="10" pointer-events="none"/><g fill="#000000" font-family="Helvetica" text-anchor="middle" font-size="12px"><text x="457.5" y="1266.5">EVAL_EXPRESSION</text></g><g fill="#000000" font-family="Helvetica" clip-path="url(#mx-clip-377-1280-162-26-0)" font-size="12px"><text x="378.5" y="1292.5">const char *source</text></g><g fill="#000000" font-family="Helvetica" clip-path="url(#mx-clip-377-1306-162-26-0)" font-size="12px"><text x="378.5" y="1318.5">const char *parsed_as</text></g><g fill="#000000" font-family="Helvetica" clip-path="url(#mx-clip-377-1332-162-26-0)" font-size="12px"><text x="378.5" y="1344.5">RRDCALC_STATUS *status</text></g><g fill="#000000" font-family="Helvetica" clip-path="url(#mx-clip-377-1358-162-26-0)" font-size="12px"><text x="378.5" y="1370.5">calculated_number *this</text></g><g fill="#000000" font-family="Helvetica" clip-path="url(#mx-clip-377-1384-162-26-0)" font-size="12px"><text x="378.5" y="1396.5">time_t *after</text></g><g fill="#000000" font-family="Helvetica" clip-path="url(#mx-clip-377-1410-162-26-0)" font-size="12px"><text x="378.5" y="1422.5">time_t *before</text></g><g fill="#000000" font-family="Helvetica" clip-path="url(#mx-clip-377-1436-162-26-0)" font-size="12px"><text x="378.5" y="1448.5">calculated_number result</text></g><g fill="#000000" font-family="Helvetica" clip-path="url(#mx-clip-377-1462-162-26-0)" font-size="12px"><text x="378.5" y="1474.5">int error</text></g><g fill="#000000" font-family="Helvetica" clip-path="url(#mx-clip-377-1488-162-26-0)" font-size="12px"><text x="378.5" y="1500.5">BUFFER *error_msg</text></g><g fill="#000000" font-family="Helvetica" clip-path="url(#mx-clip-377-1514-162-26-0)" font-size="12px"><text x="378.5" y="1526.5">void *nodes</text></g><g fill="#000000" font-family="Helvetica" clip-path="url(#mx-clip-377-1540-162-26-0)" font-size="12px"><text x="378.5" y="1552.5">struct rrdcalc_rrdcalc</text></g><path d="M 603 1275 L 603 1249 L 743 1249 L 743 1275" fill="none" stroke="#000000" stroke-miterlimit="10" pointer-events="none"/><path d="M 603 1275 L 603 1405 L 743 1405 L 743 1275" fill="#ffffff" stroke="#000000" stroke-miterlimit="10" pointer-events="none"/><path d="M 603 1275 L 743 1275" fill="none" stroke="#000000" stroke-miterlimit="10" pointer-events="none"/><g fill="#000000" font-family="Helvetica" text-anchor="middle" font-size="12px"><text x="672.5" y="1266.5">EVAL_NODE</text></g><g fill="#000000" font-family="Helvetica" clip-path="url(#mx-clip-607-1280-132-26-0)" font-size="12px"><text x="608.5" y="1292.5">int id</text></g><g fill="#000000" font-family="Helvetica" clip-path="url(#mx-clip-607-1306-132-26-0)" font-size="12px"><text x="608.5" y="1318.5">unsigned char operator</text></g><g fill="#000000" font-family="Helvetica" clip-path="url(#mx-clip-607-1332-132-26-0)" font-size="12px"><text x="608.5" y="1344.5">in precedence</text></g><g fill="#000000" font-family="Helvetica" clip-path="url(#mx-clip-607-1358-132-26-0)" font-size="12px"><text x="608.5" y="1370.5">int count</text></g><g fill="#000000" font-family="Helvetica" clip-path="url(#mx-clip-607-1384-132-26-0)" font-size="12px"><text x="608.5" y="1396.5">EVAL_VALUE ops[]</text></g><path d="M 673 1457 L 673 1431 L 853 1431 L 853 1457" fill="none" stroke="#000000" stroke-miterlimit="10" pointer-events="none"/><path d="M 673 1457 L 673 1535 L 853 1535 L 853 1457" fill="#ffffff" stroke="#000000" stroke-miterlimit="10" pointer-events="none"/><path d="M 673 1457 L 853 1457" fill="none" stroke="#000000" stroke-miterlimit="10" pointer-events="none"/><g fill="#000000" font-family="Helvetica" text-anchor="middle" font-size="12px"><text x="762.5" y="1448.5">EVAL_VALUE</text></g><g fill="#000000" font-family="Helvetica" clip-path="url(#mx-clip-677-1462-172-26-0)" font-size="12px"><text x="678.5" y="1474.5">calculated_number number</text></g><g fill="#000000" font-family="Helvetica" clip-path="url(#mx-clip-677-1488-172-26-0)" font-size="12px"><text x="678.5" y="1500.5">EVAL_VARIABLE *variable</text></g><g fill="#000000" font-family="Helvetica" clip-path="url(#mx-clip-677-1514-172-26-0)" font-size="12px"><text x="678.5" y="1526.5">struct eval_node *expression</text></g><path d="M 873 1561 L 873 1535 L 1023 1535 L 1023 1561" fill="none" stroke="#000000" stroke-miterlimit="10" pointer-events="none"/><path d="M 873 1561 L 873 1639 L 1023 1639 L 1023 1561" fill="#ffffff" stroke="#000000" stroke-miterlimit="10" pointer-events="none"/><path d="M 873 1561 L 1023 1561" fill="none" stroke="#000000" stroke-miterlimit="10" pointer-events="none"/><g fill="#000000" font-family="Helvetica" text-anchor="middle" font-size="12px"><text x="947.5" y="1552.5">EVAL_VARIABLE</text></g><g fill="#000000" font-family="Helvetica" clip-path="url(#mx-clip-877-1566-142-26-0)" font-size="12px"><text x="878.5" y="1578.5">char *name</text></g><g fill="#000000" font-family="Helvetica" clip-path="url(#mx-clip-877-1592-142-26-0)" font-size="12px"><text x="878.5" y="1604.5">uint32_t hash</text></g><path d="M 1023 1626 L 1043 1626 L 1043 1515 L 948 1515 L 948 1528.63" fill="none" stroke="#000000" stroke-miterlimit="10" pointer-events="none"/><path d="M 948 1533.88 L 944.5 1526.88 L 948 1528.63 L 951.5 1526.88 Z" fill="#000000" stroke="#000000" stroke-miterlimit="10" pointer-events="none"/><g fill="#000000" font-family="Helvetica" clip-path="url(#mx-clip-877-1618-142-26-0)" font-size="12px"><text x="878.5" y="1630.5">struct eval_variable *next</text></g><path d="M 743 1392 L 763 1392 L 763 1424.63" fill="none" stroke="#000000" stroke-miterlimit="10" pointer-events="none"/><path d="M 763 1429.88 L 759.5 1422.88 L 763 1424.63 L 766.5 1422.88 Z" fill="#000000" stroke="#000000" stroke-miterlimit="10" pointer-events="none"/><path d="M 853 1522 L 873 1522 L 873 1229 L 673 1229 L 673 1242.63" fill="none" stroke="#000000" stroke-miterlimit="10" pointer-events="none"/><path d="M 673 1247.88 L 669.5 1240.88 L 673 1242.63 L 676.5 1240.88 Z" fill="#000000" stroke="#000000" stroke-miterlimit="10" pointer-events="none"/><path d="M 543 1522 L 573 1522 L 573 1229 L 673 1229 L 673 1242.63" fill="none" stroke="#000000" stroke-miterlimit="10" pointer-events="none"/><path d="M 673 1247.88 L 669.5 1240.88 L 673 1242.63 L 676.5 1240.88 Z" fill="#000000" stroke="#000000" stroke-miterlimit="10" pointer-events="none"/><path d="M 853 1496 L 948 1496 L 948 1528.63" fill="none" stroke="#000000" stroke-miterlimit="10" pointer-events="none"/><path d="M 948 1533.88 L 944.5 1526.88 L 948 1528.63 L 951.5 1526.88 Z" fill="#000000" stroke="#000000" stroke-miterlimit="10" pointer-events="none"/><path d="M 1423 277 L 1698 277 L 1698 440.63" fill="none" stroke="#000000" stroke-miterlimit="10" pointer-events="none"/><path d="M 1698 445.88 L 1694.5 438.88 L 1698 440.63 L 1701.5 438.88 Z" fill="#000000" stroke="#000000" stroke-miterlimit="10" pointer-events="none"/><g transform="translate(1621.5,271.5)"><switch><foreignObject style="overflow:visible;" pointer-events="all" width="48" height="11" requiredFeatures="http://www.w3.org/TR/SVG11/feature#Extensibility"><div xmlns="http://www.w3.org/1999/xhtml" style="display: inline-block; font-size: 11px; font-family: Helvetica; color: rgb(0, 0, 0); line-height: 1.2; vertical-align: top; white-space: nowrap; text-align: center;"><div xmlns="http://www.w3.org/1999/xhtml" style="display:inline-block;text-align:inherit;text-decoration:inherit;background-color:#ffffff;">avl tree of</div></div></foreignObject><text x="24" y="11" fill="#000000" text-anchor="middle" font-size="11px" font-family="Helvetica">avl tree of</text></switch></g></svg>
\ No newline at end of file diff --git a/diagrams/data_structures/src/netdata_config.xml b/diagrams/data_structures/src/netdata_config.xml new file mode 100755 index 000000000..dbc3e4846 --- /dev/null +++ b/diagrams/data_structures/src/netdata_config.xml @@ -0,0 +1 @@ +<mxfile userAgent="Mozilla/5.0 (Windows NT 10.0; Win64; x64) AppleWebKit/537.36 (KHTML, like Gecko) Chrome/69.0.3497.100 Safari/537.36" version="9.2.3" editor="www.draw.io" type="device"><diagram id="84bb3b1a-4913-5d87-532d-429ace37c991" name="Page-1">7VxZb9s4EP41BtoAu7BOO4+1k3YfXKBoHrZ9MmiLlrihRYOik7i/focSJUsifWx0tN0oMBJxNLzmmxkOh3RGznz78omjXfSZBZiO7HHwMnLuRrZt+Y4LfyTlkFGmjpcRQk4CxXQkPJAfWBHHironAU4qjIIxKsiuSlyzOMZrUaEhztlzlW3DaLXXHQqxRnhYI6pT/yaBiBTV8m+PL/7CJIxU11N7kr1YofVjyNk+Vv2NbGeT/mSvtyhvS000iVDAnksk537kzDljInvavswxlbLNxZbV+3jibTFujmNxTQU7q/CE6F5NPRF8DxJNZbshoRqmOOSiSZ7JlqIYSrMNi8WDejOG8joiNFigA9vLvhMBsshLs4hx8gP4EYVXFhDgNRcKeduXrRFK54wyDoSYpR0cKz3IxlQ3HCdQ7Us+R6tG+oxeKowLlIh8gIxStEvIKh2yrLhFPCTxjAnBtoopn+DH0niOMB7fL0ict6JLXQHxhLnALyWSQuETZlss+AFY1FtHKYQymFw/nkva5ypaVFI8a6wsDSmND4uWi86+goWgOIQ5F73Zl3ubGnoDnCqdISowj5HAM6nxSVnT4KE0zSMp1T+zLjqndTGBKRAWw9ONekw0xQRBi1SvOHvENUUy6BaiJIyhSPFGVpNIEXAAHxRZsJ1sbIfWJA4XKc+de6R8VUKRJAZ1NzS14ogEAY6l6jGBBFoVprFjJBap1LwZfEC28/Gf3siDgc+hbB3L8JHsXMxhkoIjkqoUBiV+xlKRDcpmX61shyqOl7SrjndZuSpAn0HV01CNsQhAOMvtHoa7lPCmTwOgrwfUs/sD1NUARU90KTjGS8rASQNnHAxwNoFzMu0PznMhQOF2hxigGgNEYksVawtrv3VbXY4LrEv4F6FxBf/xtAUF0NddMGjZqPw9GHEu6zZWWTOKbVix7pX3MCnHTtfXCCXRAGUDKA3ra3dQ6hHTOkJcxr4x2uIBxwY4GhbWznD0phpUOAhxvljCTCMWshjR+yN1lqYOcKCkp5YZuUjhFyK+lZ6/SxaQHJRiGNi3avG7auAfLMRBLbBoL5hEreh3wSTWJzawuWwTtudrXJUKrNohrvHJqZ1FgGOKBHmqJlhO7lo/cI4OJQalR8eWv0hCaUNb2z9b1qSM1UX+P+p5khq/NfbO8cNDNuLX7n1z0V7Y/MbS1gcH8HoHUORLevHkk9OgZtm1Jdvl0KZMQ1ajEbjOtXFzG+BOTWFzZR+cQboctsONgfX6DKVvNWCHjFUHmE57jKlzx2DyxDWrHVIdXaY6PLcad3n6cmzMdE1aSHQ4lqYEOfYlNRiMukC3sJpf8mDB0ROXg59uH9I+jxYcPYuluenBQ3frof3a2bDlT3QFmHTlovXcV5aLvkmvRAx2XNixezWuZ1yzCcZW7FjPZmTZlHc3a7aFebx/98SAGXBFUhrAqYqr9wPIDUA2OeuuQHZ1Z01J/IgljpQkEm620dBskAK9Npl5LiF60kGW85zqQKyHNKeWZ/T9qvfNV9q8hWxMqlINq/+WcXT93xMbSwcnt5OuwbHGNXRuJ52hcyZ1aDqXHYKgVoOgSQ1o2zMEQV3tUz2vTcvs++Ao19yy0bpT3Whzvp98cGTVkHZuy1BdZL90bjQ5y9742MjVk9BVNwEBFuyb5LoM0YidxiVDeFXTwF8zveHqaegEZJyGV+o+gIR2hcArroesVRNY+0xx5H215Nw7ceGmsMvrw4NfK0T/TDq/crCqn6e++UDp5NcXNHsxKMXJgMn1asuoWkcrNuUZbKo4BvoffIHBNx4wnIjY35aDvqBc/tisXWfWXZMyteGgff1YQd6knKbHCRuKwrd+R6MZlKa1tjMo9ZvNw6XY9qA0fUuhMyj1ZONwKbYlHE134roD8vTt5ow0INkAScMFuO6Q/O3uN9c2KibRVnc9vuHC8ykI2t/knLkSfFPZ5SyHa8FNDcdwwbA7w9Fz+9k2Qd1EavfU7KcbliGb4OpmZdt9mZWeV3tj0rcN2fjevNpET910e2rcLQIUrTD9whKSXuN37tbQCuYl/7moMWzBI9Kyv9Vq5B634HwlypP+UIbi8V+WZImT4/+Fce7/BQ==</diagram></mxfile>
\ No newline at end of file diff --git a/diagrams/data_structures/src/registry.xml b/diagrams/data_structures/src/registry.xml new file mode 100755 index 000000000..5274ba83c --- /dev/null +++ b/diagrams/data_structures/src/registry.xml @@ -0,0 +1 @@ +<mxfile userAgent="Mozilla/5.0 (Windows NT 10.0; Win64; x64) AppleWebKit/537.36 (KHTML, like Gecko) draw.io/8.8.0 Chrome/61.0.3163.100 Electron/2.0.2 Safari/537.36" version="9.3.4" editor="www.draw.io" type="device"><diagram id="84bb3b1a-4913-5d87-532d-429ace37c991" name="Page-1">7Z1bb9u4EoB/TYDdAGehu63HJE27AdLuIt2es30yGJmx1UiiIdG57K9fUiJ1MWlXtmTG7ZmiaC2asiR+w+HMkByduVfpy4ccrZYfyRwnZ441fzlz3505jh0EAfuPl7xWJaHvVQWLPJ6LSk3B5/gfLAotUbqO57joVKSEJDRedQsjkmU4op0ylOfkuVvtgSTdq67QAisFnyOUqKX/i+d0WZVOnUlT/juOF0t5ZTsIq2/uUfS4yMk6E9c7c9yH8k/1dYrkb4kHLZZoTp5bRe71mXuVE0KrT+nLFU5428pmq857v+Xb+r5znNFeJ/jT6pQnlKzFw8/jiMYkQ/krKyfizgv6KhsHz1lbiUOS0yVZsMrJdVN6WTYA5pew2NGSpgn7aLOP+CWmf7c+f+VVfvP5UUbz17+7h1/FD3zDlL4KIUFrSlhRc91bQlbiF7+t05W8sYxk/E4iksaR+Bm1bURzFWSdR+LhAl+IG8oXWFaz3KqQP3nrTNGkHzBJMS1bK8cJovFTV4qQEMZFXU+cepHn6LVVYUXijBatX/6TF7AKol85oZCaVymPbhfud+q7zs7qvu3vqM4+VPcrj1oP3hSV4rVF1AJHETX0xGvQHONxRK2Nuy0NKI82BHGHuNV9ch/Z2y7Z/cRuohE7xzuK2CngXWtDTjyr+xPVnYqzOiKxrxCoIlDQfB3R8iEWcSHusyMExXOcJqjszg8ko5JpyXsZJ/Nb9ErWvM0KyrSvPLpckjz+h9VHkjn7OqcCpRPwX4uT5IokJG/0RXPSZ/5j4jI5Lthpf0qE9kbRR/TSqXiLCloLZJKgVRHfl7fMT0wZ4Ti7JJSSVAqceMD3rftpBo7m+9s4k7+yVaiecE7xy05pEd96XehO+Jvo/s/NiFcPyMvWaBfa1ncl7I6NyihbJHi/69lTzfWcoHs5lFCcZ4jiS973i4ES6SoSWfUNnCEGba5II2tdWgpTTh7xhvRoBAol8SJjhwl+4KdxPDGzMy5EMeUK5LJYoSjOFrdlnXdeU3InWoEXEXbuQ1IqpmU8n+Os1H4UUXRf9wcxgrAb9S/ZX9aYV1wJ+ezGr9ix3Ryzv7x6Tq9Ixp4FxaUcYSa5z5hLr0bCnN4S9toF9z2B2gTclqcO2Z2jS6CA5Fo9ZmYktxPXGROaAnSLols6cnzGxwL+ZxwB8J2eAmBN99Io+/78URWILcfuluSts4L1b649rIRki+a/FRNC1uFmpUCCbmlGr7r7nqZ2mVj9GaeIqY4MA+QRIB/axQ+DbPeHvC7Qohlazvj1XbtSm62PgP5w9JOpSfSqY7IdfZ5A3x4BsG15Jgmrhv53R2kgPRJp1zJJ2jtgrAbUI6H2jZplfn/UCVkA4BEAT42aZKpXn+KUlDcETv2bOPVO0FOZ16pgP6/+ULtvZK9+sr9Xz8cTIZygYaQQTE7bsZ8e4tgD5eGUjXr20308e24JAuHhhI068NIq2du9A9LDSZv15Kd9PfmucwegRwBt1JGfqo58RLKHeLHOEV+hBIa/UcPfs/saZq53iOF/sBYZ2fKf7hFUKNATnsmVKzPMGpP9K6edQdNITVP35BN1AtQoQ7REOSs5r9nOScoeFaAOgWrW5lcdeAl1SQqaoRQDzSE0zdr36jplpYtSMkNZxsaACMgOImvYng8VtDRO8Yy2XDX8soq3GH1A9mQN+FANrlWLK9kNxw+vs4iQR2YpMQNqHufMIASbaRhco3NvoRpT4y5N2W1T9MKd7lmCswW7E6A6hKrRCbdQjaN1qHKzCbCO4eBYJs2nUA2lrPheNMfiQGEK1WwkJfD7TqHK4XoI/EAdhaXpzGUAHKFuVw5POlYRqKOuhDm/nzE0GHgO5WkyTKHZFCl58gVLDVBYVTwKW5NBi0CdqJJsxdTUjG90h147ClmjQYtAtafe39xe1912BSwPN48mU4NBikCd7Xl3c/XXzR+fLu6+ljaSXNwFQA8FOrVMWkjqZE4XqFwWAEQHEHVN2kjqTA56SmYibUQd/i9XefDUKbM4m7PHALyH4/VNmknq1E6G6Zw1zyxdsxsuY08JiR6B6ACiU4PWUX17ehUMsaZurEnkpdmZo6h/Xo9Qxozksh2nb2KPUaJNmoQaLWVdlhagoDe789792WTMydFsqGMPNS0V80OCFmBKDUFpMtzkqN5OnYCpyfs2Y6qUT8Za5+ID0D2YrsmAk6O6PtKSyp+5BVX22PPqM1AdQNVosMlV9W/daZuxFayqo1pVk25yRN9ydfnLJhoRmOxIbtRbBFS9XeVOPC9zhUJXlmDdMWbvtBhH6cmqgq4WRP1yHpGUPcevvzwRVplxRbw1WE1xeP8rQB4AWWNjHQ2yp4ar2uoaNPVxNbVthV1VHdiBTlV7R1LVvq8QPtmMyWpzS+FtJ6f1RKu0k9PKem+cEtkOusEON2yj+m71/2ymx96oP9lZfXBKZE+NfHY1BRsGmH2XxNkj05lOqT1hENiQwGEjvU4LjDIIqIva6y1kYhEAR3uPmGKE7QqDsOrG9mNhldcaSbkfRYVr0ou7mqz242vwvo2o2Zm1IwgF1tJxraWNIdGZ6Kyl480XaDZ2bd1tG2cFezCIRza8p2MMgkcLXGk2E2xlO8cJprAoYxBbkzMJ4R75NAuM8mgJcAfBNTmRoNkushUupDsYztbodEL4QwcoNNato7Fup29m3Yaqdfvp4uP17L8Xt1+uwZw9sjnrbLzLiBUYNWdD1ZytIjm6yO//r4oMT9tuVYM3fMGL65Tz50tUwN7XISiNpoGR+kCzCQf23AwEaTQDjKXufJSTo1URkDycpNmML5bqO95df7j5/Nfd19mf13ef//gEdtJx7STP7ppJvt3bStqV1bu/BGhSO1Zame+IZB3gw5ebd7PbayYI7B7YE7PeD7NfbeJ1HzpJC8q2tAuW5DLwak9duWMHmA5hataUUlcvtczih7igM1iKNginWYNK84aDBmeCAOdQnGatKlu/TUPwlC+sA54DeBrNnmerQ+iGlTz7cncLlvJxLWX/8PnxnXmw+4uBOupCRFEDtu4up2kQ2+poW/fmshtb58wcBqBDgBq1hm010l8D/Xhx9fvNpzIdjMg2AWCHgDVqF9v66D9sdx0Jplmr2NG84KvttObg5gwGatQsdtR5AHBbx+VpNI+04+ziCW7rCDyNZpDWJAARoX2Z9LCcd+XtABH9gQ6M0RzSmjQgXQ8GAhHHDERMNqbsQqfnqDvOjJ0mcwiEITRYnTE2oB+xE++cw4GlTUNhGg1BOLtncOLsESynQTSNxh0czU4o9lh2UNHE8OqjQSwNhx3UIJKwgnmUF4zfEXgajTq4tkLrx940UU9ItHdN1BjMb5uwZUbhnfF0cDGO6WK4ftfF8CeT3ssCZYxhmAxsjR3AssB+erTuRafpfmhS2YHFOiZNo/6HJiudNtU+LPQczNWoJ6JJUwdzZuPyNOuNuLDU89g8zXoj+lABzJmNx9PoHKirRgs2fR+YYjGw1nPa9X+C0DO7LUqmLYNFgr17dtgb8lv4O55+sQqsJRsJplF3x9OkPAKzeFSeRt0cb3cwAqziwTjNejmeGo4Aq3hcnka9HC9QaP3gcy7SvjuVORdf1YBNAlZWTh5+NgK6TLh1R3gLAtuWVYmd8j8fAUtHQK59fAsC2reL/sQE5ALdNoDwzdLl2b4a+/hhddC3dbqSN4byqC8R+crirlJyxkZSnrrvGxbcjWWnU2/3KxY26/viVbLb6nu+v6v+4Hcs2DJR7QD5iUgaR1IUFMSDpatYonlpBx5hkYfm1R2nIlmTcOPdHcFuSdms73u7X96hSFa3/r6SxQ7Ld221qudotfxI5pjX+Bc=</diagram></mxfile>
\ No newline at end of file diff --git a/diagrams/data_structures/src/rrd.xml b/diagrams/data_structures/src/rrd.xml new file mode 100755 index 000000000..87abaebc2 --- /dev/null +++ b/diagrams/data_structures/src/rrd.xml @@ -0,0 +1 @@ +<mxfile userAgent="Mozilla/5.0 (Windows NT 10.0; Win64; x64) AppleWebKit/537.36 (KHTML, like Gecko) draw.io/8.8.0 Chrome/61.0.3163.100 Electron/2.0.2 Safari/537.36" version="9.2.7" editor="www.draw.io" type="device"><diagram id="4eaf3d97-8d15-fa6f-3370-04444ee55a0b" name="Page-1">7Z1bc9s6koB/jap2U5WUSOr66MROjqvsJGX7nD15YjESLHFDkVpefJlfvwBJUBTR1MUNwkrcUzMTmaZoCR8aaPS153xaPX2JvfXyOpqzoGf3508957xn29ZkPOD/iCvP8oo1LK4sYn9eXttcuPX/w8qL/fJq5s9ZsnVjGkVB6q+3L86iMGSzdOuaF8fR4/Zt91Gw/VfX3oIpF25nXqBe/R9/ni7Lq9ZouvnFX8xfLMs/PbHHxS9+erNfizjKwvLv9WznPv9P8euVJ59VftFk6c2jx9ol56LnfIqjKC1erZ4+sUAMrhy24n2fW35bfe6YhekhbxiUX+jBC7Lyu9/cnJ9fXpcfL32WQ5I8+qvAC/lPH++jML0tf9PnP8+WfjC/8p6jTPzNJOVjIH/6uIxi/z/8fi/gv7L4Bf7rOC2J2yPxND8IPkVBFPMLYZT/gc2bbsXDyj8Ts4S/7bv8blbj0rX3tHXjlZek8gNGQeCtE/9n/pHFG1devPDDj1GaRqvyJvkFP9c+zwaf81Ed2nK0H1icsqfapXKov7BoxdL4md9S/nYk53cpF441Kn5+3Ewye1zes6zNL9spJcorJ/aievYGLn9R8oVZD/sKa+9B3JD/fwM3/0ZpTiuOfrEGHoCYF/iLkP8YsHvxNjEkPhens/JyGq3Fw9bezA8XV/k954PNlZvym4pLEX/vfZDLxNKfz1kogEapl3o/qwm3jvwwzUdi+JH/l3+vT/0Pw96Qf/BP/Gdr8zP/r7g9Tj9FIf8unp+zY3xqPDIxPQCqlUjsx1pitA+lOMJDnFgKxA8fPoi11l+xMPGjULxm937op/kPJMb7xLgVuNhf8r/I5odMg6GNnwblw2/4puaFC/49j396f7L9eC9IWRx6KfsotqVEmWzVFzlsEVHn30yIlhispRfzf97xW2k1kZNrcvgm8QqriZxUO2iG3ooRTwRPHcvCwTwdSJ1zz66+fLu5vPvrWjw+WPBlOV2uCCoC6nhiEOoAhHp9cf3t5od7/e38gv8yjufuiq2i+Nld8fMYwUXAtfoDg3SHwBIcBFwBYHM3zFY/mViGV5k4/Aa++IHIvpys0zdIdnQI2bn/4CcRYUVhHZrUmcYK1ox/K8d2hdp0H3iLhGBiYE4MKkwTdfUtjtMpW/Ev6uUfbM6HS0FKB+nODtI6lKv2g/ShTx9YjcdrPkhPdi0jSy9Z0iqyWUWGLTPrNE7RqhG9gdKlUzSSp8lT9Eg1lEtryMybLZnL4TAiiiRq8gg9Uq2WYkvM5bPUyX3+Vd0ZX9lTOmOhuBo9PY9UA2YFNgszoXDwEejng0FMX87U5LnZGqvrbxYmfJw5TX5bmMNdc608/7nnnPH/t4gvhq/JA7Q1VldjhS97WkcJ8dXF1+SZ2hoDi3IaZzPBNfVXjF/nrwL+Fd2NQUz8ghhjTjx9gwqVNVY9TXykZ1ngbVk3a9eKO4kwgrBjULOyxqrbCSJciDFh1mm6MKpsAf6nNsxJGsWEWAfiiVF96yBH1OYS8cXydSyj+pbqkQL4NvQtgoyG7BhVuFR/AahwbQBHQUYqNY7wyKjCpboRIMJyEya8aLxTk4rWxFFgsfmCSccx/67LaBGFXnCxufoxTyXJvaZi/P43W63l/V4841eW6Uo6ktmTn/5be/1DvImPJv8p5J/13+0ff8hHsjR9Lt3PXpZGgmT1Sa4iwT9/ojre0tubRFk8Y/JLlqOXevGCNW4U33Ynlpjxqe4/1G/a4dw9i2PvuXZDObk2T/4eFaakci7Ykra0iVjjOr+9978vZ0Hb/ZYz3HU/f1F84pc6jKuxhcwqcTyf+6ueiNcVCwCtCi/P5jDqv7CAfI461CRh4tU78ZIRVxRXkz6MibqXyzSd5FdPhhT1Z0s2+8WHVgFL0UWHEz8yukiLr6M9vOjgx1fzsZv4oqm6WwSRmGl9sf/7jIIUa6rjSaf8TdUtou4DdRn/2M9EE0HTZHDR1FY3fBmxsGIr8ZpYIliaDCuq3KpqpNjKW/gz/vUFz+j+v4qk+ouvt5ffvrrXZ18uP/13T6Tm86/ctyg6BYfcrMYOhRxtH8MeilhB/o8vBo12WpTabjJ0Yap6tYW5zVuwjf0t/12SDw6JLapsgsmAhRGYGXt7cacgpKOXwvboQieDftN2Nhx9sPvDycR2hvZ0YEGFT4YA+spEi2KvRjJQ4ROVciUiqFMQRFGLAKtxChVEisVHgoQOQF2BtCZqOEJhGytsnbMovPcXWexR/ZrDVudW3BrS7o6dBMel3UFPHwzs7cfrNYuNgFiY4sTmi1QBUVjh8ty9uvj65e4vflD7l05p8BqzkeLT3C2gkBgqbKMXqMldYwSEv8icvHzDcJMiiYuQYpDq2AMORgrEu5RI0+c1ySYKJGgT64okkLAlSd57Kz8g7wSOJeS57owlUOBPSqWfBiSWOJSQd7gzlK3eiXdZ6Kdkl8ahhAzTnaEE0q026k9KMV/Yswlki+4MpmqPbNYLIag6oEL5cl1BtR1VCSo8DO7dj+8X5cEzdUm1xdsRTKpDqtmZgm8084SS4Trjqdr/KCxOH0sw8a0zlqqRr2Q5y2LxNdw81YGIoohCWW6dEd1ZFI9qa+JpQhltndFUDXzF3rnw1u7jkoVuECWp66escPYlrveTDyoRRhGGktq6IgykJJUr8Dr2RZl5WnxRMAeHxsloccwDgeZUDPe1vfJaDPk70lUOffxg2mhBpdcvb01Vowh1OThicamE9yT98ba1w4CZ11Sd+zHhxOA06Y23LaA4VIGzUSF3+PHz5dXF17PrC4qm0YrbpKfetlQrWMhSoQq48WMQzX65Ml+ZpeUVoouha9R9b1uqUaxWHplKIuNxmvTg25ZqF2vidOcCCzHFMDXpyueHR4WpqJiaM80re3mzGUsSKqSqg6xJzz7/gO1kszX/lsxbufzU+hzOiC3+0GPS0V+1+QZOPesgW/ghNQbBEzXq5bdVG5kkuormWcCIqAbDhEltybbbtaWqhcSIzqtYqCa9/HxRUKBSdy2NNI36+W17f8AcrbpopCYd/fzJKtKEzYpVV7xI/HDG3PxoU4RaEV0UXZOO/+ohB3QAqRr5EF0EXZNOf9sG7EvU36VzyEaDAbi+pkBO+QAFUKnx/BcEFwVXpr2bgQvYnLbhNqWXCKMJj0zqV32V8M3N+eez68urH72ioDClZvYODNk5Fb8OmGHy17fbu5LoMkooZQjF06xPx1Zg/dYdAeR41zsC2Fa5UNY7AsgbX7sjgMxbl/Snwzq/vfe/H0x23m/Zw133ozsCVGPbVjy+qB1PHQGwq4JRf2BftUcXUbhBNMsPVu11RSkM93DaR4bhavEbtofhHvx4GfbVTRSu3T+sreciZowq7Wxm2UZoTzP6tg+EawJYY7LD4aAaraMIdHjwHgI35bLpFhGYQgngu4UbR1Hq+lxtfCK8mHKnRiMN+qqVtagn8M/ZTY/Ki+tiajTWoK8aVTnTT2dXnwRRL/DiFeFE4TQZZWBNVZzU5ek09HUtAQrt+vrBj+9WX7emUIp1wiVdaHL9MheX2sqo5vtJyzQ7EX29NW5U7SsjKgxRRxnNtI0m0/XVaImmIj/3V4zLtaiRQHo8VkkwGukkjcoNne/88lqofBuuRBRD1GR0kwXUkC9aUQiJ5f9E9wrM39qvU+pfdbfOoBzvbr06hxNRz8pvjshYJSJrKrwGkbaeO/qIGBt/Ff1hREYqEVs3kBc5Pq3+YNuTaTt2ne7+N4iGTrvf4TSdpY134L2f0LYqA1zooL3voH14/FLlzZ40iTrqmajqUr/V6nioYdtVPVPUxEvFerTLAjjXggx1aE6AF6rRlIVi0rA8gZNrZzyBHI5GWg7xxPIE6rx0xnNHGZAsYW5eO4JYvpwlVNWlM5jgkYi8w52xBUKBO2MLuhGLQGDSfLVrvsrZR+qi+6xNQ1n/AdWTmvTeQ7rGa9B7u7MYqmfVwk9cBOz3/fA+ilfU8PRAAW5jfaSLWIePp91DfOjTO+53uqPupph8lDa/vTXoOD53t4zsL4NATDUwNRrFqZ6hpXzGbOHz7/hMUHVANVkvFainWYVv8E07ZO4iy9tNf/m7aDbdo8gNTZiNFk4FCm02F+Qt4AQWAdZkqi1QbbNpqY4oYgOF02SmLVBis4kzpdZCSKBmkyT3A/VX7D9U5Bh5ujFaLVXNZqbmXzphmi2UqsAs4kNECxfqnanN+mAye0k1JZUJBoLpkp9VRV8eaqOpAavRWqnUeMksXbO1U9vtS9R3SQtNo2VTWw1LIh048H8STixOo3VSVftR1R4gjhaxt6K6xmigRkujAnajBlD+yRPIz0tMT7USqmo8Kpz3RWsWyus26bPX4cVp99kf+vRqTenGZ++o1q1sk9RdHaPXWbJ0ExbO+ZlLyOqc1pRN+N60Zb6dhCPfaW8is8V1zr+eH8JxQcT2NB36jmr4Atl6a9/9xcj8heFqtAeqoyrrD5HI0st3kJ0LNItdPuCPXIj5IJ71hJufsL8cu9nmqI6q08vet+mSa4BzF8Bd/IYoYygbra3tqFr+EdL9FIVhXiifJFwPe6N1uAeqvg2v4dHsF6MEKBRYo1ECA1XPPkKoWRxHHPoyoo1b1xnLaDiBDKx/Gf3/5UNH2PVgNxp4MFDd1FJfW2X8E0Pq2s/s/p7/k/+eUKOsKCaVtoHqugZlee2vGR8Mm4KrkXTNxiWoruuPf3/+fHHTtKVUAkxwEXDNhiUMVE92bXOuyg7M5MGqBE1xRSjERmMVBqrBTATl5lxLmu7cTzaIqUUklq/J4AVH1bPKpGbmBfyv2/1VFPppFOce0n60TsEyl+QrVcBr8pVqMZO2O0sPf3y/0xrYDpAV2zzbFVNy4yelY50y6ZwXtE4wuNioumC1l5Rw5yzwnt1s7aYRYUVgNeosbY9nrKjee1mQuuyJzQgrAqtJXyngKm3BGrOZv/YZlRVDsTXqEAX8oQ24QbRwOSJGsatYriZdoIAHtDqG18CW+T3uY+ynKTUBxPE16eYEvJyfL68umnK7JqIYoib9m4B7k7qJaSwRZzYCZdDWTIzsKR3ZU/DrcjVDjjSdvHTd19ztd6ieqs+uzm6u3atvX7Z2fVpFNlbZwUmXmpRdFtpqEpVI+Td013E0Y0nC5i6VJsIBNtotbLi76FQBeOU9uVno/1/GCC4SrtEg86GqBMBwc+2O2CLZGo4kV5fmUl+/u7j+fnV2lx/GUrZai77spLpjqjsbjVQBvBNFY85eEamSsDSvsk9EX07UaHgKEDoqYwjjR9E9QQYRitKs5SWCi4BrMjAFCBAtDtp5Dwxg3aUjtQbCh4am7OwVtuNI/VLDm94jNRCRCnRdkfsBdV1pTKvBSQchAAGpe+FSARcsYZOHayAqFSBcNDUjCdbD1+T5GghJpaZYXcI1esAGPCj8i2Wzmq4uDmSh4EdQEVCNlmKXbcX/lE7R5STd6hRdXqt3ii4vmW/dPVVV2Jub83/ObhQMnZyLhr/1uejo3nLWSAqO3A7HimxZY0i2+mMNrEGNtkfN5bapViJx+LFkeCBFDSvktD2Ilg4fSI5DyyDHvd1kCCUC5cELqw6UYINWvoe6dz++Cy9P+rwmwcTQtPpqD9bucKqhsSXOb9/vLr99ve21x2MR1COgypRHE1CtvhoQ+xAJj7oopi0uEUoEyqFBDciSmXxQelge61R0HJkTUgzSiUFlyOrb0Jp7e3Fn7CT6e3vojj+JOo2TqDUEbHc2wFsph/wy4O2dih+82M/lgsS3wlvJB8pVBuHUI757exUTTAxMyCvWHcz2JjK/2LN7nwUBRSLieEJesO54tluMJE+yHGGJgq6v7pCqxiOyOGgGCrm9ugOqmpDodKqPJZSB1R1Lsh8ZwgpFAXaG1VINSNJTmp9ZREiJR3403KEFKhncHVEwo7pGtAj9IqQopFA54O6QgnakGtIiLIiAYgwLJhUjS7UTQTJKgbd4rlASVXdc2+OONoJKVNFUwUSq7qiqpqN6TGbC8pBM+Yq4IrhCOVTdcR0rtE42KnPH8NajMC3ZVbQehlndaT4Qs/o87bLzUIZ5UUQzVnig9LTuhAcMDzq/vCbfZke+zb4M9pC8gUgTewLwHo21AFcNQJu+0OzepySTGlxLS4EdCKYW4bVVq49kmWT3xBLJEnJsdsZyRyNe4QgjpyaOJeTU7IwlkNZfZ0kHRyxN0KHZHU7VHFDHOeNaCodHEopkCvk0u2O6O46kYEqCioYKOTe7g7o/mMSfk5wikUKOze6Qttfv3yAlOUUfWyDfZndQ2+v214O+SFKRUCHvZndQ2w0Ldagkq3gTg1FFqS2yhKL5tAGFnJvdAVUNDRTNp40l6NLsjqWtsKRovk6wQh7N7uy6+2K/8mg+sglioUKets6gDvcFCxVQST9CY52a1I+GbfpRbzsGjIQVR3VgmVSShvtWYIrs08VV6jBmuO6L7Cu5kk1fD9yRSbVJ+msPhEuyi8Y7NapAga0NmlG5wuaUkpUfH/tgVIkC25G0oCW5RcMdGNWl2vKBVbhk9dcAd2xUoWorLwfDJdlF450aValUp0497nvur3pFzkT+iri+nOvINqlLjSyF1u+UMyGHdytnQrrFtnIm5J2vkDMxUi1DDdmhnAldwjM0qa2O1EUx8MNfoqZfP/Dzyv7RPVq+1ALurylxkLzZpyVvk8GfP+ay7mF9zGVXAn1Dnr/1LI6959oNpcxvnvxdXOhViS1TGb9ZeVemdXx7739vl1+u7Q1DWcm85Q38RfGZN9PluI5Z1qStBr3oyvI2pFrGxZ7gBHMG2/ztsnZY23xp3v/eHu9+gzrBtt+An2BAffy3NsEkta0ZJmPHXmHXAErdv8XNfArI/etRsYFsqDdIpWqsciJp4LZjv/n1y5oCx0zpB3kNJPieVKc+5LYFDLn2c8aLdJJmy6T3U2enijEeIO93SqtC2xus0XDnG9A6TBVU/idPOFklsT7htK+6L5pwVr85I2QVqtYZobzDHu7Wgy1nvPsd+EkE2JXPrs5urt2rb1+U6UVlJ9om7VFlJ7aQDqwDq4xU6V6oXQqwhdZqsAsDqBtECwqSqzPeCMlJ1tWvzAI7mHqBF6+IKpKqyQL79kiNkMvChI9zfvYq9okZ383JY4FiarLIvj1S7ZoK05VH1WJQRI0W2bdHqiWxUKAuvt7d/OC/eJevvZT2g2Nqss6+PVJNkSFL53yE3PhR9ITPN9ZiTxXaUnGRCKMIm6y+b4/UaKnTMWseeoTedQxvPalsHa9HgAvAll51zQds1csz2T4JDZstw4pPVb6rAffIYy4QKdBYpRXYdNjFH3adBuLRCGi4OwCEXGplKCEf/2EGsmoWb8mwjDLtWIYPH3VVx/3w4QNtjipGlDkBFBste6OcUFC4XKHz5PO5RwFzGsgCJoUOyb4BF9UQ8J9X6uhrB84o5vxJnd/e+53Bbp9T5Z+D78d7C8ZgetCns6tPpD51oD418I+gfHqw+a60HWJWCwdI0YU2cgINUxXW2fzpbL51dWvDKASqUzdC+fAbNku9cBGw459epSDKx3tByuLQS9lHsTckyqw6blVxgHzSmv/izTstgJlVn0OlnJ6EK8oBstCarij2wD86uaKQVE26ohwgSEBWFKQ8QixJkw4oR6abUQv2bmAa9T05MvEHkEv2xGaEEoXSpMvJAWI4JMqYzfy1z968ox/L06SDyQGiNyTPPAefWKJYmuzp7EBRG9ubpktM8ecUk12dHSBso+rYVJgTCSYGpsl+zg4QryFhZqGfvvXYG7QBwagi1N6SwA/vI0KJQmmye7MDBF0U7opsPfdSJixB5RMJ6AuBGm3cXLmj6rLpBbMs4DTnbpitfjIhqIuY8cEjrhiuJhs3O2PVKgRxjRkZbXFUTXYUdoA4DrmTzv0VCxPqRoAGeqhHVg9Q1UZU7KeLOMrWRBJDEqxq3h1J1TpUkPzJ7qOYzp44lFAh8+5QqsahAqV3n4pdk0giSEJVy7sjqZqEamY+6t6jAyhUp7yzJI+pakq4+Ofsyr349/vNxe3t5bevQheSmi6n+8bhApFJJ5sdO1VtCwDbRy8O+cgSVwxXowEKfdXEAMls7OcECCwGrNlghbFqpKdwUrPhpFpCGtrjSQ9+fKUGdBRQOlY3/kInn7PAe3aztTvPYtrx96tzhcyeRmjpuM2bUECdR48hYdWC1Whs6UTd8OtYV94TUdVC1agaN1E9Cny8vBrXLEj9deCTiQRH1awOJ8OulPyvW/f27uzu79ucpJdmZCfBUTUaezoBYk8B9x81JcdzNRqDOlG9DBDXKJi7xBbP1mhMKtAhoWasjuO5IO3eB96ClmLcGcdoWOpkpw+CsOrDajRAdaLavlJ/xXKoAf9mbhERNyemOHOEUa1JNTJVTPNE14IpIUUhNRqwOlFNTNtiWpxtRLZHuCCyKLJmI1enqpWpIjv/6VKsBp6n0YjVqWpfqvOkMCoNQI0Gq05Vy9IGqPTapJErLvJVeEXhjji4RgNXp22BqxXZWRbHlOGMhGo2hnXaFsNa88cRVh1YjcazTtviWQusQg0mnCicJoNabWDpvbk5/+fshl97F0QUQ4WNoTJathxYczc0772VH7z1fEosTpNGfBtYazc4l1GSvvkqaUicRo33NtBUeBsnFUtDAzVptrcBB2pVCTuO5wkTL97JV8QVwdWk6d4GnKd1rsLHtgHrUpFzNF2TVnwb8KHuoLuO2QPRxdA1asm3AVcqRJeEFo3VqEFfNlj/U1oTVAO+1ZxgAjUnkHea79Xi9IdvYtShLlevN+q2jBz4w0d9fGKjrrqAy94VdxfX36/O7i561Aasmz4WI7ltVG3AgFPcENhaKusajrzqLKaOVFsCXMkGqsE1RFCPYeWwpGBK5NfDFsr/6o6tKpyUyN8NVygDrDuu9kEyS4n8GsCCSWCdkZVRkn+M+ioHfFt9dQD1Vd75Guqr6sht2j1StloHecgx2T80CBWUg9eVUDl9dRvsoCG1MSlTBbz1GFGXuoEFCJ3+M2P+1qObNzrbh5j35ZRqbd7YuF+aSdvutyY77+9hmzc6/TfQ/VN67OoTSLZWee35M9rmOy0/V+v8adz/3rF2T7ihPdz5Bg0zSPWHzqPsZ14DpoPV6oWz7dAZtWtWHjbbZHSBiV6ze5u9DuTP8hHFpyrftZkGx87bUbMJ7XjnLFRu7++etUrP2r7uSavmaf3OO+thM9MBHA2nsg429jmrv3tfbN7/fl8XZHUd1NwG2emreWJvYEpBXhT9B6KXzanp9hwpVcbWKdW4feDsmVEj3P2jPWvgeDDcdT9+wso1dpcxpjFbye8BnxcBQWn1ewwae9tE1jCrHSmtMXCkrEIqUGdKC2jrIE7M/BL1ujoioL+geIwrBISqxU4gJ8YOpvyzJ2zuelQhAoUV8IJ0iBVM0xDO6U1hrXdUWQtPFfCBdEj1sAJM79KlT1hRWCEPSIdc1fjhKln5HdUSwNMETO8d0lTjhTc0qZKABpxAjlyHOIFmoGAzsyQL3rqLDAsWyJbrEGxbVW8WxxGtuLgzDJAo1yFJ1X728e/Pny9uxIqb03RXyVsP9sESBTLluiNqqwamh0hkr/bfhdGckXaLtDCY1Ids1WzUjDRxq0wbworACqTFdYfVUQ8tuQ3467fzC4UjWX/x1t/R4ADr7wDArSXq3XHUY02hLr35ogL7xLaQlKPsvRBGPVKrnmayMOHjnDsbS5NvtGaxl5IOjOMKGXy74wodZsQHjtmM8fEipwwOJmTn7Q5mW2uiWZRR9TMcSNCy2xnJgXqOyZUk/r+/L/KVNsnH5ZygoqBCBt7uoLakGJVQSfXVrvqOG4EPVn9kqcAnkO4rxR1H3FaIQzZg+YJEeYcoD45OBAXB6pFk1U1eSvLN5dnHqzyD+8GL/Xy8CCsCK6QMd4d1R50txi+6woaY24afuH6cJJThi6QLacfd0W0xPG2ElnZg7TvwtLkDW6OhyhysuaBnB1atTzI+jaog7hff4y1QnWUmDgAL1KYl1dJLlgQTAxPaaTuDOcTnABpOS2hkFoBju52p4AyAtKxWCvqLag1U0962NrPRUClPGy8/kC7T3WKIr31wSvID5PlUJrBt6TFWkk6i+5NHGEhSbrWYdTDC1h8/wjY0hw2OsP3Hj/AAKI9icI8FSq17D+KONGZiX/390i+PJQBUVyy6Q+gffv5jHEVpPf0w9tbL62jOxB3/Dw==</diagram></mxfile>
\ No newline at end of file diff --git a/diagrams/data_structures/src/web.xml b/diagrams/data_structures/src/web.xml new file mode 100755 index 000000000..dfcaa2f4a --- /dev/null +++ b/diagrams/data_structures/src/web.xml @@ -0,0 +1 @@ +<mxfile userAgent="Mozilla/5.0 (Windows NT 10.0; Win64; x64) AppleWebKit/537.36 (KHTML, like Gecko) draw.io/8.8.0 Chrome/61.0.3163.100 Electron/2.0.2 Safari/537.36" version="9.3.1" editor="www.draw.io" type="device"><diagram id="a1159e6c-5a01-6707-8aae-70da91d3c1f3" name="Page-1">7Z1rc9q4Gsc/TWZ6MtMOBgzhZSCkzS65nJCe7e4bj2IL0EZYHFskIZ/+SL5xkcyhyHK7zdPpTGz5gqWfZUt//R/rpDWYv36O0GJ2zQJMT5qN4PWkdXHSbDpn3bb4I1NWaUrv7CxNmEYkyHZaJ4zJG84SG1nqkgQ43tqRM0Y5WWwn+iwMsc+30lAUsZft3SaMbv/qAk2xkjD2EVVT/yABn2WpTqe33vAFk+ks++mzZjfd8Ij8p2nElmH2eyfN1iT5l26eo/xcWUbjGQrYy0ZSa3jSGkSM8XRp/jrAVJZtXmzpcZclW4vrjnDIDzmgmR7wjOgyy/oLfvR8SuTx6RXyVV4q8QuZUxSKtf6EhXycbWmIdX9GaDBCK7aUPxtzUQz5Wn/GIvIm9kdUbHJEgtgc8Qx6syPPRigdMMoikRCy5AfWB43lybKfiXAsDrvLs+fsJF2j160dRyjm+QUyStEiJo/JJcsD5yiakrDPOGfzbKc8g5cb17Mm2OqrpZsV+DOOOH7dSMpK+zNmc8yjldgl29rNwGcVw81WX9Z3WauVpc02brBuM6tAKLuzp8WZ13TFQgZYD7ulwF6GMZmGOBCplIXT9R9xyC59kUGewIvYE96hpQGIqDizWKV4Ig+TJUREBTvPkjlbyJMtkE/C6SjZ56K9TrnPsi6TmDh2QpNaMiNBgEPJl3HE0WNx/y0YCXlSNG5f/BclOGh8ck9cceEDse6s18V/uXvEBywUeUEkQYnFnfKC5d2igdw8GHJGVdzUB1HN9zOB2lag/jHse4PR1fDmwbscnX8eywcgRdMYiB5P1G3WR9TdR/T69mIoXyTilQs8j+fZPauPZ2cfz/PBSJ7ep0DzeJpOo10fzq6CUzY1PJ78FApw5Im8xCIhIhieuSZUWwc2jqqgenYgVSqy6MlNQNaArFtjA6mnkJVZEh1Kf+H5LHoCkAYgz2psF+XigEKSTKC3YtJbadTYGHKcEogMIBpBbNXYBHJU2cifoUgKcoly5JGFKIGbK+/6/NuX2/HDSVMUR/cC+JpICjU2hhxVKdrmKzNbEB4P7/+TEHaBsAnhsxobRY4qG2WEA+yzAAfeMqKS8PDh4vzh3JM91vvhv78Oxw/e1/uRN776a5gwB+BHA2/lj9FagKuqUgY86dEcSBtquBHwVp0NLVV2Evla+knXh8yxSJdLzx4JZWEki5Ho6a6AsAHhTp2tMFWJyt/SjD0R7JTU6MHt7e9XQ6jUFSHv1dkwU2WqLeRNQF4D8rZTZ0tN1a8y5CwiU/Hw1hO/vb/6fHXjfRmeXwzvAXxF4Ns1ttiaqtyVgT9dxjjy0FTn0QCah9Ps1Ngca6q6V9Eci3C8ENnEW4vA9WiuvRobYcXlaQaOYlFKsWhU+5g8ix7144rDgKCZCaPGppbGLbUDNpZKGEA1hdqu0yzVVlDhYIpzJ6PI6YxNWYjocJ3aT+ycOMhKb8bnuY8RvxL+bWP5T7mLKDmxFooL+7a9+md2gr8x56vM/YiWnElqxe+OmGSdnLG0bGO2jPzs6nP7F0fRFG/vJjO2F0CEKeLiybSxk2GVUUXF4h23aSttnC4i/AyVxqDSdGtsiOYV9NepNO5PVGnaapc+YEt54zUblIRPqTmXxOkYaVml2SjgxPpceudebNQcXxQSjjR1Zy5qQUKRokdM+4Wn/TBPdH6/KLdz4dfPru5k0/OuM0t/bHxyOrnFILv1P2arB4PIzn7H0nHmfBc2mcSYK6SKizjsiaeq6iVPvFBygife8U+8Xp2dNVU7DzEPRPF4fCZF8qQVmC4C1OOhdpp19tRUufyZyWdI8qhNHw7RMgyJDIAApkczPTSkpRKme2ybC0bF+3PCvJgyePSaEO3W2EPT2DVVogIQ9tliBWhNwyAaNfYjWqqgXSp3QqihAve7Qw3d9nasoeOqb9vCVrYJu/ApGNFWBe/+18vL4b1sDaeWeqi5BdyibpjEGGphVlJzVZF7l6UnKuBiCQ9jE6SaIEN7SFV5e41U9nSApAFJTXihPZKq6pp2ZnyIETWjqAsrtIdRIyXlDd+IiuICkgYkNaGE9khqnJfFyCF4NgxJakIH7ZFUJaP00foGrR1zkprYQXskVaHozRNZw2guceZLgPP4/ogmitAeTlUl6q84nkiWj8vJRPQtd22R47vbm/HQ+2t01fcGX77e/J6aIsEQaUZdE3ZojXpb46HLX6xv8GY1FhRqbCPlRlotyhl6ho6LEUpNKKE9lHs/K5a1l0hIOBFM3mQikD2arC5m0B7ZrsLqH2T8yWNTN40/+bckN4w/OYMf4PzRRHYkfpHY85E/g0GROgZF3M6hj8pGBYMi+dj4BvIFSd0kC/jk4qaHrHcw2B8wHuJqvOF629cyhheeEdY6x0RcVUkvGqUSpOeLdxt0Mkxw1jkw4h5szkTPiMAHGE241jpU4u4R2BOUUFHNgdY5YuLu+aZmhOEdasqyzjETd48lE1HKfMQBpxnOOgdOXLWTekBUyj9bJsib9z9FfFBH7TL++gB+pgCtjipVy3LHoRcz/wlzNfoXdBpznabX2DGvapzKzbbmoVcopEbM93TwfRZOiJwj4zRfgncZ36kqRqqNjmol3+FXuw2+zJpkmn1YJSXqxdjnhIHlyoSsTrixRlbzJbQdsgGeoCXl3iMJA0+8ngDt8Wh1Io41tGp3Yiky5XSSDkVONfkeLSA9HqlWv7HGtOyT/HL2NMrgjWpEUifc2CLZVTsnRWefLXAIPX0zljrhxhrLPe6qCSIUWJqx1Kk21liqfdb0CTsJYpH36/Nv3uhq/DC88S4vxuCBNOzD6Jyv1siWRfucCrReiOYYAFcOWGdytQZYlR6Kquvx1QL4WhAh6mwyqaPSa74TNCeUAOLqEescsdYQq0LT3e1odHVzeatA/OW14hJSGnm4VAt2mrumPU191X21ovjCrxFNVVySNH+77cu37uKdV8v/AzatCt8l/1qbt3PPwDR8R8YQpE7ttQayTD569zPImTHUybrWplst68bIMVXZygWSBiS1aq41lKUzS52uZwMEmgY0dYquNZqaQdJtmjDWYspTp+pa46m2XuXsX17mZJBf48VJAAoAPR6oTtq1BlRtxhZAk6n8ivkmAKpR10Sn6lqDqjZpt6Emc00AUCOgOhXX2qTzewZGRQV9hgiFCrSDGptFvT2Do6JuQmhYBTx1Eq01nk2Fp7QVtZrpcDdF0/c+qY8ZTO13CqzBVIfMnpkMp258OA0w9USpU2kt+hcgNUGqmb3YHtIyfejDaSTfnkC0CqKa2YrtES0b9/xwGsv3JxCtgqhmMmJ7RFWpKHvswgeETUHqphi2B/JMYWU7fqzdcU42Isg+Nj41Gs085Q5HovObTE11RGzZToSYrti3o816mUS2GW1Whqfy6LKeJvQ5jzTK57s4gfmjKqhRmrmb7ek5ave/8AzsMAQDSJFUbgBx8/darrg6rgrT1cAspow1ormv80+ZJgIUKuYG27QyfJcHRIeyinrpNPbocvCdCUOSOhOIPZJ7KuWcvPfYTTOQOieIPZCqFLcGKd49APJ4kFojiD2Se6ZMp2ROoAFrxFJnA7HHUhXgNnwD8wUV/TMvwv9digx6cgt799MhGOLVuULs4VXVuAIvCSgGpFUg1flC7CFV5bh1jZ1h/8nDIjsrIGrSV9GZQuwR3ePdkguRNxd8SIx9FgbQCTUCqzOH2AOrerhy5TzlCvq5sahQa2NJtW9tibiTBO0E6qgZU51BxBpTR6MU6YR58ReoGlDVOkXsUdWoRjqqExKJfs0kwhCIYgRX5xmxB1dVksZX13ejoXd3/vAwvL+RZJHv4zj20k9nAtrj0erMI/bQllq8Tj+cogD8IxVB1flH7EFVNaZN3x4Y96qBqvWS2INa7vMC515lSHVmBntIVWUJrHuVI+3U2lRSpaXi0cvnETCthmmvxjZSr6ew+sm/Ar/Xqaf5LHxXY9QrI1C5Uc9x3o9LUlP2hR7yQ1ySjlP/zd12uz9P4Tv1Fb5YjRjjG9s+R2gxu2aiSS4S/wc=</diagram></mxfile>
\ No newline at end of file diff --git a/diagrams/data_structures/web.svg b/diagrams/data_structures/web.svg new file mode 100755 index 000000000..bf05698a2 --- /dev/null +++ b/diagrams/data_structures/web.svg @@ -0,0 +1,2 @@ +<!DOCTYPE svg PUBLIC "-//W3C//DTD SVG 1.1//EN" "http://www.w3.org/Graphics/SVG/1.1/DTD/svg11.dtd"> +<svg xmlns="http://www.w3.org/2000/svg" xmlns:xlink="http://www.w3.org/1999/xlink" version="1.1" width="1805px" height="765px" viewBox="-0.5 -0.5 1805 765" style="background-color: rgb(255, 255, 255);"><defs><clipPath id="mx-clip-7-61-322-26-0"><rect x="7" y="61" width="322" height="26"/></clipPath><clipPath id="mx-clip-7-87-322-26-0"><rect x="7" y="87" width="322" height="26"/></clipPath><clipPath id="mx-clip-7-113-322-26-0"><rect x="7" y="113" width="322" height="26"/></clipPath><clipPath id="mx-clip-7-139-322-26-0"><rect x="7" y="139" width="322" height="26"/></clipPath><clipPath id="mx-clip-7-165-322-26-0"><rect x="7" y="165" width="322" height="26"/></clipPath><clipPath id="mx-clip-7-191-322-26-0"><rect x="7" y="191" width="322" height="26"/></clipPath><clipPath id="mx-clip-7-217-322-26-0"><rect x="7" y="217" width="322" height="26"/></clipPath><clipPath id="mx-clip-7-243-322-26-0"><rect x="7" y="243" width="322" height="26"/></clipPath><clipPath id="mx-clip-7-269-322-26-0"><rect x="7" y="269" width="322" height="26"/></clipPath><clipPath id="mx-clip-7-295-322-26-0"><rect x="7" y="295" width="322" height="26"/></clipPath><clipPath id="mx-clip-7-321-322-26-0"><rect x="7" y="321" width="322" height="26"/></clipPath><clipPath id="mx-clip-7-347-322-26-0"><rect x="7" y="347" width="322" height="26"/></clipPath><clipPath id="mx-clip-7-373-322-26-0"><rect x="7" y="373" width="322" height="26"/></clipPath><clipPath id="mx-clip-7-399-322-26-0"><rect x="7" y="399" width="322" height="26"/></clipPath><clipPath id="mx-clip-7-425-322-26-0"><rect x="7" y="425" width="322" height="26"/></clipPath><clipPath id="mx-clip-7-451-322-26-0"><rect x="7" y="451" width="322" height="26"/></clipPath><clipPath id="mx-clip-7-477-322-26-0"><rect x="7" y="477" width="322" height="26"/></clipPath><clipPath id="mx-clip-7-503-322-26-0"><rect x="7" y="503" width="322" height="26"/></clipPath><clipPath id="mx-clip-7-529-322-26-0"><rect x="7" y="529" width="322" height="26"/></clipPath><clipPath id="mx-clip-7-555-322-26-0"><rect x="7" y="555" width="322" height="26"/></clipPath><clipPath id="mx-clip-7-581-322-26-0"><rect x="7" y="581" width="322" height="26"/></clipPath><clipPath id="mx-clip-7-607-322-26-0"><rect x="7" y="607" width="322" height="26"/></clipPath><clipPath id="mx-clip-7-633-322-26-0"><rect x="7" y="633" width="322" height="26"/></clipPath><clipPath id="mx-clip-7-659-322-26-0"><rect x="7" y="659" width="322" height="26"/></clipPath><clipPath id="mx-clip-7-685-322-26-0"><rect x="7" y="685" width="322" height="26"/></clipPath><clipPath id="mx-clip-7-711-322-26-0"><rect x="7" y="711" width="322" height="26"/></clipPath><clipPath id="mx-clip-7-737-322-26-0"><rect x="7" y="737" width="322" height="26"/></clipPath><clipPath id="mx-clip-477-165-252-26-0"><rect x="477" y="165" width="252" height="26"/></clipPath><clipPath id="mx-clip-477-191-252-26-0"><rect x="477" y="191" width="252" height="26"/></clipPath><clipPath id="mx-clip-477-217-252-26-0"><rect x="477" y="217" width="252" height="26"/></clipPath><clipPath id="mx-clip-477-243-252-26-0"><rect x="477" y="243" width="252" height="26"/></clipPath><clipPath id="mx-clip-477-269-252-26-0"><rect x="477" y="269" width="252" height="26"/></clipPath><clipPath id="mx-clip-477-295-252-26-0"><rect x="477" y="295" width="252" height="26"/></clipPath><clipPath id="mx-clip-477-321-252-26-0"><rect x="477" y="321" width="252" height="26"/></clipPath><clipPath id="mx-clip-477-347-252-26-0"><rect x="477" y="347" width="252" height="26"/></clipPath><clipPath id="mx-clip-477-373-252-26-0"><rect x="477" y="373" width="252" height="26"/></clipPath><clipPath id="mx-clip-477-399-252-26-0"><rect x="477" y="399" width="252" height="26"/></clipPath><clipPath id="mx-clip-477-425-252-26-0"><rect x="477" y="425" width="252" height="26"/></clipPath><clipPath id="mx-clip-477-451-252-26-0"><rect x="477" y="451" width="252" height="26"/></clipPath><clipPath id="mx-clip-477-577-252-26-0"><rect x="477" y="577" width="252" height="26"/></clipPath><clipPath id="mx-clip-477-603-252-26-0"><rect x="477" y="603" width="252" height="26"/></clipPath><clipPath id="mx-clip-477-629-252-26-0"><rect x="477" y="629" width="252" height="26"/></clipPath><clipPath id="mx-clip-477-655-252-26-0"><rect x="477" y="655" width="252" height="26"/></clipPath><clipPath id="mx-clip-477-681-252-26-0"><rect x="477" y="681" width="252" height="26"/></clipPath><clipPath id="mx-clip-477-707-252-26-0"><rect x="477" y="707" width="252" height="26"/></clipPath><clipPath id="mx-clip-477-733-252-26-0"><rect x="477" y="733" width="252" height="26"/></clipPath><clipPath id="mx-clip-837-113-232-26-0"><rect x="837" y="113" width="232" height="26"/></clipPath><clipPath id="mx-clip-837-139-232-26-0"><rect x="837" y="139" width="232" height="26"/></clipPath><clipPath id="mx-clip-837-165-232-26-0"><rect x="837" y="165" width="232" height="26"/></clipPath><clipPath id="mx-clip-837-191-232-26-0"><rect x="837" y="191" width="232" height="26"/></clipPath><clipPath id="mx-clip-837-217-232-26-0"><rect x="837" y="217" width="232" height="26"/></clipPath><clipPath id="mx-clip-837-243-232-26-0"><rect x="837" y="243" width="232" height="26"/></clipPath><clipPath id="mx-clip-837-269-232-26-0"><rect x="837" y="269" width="232" height="26"/></clipPath><clipPath id="mx-clip-837-295-232-26-0"><rect x="837" y="295" width="232" height="26"/></clipPath><clipPath id="mx-clip-837-321-232-26-0"><rect x="837" y="321" width="232" height="26"/></clipPath><clipPath id="mx-clip-837-347-232-26-0"><rect x="837" y="347" width="232" height="26"/></clipPath><clipPath id="mx-clip-837-373-232-26-0"><rect x="837" y="373" width="232" height="26"/></clipPath><clipPath id="mx-clip-1177-61-222-26-0"><rect x="1177" y="61" width="222" height="26"/></clipPath><clipPath id="mx-clip-1177-87-222-26-0"><rect x="1177" y="87" width="222" height="26"/></clipPath><clipPath id="mx-clip-1177-113-222-26-0"><rect x="1177" y="113" width="222" height="26"/></clipPath><clipPath id="mx-clip-1177-139-222-26-0"><rect x="1177" y="139" width="222" height="26"/></clipPath><clipPath id="mx-clip-1177-165-222-26-0"><rect x="1177" y="165" width="222" height="26"/></clipPath><clipPath id="mx-clip-1177-191-222-26-0"><rect x="1177" y="191" width="222" height="26"/></clipPath><clipPath id="mx-clip-1177-217-222-26-0"><rect x="1177" y="217" width="222" height="26"/></clipPath><clipPath id="mx-clip-1177-243-222-26-0"><rect x="1177" y="243" width="222" height="26"/></clipPath><clipPath id="mx-clip-1177-269-222-26-0"><rect x="1177" y="269" width="222" height="26"/></clipPath><clipPath id="mx-clip-1177-295-222-26-0"><rect x="1177" y="295" width="222" height="26"/></clipPath><clipPath id="mx-clip-1177-321-222-26-0"><rect x="1177" y="321" width="222" height="26"/></clipPath><clipPath id="mx-clip-1177-347-222-26-0"><rect x="1177" y="347" width="222" height="26"/></clipPath><clipPath id="mx-clip-1177-373-222-26-0"><rect x="1177" y="373" width="222" height="26"/></clipPath><clipPath id="mx-clip-1177-399-222-26-0"><rect x="1177" y="399" width="222" height="26"/></clipPath><clipPath id="mx-clip-1177-425-222-26-0"><rect x="1177" y="425" width="222" height="26"/></clipPath><clipPath id="mx-clip-1177-451-222-26-0"><rect x="1177" y="451" width="222" height="26"/></clipPath><clipPath id="mx-clip-1177-477-222-26-0"><rect x="1177" y="477" width="222" height="26"/></clipPath><clipPath id="mx-clip-1527-126-242-26-0"><rect x="1527" y="126" width="242" height="26"/></clipPath><clipPath id="mx-clip-1527-152-242-26-0"><rect x="1527" y="152" width="242" height="26"/></clipPath><clipPath id="mx-clip-1527-178-242-26-0"><rect x="1527" y="178" width="242" height="26"/></clipPath><clipPath id="mx-clip-1527-204-242-26-0"><rect x="1527" y="204" width="242" height="26"/></clipPath><clipPath id="mx-clip-1527-230-242-26-0"><rect x="1527" y="230" width="242" height="26"/></clipPath><clipPath id="mx-clip-1527-256-242-26-0"><rect x="1527" y="256" width="242" height="26"/></clipPath><clipPath id="mx-clip-1527-282-242-26-0"><rect x="1527" y="282" width="242" height="26"/></clipPath><clipPath id="mx-clip-1527-308-242-26-0"><rect x="1527" y="308" width="242" height="26"/></clipPath><clipPath id="mx-clip-1527-334-242-26-0"><rect x="1527" y="334" width="242" height="26"/></clipPath><clipPath id="mx-clip-1527-360-242-26-0"><rect x="1527" y="360" width="242" height="26"/></clipPath><clipPath id="mx-clip-1527-386-242-26-0"><rect x="1527" y="386" width="242" height="26"/></clipPath><clipPath id="mx-clip-1527-412-242-26-0"><rect x="1527" y="412" width="242" height="26"/></clipPath><clipPath id="mx-clip-1527-438-242-26-0"><rect x="1527" y="438" width="242" height="26"/></clipPath><clipPath id="mx-clip-1527-464-242-26-0"><rect x="1527" y="464" width="242" height="26"/></clipPath><clipPath id="mx-clip-1527-490-242-26-0"><rect x="1527" y="490" width="242" height="26"/></clipPath><clipPath id="mx-clip-1527-516-242-26-0"><rect x="1527" y="516" width="242" height="26"/></clipPath><clipPath id="mx-clip-1527-542-242-26-0"><rect x="1527" y="542" width="242" height="26"/></clipPath><clipPath id="mx-clip-1527-568-242-26-0"><rect x="1527" y="568" width="242" height="26"/></clipPath><clipPath id="mx-clip-1527-594-242-26-0"><rect x="1527" y="594" width="242" height="26"/></clipPath></defs><path d="M 3 56 L 3 30 L 333 30 L 333 56" fill="none" stroke="#000000" stroke-miterlimit="10" pointer-events="none"/><path d="M 3 56 L 3 758 L 333 758 L 333 56" fill="#ffffff" stroke="#000000" stroke-miterlimit="10" pointer-events="none"/><path d="M 3 56 L 333 56" fill="none" stroke="#000000" stroke-miterlimit="10" pointer-events="none"/><g fill="#000000" font-family="Helvetica" text-anchor="middle" font-size="12px"><text x="167.5" y="47.5">web_client</text></g><g fill="#000000" font-family="Helvetica" clip-path="url(#mx-clip-7-61-322-26-0)" font-size="12px"><text x="8.5" y="73.5">unsigned long long id</text></g><g fill="#000000" font-family="Helvetica" clip-path="url(#mx-clip-7-87-322-26-0)" font-size="12px"><text x="8.5" y="99.5">WEB_CLIENT_FLAGS flags</text></g><g fill="#000000" font-family="Helvetica" clip-path="url(#mx-clip-7-113-322-26-0)" font-size="12px"><text x="8.5" y="125.5">WEB_CLIENT_MODE mode</text></g><g fill="#000000" font-family="Helvetica" clip-path="url(#mx-clip-7-139-322-26-0)" font-size="12px"><text x="8.5" y="151.5">WEB_CLIENT_ACL acl</text></g><g fill="#000000" font-family="Helvetica" clip-path="url(#mx-clip-7-165-322-26-0)" font-size="12px"><text x="8.5" y="177.5">size_t header_parse_tries</text></g><g fill="#000000" font-family="Helvetica" clip-path="url(#mx-clip-7-191-322-26-0)" font-size="12px"><text x="8.5" y="203.5">size_t header_parse_last_size</text></g><g fill="#000000" font-family="Helvetica" clip-path="url(#mx-clip-7-217-322-26-0)" font-size="12px"><text x="8.5" y="229.5">int tcp_cork</text></g><g fill="#000000" font-family="Helvetica" clip-path="url(#mx-clip-7-243-322-26-0)" font-size="12px"><text x="8.5" y="255.5">int ifd</text></g><g fill="#000000" font-family="Helvetica" clip-path="url(#mx-clip-7-269-322-26-0)" font-size="12px"><text x="8.5" y="281.5">int ofd</text></g><g fill="#000000" font-family="Helvetica" clip-path="url(#mx-clip-7-295-322-26-0)" font-size="12px"><text x="8.5" y="307.5">char client_ip[NI_MAXHOST+1}</text></g><g fill="#000000" font-family="Helvetica" clip-path="url(#mx-clip-7-321-322-26-0)" font-size="12px"><text x="8.5" y="333.5">char client_port[NI_MAXSERV+1]</text></g><g fill="#000000" font-family="Helvetica" clip-path="url(#mx-clip-7-347-322-26-0)" font-size="12px"><text x="8.5" y="359.5">char decoded_url[NETDATA_WEB_REQUEST_URL_SIZE+1</text></g><g fill="#000000" font-family="Helvetica" clip-path="url(#mx-clip-7-373-322-26-0)" font-size="12px"><text x="8.5" y="385.5">char last_url[NETDATA_WEB_REQUEST_URL_SIZE+1]</text></g><g fill="#000000" font-family="Helvetica" clip-path="url(#mx-clip-7-399-322-26-0)" font-size="12px"><text x="8.5" y="411.5">struct timeval tv_in, tv_ready</text></g><g fill="#000000" font-family="Helvetica" clip-path="url(#mx-clip-7-425-322-26-0)" font-size="12px"><text x="8.5" y="437.5">char cookie1[NETDATA_WEB_REQUEST_COOKIE_SIZE+1]</text></g><g fill="#000000" font-family="Helvetica" clip-path="url(#mx-clip-7-451-322-26-0)" font-size="12px"><text x="8.5" y="463.5">char cookie2[NETDATA_WEB_REQUEST_COOKIE_SIZE+1]</text></g><g fill="#000000" font-family="Helvetica" clip-path="url(#mx-clip-7-477-322-26-0)" font-size="12px"><text x="8.5" y="489.5">char origin[NETDATA_WEB_REQUEST_ORIGIN_HEADER_SIZE+1]</text></g><g fill="#000000" font-family="Helvetica" clip-path="url(#mx-clip-7-503-322-26-0)" font-size="12px"><text x="8.5" y="515.5">char *user_agent</text></g><g fill="#000000" font-family="Helvetica" clip-path="url(#mx-clip-7-529-322-26-0)" font-size="12px"><text x="8.5" y="541.5">struct response response</text></g><g fill="#000000" font-family="Helvetica" clip-path="url(#mx-clip-7-555-322-26-0)" font-size="12px"><text x="8.5" y="567.5">size_t stats_received_bytes</text></g><g fill="#000000" font-family="Helvetica" clip-path="url(#mx-clip-7-581-322-26-0)" font-size="12px"><text x="8.5" y="593.5">size_t stats_sent_bytes</text></g><path d="M 333 615 L 353 615 L 353 10 L 168 10 L 168 23.63" fill="none" stroke="#000000" stroke-miterlimit="10" pointer-events="none"/><path d="M 168 28.88 L 164.5 21.88 L 168 23.63 L 171.5 21.88 Z" fill="#000000" stroke="#000000" stroke-miterlimit="10" pointer-events="none"/><g fill="#000000" font-family="Helvetica" clip-path="url(#mx-clip-7-607-322-26-0)" font-size="12px"><text x="8.5" y="619.5">struct web_client *prev</text></g><path d="M 333 641 L 353 641 L 353 10 L 168 10 L 168 23.63" fill="none" stroke="#000000" stroke-miterlimit="10" pointer-events="none"/><path d="M 168 28.88 L 164.5 21.88 L 168 23.63 L 171.5 21.88 Z" fill="#000000" stroke="#000000" stroke-miterlimit="10" pointer-events="none"/><g transform="translate(304.5,299.5)"><switch><foreignObject style="overflow:visible;" pointer-events="all" width="102" height="12" requiredFeatures="http://www.w3.org/TR/SVG11/feature#Extensibility"><div xmlns="http://www.w3.org/1999/xhtml" style="display: inline-block; font-size: 12px; font-family: Helvetica; color: rgb(0, 0, 0); line-height: 1.2; vertical-align: top; white-space: nowrap; text-align: center;"><div xmlns="http://www.w3.org/1999/xhtml" style="display:inline-block;text-align:inherit;text-decoration:inherit;background-color:#ffffff;">double linked list of</div></div></foreignObject><text x="51" y="12" fill="#000000" text-anchor="middle" font-size="12px" font-family="Helvetica">double linked list of</text></switch></g><g fill="#000000" font-family="Helvetica" clip-path="url(#mx-clip-7-633-322-26-0)" font-size="12px"><text x="8.5" y="645.5">struct web_client *next</text></g><g fill="#000000" font-family="Helvetica" clip-path="url(#mx-clip-7-659-322-26-0)" font-size="12px"><text x="8.5" y="671.5">netdata_thread_t thread</text></g><g fill="#000000" font-family="Helvetica" clip-path="url(#mx-clip-7-685-322-26-0)" font-size="12px"><text x="8.5" y="697.5">volatile int running</text></g><g fill="#000000" font-family="Helvetica" clip-path="url(#mx-clip-7-711-322-26-0)" font-size="12px"><text x="8.5" y="723.5">size_t pollinfo_slot</text></g><g fill="#000000" font-family="Helvetica" clip-path="url(#mx-clip-7-737-322-26-0)" font-size="12px"><text x="8.5" y="749.5">size_t pollinfo_filecopy_slot</text></g><path d="M 473 160 L 473 134 L 733 134 L 733 160" fill="none" stroke="#000000" stroke-miterlimit="10" pointer-events="none"/><path d="M 473 160 L 473 472 L 733 472 L 733 160" fill="#ffffff" stroke="#000000" stroke-miterlimit="10" pointer-events="none"/><path d="M 473 160 L 733 160" fill="none" stroke="#000000" stroke-miterlimit="10" pointer-events="none"/><g fill="#000000" font-family="Helvetica" text-anchor="middle" font-size="12px"><text x="602.5" y="151.5">response</text></g><g fill="#000000" font-family="Helvetica" clip-path="url(#mx-clip-477-165-252-26-0)" font-size="12px"><text x="478.5" y="177.5">BUFFER *header</text></g><g fill="#000000" font-family="Helvetica" clip-path="url(#mx-clip-477-191-252-26-0)" font-size="12px"><text x="478.5" y="203.5">BUFFER *header_output</text></g><g fill="#000000" font-family="Helvetica" clip-path="url(#mx-clip-477-217-252-26-0)" font-size="12px"><text x="478.5" y="229.5">BUFFER *data</text></g><g fill="#000000" font-family="Helvetica" clip-path="url(#mx-clip-477-243-252-26-0)" font-size="12px"><text x="478.5" y="255.5">int code</text></g><g fill="#000000" font-family="Helvetica" clip-path="url(#mx-clip-477-269-252-26-0)" font-size="12px"><text x="478.5" y="281.5">size_t rlen</text></g><g fill="#000000" font-family="Helvetica" clip-path="url(#mx-clip-477-295-252-26-0)" font-size="12px"><text x="478.5" y="307.5">size_t sent</text></g><g fill="#000000" font-family="Helvetica" clip-path="url(#mx-clip-477-321-252-26-0)" font-size="12px"><text x="478.5" y="333.5">int zoutput</text></g><g fill="#000000" font-family="Helvetica" clip-path="url(#mx-clip-477-347-252-26-0)" font-size="12px"><text x="478.5" y="359.5">z_stream zstream</text></g><g fill="#000000" font-family="Helvetica" clip-path="url(#mx-clip-477-373-252-26-0)" font-size="12px"><text x="478.5" y="385.5">Bytef zbuffer[NETDATA_WEB_RESPONSE_ZLIB_CHUNK_SIZE]</text></g><g fill="#000000" font-family="Helvetica" clip-path="url(#mx-clip-477-399-252-26-0)" font-size="12px"><text x="478.5" y="411.5">size_t zsent</text></g><g fill="#000000" font-family="Helvetica" clip-path="url(#mx-clip-477-425-252-26-0)" font-size="12px"><text x="478.5" y="437.5">size_t zhave</text></g><g fill="#000000" font-family="Helvetica" clip-path="url(#mx-clip-477-451-252-26-0)" font-size="12px"><text x="478.5" y="463.5">unsigned int zinitialized</text></g><path d="M 333 537 L 403 537 L 403 114 L 603 114 L 603 127.63" fill="none" stroke="#000000" stroke-miterlimit="10" pointer-events="none"/><path d="M 603 132.88 L 599.5 125.88 L 603 127.63 L 606.5 125.88 Z" fill="#000000" stroke="#000000" stroke-miterlimit="10" pointer-events="none"/><path d="M 473 572 L 473 546 L 733 546 L 733 572" fill="none" stroke="#000000" stroke-miterlimit="10" pointer-events="none"/><path d="M 473 572 L 473 754 L 733 754 L 733 572" fill="#ffffff" stroke="#000000" stroke-miterlimit="10" pointer-events="none"/><path d="M 473 572 L 733 572" fill="none" stroke="#000000" stroke-miterlimit="10" pointer-events="none"/><g fill="#000000" font-family="Helvetica" text-anchor="middle" font-size="12px"><text x="602.5" y="563.5">clients_cache</text></g><g fill="#000000" font-family="Helvetica" clip-path="url(#mx-clip-477-577-252-26-0)" font-size="12px"><text x="478.5" y="589.5">pid_t pid</text></g><g fill="#000000" font-family="Helvetica" clip-path="url(#mx-clip-477-603-252-26-0)" font-size="12px"><text x="478.5" y="615.5">struct web_client *used</text></g><g fill="#000000" font-family="Helvetica" clip-path="url(#mx-clip-477-629-252-26-0)" font-size="12px"><text x="478.5" y="641.5">size_t used_count</text></g><g fill="#000000" font-family="Helvetica" clip-path="url(#mx-clip-477-655-252-26-0)" font-size="12px"><text x="478.5" y="667.5">struct web_client *avail</text></g><g fill="#000000" font-family="Helvetica" clip-path="url(#mx-clip-477-681-252-26-0)" font-size="12px"><text x="478.5" y="693.5">size_t avail_count</text></g><g fill="#000000" font-family="Helvetica" clip-path="url(#mx-clip-477-707-252-26-0)" font-size="12px"><text x="478.5" y="719.5">size_t reused</text></g><g fill="#000000" font-family="Helvetica" clip-path="url(#mx-clip-477-733-252-26-0)" font-size="12px"><text x="478.5" y="745.5">size_t allocated</text></g><path d="M 733 611 L 753 611 L 753 10 L 168 10 L 168 23.63" fill="none" stroke="#000000" stroke-miterlimit="10" pointer-events="none"/><path d="M 168 28.88 L 164.5 21.88 L 168 23.63 L 171.5 21.88 Z" fill="#000000" stroke="#000000" stroke-miterlimit="10" pointer-events="none"/><g transform="translate(724.5,12.5)"><switch><foreignObject style="overflow:visible;" pointer-events="all" width="57" height="11" requiredFeatures="http://www.w3.org/TR/SVG11/feature#Extensibility"><div xmlns="http://www.w3.org/1999/xhtml" style="display: inline-block; font-size: 11px; font-family: Helvetica; color: rgb(0, 0, 0); line-height: 1.2; vertical-align: top; white-space: nowrap; text-align: center;"><div xmlns="http://www.w3.org/1999/xhtml" style="display:inline-block;text-align:inherit;text-decoration:inherit;background-color:#ffffff;">linked list of</div></div></foreignObject><text x="29" y="11" fill="#000000" text-anchor="middle" font-size="11px" font-family="Helvetica">linked list of</text></switch></g><path d="M 733 663 L 753 663 L 753 10 L 168 10 L 168 23.63" fill="none" stroke="#000000" stroke-miterlimit="10" pointer-events="none"/><path d="M 168 28.88 L 164.5 21.88 L 168 23.63 L 171.5 21.88 Z" fill="#000000" stroke="#000000" stroke-miterlimit="10" pointer-events="none"/><g transform="translate(724.5,38.5)"><switch><foreignObject style="overflow:visible;" pointer-events="all" width="57" height="11" requiredFeatures="http://www.w3.org/TR/SVG11/feature#Extensibility"><div xmlns="http://www.w3.org/1999/xhtml" style="display: inline-block; font-size: 11px; font-family: Helvetica; color: rgb(0, 0, 0); line-height: 1.2; vertical-align: top; white-space: nowrap; text-align: center;"><div xmlns="http://www.w3.org/1999/xhtml" style="display:inline-block;text-align:inherit;text-decoration:inherit;background-color:#ffffff;">linked list of</div></div></foreignObject><text x="29" y="11" fill="#000000" text-anchor="middle" font-size="11px" font-family="Helvetica">linked list of</text></switch></g><path d="M 833 108 L 833 82 L 1073 82 L 1073 108" fill="none" stroke="#000000" stroke-miterlimit="10" pointer-events="none"/><path d="M 833 108 L 833 394 L 1073 394 L 1073 108" fill="#ffffff" stroke="#000000" stroke-miterlimit="10" pointer-events="none"/><path d="M 833 108 L 1073 108" fill="none" stroke="#000000" stroke-miterlimit="10" pointer-events="none"/><g fill="#000000" font-family="Helvetica" text-anchor="middle" font-size="12px"><text x="952.5" y="99.5">listen_sockets</text></g><g fill="#000000" font-family="Helvetica" clip-path="url(#mx-clip-837-113-232-26-0)" font-size="12px"><text x="838.5" y="125.5">struct config *config</text></g><g fill="#000000" font-family="Helvetica" clip-path="url(#mx-clip-837-139-232-26-0)" font-size="12px"><text x="838.5" y="151.5">const char *config_section</text></g><g fill="#000000" font-family="Helvetica" clip-path="url(#mx-clip-837-165-232-26-0)" font-size="12px"><text x="838.5" y="177.5">const char *default_bind_to</text></g><g fill="#000000" font-family="Helvetica" clip-path="url(#mx-clip-837-191-232-26-0)" font-size="12px"><text x="838.5" y="203.5">uint16_t default_port</text></g><g fill="#000000" font-family="Helvetica" clip-path="url(#mx-clip-837-217-232-26-0)" font-size="12px"><text x="838.5" y="229.5">int backlog</text></g><g fill="#000000" font-family="Helvetica" clip-path="url(#mx-clip-837-243-232-26-0)" font-size="12px"><text x="838.5" y="255.5">size_t opened</text></g><g fill="#000000" font-family="Helvetica" clip-path="url(#mx-clip-837-269-232-26-0)" font-size="12px"><text x="838.5" y="281.5">size_t failed</text></g><g fill="#000000" font-family="Helvetica" clip-path="url(#mx-clip-837-295-232-26-0)" font-size="12px"><text x="838.5" y="307.5">int fds[MAX_LISTEN_FDS]</text></g><g fill="#000000" font-family="Helvetica" clip-path="url(#mx-clip-837-321-232-26-0)" font-size="12px"><text x="838.5" y="333.5">int *fds_names[MAX_LISTEN_FDS]</text></g><g fill="#000000" font-family="Helvetica" clip-path="url(#mx-clip-837-347-232-26-0)" font-size="12px"><text x="838.5" y="359.5">int fds_types[MAX_LISTEN_FDS]</text></g><g fill="#000000" font-family="Helvetica" clip-path="url(#mx-clip-837-373-232-26-0)" font-size="12px"><text x="838.5" y="385.5">int fds_families[MAX_LISTEN_FDS]</text></g><path d="M 1173 56 L 1173 30 L 1403 30 L 1403 56" fill="none" stroke="#000000" stroke-miterlimit="10" pointer-events="none"/><path d="M 1173 56 L 1173 498 L 1403 498 L 1403 56" fill="none" stroke="#000000" stroke-miterlimit="10" pointer-events="none"/><path d="M 1173 56 L 1403 56" fill="none" stroke="#000000" stroke-miterlimit="10" pointer-events="none"/><g fill="#000000" font-family="Helvetica" text-anchor="middle" font-size="12px"><text x="1287.5" y="47.5">POLLINFO</text></g><g fill="#000000" font-family="Helvetica" clip-path="url(#mx-clip-1177-61-222-26-0)" font-size="12px"><text x="1178.5" y="73.5">POLLJOB *p</text></g><g fill="#000000" font-family="Helvetica" clip-path="url(#mx-clip-1177-87-222-26-0)" font-size="12px"><text x="1178.5" y="99.5">size_t slot</text></g><g fill="#000000" font-family="Helvetica" clip-path="url(#mx-clip-1177-113-222-26-0)" font-size="12px"><text x="1178.5" y="125.5">int fd</text></g><g fill="#000000" font-family="Helvetica" clip-path="url(#mx-clip-1177-139-222-26-0)" font-size="12px"><text x="1178.5" y="151.5">int socktype</text></g><g fill="#000000" font-family="Helvetica" clip-path="url(#mx-clip-1177-165-222-26-0)" font-size="12px"><text x="1178.5" y="177.5">char *client_ip</text></g><g fill="#000000" font-family="Helvetica" clip-path="url(#mx-clip-1177-191-222-26-0)" font-size="12px"><text x="1178.5" y="203.5">char *client_port</text></g><g fill="#000000" font-family="Helvetica" clip-path="url(#mx-clip-1177-217-222-26-0)" font-size="12px"><text x="1178.5" y="229.5">time_t connected_t</text></g><g fill="#000000" font-family="Helvetica" clip-path="url(#mx-clip-1177-243-222-26-0)" font-size="12px"><text x="1178.5" y="255.5">time_t last_received_t</text></g><g fill="#000000" font-family="Helvetica" clip-path="url(#mx-clip-1177-269-222-26-0)" font-size="12px"><text x="1178.5" y="281.5">time_t last_sent_t</text></g><g fill="#000000" font-family="Helvetica" clip-path="url(#mx-clip-1177-295-222-26-0)" font-size="12px"><text x="1178.5" y="307.5">size_t recv_count</text></g><g fill="#000000" font-family="Helvetica" clip-path="url(#mx-clip-1177-321-222-26-0)" font-size="12px"><text x="1178.5" y="333.5">size_t send_count</text></g><g fill="#000000" font-family="Helvetica" clip-path="url(#mx-clip-1177-347-222-26-0)" font-size="12px"><text x="1178.5" y="359.5">uint32_t flags</text></g><g fill="#000000" font-family="Helvetica" clip-path="url(#mx-clip-1177-373-222-26-0)" font-size="12px"><text x="1178.5" y="385.5">void (*del_callback)</text></g><g fill="#000000" font-family="Helvetica" clip-path="url(#mx-clip-1177-399-222-26-0)" font-size="12px"><text x="1178.5" y="411.5">int (*rcv_callback)</text></g><g fill="#000000" font-family="Helvetica" clip-path="url(#mx-clip-1177-425-222-26-0)" font-size="12px"><text x="1178.5" y="437.5">int (*snd_callback)</text></g><g fill="#000000" font-family="Helvetica" clip-path="url(#mx-clip-1177-451-222-26-0)" font-size="12px"><text x="1178.5" y="463.5">void *data</text></g><path d="M 1403 485 L 1423 485 L 1423 10 L 1279 10 L 1279 22.63" fill="none" stroke="#000000" stroke-miterlimit="10" pointer-events="none"/><path d="M 1279 27.88 L 1275.5 20.88 L 1279 22.63 L 1282.5 20.88 Z" fill="#000000" stroke="#000000" stroke-miterlimit="10" pointer-events="none"/><g fill="#000000" font-family="Helvetica" clip-path="url(#mx-clip-1177-477-222-26-0)" font-size="12px"><text x="1178.5" y="489.5">struct pollinfo *next</text></g><path d="M 1523 121 L 1523 95 L 1773 95 L 1773 121" fill="none" stroke="#000000" stroke-miterlimit="10" pointer-events="none"/><path d="M 1523 121 L 1523 615 L 1773 615 L 1773 121" fill="none" stroke="#000000" stroke-miterlimit="10" pointer-events="none"/><path d="M 1523 121 L 1773 121" fill="none" stroke="#000000" stroke-miterlimit="10" pointer-events="none"/><g fill="#000000" font-family="Helvetica" text-anchor="middle" font-size="12px"><text x="1647.5" y="112.5">POLLJOB</text></g><g fill="#000000" font-family="Helvetica" clip-path="url(#mx-clip-1527-126-242-26-0)" font-size="12px"><text x="1528.5" y="138.5">size_t slots</text></g><g fill="#000000" font-family="Helvetica" clip-path="url(#mx-clip-1527-152-242-26-0)" font-size="12px"><text x="1528.5" y="164.5">size_t used</text></g><g fill="#000000" font-family="Helvetica" clip-path="url(#mx-clip-1527-178-242-26-0)" font-size="12px"><text x="1528.5" y="190.5">size_t min</text></g><g fill="#000000" font-family="Helvetica" clip-path="url(#mx-clip-1527-204-242-26-0)" font-size="12px"><text x="1528.5" y="216.5">size_t max</text></g><g fill="#000000" font-family="Helvetica" clip-path="url(#mx-clip-1527-230-242-26-0)" font-size="12px"><text x="1528.5" y="242.5">size_t limit</text></g><g fill="#000000" font-family="Helvetica" clip-path="url(#mx-clip-1527-256-242-26-0)" font-size="12px"><text x="1528.5" y="268.5">time_t complete_request_timeout</text></g><g fill="#000000" font-family="Helvetica" clip-path="url(#mx-clip-1527-282-242-26-0)" font-size="12px"><text x="1528.5" y="294.5">time_t idle_timeout</text></g><g fill="#000000" font-family="Helvetica" clip-path="url(#mx-clip-1527-308-242-26-0)" font-size="12px"><text x="1528.5" y="320.5">time_t check_every</text></g><g fill="#000000" font-family="Helvetica" clip-path="url(#mx-clip-1527-334-242-26-0)" font-size="12px"><text x="1528.5" y="346.5">time_t timer_milliseconds</text></g><g fill="#000000" font-family="Helvetica" clip-path="url(#mx-clip-1527-360-242-26-0)" font-size="12px"><text x="1528.5" y="372.5">void *timer_data</text></g><g fill="#000000" font-family="Helvetica" clip-path="url(#mx-clip-1527-386-242-26-0)" font-size="12px"><text x="1528.5" y="398.5">struct pollfd *fds</text></g><g fill="#000000" font-family="Helvetica" clip-path="url(#mx-clip-1527-412-242-26-0)" font-size="12px"><text x="1528.5" y="424.5">struct pollinfo *inf</text></g><g fill="#000000" font-family="Helvetica" clip-path="url(#mx-clip-1527-438-242-26-0)" font-size="12px"><text x="1528.5" y="450.5">struct pollinfo *first_free</text></g><g fill="#000000" font-family="Helvetica" clip-path="url(#mx-clip-1527-464-242-26-0)" font-size="12px"><text x="1528.5" y="476.5">SIMPLE_PATTERN *access_list</text></g><g fill="#000000" font-family="Helvetica" clip-path="url(#mx-clip-1527-490-242-26-0)" font-size="12px"><text x="1528.5" y="502.5">void *(*add_callback)</text></g><g fill="#000000" font-family="Helvetica" clip-path="url(#mx-clip-1527-516-242-26-0)" font-size="12px"><text x="1528.5" y="528.5">void (*dell_callback)</text></g><g fill="#000000" font-family="Helvetica" clip-path="url(#mx-clip-1527-542-242-26-0)" font-size="12px"><text x="1528.5" y="554.5">int (*rcv_callback)</text></g><g fill="#000000" font-family="Helvetica" clip-path="url(#mx-clip-1527-568-242-26-0)" font-size="12px"><text x="1528.5" y="580.5">int (*snd_callback)</text></g><g fill="#000000" font-family="Helvetica" clip-path="url(#mx-clip-1527-594-242-26-0)" font-size="12px"><text x="1528.5" y="606.5">void (*tmr_callback)</text></g><path d="M 1403 69 L 1648 69 L 1648 88.63" fill="none" stroke="#000000" stroke-miterlimit="10" pointer-events="none"/><path d="M 1648 93.88 L 1644.5 86.88 L 1648 88.63 L 1651.5 86.88 Z" fill="#000000" stroke="#000000" stroke-miterlimit="10" pointer-events="none"/><path d="M 1773 420 L 1793 420 L 1793 10 L 1279 10 L 1279 22.63" fill="none" stroke="#000000" stroke-miterlimit="10" pointer-events="none"/><path d="M 1279 27.88 L 1275.5 20.88 L 1279 22.63 L 1282.5 20.88 Z" fill="#000000" stroke="#000000" stroke-miterlimit="10" pointer-events="none"/><path d="M 1773 446 L 1793 446 L 1793 10 L 1278 10 L 1278 22.63" fill="none" stroke="#000000" stroke-miterlimit="10" pointer-events="none"/><path d="M 1278 27.88 L 1274.5 20.88 L 1278 22.63 L 1281.5 20.88 Z" fill="#000000" stroke="#000000" stroke-miterlimit="10" pointer-events="none"/></svg>
\ No newline at end of file diff --git a/doc/Add-more-charts-to-netdata.md b/doc/Add-more-charts-to-netdata.md new file mode 100644 index 000000000..1512a25e7 --- /dev/null +++ b/doc/Add-more-charts-to-netdata.md @@ -0,0 +1,429 @@ +# Add more charts to netdata + +netdata collects system metrics by itself. It has many [internal plugins](../collectors) for collecting most of the metrics presented by default when it starts, collecting data from `/proc`, `/sys` and other Linux kernel sources. + +To collect non-system metrics, netdata supports a plugin architecture. The following are the currently available external plugins: + +- **[Web Servers](#web-servers)**, such as apache, nginx, nginx_plus, tomcat, litespeed +- **[Web Logs](#web-log-parsers)**, such as apache, nginx, lighttpd, gunicorn, squid access logs, apache cache.log +- **[Load Balancers](#load-balancers)**, like haproxy +- **[Message Brokers](#message-brokers)**, like rabbitmq, beanstalkd +- **[Database Servers](#database-servers)**, such as mysql, mariadb, postgres, couchdb, mongodb, rethinkdb +- **[Social Sharing Servers](#social-sharing-servers)**, like retroshare +- **[Proxy Servers](#proxy-servers)**, like squid +- **[HTTP accelerators](#http-accelerators)**, like varnish cache +- **[Search engines](#search-engines)**, like elasticsearch +- **[Name Servers](#name-servers)** (DNS), like bind, nsd, powerdns, dnsdist +- **[DHCP Servers](#dhcp-servers)**, like ISC DHCP +- **[UPS](#ups)**, such as APC UPS, NUT +- **[RAID](#raid)**, such as linux software raid (mdadm), MegaRAID +- **[Mail Servers](#mail-servers)**, like postfix, exim, dovecot +- **[File Servers](#file-servers)**, like samba, NFS, ftp, sftp, WebDAV +- **[System](#system)**, for processes and other system metrics +- **[Sensors](#sensors)**, like temperature, fans speed, voltage, humidity, HDD/SSD S.M.A.R.T attributes +- **[Network](#network)**, such as SNMP devices, `fping`, access points, dns_query_time +- **[Time Servers](#time-servers)**, like chrony +- **[Security](#security)**, like FreeRADIUS, OpenVPN, Fail2ban +- **[Telephony Servers](#telephony-servers)**, like openSIPS +- **[Go applications](#go-applications)** +- **[Household appliances](#household-appliances)**, like SMA WebBox (solar power), Fronius Symo solar power, Stiebel Eltron heating +- **[Java Processes](#java-processes)**, via JMX or Spring Boot Actuator +- **[Provisioning Systems](#provisioning-systems)**, like Puppet +- **[Game Servers](#game-servers)**, like SpigotMC +- **[Distributed Computing Clients](#distributed-computing-clients)**, like BOINC +- **[Skeleton Plugins](#skeleton-plugins)**, for writing your own data collectors + +Check also [Third Party Plugins](Third-Party-Plugins.md) for a list of plugins distributed by third parties. + +## configuring plugins + +netdata comes with **internal** and **external** plugins: + +1. The **internal** ones are written in `C` and run as threads within the netdata daemon. +2. The **external** ones can be written in any computer language. The netdata daemon spawns these as processes (shown with `ps fax`) and reads their metrics using pipes (so the `stdout` of external plugins is connected to netdata for metrics collection and the `stderr` of external plugins is connected to `/var/log/netdata/error.log`). + +To make it easier to develop plugins, and minimize the number of threads and processes running, netdata supports **plugin orchestrators**, each of them supporting one or more data collection **modules**. Currently we ship plugin orchestrators for 4 languages: `C`, `python`, `node.js` and `bash` and 2 more are under development (`go` and `java`). + +#### enabling and disabling plugins + +To control which plugins netdata run, edit `netdata.conf` and check the `[plugins]` section. It looks like this: + +``` +[plugins] + # enable running new plugins = yes + # check for new plugins every = 60 + # proc = yes + # diskspace = yes + # cgroups = yes + # tc = yes + # nfacct = yes + # idlejitter = yes + # freeipmi = yes + # node.d = yes + # python.d = yes + # fping = yes + # charts.d = yes + # apps = yes +``` + +The default for all plugins is the option `enable running new plugins`. So, setting this to `no` will disable all the plugins, except the ones specifically enabled. + +#### enabling and disabling modules + +Each of the **plugins** may support one or more data collection **modules**. To control which of its modules run, you have to consult the configuration of the **plugin** (see table below). + +#### modules configuration + +Most **modules** come with **auto-detection**, configured to work out-of-the-box on popular operating systems with the default settings. + +However, there are cases that auto-detection fails. Usually the reason is that the applications to be monitored do not allow netdata to connect. In most of the cases, allowing the user `netdata` from `localhost` to connect and collect metrics, will automatically enable data collection for the application in question (it will require a netdata restart). + +You can verify netdata **external plugins and their modules** are able to collect metrics, following this procedure: + +```sh +# become user netdata +sudo su -s /bin/bash netdata + +# execute the plugin in debug mode, for a specific module. +# example for the python plugin, mysql module: +/usr/libexec/netdata/plugins.d/python.d.plugin 1 debug trace mysql +``` + +Similarly, you can use `charts.d.plugin` for BASH plugins and `node.d.plugin` for node.js plugins. +Other plugins (like `apps.plugin`, `freeipmi.plugin`, `fping.plugin`) use the native netdata plugin API and can be run directly. + +If you need to configure a netdata plugin or module, all user supplied configuration is kept at `/etc/netdata` while the stock versions of all files is at `/usr/lib/netdata/conf.d`. +To copy a stock file and edit it, run `/etc/netdata/edit-config`. Running this command without an argument, will list the available stock files. + +Each file should provide plenty of examples and documentation about each module and plugin. + +This is a map of the all supported configuration options: + +#### map of configuration files + +plugin | language | plugin<br/>configuration | modules<br/>configuration | +---:|:---:|:---:|:---| +`apps.plugin`<br/>(external plugin for monitoring the process tree on Linux and FreeBSD)|`C`|`netdata.conf` section `[plugin:apps]`|Custom configuration for the processes to be monitored at `apps_groups.conf` +`freebsd.plugin`<br/>(internal plugin for monitoring FreeBSD system resources)|`C`|`netdata.conf` section `[plugin:freebsd]`|one section for each module `[plugin:freebsd:MODULE]`. Each module may provide additional sections in the form of `[plugin:freebsd:MODULE:SUBSECTION]`. +`cgroups.plugin`<br/>(internal plugin for monitoring Linux containers, VMs and systemd services)|`C`|`netdata.conf` section `[plugin:cgroups]`|N/A +`charts.d.plugin`<br/>(external plugin orchestrator for BASH modules)|`BASH`|`charts.d.conf`|a file for each module in `/etc/netdata/charts.d/` +`diskspace.plugin`<br/>(internal plugin for collecting Linux mount points usage)|`C`|`netdata.conf` section `[plugin:diskspace]`|N/A +`fping.plugin`<br/>(external plugin for collecting network latencies)|`C`|`fping.conf`|This plugin is a wrapper for the `fping` command. +`freeipmi.plugin`<br/>(external plugin for collecting IPMI h/w sensors)|`C`|`netdata.conf` section `[plugin:freeipmi]` +`idlejitter.plugin`<br/>(internal plugin for monitoring CPU jitter)|`C`|N/A|N/A +`macos.plugin`<br/>(internal plugin for monitoring MacOS system resources)|`C`|`netdata.conf` section `[plugin:macos]`|one section for each module `[plugin:macos:MODULE]`. Each module may provide additional sections in the form of `[plugin:macos:MODULE:SUBSECTION]`. +`node.d.plugin`<br/>(external plugin orchestrator of node.js modules)|`node.js`|`node.d.conf`|a file for each module in `/etc/netdata/node.d/`. +`proc.plugin`<br/>(internal plugin for monitoring Linux system resources)|`C`|`netdata.conf` section `[plugin:proc]`|one section for each module `[plugin:proc:MODULE]`. Each module may provide additional sections in the form of `[plugin:proc:MODULE:SUBSECTION]`. +`python.d.plugin`<br/>(external plugin orchestrator for running python modules)|`python`<br/>v2 or v3<br/>both are supported|`python.d.conf`|a file for each module in `/etc/netdata/python.d/`. +`statsd.plugin`<br/>(internal plugin for collecting statsd metrics)|`C`|`netdata.conf` section `[statsd]`|Synthetic statsd charts can be configured with files in `/etc/netdata/statsd.d/`. +`tc.plugin`<br/>(internal plugin for collecting Linux traffic QoS)|`C`|`netdata.conf` section `[plugin:tc]`|The plugin runs an external helper called `tc-qos-helper.sh` to interface with the `tc` command. This helper supports a few additional options using `tc-qos-helper.conf`. + + +## writing data collection modules + +You can add custom plugins following the [External Plugins Guide](../collectors/plugins.d/). + +--- + +## available data collection modules + +These are all the data collection plugins currently available. + +### Web Servers + +application|language|notes| +:---------:|:------:|:----| +apache|python<br/>v2 or v3|Connects to multiple apache servers (local or remote) to collect real-time performance metrics.<br/> <br/>netdata plugin: [python.d.plugin](../collectors/python.d.plugin)<br/>plugin module: [apache.chart.py](../collectors/python.d.plugin/apache)<br/>configuration file: [python.d/apache.conf](../collectors/python.d.plugin/apache)| +apache|BASH<br/>Shell Script|Connects to an apache server (local or remote) to collect real-time performance metrics.<br/><br/>DEPRECATED IN FAVOR OF THE PYTHON ONE. It is still supplied only as an example module to shell scripting plugins.<br/> <br/>netdata plugin: [charts.d.plugin](../collectors/charts.d.plugin#chartsdplugin)<br/>plugin module: [apache.chart.sh](../collectors/charts.d.plugin/apache)<br/>configuration file: [charts.d/apache.conf](../collectors/charts.d.plugin/apache)| +ipfs|python<br/>v2 or v3|Connects to multiple ipfs servers (local or remote) to collect real-time performance metrics.<br/> <br/>netdata plugin: [python.d.plugin](../collectors/python.d.plugin)<br/>plugin module: [ipfs.chart.py](../collectors/python.d.plugin/ipfs)<br/>configuration file: [python.d/ipfs.conf](../collectors/python.d.plugin/ipfs)| +litespeed|python<br/>v2 or v3|reads the litespeed `rtreport` files to collect metrics.<br/> <br/>netdata plugin: [python.d.plugin](../collectors/python.d.plugin)<br/>plugin module: [litespeed.chart.py](../collectors/python.d.plugin/litespeed)<br/>configuration file: [python.d/litespeed.conf](../collectors/python.d.plugin/litespeed) +nginx|python<br/>v2 or v3|Connects to multiple nginx servers (local or remote) to collect real-time performance metrics.<br/> <br/>netdata plugin: [python.d.plugin](../collectors/python.d.plugin)<br/>plugin module: [nginx.chart.py](../collectors/python.d.plugin/nginx)<br/>configuration file: [python.d/nginx.conf](../collectors/python.d.plugin/nginx)| +nginx_plus|python<br/>v2 or v3|Connects to multiple nginx_plus servers (local or remote) to collect real-time performance metrics.<br/> <br/>netdata plugin: [python.d.plugin](../collectors/python.d.plugin)<br/>plugin module: [nginx_plus.chart.py](../collectors/python.d.plugin/nginx_plus)<br/>configuration file: [python.d/nginx_plus.conf](../collectors/python.d.plugin/nginx_plus)| +nginx|BASH<br/>Shell Script|Connects to an nginx server (local or remote) to collect real-time performance metrics.<br/><br/>DEPRECATED IN FAVOR OF THE PYTHON ONE. It is still supplied only as an example module to shell scripting plugins.<br/> <br/>netdata plugin: [charts.d.plugin](../collectors/charts.d.plugin#chartsdplugin)<br/>plugin module: [nginx.chart.sh](../collectors/charts.d.plugin/nginx)<br/>configuration file: [charts.d/nginx.conf](../collectors/charts.d.plugin/nginx)| +phpfpm|python<br/>v2 or v3|Connects to multiple phpfpm servers (local or remote) to collect real-time performance metrics.<br/> <br/>netdata plugin: [python.d.plugin](../collectors/python.d.plugin)<br/>plugin module: [phpfpm.chart.py](../collectors/python.d.plugin/phpfpm)<br/>configuration file: [python.d/phpfpm.conf](../collectors/python.d.plugin/phpfpm)| +phpfpm|BASH<br/>Shell Script|Connects to one or more phpfpm servers (local or remote) to collect real-time performance metrics.<br/><br/>DEPRECATED IN FAVOR OF THE PYTHON ONE. It is still supplied only as an example module to shell scripting plugins.<br/> <br/>netdata plugin: [charts.d.plugin](../collectors/charts.d.plugin#chartsdplugin)<br/>plugin module: [phpfpm.chart.sh](../collectors/charts.d.plugin/phpfpm)<br/>configuration file: [charts.d/phpfpm.conf](../collectors/charts.d.plugin/phpfpm)| +tomcat|python<br/>v2 or v3|Connects to multiple tomcat servers (local or remote) to collect real-time performance metrics.<br/> <br/>netdata plugin: [python.d.plugin](../collectors/python.d.plugin)<br/>plugin module: [tomcat.chart.py](../collectors/python.d.plugin/tomcat)<br/>configuration file: [python.d/tomcat.conf](../collectors/python.d.plugin/tomcat)| +tomcat|BASH<br/>Shell Script|Connects to a tomcat server (local or remote) to collect real-time performance metrics.<br/><br/>DEPRECATED IN FAVOR OF THE PYTHON ONE. It is still supplied only as an example module to shell scripting plugins.<br/> <br/>netdata plugin: [charts.d.plugin](../collectors/charts.d.plugin#chartsdplugin)<br/>plugin module: [tomcat.chart.sh](../collectors/charts.d.plugin/tomcat)<br/>configuration file: [charts.d/tomcat.conf](../collectors/charts.d.plugin/tomcat)| + + +--- + +### Web Log Parsers + +application|language|notes| +:---------:|:------:|:----| +web_log|python<br/>v2 or v3|powerful plugin, capable of incrementally parsing any number of web server log files <br/> <br/>netdata plugin: [python.d.plugin](../collectors/python.d.plugin)<br/>plugin module: [web_log.chart.py](../collectors/python.d.plugin/web_log)<br/>configuration file: [python.d/web_log.conf](../collectors/python.d.plugin/web_log)| + + +--- + +### Database Servers + +application|language|notes| +:---------:|:------:|:----| +couchdb|python<br/>v2 or v3|Connects to multiple couchdb servers (local or remote) to collect real-time performance metrics.<br/> <br/>netdata plugin: [python.d.plugin](../collectors/python.d.plugin)<br/>plugin module: [couchdb.chart.py](../collectors/python.d.plugin/couchdb)<br/>configuration file: [python.d/couchdb.conf](../collectors/python.d.plugin/couchdb)| +memcached|python<br/>v2 or v3|Connects to multiple memcached servers (local or remote) to collect real-time performance metrics.<br/> <br/>netdata plugin: [python.d.plugin](../collectors/python.d.plugin)<br/>plugin module: [memcached.chart.py](../collectors/python.d.plugin/memcached)<br/>configuration file: [python.d/memcached.conf](../collectors/python.d.plugin/memcached)| +mongodb|python<br/>v2 or v3|Connects to multiple `mongodb` servers (local or remote) to collect real-time performance metrics.<br/> <br/>Requires package `python-pymongo`.<br/> <br/>netdata plugin: [python.d.plugin](../collectors/python.d.plugin)<br/>plugin module: [mongodb.chart.py](../collectors/python.d.plugin/mongodb)<br/>configuration file: [python.d/mongodb.conf](../collectors/python.d.plugin/mongodb)| +mysql<br/>mariadb|python<br/>v2 or v3|Connects to multiple mysql or mariadb servers (local or remote) to collect real-time performance metrics.<br/> <br/>Requires package `python-mysqldb` (faster and preferred), or `python-pymysql`. <br/> <br/>netdata plugin: [python.d.plugin](../collectors/python.d.plugin)<br/>plugin module: [mysql.chart.py](../collectors/python.d.plugin/mysql)<br/>configuration file: [python.d/mysql.conf](../collectors/python.d.plugin/mysql)| +mysql<br/>mariadb|BASH<br/>Shell Script|Connects to multiple mysql or mariadb servers (local or remote) to collect real-time performance metrics.<br/><br/>DEPRECATED IN FAVOR OF THE PYTHON ONE. It is still supplied only as an example module to shell scripting plugins.<br/> <br/>netdata plugin: [charts.d.plugin](../collectors/charts.d.plugin#chartsdplugin)<br/>plugin module: [mysql.chart.sh](../collectors/charts.d.plugin/mysql)<br/>configuration file: [charts.d/mysql.conf](../collectors/charts.d.plugin/mysql)| +postgres|python<br/>v2 or v3|Connects to multiple postgres servers (local or remote) to collect real-time performance metrics.<br/> <br/>Requires package `python-psycopg2`.<br/> <br/>netdata plugin: [python.d.plugin](../collectors/python.d.plugin)<br/>plugin module: [postgres.chart.py](../collectors/python.d.plugin/postgres)<br/>configuration file: [python.d/postgres.conf](../collectors/python.d.plugin/postgres)| +redis|python<br/>v2 or v3|Connects to multiple redis servers (local or remote) to collect real-time performance metrics.<br/> <br/>netdata plugin: [python.d.plugin](../collectors/python.d.plugin)<br/>plugin module: [redis.chart.py](../collectors/python.d.plugin/redis)<br/>configuration file: [python.d/redis.conf](../collectors/python.d.plugin/redis)| +rethinkdb|python<br/>v2 or v3|Connects to multiple rethinkdb servers (local or remote) to collect real-time metrics.<br/> <br/>netdata plugin: [python.d.plugin](../collectors/python.d.plugin)<br/>plugin module: [rethinkdb.chart.py](../collectors/python.d.plugin/rethinkdbs)<br/>configuration file: [python.d/rethinkdb.conf](../collectors/python.d.plugin/rethinkdbs)| + + +--- + +### Social Sharing Servers + +application|language|notes| +:---------:|:------:|:----| +retroshare|python<br/>v2 or v3|Connects to multiple retroshare servers (local or remote) to collect real-time performance metrics.<br/> <br/>netdata plugin: [python.d.plugin](../collectors/python.d.plugin)<br/>plugin module: [retroshare.chart.py](../collectors/python.d.plugin/retroshare)<br/>configuration file: [python.d/retroshare.conf](../collectors/python.d.plugin/retroshare)| + + +--- + +### Proxy Servers + +application|language|notes| +:---------:|:------:|:----| +squid|python<br/>v2 or v3|Connects to multiple squid servers (local or remote) to collect real-time performance metrics.<br/> <br/>netdata plugin: [python.d.plugin](../collectors/python.d.plugin)<br/>plugin module: [squid.chart.py](../collectors/python.d.plugin/squid)<br/>configuration file: [python.d/squid.conf](../collectors/python.d.plugin/squid)| +squid|BASH<br/>Shell Script|Connects to a squid server (local or remote) to collect real-time performance metrics.<br/><br/>DEPRECATED IN FAVOR OF THE PYTHON ONE. It is still supplied only as an example module to shell scripting plugins.<br/> <br/>netdata plugin: [charts.d.plugin](../collectors/charts.d.plugin#chartsdplugin)<br/>plugin module: [squid.chart.sh](../collectors/charts.d.plugin/squid)<br/>configuration file: [charts.d/squid.conf](../collectors/charts.d.plugin/squid)| + + +--- + +### HTTP Accelerators + +application|language|notes| +:---------:|:------:|:----| +varnish|python<br/>v2 or v3|Uses the varnishstat command to provide varnish cache statistics (client metrics, cache perfomance, thread-related metrics, backend health, memory usage etc.).<br/> <br/>netdata plugin: [python.d.plugin](../collectors/python.d.plugin)<br/>plugin module: [varnish.chart.py](../collectors/python.d.plugin/varnish)<br/>configuration file: [python.d/varnish.conf](../collectors/python.d.plugin/varnish)| + + +--- + +### Search Engines + +application|language|notes| +:---------:|:------:|:----| +elasticsearch|python<br/>v2 or v3|Monitor elasticsearch performance and health metrics.<br/> <br/>netdata plugin: [python.d.plugin](../collectors/python.d.plugin)<br/>plugin module: [elasticsearch.chart.py](../collectors/python.d.plugin/elasticsearch)<br/>configuration file: [python.d/elasticsearch.conf](../collectors/python.d.plugin/elasticsearch)| + + +--- + +### Name Servers + +application|language|notes| +:---------:|:------:|:----| +named|node.js|Connects to multiple named (ISC-Bind) servers (local or remote) to collect real-time performance metrics. All versions of bind after 9.9.10 are supported.<br/> <br/>netdata plugin: [node.d.plugin](../collectors/node.d.plugin#nodedplugin)<br/>plugin module: [named.node.js](../collectors/node.d.plugin/named)<br/>configuration file: [node.d/named.conf](../collectors/node.d.plugin/named)| +bind_rndc|python<br/>v2 or v3|Parses named.stats dump file to collect real-time performance metrics. All versions of bind after 9.6 are supported.<br/> <br/>netdata plugin: [python.d.plugin](../collectors/python.d.plugin)<br/>plugin module: [bind_rndc.chart.py](../collectors/python.d.plugin/bind_rndc)<br/>configuration file: [python.d/bind_rndc.conf](../collectors/python.d.plugin/bind_rndc)| +nsd|python<br/>v2 or v3|Charts the nsd received queries and zones.<br/> <br/>netdata plugin: [python.d.plugin](../collectors/python.d.plugin)<br/>plugin module: [nsd.chart.py](../collectors/python.d.plugin/nsd)<br/>configuration file: [python.d/nsd.conf](../collectors/python.d.plugin/nsd) +powerdns|python<br/>v2 or v3|Monitors powerdns performance and health metrics <br/> <br/>netdata plugin: [python.d.plugin](../collectors/python.d.plugin)<br/>plugin module: [powerdns.chart.py](../collectors/python.d.plugin/powerdns)<br/>configuration file: [python.d/powerdns.conf](../collectors/python.d.plugin/powerdns)| +dnsdist|python<br/>v2 or v3|Monitors dnsdist performance and health metrics <br/> <br/>netdata plugin: [python.d.plugin](../collectors/python.d.plugin)<br/>plugin module: [dnsdist.chart.py](../collectors/python.d.plugin/dnsdist)<br/>configuration file: [python.d/dnsdist.conf](../collectors/python.d.plugin/dnsdist)| +unbound|python<br/>v2 or v3|Monitors Unbound performance and resource usage metrics <br/> <br/>netdata plugin: [python.d.plugin](../collectors/python.d.plugin)<br/>plugin module: [unbound.chart.py](../collectors/python.d.plugin/unbound)<br/>configuration file: [python.d/unbound.conf](../collectors/python.d.plugin/unbound)| + + +--- + +### DHCP Servers + +application|language|notes| +:---------:|:------:|:----| +isc dhcp|python<br/>v2 or v3|Monitor lease database to show all active leases.<br/> <br/>Python v2 requires package `python-ipaddress`.<br/> <br/>netdata plugin: [python.d.plugin](../collectors/python.d.plugin)<br/>plugin module: [isc-dhcpd.chart.py](../collectors/python.d.plugin/isc_dhcpd)<br/>configuration file: [python.d/isc-dhcpd.conf](../collectors/python.d.plugin/isc_dhcpd)| + + +--- + +### Load Balancers + +application|language|notes| +:---------:|:------:|:----| +haproxy|python<br/>v2 or v3|Monitor frontend, backend and health metrics.<br/> <br/>netdata plugin: [python.d.plugin](../collectors/python.d.plugin)<br/>plugin module: [haproxy.chart.py](../collectors/python.d.plugin/haproxy)<br/>configuration file: [python.d/haproxy.conf](../collectors/python.d.plugin/haproxy)| +traefik|python<br/>v2 or v3|Connects to multiple traefik instances (local or remote) to collect API metrics (response status code, response time, average response time and server uptime).<br/> <br/>netdata plugin: [python.d.plugin](../collectors/python.d.plugin)<br/>plugin module: [traefik.chart.py](../collectors/python.d.plugin/traefik)<br/>configuration file: [python.d/traefik.conf](../collectors/python.d.plugin/traefik)| + +--- + +### Message Brokers + +application|language|notes| +:---------:|:------:|:----| +rabbitmq|python<br/>v2 or v3|Monitor rabbitmq performance and health metrics.<br/> <br/>netdata plugin: [python.d.plugin](../collectors/python.d.plugin)<br/>plugin module: [rabbitmq.chart.py](../collectors/python.d.plugin/rabbitmq)<br/>configuration file: [python.d/rabbitmq.conf](../collectors/python.d.plugin/rabbitmq)| +beanstalkd|python<br/>v2 or v3|Provides server and tube level statistics.<br/> <br/>Requires beanstalkc python package (`pip install beanstalkc` or install package `python-beanstalkc`, which also installs `python-yaml`).<br/> <br/>netdata plugin: [python.d.plugin](../collectors/python.d.plugin)<br/>plugin module: [beanstalk.chart.py](../collectors/python.d.plugin/beanstalk)<br/>configuration file: [python.d/beanstalk.conf](../collectors/python.d.plugin/beanstalk)| + + +--- + +### UPS + +application|language|notes| +:---------:|:------:|:----| +apcupsd|BASH<br/>Shell Script|Connects to an apcupsd server to collect real-time statistics of an APC UPS.<br/> <br/>netdata plugin: [charts.d.plugin](../collectors/charts.d.plugin#chartsdplugin)<br/>plugin module: [apcupsd.chart.sh](../collectors/charts.d.plugin/apcupsd)<br/>configuration file: [charts.d/apcupsd.conf](../collectors/charts.d.plugin/apcupsd)| +nut|BASH<br/>Shell Script|Connects to a nut server (upsd) to collect real-time UPS statistics.<br/> <br/>netdata plugin: [charts.d.plugin](../collectors/charts.d.plugin#chartsdplugin)<br/>plugin module: [nut.chart.sh](../collectors/charts.d.plugin/nut)<br/>configuration file: [charts.d/nut.conf](../collectors/charts.d.plugin/nut)| + + +--- + +### RAID + +application|language|notes| +:---------:|:------:|:----| +mdstat|python<br/>v2 or v3|Parses `/proc/mdstat` to get mds health metrics.<br/> <br/>netdata plugin: [python.d.plugin](../collectors/python.d.plugin)<br/>plugin module: [mdstat.chart.py](../collectors/python.d.plugin/mdstat)<br/>configuration file: [python.d/mdstat.conf](../collectors/python.d.plugin/mdstat)| +megacli|python<br/>v2 or v3|Collects adapter, physical drives and battery stats..<br/> <br/>netdata plugin: [python.d.plugin](../collectors/python.d.plugin)<br/>plugin module: [megacli.chart.py](../collectors/python.d.plugin/megacli)<br/>configuration file: [python.d/megacli.conf](../collectors/python.d.plugin/megacli)| + +--- + +### Mail Servers + +application|language|notes| +:---------:|:------:|:----| +dovecot|python<br/>v2 or v3|Connects to multiple dovecot servers (local or remote) to collect real-time performance metrics.<br/> <br/>netdata plugin: [python.d.plugin](../collectors/python.d.plugin)<br/>plugin module: [dovecot.chart.py](../collectors/python.d.plugin/dovecot)<br/>configuration file: [python.d/dovecot.conf](../collectors/python.d.plugin/dovecot)| +exim|python<br/>v2 or v3|Charts the exim queue size.<br/> <br/>netdata plugin: [python.d.plugin](../collectors/python.d.plugin)<br/>plugin module: [exim.chart.py](../collectors/python.d.plugin/exim)<br/>configuration file: [python.d/exim.conf](../collectors/python.d.plugin/exim)| +exim|BASH<br/>Shell Script|Charts the exim queue size.<br/><br/>DEPRECATED IN FAVOR OF THE PYTHON ONE. It is still supplied only as an example module to shell scripting plugins.<br/> <br/>netdata plugin: [charts.d.plugin](../collectors/charts.d.plugin#chartsdplugin)<br/>plugin module: [exim.chart.sh](../collectors/charts.d.plugin/exim)<br/>configuration file: [charts.d/exim.conf](../collectors/charts.d.plugin/exim)| +postfix|python<br/>v2 or v3|Charts the postfix queue size (supports multiple queues).<br/> <br/>netdata plugin: [python.d.plugin](../collectors/python.d.plugin)<br/>plugin module: [postfix.chart.py](../collectors/python.d.plugin/postfix)<br/>configuration file: [python.d/postfix.conf](../collectors/python.d.plugin/postfix)| +postfix|BASH<br/>Shell Script|Charts the postfix queue size.<br/><br/>DEPRECATED IN FAVOR OF THE PYTHON ONE. It is still supplied only as an example module to shell scripting plugins.<br/> <br/>netdata plugin: [charts.d.plugin](../collectors/charts.d.plugin#chartsdplugin)<br/>plugin module: [postfix.chart.sh](../collectors/charts.d.plugin/postfix)<br/>configuration file: [charts.d/postfix.conf](../collectors/charts.d.plugin/postfix)| + + +--- + +### File Servers + +application|language|notes| +:---------:|:------:|:----| +NFS Client|`C`|This is handled entirely by the netdata daemon.<br/> <br/>Configuration: `netdata.conf`, section `[plugin:proc:/proc/net/rpc/nfs]`. +NFS Server|`C`|This is handled entirely by the netdata daemon.<br/> <br/>Configuration: `netdata.conf`, section `[plugin:proc:/proc/net/rpc/nfsd]`. +samba|python<br/>v2 or v3|Performance metrics of Samba SMB2 file sharing.<br/> <br/>documentation page: [python.d.plugin module samba](../collectors/python.d.plugin/samba)<br/>netdata plugin: [python.d.plugin](../collectors/python.d.plugin)<br/>plugin module: [samba.chart.py](../collectors/python.d.plugin/samba)<br/>configuration file: [python.d/samba.conf](../collectors/python.d.plugin/samba)| + + +--- + +### System + +application|language|notes| +:---------:|:------:|:----| +apps|C|`apps.plugin` collects resource usage statistics for all processes running in the system. It groups the entire process tree and reports dozens of metrics for CPU utilization, memory footprint, disk I/O, swap memory, network connections, open files and sockets, etc. It reports metrics for application groups, users and user groups.<br/> <br/>[Documentation of `apps.plugin`](../collectors/apps.plugin/).<br/> <br/>netdata plugin: [`apps_plugin.c`](../collectors/apps.plugin)<br/>configuration file: [`apps_groups.conf`](../collectors/apps.plugin)| +cpu_apps|BASH<br/>Shell Script|Collects the CPU utilization of select apps.<br/><br/>DEPRECATED IN FAVOR OF `apps.plugin`. It is still supplied only as an example module to shell scripting plugins.<br/> <br/>netdata plugin: [charts.d.plugin](../collectors/charts.d.plugin#chartsdplugin)<br/>plugin module: [cpu_apps.chart.sh](../collectors/charts.d.plugin/cpu_apps)<br/>configuration file: [charts.d/cpu_apps.conf](../collectors/charts.d.plugin/cpu_apps)| +load_average|BASH<br/>Shell Script|Collects the current system load average.<br/><br/>DEPRECATED IN FAVOR OF THE NETDATA INTERNAL ONE. It is still supplied only as an example module to shell scripting plugins.<br/> <br/>netdata plugin: [charts.d.plugin](../collectors/charts.d.plugin#chartsdplugin)<br/>plugin module: [load_average.chart.sh](../collectors/charts.d.plugin/load_average)<br/>configuration file: [charts.d/load_average.conf](../collectors/charts.d.plugin/load_average)| +mem_apps|BASH<br/>Shell Script|Collects the memory footprint of select applications.<br/><br/>DEPRECATED IN FAVOR OF `apps.plugin`. It is still supplied only as an example module to shell scripting plugins.<br/> <br/>netdata plugin: [charts.d.plugin](../collectors/charts.d.plugin#chartsdplugin)<br/>plugin module: [mem_apps.chart.sh](../collectors/charts.d.plugin/mem_apps)<br/>configuration file: [charts.d/mem_apps.conf](../collectors/charts.d.plugin/mem_apps)| + + +--- + +### Sensors + +application|language|notes| +:---------:|:------:|:----| +cpufreq|python<br/>v2 or v3|Collects the current CPU frequency from `/sys/devices`.<br/> <br/>netdata plugin: [python.d.plugin](../collectors/python.d.plugin)<br/>plugin module: [cpufreq.chart.py](../collectors/python.d.plugin/cpufreq)<br/>configuration file: [python.d/cpufreq.conf](../collectors/python.d.plugin/cpufreq)| +cpufreq|BASH<br/>Shell Script|Collects current CPU frequency from `/sys/devices`.<br/><br/>DEPRECATED IN FAVOR OF THE PYTHON ONE. It is still supplied only as an example module to shell scripting plugins.<br/> <br/>netdata plugin: [charts.d.plugin](../collectors/charts.d.plugin#chartsdplugin)<br/>plugin module: [cpufreq.chart.sh](../collectors/charts.d.plugin/cpufreq)<br/>configuration file: [charts.d/cpufreq.conf](../collectors/charts.d.plugin/cpufreq)| +IPMI|C|Collects temperatures, voltages, currents, power, fans and `SEL` events from IPMI using `libipmimonitoring`.<br/>Check [Monitoring IPMI](../collectors/freeipmi.plugin/) for more information<br/> <br/>netdata plugin: [freeipmi.plugin](../collectors/freeipmi.plugin)<br/>configuration file: none required - to enable it, compile/install netdata with `--enable-plugin-freeipmi`| +hddtemp|python<br/>v2 or v3|Connects to multiple hddtemp servers (local or remote) to collect real-time performance metrics.<br/> <br/>netdata plugin: [python.d.plugin](../collectors/python.d.plugin)<br/>plugin module: [hddtemp.chart.py](../collectors/python.d.plugin/hddtemp)<br/>configuration file: [python.d/hddtemp.conf](../collectors/python.d.plugin/hddtemp)| +hddtemp|BASH<br/>Shell Script|Connects to a hddtemp server (local or remote) to collect real-time performance metrics.<br/><br/>DEPRECATED IN FAVOR OF THE PYTHON ONE. It is still supplied only as an example module to shell scripting plugins.<br/> <br/>netdata plugin: [charts.d.plugin](../collectors/charts.d.plugin#chartsdplugin)<br/>plugin module: [hddtemp.chart.sh](../collectors/charts.d.plugin/hddtemp)<br/>configuration file: [charts.d/hddtemp.conf](../collectors/charts.d.plugin/hddtemp)| +sensors|BASH<br/>Shell Script|Collects sensors values from files in `/sys`.<br/><br/>DEPRECATED IN FAVOR OF THE PYTHON ONE. It is still supplied only as an example module to shell scripting plugins.<br/> <br/>netdata plugin: [charts.d.plugin](../collectors/charts.d.plugin#chartsdplugin)<br/>plugin module: [sensors.chart.sh](../collectors/charts.d.plugin/sensors)<br/>configuration file: [charts.d/sensors.conf](../collectors/charts.d.plugin/sensors)| +sensors|python<br/>v2 or v3|Uses `lm-sensors` to collect sensor data.<br/> <br/>netdata plugin: [python.d.plugin](../collectors/python.d.plugin)<br/>plugin module: [sensors.chart.py](../collectors/python.d.plugin/sensors)<br/>configuration file: [python.d/sensors.conf](../collectors/python.d.plugin/sensors)| +smartd_log|python<br/>v2 or v3|Collects the S.M.A.R.T attributes from `smartd` log files.<br/> <br/>netdata plugin: [python.d.plugin](../collectors/python.d.plugin)<br/>plugin module: [smartd_log.chart.py](../collectors/python.d.plugin/smartd_log)<br/>configuration file: [python.d/smartd_log.conf](../collectors/python.d.plugin/smartd_log)| +w1sensor|python<br/>v2 or v3|Collects data from connected 1-Wire sensors.<br/> <br/>netdata plugin: [python.d.plugin](../collectors/python.d.plugin)<br/>plugin module: [w1sensor.chart.py](../collectors/python.d.plugin/w1sensor)<br/>configuration file: [python.d/w1sensor.conf](../collectors/python.d.plugin/w1sensor)| + + +--- + +### Network + +application|language|notes| +:---------:|:------:|:----| +ap|BASH<br/>Shell Script|Uses the `iw` command to provide statistics of wireless clients connected to a wireless access point running on this host (works well with `hostapd`).<br/> <br/>netdata plugin: [charts.d.plugin](../collectors/charts.d.plugin#chartsdplugin)<br/>plugin module: [ap.chart.sh](../collectors/charts.d.plugin/ap)<br/>configuration file: [charts.d/ap.conf](../collectors/charts.d.plugin/ap)| +fping|C|Charts network latency statistics for any number of nodes, using the `fping` command. A recent (probably unreleased) version of fping is required. The plugin supplied can install it in `/usr/local`.<br/> <br/>netdata plugin: [fping.plugin](../collectors/fping.plugin) (this is a shell wrapper to start fping - once fping is started, netdata and fping communicate directly - it can also install the right version of fping)<br/>configuration file: [fping.conf](../collectors/fping.plugin)| +snmp|node.js|Connects to multiple snmp servers to collect real-time performance metrics.<br/> <br/>netdata plugin: [node.d.plugin](../collectors/node.d.plugin#nodedplugin)<br/>plugin module: [snmp.node.js](../collectors/node.d.plugin/snmp)<br/>configuration file: [node.d/snmp.conf](../collectors/node.d.plugin/snmp)| +dns_query_time|python<br/>v2 or v3|Provides DNS query time statistics.<br/> <br/>Requires package `dnspython` (`pip install dnspython` or install package `python-dnspython`).<br/> <br/>netdata plugin: [python.d.plugin](../collectors/python.d.plugin)<br/>plugin module: [dns_query_time.chart.py](../collectors/python.d.plugin/dns_query_time)<br/>configuration file: [python.d/dns_query_time.conf](../collectors/python.d.plugin/dns_query_time)| +http|python<br />v2 or v3|Monitors a generic web page for status code and returned content in HTML +port|ptyhon<br />v2 or v3|Checks if a generic TCP port for its availability and response time + + +--- + +### Time Servers + +application|language|notes| +:---------:|:------:|:----| +chrony|python<br/>v2 or v3|Uses the chronyc command to provide chrony statistics (Frequency, Last offset, RMS offset, Residual freq, Root delay, Root dispersion, Skew, System time).<br/> <br/>netdata plugin: [python.d.plugin](../collectors/python.d.plugin)<br/>plugin module: [chrony.chart.py](../collectors/python.d.plugin/chrony)<br/>configuration file: [python.d/chrony.conf](../collectors/python.d.plugin/chrony)| +ntpd|python<br/>v2 or v3|Connects to multiple ntpd servers (local or remote) to provide statistics of system variables and optional also peer variables (if enabled in the configuration).<br/> <br/>netdata plugin: [python.d.plugin](../collectors/python.d.plugin)<br/>plugin module: [ntpd.chart.py](../collectors/python.d.plugin/ntpd)<br/>configuration file: [python.d/ntpd.conf](../collectors/python.d.plugin/ntpd)| + + +--- + +### Security + +application|language|notes| +:---------:|:------:|:----| +freeradius|python<br/>v2 or v3|Uses the radclient command to provide freeradius statistics (authentication, accounting, proxy-authentication, proxy-accounting).<br/> <br/>netdata plugin: [python.d.plugin](../collectors/python.d.plugin)<br/>plugin module: [freeradius.chart.py](../collectors/python.d.plugin/freeradius)<br/>configuration file: [python.d/freeradius.conf](../collectors/python.d.plugin/freeradius)| +openvpn|python<br/>v2 or v3|All data from openvpn-status.log in your dashboard! <br/> <br/>netdata plugin: [python.d.plugin](../collectors/python.d.plugin)<br/>plugin module: [ovpn_status_log.chart.py](../collectors/python.d.plugin/ovpn_status_log)<br/>configuration file: [python.d/ovpn_status_log.conf](../collectors/python.d.plugin/ovpn_status_log)| +fail2ban|python<br/>v2 or v3|Monitor fail2ban log file to show all bans for all active jails <br/> <br/>netdata plugin: [python.d.plugin](../collectors/python.d.plugin)<br/>plugin module: [fail2ban.chart.py](../collectors/python.d.plugin/fail2ban)<br/>configuration file: [python.d/fail2ban.conf](../collectors/python.d.plugin/fail2ban)| + + +--- + +### Telephony Servers + +application|language|notes| +:---------:|:------:|:----| +opensips|BASH<br/>Shell Script|Connects to an opensips server (local only) to collect real-time performance metrics.<br/> <br/>netdata plugin: [charts.d.plugin](../collectors/charts.d.plugin#chartsdplugin)<br/>plugin module: [opensips.chart.sh](../collectors/charts.d.plugin/opensips)<br/>configuration file: [charts.d/opensips.conf](../collectors/charts.d.plugin/opensips)| + + +--- + +### Go applications + +application|language|notes| +:---------:|:------:|:----| +go_expvar|python<br/>v2 or v3|Parses metrics exposed by applications written in the Go programming language using the [expvar package](https://golang.org/pkg/expvar/).<br/> <br/>netdata plugin: [python.d.plugin](../collectors/python.d.plugin)<br/>plugin module: [go_expvar.chart.py](../collectors/python.d.plugin/go_expvar)<br/>configuration file: [python.d/go_expvar.conf](../collectors/python.d.plugin/go_expvar)<br/>documentation: [Monitoring Go Applications](../collectors/python.d.plugin/go_expvar/)| + + +--- + +### Household Appliances + +application|language|notes| +:---------:|:------:|:----| +sma_webbox|node.js|Connects to multiple remote SMA webboxes to collect real-time performance metrics of the photovoltaic (solar) power generation.<br/> <br/>netdata plugin: [node.d.plugin](../collectors/node.d.plugin#nodedplugin)<br/>plugin module: [sma_webbox.node.js](../collectors/node.d.plugin/sma_webbox)<br/>configuration file: [node.d/sma_webbox.conf](../collectors/node.d.plugin/sma_webbox)| +fronius|node.js|Connects to multiple remote Fronius Symo servers to collect real-time performance metrics of the photovoltaic (solar) power generation.<br/> <br/>netdata plugin: [node.d.plugin](../collectors/node.d.plugin#nodedplugin)<br/>plugin module: [fronius.node.js](../collectors/node.d.plugin/fronius)<br/>configuration file: [node.d/fronius.conf](../collectors/node.d.plugin/fronius)| +stiebeleltron|node.js|Collects the temperatures and other metrics from your Stiebel Eltron heating system using their Internet Service Gateway (ISG web).<br/> <br/>netdata plugin: [node.d.plugin](../collectors/node.d.plugin#nodedplugin)<br/>plugin module: [stiebeleltron.node.js](../collectors/node.d.plugin/stiebeleltron)<br/>configuration file: [node.d/stiebeleltron.conf](../collectors/node.d.plugin/stiebeleltron)| + + +--- + +### Java Processes + +application|language|notes| +:---------:|:------:|:----| +Spring Boot Application|java|Monitors running Java [Spring Boot](https://spring.io/) applications that expose their metrics with the use of the **Spring Boot Actuator** included in Spring Boot library.<br/> <br/>netdata plugin: [python.d.plugin](../collectors/python.d.plugin)<br/>plugin module: [springboot](../collectors/python.d.plugin/springboot)<br/>configuration file: [python.d/springboot.conf](../collectors/python.d.plugin/springboot) + + +--- + +### Provisioning Systems + +application|language|notes| +:---------:|:------:|:----| +puppet|python<br/>v2 or v3|Connects to multiple Puppet Server and Puppet DB instances (local or remote) to collect real-time status metrics.<br/> <br/>netdata plugin: [python.d.plugin](../collectors/python.d.plugin)<br/>plugin module: [puppet.chart.py](../collectors/python.d.plugin/puppet)<br/>configuration file: [python.d/puppet.conf](../collectors/python.d.plugin/puppet)| + +--- + +### Game Servers + +application|language|notes| +:---------:|:------:|:----| +SpigotMC|Python<br/>v2 or v3|Monitors Spigot Minecraft server ticks per second and number of online players using the Minecraft remote console.<br/> <br/>netdata plugin: [python.d.plugin](../collectors/python.d.plugin)<br/>plugin module: [spigotmc.chart.py](../collectors/python.d.plugin/spigotmc)<br/>configuration file: [python.d/spigotmc.conf](../collectors/python.d.plugin/spigotmc)| + +--- + +### Distributed Computing Clients + +application|language|notes| +:---------:|:------:|:----| +BOINC|Python<br/>v2 or v3|Monitors task states for local and remote BOINC client software using the remote GUI RPC interface. Also provides alarms for a handful of error conditions. Requires manual configuration<br/> <br/>netdata plugin: [python.d.plugin](../collectors/python.d.plugin)<br/>plugin module: [boinc.chart.py](../collectors/python.d.plugin/boinc)<br/>configuration file: [python.d/boinc.conf](../collectors/python.d.plugin/boinc)| + +--- + +### Skeleton Plugins + +application|language|notes| +:---------:|:------:|:----| +example|BASH<br/>Shell Script|Skeleton plugin in BASH.<br/><br/>DEPRECATED IN FAVOR OF THE PYTHON ONE. It is still supplied only as an example module to shell scripting plugins.<br/> <br/>netdata plugin: [charts.d.plugin](../collectors/charts.d.plugin#chartsdplugin)<br/>plugin module: [example.chart.sh](../collectors/charts.d.plugin/example)<br/>configuration file: [charts.d/example.conf](../collectors/charts.d.plugin/example)| +example|python<br/>v2 or v3|Skeleton plugin in Python.<br/> <br/>netdata plugin: [python.d.plugin](../collectors/python.d.plugin)<br/>plugin module: [example.chart.py](../collectors/python.d.plugin/example)<br/>configuration file: [python.d/example.conf](../collectors/python.d.plugin/example)| diff --git a/doc/Demo-Sites.md b/doc/Demo-Sites.md new file mode 100644 index 000000000..c9e0594ba --- /dev/null +++ b/doc/Demo-Sites.md @@ -0,0 +1,19 @@ +# Demo Sites + +Live demo installations of netdata are available at **[https://my-netdata.io](https://my-netdata.io)**: + +Location | netdata demo URL | 60 mins reqs | VM Donated by +:-------:|:-----------------:|:----------:|:------------- +London (UK)|**[london.my-netdata.io](https://london.my-netdata.io)**<br/>(this is the global netdata **registry** and has **named** and **mysql** charts)|[](https://london.my-netdata.io)|[DigitalOcean.com](https://m.do.co/c/83dc9f941745) +Atlanta (USA)|**[cdn77.my-netdata.io](https://cdn77.my-netdata.io)**<br/>(with **named** and **mysql** charts)|[](https://cdn77.my-netdata.io)|[CDN77.com](https://www.cdn77.com/) +Israel|**[octopuscs.my-netdata.io](https://octopuscs.my-netdata.io)**|[](https://octopuscs.my-netdata.io)|[OctopusCS.com](https://www.octopuscs.com) +Roubaix (France)|**[ventureer.my-netdata.io](https://ventureer.my-netdata.io)**|[](https://ventureer.my-netdata.io)|[Ventureer.com](https://ventureer.com/) +Madrid (Spain)|**[stackscale.my-netdata.io](https://stackscale.my-netdata.io)**|[](https://stackscale.my-netdata.io)|[StackScale Spain](https://www.stackscale.es/) +Bangalore (India)|**[bangalore.my-netdata.io](https://bangalore.my-netdata.io)**|[](https://bangalore.my-netdata.io)|[DigitalOcean.com](https://m.do.co/c/83dc9f941745) +Frankfurt (Germany)|**[frankfurt.my-netdata.io](https://frankfurt.my-netdata.io)**|[](https://frankfurt.my-netdata.io)|[DigitalOcean.com](https://m.do.co/c/83dc9f941745) +New York (USA)|**[newyork.my-netdata.io](https://newyork.my-netdata.io)**|[](https://newyork.my-netdata.io)|[DigitalOcean.com](https://m.do.co/c/83dc9f941745) +San Francisco (USA)|**[sanfrancisco.my-netdata.io](https://sanfrancisco.my-netdata.io)**|[](https://sanfrancisco.my-netdata.io)|[DigitalOcean.com](https://m.do.co/c/83dc9f941745) +Singapore|**[singapore.my-netdata.io](https://singapore.my-netdata.io)**|[](https://singapore.my-netdata.io)|[DigitalOcean.com](https://m.do.co/c/83dc9f941745) +Toronto (Canada)|**[toronto.my-netdata.io](https://toronto.my-netdata.io)**|[](https://toronto.my-netdata.io)|[DigitalOcean.com](https://m.do.co/c/83dc9f941745) + +*Netdata dashboards are mobile and touch friendly.* diff --git a/doc/Donations-netdata-has-received.md b/doc/Donations-netdata-has-received.md new file mode 100644 index 000000000..53cff3864 --- /dev/null +++ b/doc/Donations-netdata-has-received.md @@ -0,0 +1,23 @@ +# Donations received + +This is a list of the donations we have received for netdata (sorted alphabetically on their name): + +what donated|related links|who donated|description of the donation +----:|:-----:|:---:|:----------- +Packages Distribution|-|**[PackageCloud.io](https://packagecloud.io/)**|**PackageCloud.io** donated to a free open-source subscription to their awesome Package Distribution services. +Cross Browser Testing|-|**[BrowserStack.com](https://www.browserstack.com/)**|**BrowserStack.com** donated a free subscription to their awesome Browser Testing services (all three of them: Live, Screenshots, Responsive). +Cloud VM|[cdn77.my-netdata.io](http://cdn77.my-netdata.io)|**[CDN77.com](https://www.cdn77.com/)**|**CDN77.com** donated a VM with 2 CPU cores, 4GB RAM and 20GB HD, on their excellent CDN network. +Localization Management|[netdata localization project](https://crowdin.com/project/netdata) (check issue [#279](https://github.com/netdata/netdata/issues/279))|**[Crowdin.com](https://crowdin.com/)**|**Crowdin.com** donated an open source license to their Localization Management Platform. +Cloud VMs|[london.my-netdata.io](https://london.my-netdata.io) (Several VMs)|**[DigitalOcean.com](https://www.digitalocean.com/)**|**DigitalOcean.com** donated 1000 USD to be used in their excellent Cloud Computing services. Many thanks to [Justin Paine](https://github.com/xxdesmus) for making this happen. +Development IDE|-|**[JetBrains.com](https://www.jetbrains.com/)**|**JetBrains.com** donated an open source license for 4 developers for 1 year, to their excellent IDEs. +Cloud VM|[octopuscs.my-netdata.io](https://octopuscs.my-netdata.io)|**[OctopusCS.com](https://octopuscs.com/)**|**OctopusCS.com** donated a VM with 4 CPU cores, 16GB RAM and 50GB HD in their excellent Cloud Computing services. +Cloud VM|[ventureer.my-netdata.io](https://ventureer.my-netdata.io)|**[Ventureer.com](https://ventureer.com/)**|**Ventureer.com** donated a VM with 4 CPU cores, 8GB RAM and 50GB HD in their excellent Cloud Computing services. +Cloud VM|[stackscale.my-netdata.io](https://stackscale.my-netdata.io)|**[stackscale.com](https://www.stackscale.com/)**|**StackScale.com** donated a VM with 4 CPU cores, 16GB RAM and 100GB HD in their excellent Cloud Computing services. + +Thank you! + +--- + +**Do you want to donate?** We are thirsty for on-line services that can help us make netdata better. We also try to build a network of demo sites (VMs) that can help us show the full potential of netdata. + +Please contact me at costa@tsaousis.gr. diff --git a/doc/Netdata-Security-and-Disclosure-Information.md b/doc/Netdata-Security-and-Disclosure-Information.md new file mode 100644 index 000000000..86adfeeb9 --- /dev/null +++ b/doc/Netdata-Security-and-Disclosure-Information.md @@ -0,0 +1,37 @@ +# Netdata Security and Disclosure Information + +This page describes netdata security and disclosure information. + +## Security Announcements + +Every time a security issue is fixed in netdata, we immediately release a new version of it. So, to get notified of all security incidents, please subscribe to our releases on github. + +## Report a Vulnerability + +We’re extremely grateful for security researchers and users that report vulnerabilities to Netdata Open Source Community. All reports are thoroughly investigated by a set of community volunteers. + +To make a report, please email the private [security@netdata.cloud](mailto:security@netdata.cloud) list with the security details and the details expected for [all netdata bug reports](../.github/ISSUE_TEMPLATE/bug_report.md). + +## When Should I Report a Vulnerability? + +- You think you discovered a potential security vulnerability in Netdata +- You are unsure how a vulnerability affects Netdata +- You think you discovered a vulnerability in another project that Netdata depends on (e.g. python, node, etc) + +### When Should I NOT Report a Vulnerability? + +- You need help tuning Netdata for security +- You need help applying security related updates +- Your issue is not security related + +## Security Vulnerability Response + +Each report is acknowledged and analyzed by Netdata Team members within 3 working days. This will set off a Security Release Process. + +Any vulnerability information shared with Netdata Team stays within Netdata project and will not be disseminated to other projects unless it is necessary to get the issue fixed. + +As the security issue moves from triage, to identified fix, to release planning we will keep the reporter updated. + +## Public Disclosure Timing + +A public disclosure date is negotiated by the Netdata team and the bug submitter. We prefer to fully disclose the bug as soon as possible once a user mitigation is available. It is reasonable to delay disclosure when the bug or the fix is not yet fully understood, the solution is not well-tested, or for vendor coordination. The timeframe for disclosure is from immediate (especially if it's already publicly known) to a few weeks. As a basic default, we expect report date to disclosure date to be on the order of 7 days. The Netdata team holds the final say when setting a disclosure date. diff --git a/doc/Performance.md b/doc/Performance.md new file mode 100644 index 000000000..ef15a871a --- /dev/null +++ b/doc/Performance.md @@ -0,0 +1,73 @@ +# Netdata Performance + +Netdata performance is affected by: + +**Data collection** +- the number of charts for which data are collected +- the number of plugins running +- the technology of the plugins (i.e. BASH plugins are slower than binary plugins) +- the frequency of data collection + +You can control all the above. + +**Web clients accessing the data** +- the duration of the charts in the dashboard +- the number of charts refreshes requested +- the compression level of the web responses + +--- + +## Netdata Daemon + +For most server systems, with a few hundred charts and a few thousand dimensions, the netdata daemon, without any web clients accessing it, should not use more than 1% of a single core. + +To prove netdata scalability, check issue [#1323](https://github.com/netdata/netdata/issues/1323#issuecomment-265501668) where netdata collects 95.000 metrics per second, with 12% CPU utilization of a single core! + +In embedded systems, if the netdata daemon is using a lot of CPU without any web clients accessing it, you should lower the data collection frequency. To set the data collection frequency, edit `/etc/netdata/netdata.conf` and set `update_every` to a higher number (this is the frequency in seconds data are collected for all charts: higher number of seconds = lower frequency, the default is 1 for per second data collection). You can also set this frequency per module or chart. Check the **[[Configuration]]** section. + +## Plugins + +If a plugin is using a lot of CPU, you should lower its update frequency, or if you wrote it, re-factor it to be more CPU efficient. Check **[[External Plugins]]** for more details on writing plugins. + +## CPU consumption when web clients are accessing dashboards + +Netdata is very efficient when servicing web clients. On most server platforms, netdata should be able to serve **1800 web client requests per second per core** for auto-refreshing charts. + +Normally, each user connected will request less than 10 chart refreshes per second (the page may have hundreds of charts, but only the visible are refreshed). So you can expect 180 users per CPU core accessing dashboards before having any delays. + +Netdata runs with the lowest possible process priority, so even if 1000 users are accessing dashboards, it should not influence your applications. CPU utilization will reach 100%, but your applications should get all the CPU they need. + +To lower the CPU utilization of netdata when clients are accessing the dashboard, set `web compression level = 1`, or disable web compression completely by setting `enable web responses gzip compression = no`. Both settings are in the `[web]` section. + + +## Monitoring a heavy loaded system + +Netdata, while running, does not depend on disk I/O (apart its log files and `access.log` is written with buffering enabled and can be disabled). Some plugins that need disk may stop and show gaps during heavy system load, but the netdata daemon itself should be able to work and collect values from `/proc` and `/sys` and serve web clients accessing it. + +Keep in mind that netdata saves its database when it exits and loads it back when restarted. While it is running though, its DB is only stored in RAM and no I/O takes place for it. + + +## Running netdata in embedded devices + +Embedded devices usually have very limited CPU resources available, and in most cases, just a single core. + +We suggest to do the following: + +#### external plugins + + `charts.d.plugin` and `apps.plugin`, each consumes twice the CPU resources of the netdata daemon. + + If you don't need them, disable them (edit `/etc/netdata/netdata.conf` and search for the plugins section). + + If you need them, increase their `update every` value (again in `/etc/netdata/netdata.conf`), so that they do not run that frequently. + +#### internal plugins + +If netdata is still using a lot of CPU, lower its update frequency. Going from per second updates, to once every 2 seconds updates, will cut the CPU resources of all netdata programs **in half**, and you will still have very frequent updates. + +If the CPU of the embedded device is too weak, try setting even lower update frequency. Experiment with `update every = 5` or `update every = 10` (higher number = lower frequency), until you get acceptable results. + +#### Single threaded web server + +Normally, netdata spawns a thread for each web client. This allows netdata to utilize all the available cores for servicing chart refreshes. You can however disable this feature and serve all charts one after another, using a single thread / core. This will might lower the CPU pressure on the embedded device. To enable the single threaded web server, edit `/etc/netdata/netdata.conf` and set `mode = single-threaded` in the `[web]` section. + diff --git a/doc/Running-behind-apache.md b/doc/Running-behind-apache.md new file mode 100644 index 000000000..02d2be92f --- /dev/null +++ b/doc/Running-behind-apache.md @@ -0,0 +1,268 @@ +# netdata via apache's mod_proxy + +Below you can find instructions for configuring an apache server to: + +1. proxy a single netdata via an HTTP and HTTPS virtual host +2. dynamically proxy any number of netdata +3. add user authentication +4. adjust netdata settings to get optimal results + + +## Requirements + +Make sure your apache has installed `mod_proxy` and `mod_proxy_http`. + +On debian/ubuntu systems, install them with this: + +```sh +sudo apt-get install libapache2-mod-proxy-html +``` + +Also make sure they are enabled: + +``` +sudo a2enmod proxy +sudo a2enmod proxy_http +``` + +Ensure your rewrite module is enabled: + +``` +sudo a2enmod rewrite +``` + +--- + +## netdata on an existing virtual host + +On any **existing** and already **working** apache virtual host, you can redirect requests for URL `/netdata/` to one or more netdata servers. + +### proxy one netdata, running on the same server apache runs + +Add the following on top of any existing virtual host. It will allow you to access netdata as `http://virtual.host/netdata/`. + +``` +<VirtualHost *:80> + + RewriteEngine On + ProxyRequests Off + ProxyPreserveHost On + + <Proxy *> + Require all granted + </Proxy> + + # Local netdata server accessed with '/netdata/', at localhost:19999 + ProxyPass "/netdata/" "http://localhost:19999/" connectiontimeout=5 timeout=30 keepalive=on + ProxyPassReverse "/netdata/" "http://localhost:19999/" + + # if the user did not give the trailing /, add it + # for HTTP (if the virtualhost is HTTP, use this) + RewriteRule ^/netdata$ http://%{HTTP_HOST}/netdata/ [L,R=301] + # for HTTPS (if the virtualhost is HTTPS, use this) + #RewriteRule ^/netdata$ https://%{HTTP_HOST}/netdata/ [L,R=301] + + # rest of virtual host config here + +</VirtualHost> +``` + +### proxy multiple netdata running on multiple servers + +Add the following on top of any existing virtual host. It will allow you to access multiple netdata as `http://virtual.host/netdata/HOSTNAME/`, where `HOSTNAME` is the hostname of any other netdata server you have (to access the `localhost` netdata, use `http://virtual.host/netdata/localhost/`). + +``` +<VirtualHost *:80> + + RewriteEngine On + ProxyRequests Off + ProxyPreserveHost On + + <Proxy *> + Require all granted + </Proxy> + + # proxy any host, on port 19999 + ProxyPassMatch "^/netdata/([A-Za-z0-9\._-]+)/(.*)" "http://$1:19999/$2" connectiontimeout=5 timeout=30 keepalive=on + + # make sure the user did not forget to add a trailing / + # for HTTP (if the virtualhost is HTTP, use this) + RewriteRule "^/netdata/([A-Za-z0-9\._-]+)$" http://%{HTTP_HOST}/netdata/$1/ [L,R=301] + # for HTTPS (if the virtualhost is HTTPS, use this) + RewriteRule "^/netdata/([A-Za-z0-9\._-]+)$" https://%{HTTP_HOST}/netdata/$1/ [L,R=301] + + # rest of virtual host config here + +</VirtualHost> +``` + +> IMPORTANT<br/> +> The above config allows your apache users to connect to port 19999 on any server on your network. + +If you want to control the servers your users can connect to, replace the `ProxyPassMatch` line with the following. This allows only `server1`, `server2`, `server3` and `server4`. + +``` + ProxyPassMatch "^/netdata/(server1|server2|server3|server4)/(.*)" "http://$1:19999/$2" connectiontimeout=5 timeout=30 keepalive=on +``` + +## netdata on a dedicated virtual host + +You can proxy netdata through apache, using a dedicated apache virtual host. + +Create a new apache site: + +```sh +nano /etc/apache2/sites-available/netdata.conf +``` + +with this content: + +``` +<VirtualHost *:80> + RewriteEngine On + ProxyRequests Off + ProxyPreserveHost On + + ServerName netdata.domain.tld + + <Proxy *> + Require all granted + </Proxy> + + ProxyPass "/" "http://localhost:19999/" connectiontimeout=5 timeout=30 keepalive=on + ProxyPassReverse "/" "http://localhost:19999/" + + ErrorLog ${APACHE_LOG_DIR}/netdata-error.log + CustomLog ${APACHE_LOG_DIR}/netdata-access.log combined +</VirtualHost> +``` + +Enable the VirtualHost: + +```sh +sudo a2ensite netdata.conf && service apache2 reload +``` + +## Netdata proxy in Plesk +_Assuming the main goal is to make Netdata running in HTTPS._ +1. Make a subdomain for Netdata on which you enable and force HTTPS - You can use a free Let's Encrypt certificate +2. Go to "Apache & nginx Settings", and in the following section, add: +``` +RewriteEngine on +RewriteRule (.*) http://localhost:19999/$1 [P,L] +``` +3. Optional: If your server is remote, then just replace "localhost" with your actual hostname or IP, it just works. + +Repeat the operation for as many servers as you need. + + +## Enable Basic Auth + +If you wish to add an authentication (user/password) to access your netdata, do these: + +Install the package `apache2-utils`. On debian / ubuntu run `sudo apt-get install apache2-utils`. + +Then, generate password for user `netdata`, using `htpasswd -c /etc/apache2/.htpasswd netdata` + +Modify the virtual host with these: + +``` + # replace the <Proxy *> section + <Proxy *> + Order deny,allow + Allow from all + </Proxy> + + # add a <Location /netdata/> section + <Location /netdata/> + AuthType Basic + AuthName "Protected site" + AuthUserFile /etc/apache2/.htpasswd + Require valid-user + Order deny,allow + Allow from all + </Location> +``` + +Specify `Location /` if netdata is running on dedicated virtual host. + +Note: Changes are applied by reloading or restarting Apache. + +# Netdata configuration + +You might edit `/etc/netdata/netdata.conf` to optimize your setup a bit. For applying these changes you need to restart netdata. + +## Response compression + +If you plan to use netdata exclusively via apache, you can gain some performance by preventing double compression of its output (netdata compresses its response, apache re-compresses it) by editing `/etc/netdata/netdata.conf` and setting: + +``` +[web] + enable gzip compression = no +``` + +Once you disable compression at netdata (and restart it), please verify you receive compressed responses from apache (it is important to receive compressed responses - the charts will be more snappy). + +## Limit direct access to netdata + +You would also need to instruct netdata to listen only on `localhost`, `127.0.0.1` or `::1`. + +``` +[web] + bind to = localhost +``` +or +``` +[web] + bind to = 127.0.0.1 +``` +or +``` +[web] + bind to = ::1 +``` + +--- + +You can also use a unix domain socket. This will also provide a faster route between apache and netdata: + +``` +[web] + bind to = unix:/tmp/netdata.sock +``` +_note: netdata v1.8+ support unix domain sockets_ + +At the apache side, prepend the 2nd argument to `ProxyPass` with `unix:/tmp/netdata.sock|`, like this: + +``` +ProxyPass "/netdata/" "unix:/tmp/netdata.sock|http://localhost:19999/" connectiontimeout=5 timeout=30 keepalive=on +``` + +--- + +If your apache server is not on localhost, you can set: + +``` +[web] + bind to = * + allow connections from = IP_OF_APACHE_SERVER +``` +_note: netdata v1.9+ support `allow connections from`_ + +`allow connections from` accepts [netdata simple patterns](../libnetdata/simple_pattern/) to match against the connection IP address. + +## prevent the double access.log + +apache logs accesses and netdata logs them too. You can prevent netdata from generating its access log, by setting this in `/etc/netdata/netdata.conf`: + +``` +[global] + access log = none +``` + +## Troubleshooting mod_proxy + +Make sure the requests reach netdata, by examing `/var/log/netdata/access.log`. + +1. if the requests do not reach netdata, your apache does not forward them. +2. if the requests reach netdata by the URLs are wrong, you have not re-written them properly. diff --git a/doc/Running-behind-caddy.md b/doc/Running-behind-caddy.md new file mode 100644 index 000000000..2fc3fd634 --- /dev/null +++ b/doc/Running-behind-caddy.md @@ -0,0 +1,27 @@ +# netdata via Caddy + +To run netdata via [Caddy's proxying,](https://caddyserver.com/docs/proxy) set your Caddyfile up like this: + +``` +netdata.domain.tld { + proxy / localhost:19999 +} +``` + +Other directives can be added between the curly brackets as needed. + +To run netdata in a subfolder: + +``` +netdata.domain.tld { + proxy /netdata/ localhost:19999 { + without /netdata + } +} +``` + +## limit direct access to netdata + +You would also need to instruct netdata to listen only to `127.0.0.1` or `::1`. + +To limit access to netdata only from localhost, set `bind socket to IP = 127.0.0.1` or `bind socket to IP = ::1` in `/etc/netdata/netdata.conf`. diff --git a/doc/Running-behind-lighttpd.md b/doc/Running-behind-lighttpd.md new file mode 100644 index 000000000..17fb9c629 --- /dev/null +++ b/doc/Running-behind-lighttpd.md @@ -0,0 +1,60 @@ +# lighttpd v1.4.x + +Here is a config for accessing netdata in a suburl via lighttpd 1.4.46 and newer: + +```txt +$HTTP["url"] =~ "^/netdata/" { + proxy.server = ( "" => ("netdata" => ( "host" => "127.0.0.1", "port" => 19999 ))) + proxy.header = ( "map-urlpath" => ( "/netdata/" => "/") ) +} +``` + +If you have older lighttpd you have to use a chain (such as bellow), as explained [at this stackoverflow answer](http://stackoverflow.com/questions/14536554/lighttpd-configuration-to-proxy-rewrite-from-one-domain-to-another). + +```txt +$HTTP["url"] =~ "^/netdata/" { + proxy.server = ( "" => ("" => ( "host" => "127.0.0.1", "port" => 19998 ))) +} + +$SERVER["socket"] == ":19998" { + url.rewrite-once = ( "^/netdata(.*)$" => "/$1" ) + proxy.server = ( "" => ( "" => ( "host" => "127.0.0.1", "port" => 19999 ))) +} +``` + +--- + +If the only thing the server is exposing via the web is netdata (and thus no suburl rewriting required), +then you can get away with just +``` +proxy.server = ( "" => ( ( "host" => "127.0.0.1", "port" => 19999 ))) +``` +Though if it's public facing you might then want to put some authentication on it. htdigest support +looks like: +``` +auth.backend = "htdigest" +auth.backend.htdigest.userfile = "/etc/lighttpd/lighttpd.htdigest" +auth.require = ( "" => ( "method" => "digest", + "realm" => "netdata", + "require" => "valid-user" + ) + ) +``` +other auth methods, and more info on htdigest, can be found in lighttpd's [mod_auth docs](http://redmine.lighttpd.net/projects/lighttpd/wiki/Docs_ModAuth). + +--- + +It seems that lighttpd (or some versions of it), fail to proxy compressed web responses. +To solve this issue, disable web response compression in netdata. + +Open /etc/netdata/netdata.conf and set in [global]: + +``` +enable web responses gzip compression = no +``` + +## limit direct access to netdata + +You would also need to instruct netdata to listen only to `127.0.0.1` or `::1`. + +To limit access to netdata only from localhost, set `bind socket to IP = 127.0.0.1` or `bind socket to IP = ::1` in `/etc/netdata/netdata.conf`. diff --git a/doc/Running-behind-nginx.md b/doc/Running-behind-nginx.md new file mode 100644 index 000000000..76062e035 --- /dev/null +++ b/doc/Running-behind-nginx.md @@ -0,0 +1,202 @@ +# netdata via nginx + +To pass netdata via a nginx, use this: + +### As a virtual host + +``` +upstream backend { + # the netdata server + server 127.0.0.1:19999; + keepalive 64; +} + +server { + # nginx listens to this + listen 80; + + # the virtual host name of this + server_name netdata.example.com; + + location / { + proxy_set_header X-Forwarded-Host $host; + proxy_set_header X-Forwarded-Server $host; + proxy_set_header X-Forwarded-For $proxy_add_x_forwarded_for; + proxy_pass http://backend; + proxy_http_version 1.1; + proxy_pass_request_headers on; + proxy_set_header Connection "keep-alive"; + proxy_store off; + } +} +``` + +### As a subfolder to an existing virtual host + +``` +upstream netdata { + server 127.0.0.1:19999; + keepalive 64; +} + +server { + listen 80; + + # the virtual host name of this subfolder should be exposed + #server_name netdata.example.com; + + location = /netdata { + return 301 /netdata/; + } + + location ~ /netdata/(?<ndpath>.*) { + proxy_redirect off; + proxy_set_header Host $host; + + proxy_set_header X-Forwarded-Host $host; + proxy_set_header X-Forwarded-Server $host; + proxy_set_header X-Forwarded-For $proxy_add_x_forwarded_for; + proxy_http_version 1.1; + proxy_pass_request_headers on; + proxy_set_header Connection "keep-alive"; + proxy_store off; + proxy_pass http://netdata/$ndpath$is_args$args; + + gzip on; + gzip_proxied any; + gzip_types *; + } +} +``` + +### As a subfolder for multiple netdata servers, via one nginx + +``` +upstream backend-server1 { + server 10.1.1.103:19999; + keepalive 64; +} +upstream backend-server2 { + server 10.1.1.104:19999; + keepalive 64; +} + +server { + listen 80; + + # the virtual host name of this subfolder should be exposed + #server_name netdata.example.com; + + location ~ /netdata/(?<behost>.*)/(?<ndpath>.*) { + proxy_set_header X-Forwarded-Host $host; + proxy_set_header X-Forwarded-Server $host; + proxy_set_header X-Forwarded-For $proxy_add_x_forwarded_for; + proxy_http_version 1.1; + proxy_pass_request_headers on; + proxy_set_header Connection "keep-alive"; + proxy_store off; + proxy_pass http://backend-$behost/$ndpath$is_args$args; + + gzip on; + gzip_proxied any; + gzip_types *; + } + + # make sure there is a trailing slash at the browser + # or the URLs will be wrong + location ~ /netdata/(?<behost>.*) { + return 301 /netdata/$behost/; + } +} +``` + +Of course you can add as many backend servers as you like. + +Using the above, you access netdata on the backend servers, like this: + +- `http://nginx.server/netdata/server1/` to reach `backend-server1` +- `http://nginx.server/netdata/server2/` to reach `backend-server2` + + +### Enable authentication + +Create an authentication file to enable the nginx basic authentication. +Do not use authentication without SSL/TLS! +If you haven't one you can do the following: + +``` +printf "yourusername:$(openssl passwd -apr1)" > /etc/nginx/passwords +``` + +And enable the authentication inside your server directive: + +``` +server { + # ... + auth_basic "Protected"; + auth_basic_user_file passwords; + # ... +} +``` + +## limit direct access to netdata + +If your nginx is on `localhost`, you can use this to protect your netdata: + +``` +[web] + bind to = 127.0.0.1 ::1 +``` + +--- + +You can also use a unix domain socket. This will also provide a faster route between nginx and netdata: + +``` +[web] + bind to = unix:/tmp/netdata.sock +``` +_note: netdata v1.8+ support unix domain sockets_ + +At the nginx side, use something like this to use the same unix domain socket: + +``` +upstream backend { + server unix:/tmp/netdata.sock; + keepalive 64; +} +``` + +--- + +If your nginx server is not on localhost, you can set: + +``` +[web] + bind to = * + allow connections from = IP_OF_NGINX_SERVER +``` + +_note: netdata v1.9+ support `allow connections from`_ + +`allow connections from` accepts [netdata simple patterns](../libnetdata/simple_pattern/) to match against the connection IP address. + +## prevent the double access.log + +nginx logs accesses and netdata logs them too. You can prevent netdata from generating its access log, by setting this in `/etc/netdata/netdata.conf`: + +``` +[global] + access log = none +``` + +## SELinux + +If you get an 502 Bad Gateway error you might check your nginx error log: + +```sh +# cat /var/log/nginx/error.log: +2016/09/09 12:34:05 [crit] 5731#5731: *1 connect() to 127.0.0.1:19999 failed (13: Permission denied) while connecting to upstream, client: 1.2.3.4, server: netdata.example.com, request: "GET / HTTP/2.0", upstream: "http://127.0.0.1:19999/", host: "netdata.example.com" +``` + +If you see something like the above, chances are high that SELinux prevents nginx from connecting to the backend server. To fix that, just use this policy: `setsebool -P httpd_can_network_connect true`. diff --git a/doc/Third-Party-Plugins.md b/doc/Third-Party-Plugins.md new file mode 100644 index 000000000..d50aa417d --- /dev/null +++ b/doc/Third-Party-Plugins.md @@ -0,0 +1,29 @@ +# Third-party Plugins + +The following is a list of Netdata plugins distributed by third parties: + +## Nvidia GPUs + +[netdata nv plugin](https://github.com/coraxx/netdata_nv_plugin) monitors nvidia GPUs. + + + +## teamspeak 3 + +[teamspeak 3 plugin](https://github.com/coraxx/netdata_ts3_plugin) polls active users and bandwidth from TeamSpeak 3 servers. + +## SSH + +[SSH module](https://github.com/Yaser-Amiri/netdata-ssh-module) monitors failed authentication requests of SSH server. + +## interactive users count + +Collect [number of currently logged-on users](https://github.com/veksh/netdata-numsessions) + +## CyberPower UPS + +[cyberups plugin](https://github.com/HawtDogFlvrWtr/netdata_cyberpwrups_plugin) polls the USB connected CyberPower UPS for stats. + +## Nim + +There is an unofficial [nim plugin helper](https://github.com/FedericoCeratto/nim-netdata-plugin) diff --git a/doc/Why-Netdata.md b/doc/Why-Netdata.md new file mode 100644 index 000000000..57ff722ec --- /dev/null +++ b/doc/Why-Netdata.md @@ -0,0 +1,170 @@ +# Why Netdata + + + +## Netdata is unique! + +The following is an animated GIF showing **netdata**'s ability to monitor QoS. The timings of this animation have not been altered, this is the real thing: + + + +Check the details on this animation: + +1. At the beginning the charts auto-refresh, in real-time +2. Charts can be dragged and zoomed (either mouse or touch) +3. You pan or zoom one, the others follow +4. Mouse over on one, selects the same timestamp on all +5. Dimensions can be enabled or disabled +6. All refreshes are instant (an 8 year old core-2 duo computer was used to record this) + +There are a lot of excellent open source tools for collecting and visualizing performance metrics. Check for example [collectd](https://collectd.org/), [OpenTSDB](http://opentsdb.net/), [influxdb](https://influxdata.com/), [Grafana](http://grafana.org/), etc. + +So, why **netdata**? + +Well, **netdata** has a quite different approach. + +## Simplicity + +> Most monitoring solutions require endless configuration of whatever imaginable. Well, this is a linux box. Why do we need to configure every single metric we need to monitor. Of course it has a CPU and RAM and a few disks, and ethernet ports, it might run a firewall, a web server, or a database server and so on. Why do we need to configure all these metrics? + +**Netdata** has been designed to auto-detect everything. Of course you can enable, tweak or disable things. But by default, if **netdata** can retrieve `/server-status` from an web server you run on your linux box, it will automatically collect all performance metrics. This happens for apache, squid, nginx, mysql, opensips, etc. It will also automatically collect all available system values for CPU, memory, disks, network interfaces, QoS (with labels if you also use [FireQOS](http://firehol.org)), etc. Even for applications that do not offer performance metrics, it will automatically group the whole process tree and provide metrics like CPU usage, memory allocated, opened files, sockets, disk activity, swap activity, etc per application group. + +Netdata supports plenty of [configuration](../daemon/config/). However, we have done everything we can to allow netdata to auto-detect as much as possible. + +Even netdata plugins are designed to support configuration-less operation. So, you just install and run netdata. You will need to configure something only if it cannot be auto-detected. + +> Take any performance monitoring solution and try to troubleshoot a performance problem. At the end of the day you will have to ssh to the server to understand what exactly is happening. You will have to use `iostat`, `iotop`, `vmstat`, `top`, `iperf`, `ethtool` and probably a few dozen more console tools to figure it out. + +With **netdata**, this need is eliminated significantly. Of course you will ssh. Just not for monitoring performance. + +If you install **netdata** you will prefer it over the console tools. **Netdata** visualizes the data, while the console tools just show their values. The detail is the same - I have spent pretty much time reading the source code of the console tools, to figure out what needs to do done in netdata, so that the data, the values, will be the same. Actually, **netdata** is more precise than most console tools, it will interpolate all collected values to second boundary, so that even if something took a few microseconds more to be collected, netdata will correctly estimate the per second value. + +**Netdata** visualizes data in ways you cannot even imagine on a console. It allows you to see the present in real-time, much like the console tools, but also the recent past, compare different metrics with each other, zoom in to see the recent past in detail, or zoom out to have a helicopter view of what is happening in longer durations, build custom dashboards with just the charts you need for a specific purpose. + +Most engineers that install netdata, ssh to the server to tweak system or application settings and at the same time they monitor the result of the new settings in **netdata** on their browser. + +## Per second data collection and visualization + +**Per second data collection and visualization** is usually only available in dedicated console tools, like `top`, `vmstat`, `iostat`, etc. Netdata brings per second data collection and visualization to all applications, accessible through the web. + +*You are not convinced per second data collection is important?* +**Click** this image for a demo: + +[](http://netdata.firehol.org/demo2.html) + +## Realtime monitoring + +> Any performance monitoring solution that does not go down to per second collection and visualization of the data, is useless. It will make you happy to have it, but it will not help you more than that. + +Visualizing the present in **real-time and in great detail**, is the most important value a performance monitoring solution should provide. The next most important is the last hour, again per second. The next is the last 8 hours and so on, up to a week, or at most a month. In my 20+ years in IT, I needed just once or twice to look a year back. And this was mainly out of curiosity. + +Of course real-time monitoring requires resources. **netdata** is designed to be very efficient: + +1. collecting performance data is a repeating process - you do the same thing again and again. **Netdata** has been designed to learn from each iteration, so that the next one will be faster. It learns the sizes of files (it even keeps them open when it can), the number of lines and words per line they contain, the sizes of the buffers it needs to process them, etc. It adapts, so that everything will be as ready as possible for the next iteration. +2. internally, it uses hashes and indexes (b-trees), to speed up lookups of metrics, charts, dimensions, settings. +3. it has an in-memory round robin database based on a custom floating point number that allows it to pack values and flags together, in 32 bits, to lower its memory footprint. +4. its internal web server is capable of generating JSON responses from live performance data with speeds comparable to static content delivery (it does not use `printf`, it is actually 11 times faster than in generating JSON compared to `printf`). + +**Netdata** will use some CPU and memory, but it **will not produce any disk I/O at all**, apart its logs (which you can disable if you like). + +Most servers should have plenty of CPU resources (I consider a hardware upgrade or application split when a server averages around 40% CPU utilization at the peak hour). Even if a server has limited CPU resources available, you can just lower the data collection frequency of **netdata**. Going from per second to every 2 seconds data collection, will cut the **netdata** CPU requirements in half and you will still get charts that are just 2 seconds behind. + +The same goes for memory. If you just keep an hour of data (which is perfect for performance troubleshooting), you will most probably need 15-20MB. You can also enable the kernel de-duper (Kernel Same-Page Merging) and **netdata** will offer to it all its round robin database. KSM can free 20-60% of the memory used by **netdata** (guess why: there are a lot of metrics that are always zero or just constant). + +When netdata runs on modern computers (even on CELERON processors), most chart queries are replied in less than 3 milliseconds! **Not seconds, MILLISECONDS!** Less than 3 milliseconds for calculating the chart, generating JSON text, compressing it and sending it to your web browser. Timings are logged in netdata's `access.log` for you to examine. + +Netdata is written in plain `C` and the key system plugins are written in `C` too. Its speed can only be compared to the native console system administration tools. + +You can also stress test your netdata installation by running the script `tests/stress.sh` found in the distribution. Most modern server hardware can serve more than 300 chart refreshes per second per core. A raspberry pi 2, can serve 300+ chart refreshes per second utilizing all of its 4 cores. + + +## No disk I/O at all + +Netdata does not use any disk I/O, apart from its logs and even these can be disabled. + +Netdata will use some memory (you size it, check [[Memory Requirements]] and CPU (below 2% of a single core for the daemon, plugins may require more, check [[Performance]]), but normally your systems should have plenty of these resources available and spare. + +The design goal of **NO DISK I/O AT ALL** effectively means netdata will not disrupt your applications. + +## No root access + +You don't need to run netdata as root. If started as root, netdata will switch to the `netdata` user (or any other user given in its configuration or command line argument). + +There are a few plugins that in order to collect values need root access. These (and only these) are setuid to root. + +## Visualizes QoS + +Netdata visualizes `tc` QoS classes automatically. If you also use FireQOS, it will also collect interface and class names. + +Check this animated GIF (generated with [ScreenToGif](https://github.com/NickeManarin/ScreenToGif)): + + + +## Embedded web server + +> Most solutions require dedicated servers to actually use the monitoring console. To my perspective, this is totally unneeded for performance monitoring. All of us have a spectacular tool on our desktops, that allows us to connect in real time to any server in the world: **the web browser**. It shouldn't be so hard to use the same tool to connect in real-time to all our servers. + +With **netdata**, there is no need to centralize anything for performance monitoring. You view everything directly from their source. No need to run something else to access netdata. Of course you can use a firewall, or a reverse proxy, to limit access to it. But for most systems, inside your DMZ, just running it will be enough. + +Still, with **netdata** you can build dashboards with charts from any number of servers. And these charts will be connected to each other much like the ones that come from the same server. You will hover on one and all of them will show the relative value for the selected timestamp. You will zoom or pan one and all of them will follow. **Netdata** achieves that because the logic that connects the charts together is at the browser, not the server, so that all charts presented on the same page are connected, no matter where they come from. + +## Performance monitoring, scaled properly + +"Properly"? What is "properly"? + +We know software solutions can **scale up** (i.e. you replace its resources with bigger ones), or **scale out** (i.e. you add more smaller resources to it). In both cases, to get more of it, you need to supply **more resources**. + +So, what is "scaled properly"? + +Traditionally, monitoring solutions centralize all metric data to provide unified dashboards across all servers. So, you install agents on all your servers to collect system and application metrics which are then sent to a central place for storage and processing. Depending on the solution you use, the central place can either **scale up** or **scale out** (or a mix of the two). + +"Scaled properly" is something completely different. "Scaled properly" minimizes the need for a "central place", so that **there is nothing to be scaled**! + +Wait a moment! You cannot take out the "central place" of a monitoring solution! + +Yes, we can! well... most of it, but before explaining how, let's see what happens today: + +Monitoring solutions are a key component for any online service. These solutions usually consume considerable amount of resources. This is true for both "scale-up" and "scale-out" solutions. These resources require maintenance and administration too. To balance the resources required, these monitoring solutions follow a few simple rules: + +1. The number of metrics collected per server is limited. They collect CPU, RAM, DISK, NETWORK metrics and a few application metrics. + +2. The data collection frequency of each metric is also very low, at best it is once every 10 or 15 seconds, at worst every 5 or 10 mins. + +Due to all the above, most centralized monitoring solutions are usually good for alarms and **statistics of past performance**. The alarms usually trigger every 1 to 5 minutes and you get a few low-resolution charts about the past performance of your servers. + +Well... there is something wrong in this approach! Can you see it? + +Let's see the netdata approach: + +1. Data collection happens **per second**. This allows true real-time performance monitoring. + +2. **Thousands of metrics** per server and application are collected, **every single second**. The number of metrics collected is not a problem. + +3. Data do not leave the server they are collected. Data are not centralized, so the need for a huge central place that will process and store gazillions of data is not needed. + + > Ok, I hear a few of you complaining already - you will find out... patience... + +4. netdata does not use any DISK I/O while running (apart its log files - and even these can be disabled) and netdata runs with the lowest possible process priority, so that **your applications will never be affected by it**. + +5. Each netdata is standalone. Your web browser connects directly to each server to present real-time dashboards. The charts are so snappy, so real-time, so fast that we can call netdata, **a console killer for performance monitoring**. + +The charting libraries **netdata** uses, are the fastest possible ([Dygraphs](http://dygraphs.com/) do make the difference!) and **netdata** respects browser resources. Data are just rendered on a canvas. No processing in javascript at all. + +6. netdata is very efficient: just 2% of a single core is required and some RAM, and you can actually control how much of both you want to allocate to it. + + +Server side, chart data generation scales pretty well. You can expect 400+ chart refreshes per second per core on modern hardware. For a page with 10 charts visible (the page may have hundreds, but only the visible are refreshed), just a tiny fraction of a single CPU core will be used for servicing them. Even these refreshes stop when you switch tabs on your browser, you focus on another window, scroll to a part of the page without charts, zoom or pan a chart. And of course the **netdata** server runs with the lowest possible process priority, so that your production environment, your applications, will not be slowed down by the netdata server. + +7. netdata dashboards can be multi-server (check: [http://my-netdata.io](http://my-netdata.io)) - your browser connects to each netdata server directly. + +So, using netdata, your monitoring infrastructure is embedded on each server, limiting significantly the need of additional resources. netdata is very resource efficient and utilizes server resources that already exist and are spare (on each server). + +Of course, there are a few issues that need to be addressed with this approach: + +1. We need an index of all netdata installations we have +2. We need a place to handle notifications and alarms +3. We need a place to save statistics of past performance + +Our approach uses the netdata [registry](../registry/). The registry solves the problem of maintaining a list of all the netdata installations we have. It does this transparently, without any configuration. It tracks the netdata servers your web browser has visited and bookmarks them at the `my-netdata` menu. + +Every netdata can be a registry. You can use the global one we provided for free, or pick one of your netdata servers and turn it to a registry for your network. diff --git a/doc/a-github-star-is-important.md b/doc/a-github-star-is-important.md new file mode 100644 index 000000000..c00fba300 --- /dev/null +++ b/doc/a-github-star-is-important.md @@ -0,0 +1,13 @@ +# A GitHub start is important + +**GitHub stars** allow netdata to expand its reach, its community, especially attract people with skills willing to contribute to it. + +Compared to its first release, netdata is now **twice as fast**, has all its bugs settled and a lot more functionality. This happened because a lot of people find it useful, use it daily at home and work, **rely on it** and **contribute to it**. + +**GitHub stars** also **motivate** us. They state that you find our work **useful**. They give us strength to continue, to work **harder** to make it even **better**. + +So, give netdata a **GitHub star**, at the top right of this page. + +Thank you! + +Costa Tsaousis diff --git a/doc/high-performance-netdata.md b/doc/high-performance-netdata.md new file mode 100644 index 000000000..1671acab8 --- /dev/null +++ b/doc/high-performance-netdata.md @@ -0,0 +1,149 @@ +# High performance netdata + +If you plan to run a netdata public on the internet, you will get the most performance out of it by following these rules: + +## 1. run behind nginx + +The internal web server is optimized to provide the best experience with few clients connected to it. Normally a web browser will make 4-6 concurrent connections to a web server, so that it can send requests in parallel. To best serve a single client, netdata spawns a thread for each connection it receives (so 4-6 threads per connected web browser). + +If you plan to have your netdata public on the internet, this strategy wastes resources. It provides a lock-free environment so each thread is autonomous to serve the browser, but it does not scale well. Running netdata behind nginx, idle connections to netdata can be reused, thus improving significantly the performance of netdata. + +In the following nginx configuration we do the following: + +- allow nginx to maintain up to 1024 idle connections to netdata (so netdata will have up to 1024 threads waiting for requests) + +- allow nginx to compress the responses of netdata (later we will disable gzip compression at netdata) + +- we disable wordpress pingback attacks and allow only GET, HEAD and OPTIONS requests. + +``` +upstream backend { + server 127.0.0.1:19999; + keepalive 1024; +} + +server { + listen *:80; + server_name my.web.server.name; + + location / { + proxy_set_header X-Forwarded-Host $host; + proxy_set_header X-Forwarded-Server $host; + proxy_set_header X-Forwarded-For $proxy_add_x_forwarded_for; + proxy_pass http://backend; + proxy_http_version 1.1; + proxy_pass_request_headers on; + proxy_set_header Connection "keep-alive"; + proxy_store off; + gzip on; + gzip_proxied any; + gzip_types *; + + # Block any HTTP requests other than GET, HEAD, and OPTIONS + limit_except GET HEAD OPTIONS { + deny all; + } + } + + # WordPress Pingback Request Denial + if ($http_user_agent ~* "WordPress") { + return 403; + } + +} +``` + +Then edit `/etc/netdata/netdata.conf` and set these config options: + +``` +[global] + bind socket to IP = 127.0.0.1 + access log = none + disconnect idle web clients after seconds = 3600 + enable web responses gzip compression = no +``` + +These options: + +- `[global].bind socket to IP = 127.0.0.1` makes netdata listen only for requests from localhost (nginx). +- `[global].access log = none` disables the access.log of netdata. It is not needed since netdata only listens for requests on 127.0.0.1 and thus only nginx can access it. nginx has its own access.log for your record. +- `[global].disconnect idle web clients after seconds = 3600` will kill inactive web threads after an hour of inactivity. +- `[global].enable web responses gzip compression = no` disables gzip compression at netdata (nginx will compress the responses). + +## 2. increase open files limit (non-systemd) + +By default Linux limits open file descriptors per process to 1024. This means that less than half of this number of client connections can be accepted by both nginx and netdata. To increase them, create 2 new files: + +1. `/etc/security/limits.d/nginx.conf`, with these contents: + + ``` +nginx soft nofile 10000 +nginx hard nofile 30000 +``` + +2. `/etc/security/limits.d/netdata.conf`, with these contents: + + ``` +netdata soft nofile 10000 +netdata hard nofile 30000 +``` + +and to activate them, run: + +```sh +sysctl -p +``` + +## 2b. increase open files limit (systemd) + +Thanks to [@leleobhz](https://github.com/netdata/netdata/issues/655#issue-163932584), this is what you need to raise the limits using systemd: + +This is based on https://ma.ttias.be/increase-open-files-limit-in-mariadb-on-centos-7-with-systemd/ and here worked as following: + +1. Create the folders in /etc: + + ``` +mkdir -p /etc/systemd/system/netdata.service.d +mkdir -p /etc/systemd/system/nginx.service.d +``` + +2. Create limits.conf in each folder as following: + + ``` +[Service] +LimitNOFILE=30000 +``` + +3. Reload systemd daemon list and restart services: + + ```sh +systemctl daemon-reload +systemctl restart netdata.service +systemctl restart nginx.service +``` + +You can check limits with following commands: + +```sh +cat /proc/$(ps aux | grep "nginx: master process" | grep -v grep | awk '{print $2}')/limits | grep "Max open files" +cat /proc/$(ps aux | grep "netdata" | head -n1 | grep -v grep | awk '{print $2}')/limits | grep "Max open files" +``` + +View of the files: + +```sh +# tree /etc/systemd/system/*service.d/etc/systemd/system/netdata.service.d +/etc/systemd/system/netdata.service.d +└── limits.conf +/etc/systemd/system/nginx.service.d +└── limits.conf + +0 directories, 2 files + +# cat /proc/$(ps aux | grep "nginx: master process" | grep -v grep | awk '{print $2}')/limits | grep "Max open files" +Max open files 30000 30000 files + +# cat /proc/$(ps aux | grep "netdata" | head -n1 | grep -v grep | awk '{print $2}')/limits | grep "Max open files" +Max open files 30000 30000 files + +``` diff --git a/doc/netdata-for-IoT.md b/doc/netdata-for-IoT.md new file mode 100644 index 000000000..ea7798722 --- /dev/null +++ b/doc/netdata-for-IoT.md @@ -0,0 +1,199 @@ +# Netdata for IoT + + + +> New to netdata? Check its demo: **[https://my-netdata.io/](https://my-netdata.io/)** +> +> [](https://registry.my-netdata.io/#netdata_registry) [](https://registry.my-netdata.io/#netdata_registry) [](https://registry.my-netdata.io/#netdata_registry) +> +> [](https://registry.my-netdata.io/#netdata_registry) [](https://registry.my-netdata.io/#netdata_registry) [](https://registry.my-netdata.io/#netdata_registry) + +--- + +netdata is a **very efficient** server performance monitoring solution. When running in server hardware, it can collect thousands of system and application metrics **per second** with just 1% CPU utilization of a single core. Its web server responds to most data requests in about **half a millisecond** making its web dashboards spontaneous, amazingly fast! + +netdata can also be a very efficient real-time monitoring solution for **IoT devices** (RPIs, routers, media players, wifi access points, industrial controllers and sensors of all kinds). Netdata will generally run everywhere a Linux kernel runs (and it is glibc and [musl-libc](https://www.musl-libc.org/) friendly). + +You can use it as both a data collection agent (where you pull data using its API), for embedding its charts on other web pages / consoles, but also for accessing it directly with your browser to view its dashboard. + +The netdata web API already provides **reduce** functions allowing it to report **average** and **max** for any timeframe. It can also respond in many formats including JSON, JSONP, CSV, HTML. Its API is also a **google charts** provider so it can directly be used by google sheets, google charts, google widgets. + + + +Although netdata has been significantly optimized to lower the CPU and RAM resources it consumes, the plethora of data collection plugins may be inappropriate for weak IoT devices. + +> keep in mind that netdata on RPi 2 and 3 does not require any tuning. The default settings will be good. The following tunables apply only when running netdata on RPi 1 or other very weak IoT devices. + +Here are a few tricks to control the resources consumed by netdata: + +## 1. Disable External plugins + +External plugins can consume more system resources than the netdata server. Disable the ones you don't need. + +Edit `/etc/netdata/netdata.conf`, find the `[plugins]` section: + +``` +[plugins] + proc = yes + + tc = no + idlejitter = no + cgroups = no + checks = no + apps = no + charts.d = no + node.d = no + + plugins directory = /usr/libexec/netdata/plugins.d + enable running new plugins = no + check for new plugins every = 60 +``` + +In detail: + +plugin|description +:---:|:--------- +`proc`|the internal plugin used to monitor the system. Normally, you don't want to disable this. You can disable individual functions of it at the next section. +`tc`|monitoring network interfaces QoS (tc classes) +`idlejitter`|internal plugin (written in C) that attempts show if the systems starved for CPU. Disabling it will eliminate a thread. +`cgroups`|monitoring linux containers. Most probably you are not going to need it. This will also eliminate another thread. +`checks`|a debugging plugin, which is disabled by default. +`apps`|a plugin that monitors system processes. It is very complex and heavy (heavier than the netdata daemon), so if you don't need to monitor the process tree, you can disable it. +`charts.d`|BASH plugins (squid, nginx, mysql, etc). This is again a heavy plugin. +`node.d`|node.js plugin, currently used for SNMP data collection and monitoring named (the name server). + +For most IoT devices, you can disable all plugins except `proc`. For `proc` there is another section that controls which functions of it you need. Check the next section. + +--- + +## 2. Disable internal plugins + +In this section you can select which modules of the `proc` plugin you need. All these are run in a single thread, one after another. Still, each one needs some RAM and consumes some CPU cycles. + +``` +[plugin:proc] + # /proc/net/dev = yes # network interfaces + # /proc/diskstats = yes # disks + # /proc/net/snmp = yes # generic IPv4 + # /proc/net/snmp6 = yes # generic IPv6 + # /proc/net/netstat = yes # TCP and UDP + # /proc/net/stat/conntrack = yes # firewall + # /proc/net/ip_vs/stats = yes # IP load balancer + # /proc/net/stat/synproxy = yes # Anti-DDoS + # /proc/stat = yes # CPU, context switches + # /proc/meminfo = yes # Memory + # /proc/vmstat = yes # Memory operations + # /proc/net/rpc/nfsd = yes # NFS Server + # /proc/sys/kernel/random/entropy_avail = yes # Cryptography + # /proc/interrupts = yes # Interrupts + # /proc/softirqs = yes # SoftIRQs + # /proc/loadavg = yes # Load Average + # /sys/kernel/mm/ksm = yes # Memory deduper + # netdata server resources = yes # netdata charts +``` + +--- + +## 3. Disable logs + +Normally, you will not need them. To disable them, set: + +``` +[global] + debug log = none + error log = none + access log = none +``` + +--- + +## 4. Set memory mode to RAM + +Setting the memory mode to `ram` will disable loading and saving the round robin database. This will not affect anything while running netdata, but it might be required if you have very limited storage available. + +``` +[global] + memory mode = ram +``` + +--- + +## 5. CPU utilization + +If after disabling the plugins you don't need, netdata still uses a lot of CPU without any clients accessing the dashboard, try lowering its data collection frequency. Going from "once per second" to "once every two seconds" will not have a significant difference on the user experience, but it will cut the CPU resources required **in half**. + +To set the update frequency, edit `/etc/netdata/netdata.conf` and set: + +``` +[global] + update every = 2 +``` + +You may have to increase this to 5 or 10 if the CPU of the device is weak. + +Keep in mind this will also force dashboard chart refreshes to happen at the same rate. So increasing this number actually lowers data collection frequency but also lowers dashboard chart refreshes frequency. + +This is a dashboard on a device with `[global].update every = 5` (this device is a media player and is now playing a movie): + + + +--- + +## 6. Lower memory requirements + +You can set the default size of the round robin database for all charts, using: + +``` +[global] + history = 600 +``` + +The units for history is `[global].update every` seconds. So if `[global].update every = 6` and `[global].history = 600`, you will have an hour of data ( 6 x 600 = 3.600 ), which will store 600 points per dimension, one every 6 seconds. + +Check also [[Memory Requirements]] for directions on calculating the size of the round robin database. + +--- + +## 7. Disable gzip compression of responses + +Gzip compression of the web responses is using more CPU that the rest of netdata. You can lower the compression level or disable gzip compression completely. You can disable it, like this: + +``` +[web] + enable gzip compression = no +``` + +To lower the compression level, do this: + +``` +[web] + enable gzip compression = yes + gzip compression level = 1 +``` + +--- + +Finally, if no web server is installed on your device, you can use port tcp/80 for netdata: + +``` +[global] + port = 80 +``` + +--- + +## 8. Monitoring RPi temperature + +The python version of the sensors plugin uses `lm-sensors`. Unfortunately the temperature reading of RPi are not supported by `lm-sensors`. + +netdata also has a bash version of the sensors plugin that can read RPi temperatures. It is disabled by default to avoid the conflicts with the python version. + +To enable it, edit `/etc/netdata/charts.d.conf` and uncomment this line: + +```sh +sensors=force +``` + +Then restart netdata. You will get this: + +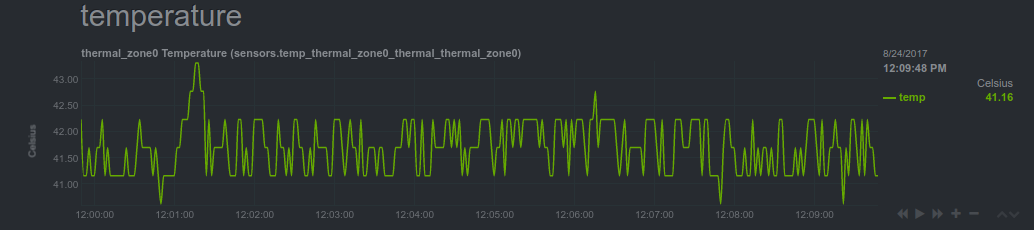 diff --git a/doc/netdata-security.md b/doc/netdata-security.md new file mode 100644 index 000000000..79858656b --- /dev/null +++ b/doc/netdata-security.md @@ -0,0 +1,179 @@ +# Netdata Security + +We have given special attention to all aspects of netdata, ensuring that everything throughout its operation is as secure as possible. netdata has been designed with security in mind. + +**Table of Contents** + +1. [your data are safe with netdata](#your-data-are-safe-with-netdata) +2. [your systems are safe with netdata](#your-systems-are-safe-with-netdata) +3. [netdata is read-only](#netdata-is-read-only) +4. [netdata viewers authentication](#netdata-viewers-authentication) + - [why netdata should be protected](#why-netdata-should-be-protected) + - [protect netdata from the internet](#protect-netdata-from-the-internet) + - [expose netdata only in a private LAN](#expose-netdata-only-in-a-private-lan) + - [use an authenticating web server in proxy mode](#use-an-authenticating-web-server-in-proxy-mode) + - [other methods](#other-methods) +5. [registry or how to not send any information to a third party server](#registry-or-how-to-not-send-any-information-to-a-third-party-server) + +## your data are safe with netdata + +netdata collects raw data from many sources. For each source, netdata uses a plugin that connects to the source (or reads the relative files produced by the source), receives raw data and processes them to calculate the metrics shown on netdata dashboards. + +Even if netdata plugins connect to your database server, or read your application log file to collect raw data, the product of this data collection process is always a number of **chart metadata and metric values** (summarized data for dashboard visualization). All netdata plugins (internal to the netdata daemon, and external ones written in any computer language), convert raw data collected into metrics, and only these metrics are stored in netdata databases, sent to upstream netdata servers, or archived to backend time-series databases. + +> The **raw data** collected by netdata, do not leave the host they are collected. **The only data netdata exposes are chart metadata and metric values.** + +This means that netdata can safely be used in environments that require the highest level of data isolation (like PCI Level 1). + +## your systems are safe with netdata + +We are very proud that **the netdata daemon runs as a normal system user, without any special privileges**. This is quite an achievement for a monitoring system that collects all kinds of system and application metrics. + +There are a few cases however that raw source data are only exposed to processes with escalated privileges. To support these cases, netdata attempts to minimize and completely isolate the code that runs with escalated privileges. + +So, netdata **plugins**, even those running with escalated capabilities or privileges, perform a **hard coded data collection job**. They do not accept commands from netdata. The communication is strictly **unidirectional**: from the plugin towards the netdata daemon. The original application data collected by each plugin do not leave the process they are collected, are not saved and are not transferred to the netdata daemon. The communication from the plugins to the netdata daemon includes only chart metadata and processed metric values. + +netdata slaves streaming metrics to upstream netdata servers, use exactly the same protocol local plugins use. The raw data collected by the plugins of slave netdata servers are **never leaving the host they are collected**. The only data appearing on the wire are chart metadata and metric values. This communication is also **unidirectional**: slave netdata servers never accept commands from master netdata servers. + +## netdata is read-only + +netdata **dashboards are read-only**. Dashboard users can view and examine metrics collected by netdata, but cannot instruct netdata to do something other than present the already collected metrics. + +netdata dashboards do not expose sensitive information. Business data of any kind, the kernel version, O/S version, application versions, host IPs, etc are not stored and are not exposed by netdata on its dashboards. + +## netdata viewers authentication + +netdata is a monitoring system. It should be protected, the same way you protect all your admin apps. We assume netdata will be installed privately, for your eyes only. + +### why netdata should be protected + +Viewers will be able to get some information about the system netdata is running. This information is everything the dashboard provides. The dashboard includes a list of the services each system runs (the legends of the charts under the `Systemd Services` section), the applications running (the legends of the charts under the `Applications` section), the disks of the system and their names, the user accounts of the system that are running processes (the `Users` and `User Groups` section of the dashboard), the network interfaces and their names (not the IPs) and detailed information about the performance of the system and its applications. + +This information is not sensitive (meaning that it is not your business data), but **it is important for possible attackers**. It will give them clues on what to check, what to try and in the case of DDoS against your applications, they will know if they are doing it right or not. + +Also, viewers could use netdata itself to stress your servers. Although the netdata daemon runs unprivileged, with the minimum process priority (scheduling priority `idle` - lower than nice 19) and adjusts its OutOfMemory (OOM) score to 1000 (so that it will be first to be killed by the kernel if the system starves for memory), some pressure can be applied on your systems if someone attempts a DDoS against netdata. + +### protect netdata from the internet + +netdata is a distributed application. Most likely you will have many installations of it. Since it is distributed and you are expected to jump from server to server, there is very little usability to add authentication local on each netdata. + +Until we add a distributed authentication method to netdata, you have the following options: + +#### expose netdata only in a private LAN + +If your organisation has a private administration and management LAN, you can bind netdata on this network interface on all your servers. This is done in `netdata.conf` with these settings: + +``` +[web] + bind to = 10.1.1.1:19999 localhost:19999 +``` + +You can bind netdata to multiple IPs and ports. If you use hostnames, netdata will resolve them and use all the IPs (in the above example `localhost` usually resolves to both `127.0.0.1` and `::1`). + +**This is the best and the suggested way to protect netdata**. Your systems **should** have a private administration and management LAN, so that all management tasks are performed without any possibility of them being exposed on the internet. + +For cloud based installations, if your cloud provider does not provide such a private LAN (or if you use multiple providers), you can create a virtual management and administration LAN with tools like `tincd` or `gvpe`. These tools create a mesh VPN allowing all servers to communicate securely and privately. Your administration stations join this mesh VPN to get access to management and administration tasks on all your cloud servers. + +For `gvpe` we have developed a [simple provisioning tool](https://github.com/netdata/netdata-demo-site/tree/master/gvpe) you may find handy (it includes statically compiled `gvpe` binaries for Linux and FreeBSD, and also a script to compile `gvpe` on your Mac). We use this to create a management and administration LAN for all netdata demo sites (spread all over the internet using multiple hosting providers). + +--- + +In netdata v1.9+ there is also access list support, like this: + +``` +[web] + bind to = * + allow connections from = localhost 10.* 192.168.* +``` + + +#### use an authenticating web server in proxy mode + +Use **one nginx** (or one apache) server to provide authentication in front of **all your netdata servers**. So, you will be accessing all your netdata with URLs like `http://nginx.host/netdata/{NETDATA_HOSTNAME}/` and authentication will be shared among all of them (you will sign-in once for all your servers). Check [this wiki page for more information on configuring nginx for such a setup](Running-behind-nginx.md#netdata-via-nginx). + +To use this method, you should firewall protect all your netdata servers, so that only the nginx IP will allowed to directly access netdata. To do this, run this on each of your servers (or use your firewall manager): + +```sh +NGINX_IP="1.2.3.4" +iptables -t filter -I INPUT -p tcp --dport 19999 \! -s ${NGINX_IP} -m conntrack --ctstate NEW -j DROP +``` +_commands to allow direct access to netdata from an nginx proxy_ + +The above will prevent anyone except your nginx server to access a netdata dashboard running on the host. + +For netdata v1.9+ you can also use `netdata.conf`: + +``` +[web] + allow connections from = localhost 1.2.3.4 +``` + +Of course you can add more IPs. + +For netdata prior to v1.9, if you want to allow multiple IPs, use this: + +```sh +# space separated list of IPs to allow access netdata +NETDATA_ALLOWED="1.2.3.4 5.6.7.8 9.10.11.12" +NETDATA_PORT=19999 + +# create a new filtering chain || or empty an existing one named netdata +iptables -t filter -N netdata 2>/dev/null || iptables -t filter -F netdata +for x in ${NETDATA_ALLOWED} +do + # allow this IP + iptables -t filter -A netdata -s ${x} -j ACCEPT +done + +# drop all other IPs +iptables -t filter -A netdata -j DROP + +# delete the input chain hook (if it exists) +iptables -t filter -D INPUT -p tcp --dport ${NETDATA_PORT} -m conntrack --ctstate NEW -j netdata 2>/dev/null + +# add the input chain hook (again) +# to send all new netdata connections to our filtering chain +iptables -t filter -I INPUT -p tcp --dport ${NETDATA_PORT} -m conntrack --ctstate NEW -j netdata +``` +_script to allow access to netdata only from a number of hosts_ + +You can run the above any number of times. Each time it runs it refreshes the list of allowed hosts. + +#### other methods + +Of course, there are many more methods you could use to protect netdata: + +- bind netdata to localhost and use `ssh -L 19998:127.0.0.1:19999 remote.netdata.ip` to forward connections of local port 19998 to remote port 19999. This way you can ssh to a netdata server and then use `http://127.0.0.1:19998/` on your computer to access the remote netdata dashboard. + +- If you are always under a static IP, you can use the script given above to allow direct access to your netdata servers without authentication, from all your static IPs. + +- install all your netdata in **headless data collector** mode, forwarding all metrics in real-time to a master netdata server, which will be protected with authentication using an nginx server running locally at the master netdata server. This requires more resources (you will need a bigger master netdata server), but does not require any firewall changes, since all the slave netdata servers will not be listening for incoming connections. + +## registry or how to not send any information to a third party server + +The default configuration uses a public registry under registry.my-netdata.io (more information about the registry here: [mynetdata-menu-item](../registry/) ). Please be aware that if you use that public registry, you submit at least the following information to a third party server, which might violate your security policies: +- Your public ip where the browser runs +- The url where you open the web-ui in the browser (via http request referer) +- The hostnames of the netdata servers + +You are able to run your own registry, which is pretty simple to do: +- If you have just one netdata web-ui, turn on registry and set the url of that web-ui as "registry to announce" +``` +[registry] +enabled = yes +registry to announce = URL_OF_THE_NETDATA_WEB-UI +``` +- If you run multiple netdata servers with web-ui, you need to define one as registry. On that node activate the registry and setting its url as "registry to announce". On all other nodes do not enable the registry but define the same url. + +restart netdata and check with developer tools of your browser which registry is called. + +## netdata directories + +path|owner|permissions| netdata |comments| +:---|:----|:----------|:--------|:-------| +`/etc/netdata`|user `root`<br/>group `netdata`|dirs `0755`<br/>files `0640`|reads|**netdata config files**<br/>may contain sensitive information, so group `netdata` is allowed to read them. +`/usr/libexec/netdata`|user `root`<br/>group `root`|executable by anyone<br/>dirs `0755`<br/>files `0644` or `0755`|executes|**netdata plugins**<br/>permissions depend on the file - not all of them should have the executable flag.<br/>there are a few plugins that run with escalated privileges (Linux capabilities or `setuid`) - these plugins should be executable only by group `netdata`. +`/usr/share/netdata`|user `root`<br/>group `netdata`|readable by anyone<br/>dirs `0755`<br/>files `0644`|reads and sends over the network|**netdata web static files**<br/>these files are sent over the network to anyone that has access to the netdata web server. netdata checks the ownership of these files (using settings at the `[web]` section of `netdata.conf`) and refuses to serve them if they are not properly owned. Symbolic links are not supported. netdata also refuses to serve URLs with `..` in their name. +`/var/cache/netdata`|user `netdata`<br/>group `netdata`|dirs `0750`<br/>files `0660`|reads, writes, creates, deletes|**netdata ephemeral database files**<br/>netdata stores its ephemeral real-time database here. +`/var/lib/netdata`|user `netdata`<br/>group `netdata`|dirs `0750`<br/>files `0660`|reads, writes, creates, deletes|**netdata permanent database files**<br/>netdata stores here the registry data, health alarm log db, etc. +`/var/log/netdata`|user `netdata`<br/>group `root`|dirs `0755`<br/>files `0644`|writes, creates|**netdata log files**<br/>all the netdata applications, logs their errors or other informational messages to files in this directory. These files should be log rotated. diff --git a/docker/Dockerfile b/docker/Dockerfile index 4362a273e..a852f3044 100644 --- a/docker/Dockerfile +++ b/docker/Dockerfile @@ -86,7 +86,7 @@ RUN \ addgroup -g ${NETDATA_GID} -S netdata && \ adduser -S -H -s /usr/sbin/nologin -u ${NETDATA_GID} -h /etc/netdata -G netdata netdata && \ # Apply the permissions as described in - # https://github.com/netdata/netdata/wiki/netdata-security#netdata-directories + # https://github.com/netdata/netdata/tree/master/doc/netdata-security.md#netdata-directories chown -R root:netdata /etc/netdata && \ chown -R netdata:netdata /var/cache/netdata /var/lib/netdata /usr/share/netdata && \ chown -R root:netdata /usr/lib/netdata && \ diff --git a/docker/README.md b/docker/README.md new file mode 100644 index 000000000..d624855fb --- /dev/null +++ b/docker/README.md @@ -0,0 +1,117 @@ +# Install netdata with Docker + +> :warning: As of Sep 9th, 2018 we ship [new docker builds](https://github.com/netdata/netdata/pull/3995), running netdata in docker with an ENTRYPOINT directive, not a COMMAND directive. Please adapt your execution scripts accordingly. +> More information about ENTRYPOINT vs COMMAND is presented by goinbigdata [here](http://goinbigdata.com/docker-run-vs-cmd-vs-entrypoint/) and by docker docs [here](https://docs.docker.com/engine/reference/builder/#understand-how-cmd-and-entrypoint-interact). +> +> Also, the `latest` is now based on alpine, so **`alpine` is not updated any more** and `armv7hf` is now replaced with `armhf` (to comply with https://github.com/multiarch naming), so **`armv7hf` is not updated** either. + +## Limitations + +Running netdata in a container for monitoring the whole host, can limit its capabilities. Some data is not accessible or not as detailed as when running netdata on the host. + +## Run netdata with docker command + +Quickly start netdata with the docker command line. +Netdata is then available at http://host:19999 + +This is good for an internal network or to quickly analyse a host. + +For a permanent installation on a public server, you should [[secure the netdata instance|netdata-security]]. See below for an example of how to install netdata with an SSL reverse proxy and basic authentication. + +```bash +docker run -d --name=netdata \ + -p 19999:19999 \ + -v /proc:/host/proc:ro \ + -v /sys:/host/sys:ro \ + -v /var/run/docker.sock:/var/run/docker.sock:ro \ + --cap-add SYS_PTRACE \ + --security-opt apparmor=unconfined \ + netdata/netdata +``` + +above can be converted to docker-compose file for ease of management: + +```yaml +version: '3' +services: + netdata: + image: netdata/netdata + hostname: example.com # set to fqdn of host + ports: + - 19999:19999 + cap_add: + - SYS_PTRACE + security_opt: + - apparmor:unconfined + volumes: + - /proc:/host/proc:ro + - /sys:/host/sys:ro + - /var/run/docker.sock:/var/run/docker.sock:ro +``` + +### Docker container names resolution + +If you want to have your container names resolved by netdata it needs to have access to docker group. To achive that just add environment variable `PGID=999` to netdata container, where `999` is a docker group id from your host. This number can be found by running: +```bash +grep docker /etc/group | cut -d ':' -f 3 +``` + +## Install Netdata using Docker Compose with SSL/TLS enabled http proxy + +You can use use the following docker-compose.yml and Caddyfile files to run netdata with docker. +Replace the Domains and email address for Letsencrypt before starting. + +### Prerequisites +* [Docker](https://docs.docker.com/install/#server) +* [Docker Compose](https://docs.docker.com/compose/install/) +* Domain configured in DNS pointing to host. + +### Caddyfile + +This file needs to be placed in /opt with nams Caddyfile. Here you customize your domain and you need to provide your email address to obtain Letsencrypt certificate. +Certificate renewal will happen automatically and will be executed internally by caddy server. + +``` +netdata.example.org { + proxy / netdata:19999 + tls admin@example.org +} +``` + +### docker-compose.yml + +After setting Caddyfile run this with `docker-compose up -d` to have fully functioning netdata setup behind HTTP reverse proxy. + +```yaml +version: '3' +volumes: + caddy: + +services: + caddy: + image: abiosoft/caddy + ports: + - 80:80 + - 443:443 + volumes: + - /opt/Caddyfile:/etc/Caddyfile + - caddy:/root/.caddy + environment: + ACME_AGREE: 'true' + netdata: + restart: always + hostname: netdata.example.org + image: netdata/netdata + cap_add: + - SYS_PTRACE + security_opt: + - apparmor:unconfined + volumes: + - /proc:/host/proc:ro + - /sys:/host/sys:ro + - /var/run/docker.sock:/var/run/docker.sock:ro +``` + +### Restrict access with basic auth + +You can restrict access by following [official caddy guide](https://caddyserver.com/docs/basicauth) and adding lines to Caddyfile. diff --git a/docker/build.sh b/docker/build.sh index 908468d39..faaa2db79 100755 --- a/docker/build.sh +++ b/docker/build.sh @@ -30,7 +30,9 @@ fi # Build images using multi-arch Dockerfile. for ARCH in i386 armhf aarch64 amd64; do - docker build --build-arg ARCH="${ARCH}-v3.8" --tag "${REPOSITORY}:${VERSION}-${ARCH}" --file docker/Dockerfile ./ & + docker build --build-arg ARCH="${ARCH}-v3.8" \ + --tag "${REPOSITORY}:${VERSION}-${ARCH}" \ + --file docker/Dockerfile ./ & done wait @@ -70,14 +72,3 @@ docker --config /tmp/docker manifest push -p "${REPOSITORY}:${VERSION}" # Show current manifest (debugging purpose only) docker --config /tmp/docker manifest inspect "${REPOSITORY}:${VERSION}" -# Push netdata images to firehol organization -# TODO: Remove it after we decide to deprecate firehol/netdata docker repo -if [ "$REPOSITORY" != "netdata" ]; then - echo "$OLD_DOCKER_PASSWORD" | docker login -u "$OLD_DOCKER_USERNAME" --password-stdin - for ARCH in amd64 i386 armhf aarch64; do - docker tag "${REPOSITORY}:${VERSION}-${ARCH}" "firehol/netdata:${ARCH}" - docker push "firehol/netdata:${ARCH}" - done - docker tag "${REPOSITORY}:${VERSION}-amd64" "firehol/netdata:${VERSION}" - docker push "firehol/netdata:${VERSION}" -fi diff --git a/health/README.md b/health/README.md index 597bd3c32..5d68d752a 100644 --- a/health/README.md +++ b/health/README.md @@ -1,4 +1,3 @@ - # Health monitoring Each netdata node runs an independent thread evaluating health monitoring checks. @@ -40,16 +39,16 @@ killall -USR2 netdata There are 2 entities: -1. **alarms**, which are attached to specific charts, and +1. **alarms**, which are attached to specific charts, and -2. **templates**, which define rules that should be applied to all charts having a +1. **templates**, which define rules that should be applied to all charts having a specific `context`. You can use this feature to apply **alarms** to all disks, all network interfaces, all mysql databases, all nginx web servers, etc. Both of these entities have exactly the same format and feature set. The only difference is the label `alarm` or `template`. -netdata supports overriding **templates** with **alarms**. +Netdata supports overriding **templates** with **alarms**. For example, when a template is defined for a set of charts, an alarm with exactly the same name attached to the same chart the template matches, will have higher precedence (i.e. netdata will use the alarm on this chart and prevent the template from being applied @@ -59,7 +58,7 @@ to it). The following lines are parsed. -#### alarm line `alarm` or `template` +#### Alarm line `alarm` or `template` This line starts an alarm or alarm template. @@ -78,7 +77,7 @@ This line has to be first on each alarm or template. --- -#### alarm line `on` +#### Alarm line `on` This line defines the data the alarm should be attached to. @@ -112,7 +111,7 @@ So, `plugin = proc`, `module = /proc/net/dev` and `context = net.net`. --- -#### alarm line `os` +#### Alarm line `os` This alarm or template will be used only if the O/S of the host loading it, matches this pattern list. The value is a space separated list of simple patterns (use `*` as wildcard, @@ -124,7 +123,7 @@ os: linux freebsd macos --- -#### alarm line `hosts` +#### Alarm line `hosts` This alarm or template will be used only if the hostname of the host loading it, matches this pattern list. The value is a space separated list of simple patterns (use `*` as wildcard, @@ -141,7 +140,7 @@ This is useful when you centralize metrics from multiple hosts, to one netdata. --- -#### alarm line `families` +#### Alarm line `families` This line is only used in alarm templates. It filters the charts. So, if you need to create an alarm template for a few of a kind of chart (a few of your disks, or a few of your network @@ -165,7 +164,7 @@ The family of a chart is usually the submenu of the netdata dashboard it appears --- -#### alarm line `lookup` +#### Alarm line `lookup` This lines makes a database lookup to find a value. This result of this lookup is available as `$this`. @@ -205,7 +204,7 @@ The timestamps of the timeframe evaluated by the database lookup is available as --- -#### alarm line `calc` +#### Alarm line `calc` This expression is evaluated just after the `lookup` (if any). Its purpose is to apply some calculation before using the value looked up from the db. @@ -225,7 +224,7 @@ Check [Expressions](#expressions) for more information. --- -#### alarm line `every` +#### Alarm line `every` Sets the update frequency of this alarm. This is the same to the `every DURATION` given in the `lookup` lines. @@ -240,7 +239,7 @@ every: DURATION --- -#### alarm lines `green` and `red` +#### Alarm lines `green` and `red` Set the green and red thresholds of a chart. Both are available as `$green` and `$red` in expressions. If multiple alarms define different thresholds, the ones defined by the first @@ -257,7 +256,7 @@ red: NUMBER --- -#### alarm lines `warn` and `crit` +#### Alarm lines `warn` and `crit` These expressions should evaluate to true or false (alternatively non-zero or zero). They trigger the alarm. Both are optional. @@ -272,7 +271,7 @@ Check [Expressions](#expressions) for more information. --- -#### alarm line `to` +#### Alarm line `to` This will be the first parameter of the script to be executed when the alarm switches status. Its meaning is left up to the `exec` script. @@ -288,7 +287,7 @@ to: ROLE1 ROLE2 ROLE3 ... --- -#### alarm line `exec` +#### Alarm line `exec` The script that will be executed when the alarm changes status. @@ -303,7 +302,7 @@ methods netdata supports, including custom hooks. --- -#### alarm line `delay` +#### Alarm line `delay` This is used to provide optional hysteresis settings for the notifications, to defend against notification floods. These settings do not affect the actual alarm - only the time @@ -374,13 +373,9 @@ Expressions can have variables. Variables start with `$`. Check below for more i There are two special values you can use: - - `nan`, for example `$this != nan` will check if the variable `this` is available. - A variable can be `nan` if the database lookup failed. All calculations (i.e. addition, - multiplication, etc) with a `nan` result in a `nan`. +- `nan`, for example `$this != nan` will check if the variable `this` is available. A variable can be `nan` if the database lookup failed. All calculations (i.e. addition, multiplication, etc) with a `nan` result in a `nan`. - - `inf`, for example `$this != inf` will check if `this` is not infinite. A value or - variable can be infinite if divided by zero. All calculations (i.e. addition, - multiplication, etc) with a `inf` result in a `inf`. +- `inf`, for example `$this != inf` will check if `this` is not infinite. A value or variable can be infinite if divided by zero. All calculations (i.e. addition, multiplication, etc) with a `inf` result in a `inf`. --- @@ -412,10 +407,10 @@ Which in turn, results in the following behavior: * While the value is falling, it will return to a warning state when it goes below 85, and a normal state when it goes below 75. - + * If the value is constantly varying between 80 and 90, then it will trigger a warning the first time it goes above 85, but will remain a warning until it goes below 75 (or goes above 85). - + * If the value is constantly varying between 90 and 100, then it will trigger a critical alert the first time it goes above 95, but will remain a critical alert goes below 85 (at which point it will return to being a warning). @@ -490,8 +485,7 @@ The external script will be called for all status changes. ## Examples - -Check the **[health.d directory](health.d)** for all alarms shipped with netdata. +Check the `health/health.d/` directory for all alarms shipped with netdata. Here are a few examples: @@ -650,8 +644,5 @@ Important: this will generate a lot of output in debug.log. You can find the context of charts by looking up the chart in either `http://your.netdata:19999/netdata.conf` or `http://your.netdata:19999/api/v1/charts`. -You can find how netdata interpreted the expressions by examining the alarm at -`http://your.netdata:19999/api/v1/alarms?all`. For each expression, netdata will return the -expression as given in its config file, and the same expression with additional parentheses -added to indicate the evaluation flow of the expression. +You can find how netdata interpreted the expressions by examining the alarm at `http://your.netdata:19999/api/v1/alarms?all`. For each expression, netdata will return the expression as given in its config file, and the same expression with additional parentheses added to indicate the evaluation flow of the expression. diff --git a/health/health.d/net.conf b/health/health.d/net.conf index 489016dd5..ae3c26ec6 100644 --- a/health/health.d/net.conf +++ b/health/health.d/net.conf @@ -4,13 +4,23 @@ # ----------------------------------------------------------------------------- # net traffic overflow + template: interface_speed + on: net.net + os: * + hosts: * + families: * + calc: ( $nic_speed_max > 0 ) ? ( $nic_speed_max) : ( nan ) + units: Mbit + every: 10s + info: The current speed of the physical network interface + template: 1m_received_traffic_overflow on: net.net os: linux hosts: * families: * lookup: average -1m unaligned absolute of received - calc: ($nic_speed_max > 0) ? ($this * 100 / ($nic_speed_max * 1000)) : ( nan ) + calc: ($interface_speed > 0) ? ($this * 100 / ($interface_speed * 1000)) : ( nan ) units: % every: 10s warn: $this > (($status >= $WARNING) ? (80) : (85)) @@ -25,7 +35,7 @@ hosts: * families: * lookup: average -1m unaligned absolute of sent - calc: ($nic_speed_max > 0) ? ($this * 100 / ($nic_speed_max * 1000)) : ( nan ) + calc: ($interface_speed > 0) ? ($this * 100 / ($interface_speed * 1000)) : ( nan ) units: % every: 10s warn: $this > (($status >= $WARNING) ? (80) : (85)) diff --git a/health/health_config.c b/health/health_config.c index d4af9776f..d4cf78d97 100644 --- a/health/health_config.c +++ b/health/health_config.c @@ -84,7 +84,7 @@ static inline int rrdcalctemplate_add_template_from_config(RRDHOST *host, RRDCAL return 0; } - if(unlikely(!RRDCALCTEMPLATE_HAS_CALCULATION(rt) && !rt->warning && !rt->critical)) { + if(unlikely(!RRDCALCTEMPLATE_HAS_DB_LOOKUP(rt) && !rt->calculation && !rt->warning && !rt->critical)) { error("Health configuration for template '%s' is useless (no calculation, no warning and no critical evaluation)", rt->name); return 0; } diff --git a/health/notifications/alarm-notify.sh b/health/notifications/alarm-notify.sh index 33a59590e..3331dcd94 100644 --- a/health/notifications/alarm-notify.sh +++ b/health/notifications/alarm-notify.sh @@ -896,7 +896,7 @@ date=$(date --date=@${when} "${date_format}" 2>/dev/null) # ---------------------------------------------------------------------------- # prepare some extra headers if we've been asked to thread e-mails -if [ "${SEND_EMAIL}" == "YES" -a "${EMAIL_THREADING}" == "YES" ] ; then +if [ "${SEND_EMAIL}" == "YES" -a "${EMAIL_THREADING}" != "NO" ] ; then email_thread_headers="In-Reply-To: <${chart}-${name}@${host}>\nReferences: <${chart}-${name}@${host}>" else email_thread_headers= @@ -1480,7 +1480,7 @@ send_slack() { { "channel": "#${channel}", "username": "netdata on ${host}", - "icon_url": "${images_base_url}/images/seo-performance-128.png", + "icon_url": "${images_base_url}/images/banner-icon-144x144.png", "text": "${host} ${status_message}, \`${chart}\` (_${family}_), *${alarm}*", "attachments": [ { @@ -1545,7 +1545,7 @@ send_rocketchat() { { "channel": "#${channel}", "alias": "netdata on ${host}", - "avatar": "${images_base_url}/images/seo-performance-128.png", + "avatar": "${images_base_url}/images/banner-icon-144x144.png", "text": "${host} ${status_message}, \`${chart}\` (_${family}_), *${alarm}*", "attachments": [ { @@ -1592,39 +1592,68 @@ EOF # alerta sender send_alerta() { - local webhook="${1}" channels="${2}" httpcode sent=0 channel severity content + local webhook="${1}" channels="${2}" httpcode sent=0 channel severity resource event payload auth [ "${SEND_ALERTA}" != "YES" ] && return 1 case "${status}" in - WARNING) severity="warning" ;; CRITICAL) severity="critical" ;; + WARNING) severity="warning" ;; CLEAR) severity="cleared" ;; - *) severity="unknown" ;; + *) severity="indeterminate" ;; esac - info=$( echo -n ${info}) + if [[ "${chart}" == httpcheck* ]] + then + resource=$chart + event=$name + else + resource="${host}:${family}" + event="${chart}.${name}" + fi - # the "event" property must be unique and repetible between states to let alerta do automatic correlation using severity value for channel in ${channels} do - content="{" - content="$content \"environment\": \"${channel}\"," - content="$content \"service\": [\"${host}\"]," - content="$content \"resource\": \"${host}\"," - content="$content \"event\": \"${name}.${chart} (${family})\"," - content="$content \"severity\": \"${severity}\"," - content="$content \"value\": \"${alarm}\"," - content="$content \"text\": \"${info}\"" - content="$content }" + payload="$(cat <<EOF + { + "resource": "${resource}", + "event": "${event}", + "environment": "${channel}", + "severity": "${severity}", + "service": ["Netdata"], + "group": "Performance", + "value": "${value_string}", + "text": "${info}", + "tags": ["alarm_id:${alarm_id}"], + "attributes": { + "roles": "${roles}", + "name": "${name}", + "chart": "${chart}", + "family": "${family}", + "source": "${src}", + "moreInfo": "<a href=\"${goto_url}\">View Netdata</a>" + }, + "origin": "netdata/${this_host}", + "type": "netdataAlarm", + "rawData": "${BASH_ARGV[@]}" + } +EOF + )" + if [[ -n "${ALERTA_API_KEY}" ]] + then + auth="Key ${ALERTA_API_KEY}" + fi - httpcode=$(docurl -X POST "${webhook}/alert" -H "Content-Type: application/json" -H "Authorization: Key $ALERTA_API_KEY" -d "$content" ) + httpcode=$(docurl -X POST "${webhook}/alert" -H "Content-Type: application/json" -H "Authorization: $auth" --data "${payload}") if [[ "${httpcode}" = "200" || "${httpcode}" = "201" ]] then info "sent alerta notification for: ${host} ${chart}.${name} is ${status} to '${channel}'" sent=$((sent + 1)) + elif [[ "${httpcode}" = "202" ]] + then + info "suppressed alerta notification for: ${host} ${chart}.${name} is ${status} to '${channel}'" else error "failed to send alerta notification for: ${host} ${chart}.${name} is ${status} to '${channel}', with HTTP error code ${httpcode}." fi @@ -1655,7 +1684,7 @@ send_flock() { httpcode=$(docurl -X POST "${webhook}" -H "Content-Type: application/json" -d "{ \"sendAs\": { \"name\" : \"netdata on ${host}\", - \"profileImage\" : \"${images_base_url}/images/seo-performance-128.png\" + \"profileImage\" : \"${images_base_url}/images/banner-icon-144x144.png\" }, \"text\": \"${host} *${status_message}*\", \"timestamp\": \"${when}\", @@ -1715,7 +1744,7 @@ send_discord() { "channel": "#${channel}", "username": "${username}", "text": "${host} ${status_message}, \`${chart}\` (_${family}_), *${alarm}*", - "icon_url": "${images_base_url}/images/seo-performance-128.png", + "icon_url": "${images_base_url}/images/banner-icon-144x144.png", "attachments": [ { "color": "${color}", @@ -1729,7 +1758,7 @@ send_discord() { } ], "thumb_url": "${image}", - "footer_icon": "${images_base_url}/images/seo-performance-128.png", + "footer_icon": "${images_base_url}/images/banner-icon-144x144.png", "footer": "${this_host}", "ts": ${when} } @@ -1952,7 +1981,7 @@ color="grey" alarm="${name//_/ } = ${value_string}" # the image of the alarm -image="${images_base_url}/images/seo-performance-128.png" +image="${images_base_url}/images/banner-icon-144x144.png" # prepare the title based on status case "${status}" in diff --git a/health/notifications/alarm-notify.sh.in b/health/notifications/alarm-notify.sh.in index 4aef3a521..ea8223097 100755 --- a/health/notifications/alarm-notify.sh.in +++ b/health/notifications/alarm-notify.sh.in @@ -896,7 +896,7 @@ date=$(date --date=@${when} "${date_format}" 2>/dev/null) # ---------------------------------------------------------------------------- # prepare some extra headers if we've been asked to thread e-mails -if [ "${SEND_EMAIL}" == "YES" -a "${EMAIL_THREADING}" == "YES" ] ; then +if [ "${SEND_EMAIL}" == "YES" -a "${EMAIL_THREADING}" != "NO" ] ; then email_thread_headers="In-Reply-To: <${chart}-${name}@${host}>\nReferences: <${chart}-${name}@${host}>" else email_thread_headers= @@ -1480,7 +1480,7 @@ send_slack() { { "channel": "#${channel}", "username": "netdata on ${host}", - "icon_url": "${images_base_url}/images/seo-performance-128.png", + "icon_url": "${images_base_url}/images/banner-icon-144x144.png", "text": "${host} ${status_message}, \`${chart}\` (_${family}_), *${alarm}*", "attachments": [ { @@ -1545,7 +1545,7 @@ send_rocketchat() { { "channel": "#${channel}", "alias": "netdata on ${host}", - "avatar": "${images_base_url}/images/seo-performance-128.png", + "avatar": "${images_base_url}/images/banner-icon-144x144.png", "text": "${host} ${status_message}, \`${chart}\` (_${family}_), *${alarm}*", "attachments": [ { @@ -1592,39 +1592,68 @@ EOF # alerta sender send_alerta() { - local webhook="${1}" channels="${2}" httpcode sent=0 channel severity content + local webhook="${1}" channels="${2}" httpcode sent=0 channel severity resource event payload auth [ "${SEND_ALERTA}" != "YES" ] && return 1 case "${status}" in - WARNING) severity="warning" ;; CRITICAL) severity="critical" ;; + WARNING) severity="warning" ;; CLEAR) severity="cleared" ;; - *) severity="unknown" ;; + *) severity="indeterminate" ;; esac - info=$( echo -n ${info}) + if [[ "${chart}" == httpcheck* ]] + then + resource=$chart + event=$name + else + resource="${host}:${family}" + event="${chart}.${name}" + fi - # the "event" property must be unique and repetible between states to let alerta do automatic correlation using severity value for channel in ${channels} do - content="{" - content="$content \"environment\": \"${channel}\"," - content="$content \"service\": [\"${host}\"]," - content="$content \"resource\": \"${host}\"," - content="$content \"event\": \"${name}.${chart} (${family})\"," - content="$content \"severity\": \"${severity}\"," - content="$content \"value\": \"${alarm}\"," - content="$content \"text\": \"${info}\"" - content="$content }" + payload="$(cat <<EOF + { + "resource": "${resource}", + "event": "${event}", + "environment": "${channel}", + "severity": "${severity}", + "service": ["Netdata"], + "group": "Performance", + "value": "${value_string}", + "text": "${info}", + "tags": ["alarm_id:${alarm_id}"], + "attributes": { + "roles": "${roles}", + "name": "${name}", + "chart": "${chart}", + "family": "${family}", + "source": "${src}", + "moreInfo": "<a href=\"${goto_url}\">View Netdata</a>" + }, + "origin": "netdata/${this_host}", + "type": "netdataAlarm", + "rawData": "${BASH_ARGV[@]}" + } +EOF + )" + if [[ -n "${ALERTA_API_KEY}" ]] + then + auth="Key ${ALERTA_API_KEY}" + fi - httpcode=$(docurl -X POST "${webhook}/alert" -H "Content-Type: application/json" -H "Authorization: Key $ALERTA_API_KEY" -d "$content" ) + httpcode=$(docurl -X POST "${webhook}/alert" -H "Content-Type: application/json" -H "Authorization: $auth" --data "${payload}") if [[ "${httpcode}" = "200" || "${httpcode}" = "201" ]] then info "sent alerta notification for: ${host} ${chart}.${name} is ${status} to '${channel}'" sent=$((sent + 1)) + elif [[ "${httpcode}" = "202" ]] + then + info "suppressed alerta notification for: ${host} ${chart}.${name} is ${status} to '${channel}'" else error "failed to send alerta notification for: ${host} ${chart}.${name} is ${status} to '${channel}', with HTTP error code ${httpcode}." fi @@ -1655,7 +1684,7 @@ send_flock() { httpcode=$(docurl -X POST "${webhook}" -H "Content-Type: application/json" -d "{ \"sendAs\": { \"name\" : \"netdata on ${host}\", - \"profileImage\" : \"${images_base_url}/images/seo-performance-128.png\" + \"profileImage\" : \"${images_base_url}/images/banner-icon-144x144.png\" }, \"text\": \"${host} *${status_message}*\", \"timestamp\": \"${when}\", @@ -1715,7 +1744,7 @@ send_discord() { "channel": "#${channel}", "username": "${username}", "text": "${host} ${status_message}, \`${chart}\` (_${family}_), *${alarm}*", - "icon_url": "${images_base_url}/images/seo-performance-128.png", + "icon_url": "${images_base_url}/images/banner-icon-144x144.png", "attachments": [ { "color": "${color}", @@ -1729,7 +1758,7 @@ send_discord() { } ], "thumb_url": "${image}", - "footer_icon": "${images_base_url}/images/seo-performance-128.png", + "footer_icon": "${images_base_url}/images/banner-icon-144x144.png", "footer": "${this_host}", "ts": ${when} } @@ -1952,7 +1981,7 @@ color="grey" alarm="${name//_/ } = ${value_string}" # the image of the alarm -image="${images_base_url}/images/seo-performance-128.png" +image="${images_base_url}/images/banner-icon-144x144.png" # prepare the title based on status case "${status}" in diff --git a/health/notifications/alerta/README.md b/health/notifications/alerta/README.md index bbed23bac..cf43621ff 100644 --- a/health/notifications/alerta/README.md +++ b/health/notifications/alerta/README.md @@ -1,207 +1,50 @@ # alerta.io notifications -The alerta monitoring system is a tool used to consolidate and de-duplicate alerts from multiple sources for quick ‘at-a-glance’ visualisation. With just one system you can monitor alerts from many other monitoring tools on a single screen. +The [Alerta](https://alerta.io) monitoring system is a tool used to +consolidate and de-duplicate alerts from multiple sources for quick +‘at-a-glance’ visualisation. With just one system you can monitor +alerts from many other monitoring tools on a single screen. - + -When receiving alerts from multiple sources you can quickly become overwhelmed. With Alerta any alert with the same environment and resource is considered a duplicate if it has the same severity. If it has a different severity it is correlated so that you only see the most recent one. Awesome. +Netadata alarms can be sent to Alerta so you can see in one place +alerts coming from many Netdata hosts or also from a multi-host +Netadata configuration. The big advantage over other notifications +systems is that there is a main view of all active alarms with +the most recent state, and it is also possible to view alarm history. -main site http://www.alerta.io +## Deploying Alerta -We can send Netadata alarms to Alerta so yo can see in one place alerts coming from many Netdata hosts or also from a multihost Netadata configuration.\ -The big advantage over other notifications method is that you have in a main view all active alarms with only las state, but you can also search history. +It is recommended to set up the server in a separated server, VM or +container. If you have other Nginx or Apache server in your organization, +it is recommended to proxy to this new server. -## Setting up an Alerta server with Ubuntu 16.04 +The easiest way to install Alerta is to use the Docker image available +on [Docker hub][1]. Alternatively, follow the ["getting started"][2] +tutorial to deploy Alerta to an Ubuntu server. More advanced +configurations are out os scope of this tutorial but information +about different deployment scenaries can be found in the [docs][3]. -Here we will set a basic Alerta server to test it with Netdata alerts.\ -More advanced configurations are out os scope of this tutorial. +[1]: https://hub.docker.com/r/alerta/alerta-web/ +[2]: http://alerta.readthedocs.io/en/latest/gettingstarted/tutorial-1-deploy-alerta.html +[3]: http://docs.alerta.io/en/latest/deployment.html -source: http://alerta.readthedocs.io/en/latest/gettingstarted/tutorial-1-deploy-alerta.html +## Send alarms to Alerta -I recommend to set up the server in a separated server, VM or container.\ -If you have other Nginx or Apache server in your organization, I recommend to proxy to this new server. +Step 1. Create an API key (if authentication is enabled) -Set us as root for easiest working -``` -sudo su -cd -``` - -Install Mongodb https://docs.mongodb.com/manual/tutorial/install-mongodb-on-ubuntu/ -``` -apt-key adv --keyserver hkp://keyserver.ubuntu.com:80 --recv 2930ADAE8CAF5059EE73BB4B58712A2291FA4AD5 -echo "deb [ arch=amd64,arm64 ] https://repo.mongodb.org/apt/ubuntu xenial/mongodb-org/3.6 multiverse" | tee /etc/apt/sources.list.d/mongodb-org-3.6.list -apt-get update -apt-get install -y mongodb-org -systemctl enable mongod -systemctl start mongod -systemctl status mongod -``` - -Install Nginx and Alerta uwsgi -``` -apt-get install -y python-pip python-dev nginx -pip install alerta-server uwsgi -``` +You will need an API key to send messages from any source, if +Alerta is configured to use authentication (recommended). To +create an API key go to "Configuration -> API Keys" and create +a new API key called "netdata" with `write:alerts` permission. -Install web console -``` -cd /var/www/html -mkdir alerta -cd alerta -wget -q -O - https://github.com/alerta/angular-alerta-webui/tarball/master | tar zxf - -mv alerta*/app/* . -cd -``` -## Services configuration - -Create a wsgi python file -``` -nano /var/www/wsgi.py -``` -fill with -``` -from alerta import app -``` -Create uWsgi configuration file -``` -nano /etc/uwsgi.ini -``` -fill with -``` -[uwsgi] -chdir = /var/www -mount = /alerta/api=wsgi.py -callable = app -manage-script-name = true - -master = true -processes = 5 -logger = syslog:alertad - -socket = /tmp/uwsgi.sock -chmod-socket = 664 -uid = www-data -gid = www-data -vacuum = true - -die-on-term = true -``` -Create a systemd configuration file -``` -nano /etc/systemd/system/uwsgi.service -``` -fill with -``` -[Unit] -Description=uWSGI service - -[Service] -ExecStart=/usr/local/bin/uwsgi --ini /etc/uwsgi.ini - -[Install] -WantedBy=multi-user.target -``` -enable service -``` -systemctl start uwsgi -systemctl status uwsgi -systemctl enable uwsgi -``` -Configure nginx to serve Alerta as a uWsgi application on /alerta/api -``` -nano /etc/nginx/sites-enabled/default -``` -fill with -``` -server { - listen 80 default_server; - listen [::]:80 default_server; - - location /alerta/api { try_files $uri @alerta/api; } - location @alerta/api { - include uwsgi_params; - uwsgi_pass unix:/tmp/uwsgi.sock; - proxy_set_header Host $host:$server_port; - proxy_set_header X-Real-IP $remote_addr; - proxy_set_header X-Forwarded-For $proxy_add_x_forwarded_for; - } - - location / { - root /var/www/html; - } -} -``` -restart nginx -``` -service nginx restart -``` -## Config web console -``` -nano /var/www/html/config.js -``` -fill with -``` -'use strict'; - -angular.module('config', []) - .constant('config', { - 'endpoint' : "/alerta/api", - 'provider' : "basic", - 'colors' : {}, - 'severity' : {}, - 'audio' : {} - }); -``` - -## Config Alerta server - -source: http://alerta.readthedocs.io/en/latest/configuration.html - -Create a random string to use as SECRET_KEY -``` -cat /dev/urandom | tr -dc A-Za-z0-9_\!\@\#\$\%\^\&\*\(\)-+= | head -c 32 && echo -``` -will output something like -``` -0pv8Bw7VKfW6avDAz_TqzYPme_fYV%7g -``` -Edit alertad.conf -``` -nano /etc/alertad.conf -``` -fill with (take care about all single quotes) -``` -BASE_URL='/alerta/api' -AUTH_REQUIRED=True -SECRET_KEY='0pv8Bw7VKfW6avDAz_TqzYPme_fYV%7g' -ADMIN_USERS=['<here put you email for future login>'] -``` - -restart -``` -systemctl restart uwsgi -``` - -* go to console to http://yourserver/alerta/ -* go to Login -> Create an account -* use your email for login so and administrative account will be created - -## create an API KEY - -You need an API KEY to send messages from any source.\ -To create an API KEY go to Configuration -> Api Keys\ -Then create a API KEY with write permisions. - -## configure Netdata to send alarms to Alerta +Step 2. configure Netdata to send alarms to Alerta On your system run: -``` -/etc/netdata/edit-config health_alarm_notify.conf -``` + $ /etc/netdata/edit-config health_alarm_notify.conf -and set +and modify the file as below: ``` # enable/disable sending alerta notifications @@ -214,7 +57,7 @@ ALERTA_WEBHOOK_URL="http://yourserver/alerta/api" # Login with an administrative user to you Alerta server and create an API KEY # with write permissions. -ALERTA_API_KEY="you last created API KEY" +ALERTA_API_KEY="INSERT_YOUR_API_KEY_HERE" # you can define environments in /etc/alertad.conf option ALLOWED_ENVIRONMENTS # standard environments are Production and Development @@ -225,12 +68,13 @@ DEFAULT_RECIPIENT_ALERTA="Production" ## Test alarms -We can test alarms with standard -``` -sudo su -s /bin/bash netdata -/opt/netdata/netdata-plugins/plugins.d/alarm-notify.sh test -exit -``` -But the problem is that Netdata will send 3 alarms, and because last alarm is "CLEAR" you will not se them in main Alerta page, you need to select to see "closed" alarma in top-right lookup. +We can test alarms using the standard approach: + + $ /opt/netdata/netdata-plugins/plugins.d/alarm-notify.sh test + +Note: Netdata will send 3 alarms, and because last alarm is "CLEAR" +you will not se them in main Alerta page, you need to select to see +"closed" alarma in top-right lookup. A little change in `alarm-notify.sh` +that let us test each state one by one will be useful. -A little change in alarm-notify.sh that let us test each state one by one will be useful.
\ No newline at end of file +For more information see [https://docs.alerta.io](https://docs.alerta.io) diff --git a/health/notifications/health_alarm_notify.conf b/health/notifications/health_alarm_notify.conf index 9e72aac4d..a997765a6 100755 --- a/health/notifications/health_alarm_notify.conf +++ b/health/notifications/health_alarm_notify.conf @@ -183,8 +183,9 @@ DEFAULT_RECIPIENT_EMAIL="root" # chart+alarm+host combination as a single thread. This can help # simplify tracking of alarms, as it provides an easy wway for scripts # to corelate messages and also will cause most clients to group all the -# messages together. THis is off by default. -#EMAIL_THREADING="YES" +# messages together. This is enabled by default, uncomment the line +# below if you want to disable it. +#EMAIL_THREADING="NO" #------------------------------------------------------------------------------ diff --git a/htmldoc/buildhtml.sh b/htmldoc/buildhtml.sh new file mode 100755 index 000000000..8a41f454f --- /dev/null +++ b/htmldoc/buildhtml.sh @@ -0,0 +1,33 @@ +#!/bin/bash + +# buildhtml.sh + +# Builds the html static site, using mkdocs +# Assumes that the script is executed from the root netdata folder, by calling htmldoc/buildhtml.sh + +# Copy all netdata .md files to htmldoc/src. Exclude htmldoc itself and also the directory node_modules generated by Netlify +echo "Copying files" +rm -rf htmldoc/src +find . -type d \( -path ./htmldoc -o -path ./node_modules \) -prune -o -name "*.md" -print | cpio -pd htmldoc/src + +# Modify the first line of the main README.md, to enable proper static html generation +sed -i '0,/# netdata /s//# Introducing NetData\n\n/' htmldoc/src/README.md + +echo "Creating mkdocs.yaml" + +# Generate mkdocs.yaml +htmldoc/buildyaml.sh > htmldoc/mkdocs.yml + +echo "Fixing links" + +# Fix links (recursively, all types, executing replacements) +htmldoc/checklinks.sh -rax +if [ $? -eq 1 ] ; then exit 1 ; fi + +echo "Calling mkdocs" + +# Build html docs +mkdocs build --config-file=htmldoc/mkdocs.yml + +echo "Finished" + diff --git a/htmldoc/buildyaml.sh b/htmldoc/buildyaml.sh new file mode 100755 index 000000000..096e4ce5c --- /dev/null +++ b/htmldoc/buildyaml.sh @@ -0,0 +1,171 @@ +#!/bin/bash + +cd htmldoc/src + +# create yaml nav subtree with all the files directly under a specific directory +# arguments: +# tabs - how deep do we show it in the hierarchy. Level 1 is the top level, max should probably be 3 +# directory - to get mds from to add them to the yaml +# file - can be left empty to include all files +# name - what do we call the relevant section on the navbar. Empty if no new section is required +# maxdepth - how many levels of subdirectories do I include in the yaml in this section. 1 means just the top level and is the default if left empty +# excludefirstlevel - Optional param. If passed, mindepth is set to 2, to exclude the READMEs in the first directory level + +navpart () { + tabs=$1 + dir=$2 + file=$3 + section=$4 + maxdepth=$5 + excludefirstlevel=$6 + spc="" + + i=1 + while [ ${i} -lt ${tabs} ] ; do + spc=" $spc" + i=$[$i + 1] + done + + if [ -z "$file" ] ; then file='*' ; fi + if [[ ! -z "$section" ]] ; then echo "$spc- ${section}:" ; fi + if [ -z "$maxdepth" ] ; then maxdepth=1; fi + if [[ ! -z "$excludefirstlevel" ]] ; then mindepth=2 ; else mindepth=1; fi + + for f in $(find $dir -mindepth $mindepth -maxdepth $maxdepth -name "${file}.md" -printf '%h\0%d\0%p\n' | sort -t '\0' -n | awk -F '\0' '{print $3}'); do + # If I'm adding a section, I need the child links to be one level deeper than the requested level in "tabs" + if [ -z "$section" ] ; then + echo "$spc- '$f'" + else + echo "$spc - '$f'" + fi + done +} + + +echo -e 'site_name: NetData Documentation +repo_url: https://github.com/netdata/netdata +repo_name: GitHub +edit_uri: blob/master +site_description: NetData Documentation +copyright: NetData, 2018 +docs_dir: src +site_dir: build +#use_directory_urls: false +theme: + name: "material" + custom_dir: themes/material +markdown_extensions: + - extra + - abbr + - attr_list + - def_list + - fenced_code + - footnotes + - tables + - admonition + - codehilite + - meta + - nl2br + - sane_lists + - smarty + - toc: + permalink: True + separator: "-" + - wikilinks +nav:' + +navpart 1 . README "Getting Started" + +echo -ne " - 'doc/Why-Netdata.md' + - 'doc/Demo-Sites.md' + - Installation: + - 'installer/README.md' + - 'docker/README.md' + - 'installer/UPDATE.md' + - 'installer/UNINSTALL.md' +" +echo -ne "- Using NetData: +" +navpart 2 daemon +navpart 2 web "README" "Web Dashboards" +navpart 3 web/gui "" "" 3 +navpart 2 web/server "" "Web Server" +navpart 3 web/server "" "" 2 excludefirstlevel +navpart 2 web/api "" "Web API" +navpart 3 web/api "" "" 4 excludefirstlevel +navpart 2 daemon/config +#navpart 2 system +navpart 2 registry +navpart 2 streaming "" "" 4 +navpart 2 backends "" "Backends" 3 +navpart 2 database + +echo -ne " - 'doc/Performance.md' + - 'doc/netdata-for-IoT.md' + - 'doc/high-performance-netdata.md' + - 'doc/netdata-security.md' + - 'doc/Netdata-Security-and-Disclosure-Information.md' +" + +navpart 2 health README "Health Monitoring" +navpart 3 health/notifications "" "" 1 +navpart 3 health/notifications "" "Supported Notifications" 2 excludefirstlevel + +echo -ne " - Running-behind-another-web-server: + - 'doc/Running-behind-nginx.md' + - 'doc/Running-behind-apache.md' + - 'doc/Running-behind-lighttpd.md' + - 'doc/Running-behind-caddy.md' +" + + +navpart 1 collectors "" "Data Collection" 1 +echo -ne " - 'doc/Add-more-charts-to-netdata.md' + - Internal Plugins: +" +navpart 3 collectors/proc.plugin +navpart 3 collectors/statsd.plugin +navpart 3 collectors/cgroups.plugin +navpart 3 collectors/idlejitter.plugin +navpart 3 collectors/tc.plugin +navpart 3 collectors/nfacct.plugin +navpart 3 collectors/checks.plugin +navpart 3 collectors/diskspace.plugin +navpart 3 collectors/freebsd.plugin +navpart 3 collectors/macos.plugin + +navpart 2 collectors/plugins.d "" "External Plugins" +navpart 3 collectors/python.d.plugin "" "Python Plugins" 3 +navpart 3 collectors/node.d.plugin "" "Node.js Plugins" 3 +navpart 3 collectors/charts.d.plugin "" "BASH Plugins" 3 +navpart 3 collectors/apps.plugin +navpart 3 collectors/fping.plugin +navpart 3 collectors/freeipmi.plugin + +echo -ne " - Third Party Plugins: + - 'doc/Third-Party-Plugins.md' +" + +echo -ne "- Hacking netdata: + - CONTRIBUTING.md + - CODE_OF_CONDUCT.md + - CONTRIBUTORS.md +" +navpart 2 makeself "" "" 4 +navpart 2 packaging "" "" 4 +navpart 2 libnetdata "" "libnetdata" 4 +navpart 2 contrib +navpart 2 tests +navpart 2 diagrams/data_structures + +echo -ne "- About: + - 'doc/Donations-netdata-has-received.md' + - 'doc/a-github-star-is-important.md' + - CHANGELOG.md + - HISTORICAL_CHANGELOG.md + - REDISTRIBUTED.md +" + + + + diff --git a/htmldoc/themes/material/partials/footer.html b/htmldoc/themes/material/partials/footer.html new file mode 100644 index 000000000..ba690f236 --- /dev/null +++ b/htmldoc/themes/material/partials/footer.html @@ -0,0 +1,57 @@ +{% import "partials/language.html" as lang with context %} +<footer class="md-footer"> + {% if page.previous_page or page.next_page %} + <div class="md-footer-nav"> + <nav class="md-footer-nav__inner md-grid"> + {% if page.previous_page %} + <a href="{{ page.previous_page.url | url }}" title="{{ page.previous_page.title }}" class="md-flex md-footer-nav__link md-footer-nav__link--prev" rel="prev"> + <div class="md-flex__cell md-flex__cell--shrink"> + <i class="md-icon md-icon--arrow-back md-footer-nav__button"></i> + </div> + <div class="md-flex__cell md-flex__cell--stretch md-footer-nav__title"> + <span class="md-flex__ellipsis"> + <span class="md-footer-nav__direction"> + {{ lang.t("footer.previous") }} + </span> + {{ page.previous_page.title }} + </span> + </div> + </a> + {% endif %} + {% if page.next_page %} + <a href="{{ page.next_page.url | url }}" title="{{ page.next_page.title }}" class="md-flex md-footer-nav__link md-footer-nav__link--next" rel="next"> + <div class="md-flex__cell md-flex__cell--stretch md-footer-nav__title"> + <span class="md-flex__ellipsis"> + <span class="md-footer-nav__direction"> + {{ lang.t("footer.next") }} + </span> + {{ page.next_page.title }} + </span> + </div> + <div class="md-flex__cell md-flex__cell--shrink"> + <i class="md-icon md-icon--arrow-forward md-footer-nav__button"></i> + </div> + </a> + {% endif %} + </nav> + </div> + {% endif %} + <div class="md-footer-meta md-typeset"> + <div class="md-footer-meta__inner md-grid"> + <div class="md-footer-copyright"> + {% if config.copyright %} + <div class="md-footer-copyright__highlight"> + {{ config.copyright }} + </div> + {% endif %} + <a href="https://twitter.com/linuxnetdata" rel="nofollow"><img src="https://img.shields.io/twitter/follow/linuxnetdata.svg?style=social&label=New%20-%20stay%20in%20touch%20-%20follow%20netdata%20on%20twitter"></a> + <img src="https://www.google-analytics.com/collect?v=1&t=pageview&_s=1&ds=github&dr=https%3A%2F%2Fgithub.com%2Ffirehol%2Fnetdata%2Fwiki&dl=https%3A%2F%2Fmy-netdata.io%2Fgithub%2Fwiki&_u=MAC%7E&cid=8c51788e-8721-45e3-ae8c-e7c63ba8236b&tid=UA-64295674-3"> + + + </div> + {% block social %} + {% include "partials/social.html" %} + {% endblock %} + </div> + </div> +</footer> diff --git a/installer/README.md b/installer/README.md new file mode 100644 index 000000000..cbcefab08 --- /dev/null +++ b/installer/README.md @@ -0,0 +1,366 @@ +# Installation + + +## Linux package managers + +You can install the latest release of netdata, using your package manager in + + - Arch Linux (`sudo pacman -S netdata`) + - Alpine Linux (`sudo apk add netdata`) + - Debian Linux (`sudo apt install netdata`) + - Gentoo Linux (`sudo emerge --ask netdata`) + - OpenSUSE (`sudo zypper install netdata`) + - Solus Linux (`sudo eopkg install netdata`) + - Ubuntu Linux >= 18.04 (`sudo apt install netdata`) + +Please note that the particular packages are not build by netdata. + +## Docker + +You can [Install netdata with Docker](../docker/#install-netdata-with-docker) + +## Linux one liner + +  + +To install netdata from source to your systems and keep it up to date automatically, run the following: + +:hash:**`bash <(curl -Ss https://my-netdata.io/kickstart.sh)`** + +(do not `sudo` this command, it will do it by itself as needed) + +The command: + +1. detects the distro and **installs the required system packages** for building netdata (will ask for confirmation) +2. downloads the latest netdata source tree to `/usr/src/netdata.git`. +3. installs netdata by running `./netdata-installer.sh` from the source tree. +4. installs `netdata-updater.sh` to `cron.daily`, so your netdata installation will be updated daily (you will get a message from cron only if the update fails). + +The `kickstart.sh` script passes all its parameters to `netdata-installer.sh`, so you can add more parameters to change the installation directory, enable/disable plugins, etc (check below). + +For automated installs, append a space + `--dont-wait` to the command line. You can also append `--dont-start-it` to prevent the installer from starting netdata. Example: + +```sh +bash <(curl -Ss https://my-netdata.io/kickstart.sh) all --dont-wait --dont-start-it +``` + +## Linux 64bit pre-built static binary + +You can install a pre-compiled static binary of netdata for any Intel/AMD 64bit Linux system (even those that don't have a package manager, like CoreOS, CirrOS, busybox systems, etc). You can also use these packages on systems with broken or unsupported package managers. + +<br/>  + +To install netdata with a binary package on any Linux distro, any kernel version - for **Intel/AMD 64bit** hosts, run the following: + +:hash: **`bash <(curl -Ss https://my-netdata.io/kickstart-static64.sh)`** + +(do not `sudo` this command, it will do it by itself as needed; the target system does not need `bash` installed, check below for instructions to run it without `bash`) + +*Note: The static builds install netdata at `/opt/netdata`* + +For automated installs, append a space + `--dont-wait` to the command line. You can also append `--dont-start-it` to prevent the installer from starting netdata. Example: + +```sh +bash <(curl -Ss https://my-netdata.io/kickstart-static64.sh) --dont-wait --dont-start-it +``` + +If your shell fails to handle the above one liner, do this: + +```sh +# download the script with curl +curl https://my-netdata.io/kickstart-static64.sh >/tmp/kickstart-static64.sh + +# or, download the script with wget +wget -O /tmp/kickstart-static64.sh https://my-netdata.io/kickstart-static64.sh + +# run the downloaded script (any sh is fine, no need for bash) +sh /tmp/kickstart-static64.sh +``` + +The static binary files are kept in repo [binary-packages](https://github.com/netdata/binary-packages). You can download any of the `.run` files, and run it. These files are self-extracting shell scripts built with [makeself](https://github.com/megastep/makeself). The target system does **not** need to have bash installed. The same files can be used for updates too. + +## Other installation methods + +- **Linux manual installation from source** + + Semi-automatic, with more details about the steps involved and actions taken [here](#install-netdata-on-linux-manually) + +- **Non-Linux installation** + - [Install from package or source, on FreeBSD](#freebsd) + - [Install from package, on pfSense](#pfsense) + - [Enable netdata on FreeNAS Corral](#freenas) + - [Install from package or source, on macOS (OS X)](#macos) + + See also the list of netdata [package maintainers](../packaging/maintainers) for ASUSTOR NAS, OpenWRT, ReadyNAS, etc. + +## Install netdata on Linux manually + +To install the latest git version of netdata, please follow these 2 steps: + +1. [Prepare your system](#prepare-your-system) + + Install the required packages on your system. + +2. [Install netdata](#install-netdata) + + Download and install netdata. You can also update it the same way. + +--- + +### Prepare your system + +Try our experimental automatic requirements installer (no need to be root). This will try to find the packages that should be installed on your system to build and run netdata. It supports most major Linux distributions released after 2010: + +- **Alpine** Linux and its derivatives (you have to install `bash` yourself, before using the installer) +- **Arch** Linux and its derivatives +- **Gentoo** Linux and its derivatives +- **Debian** Linux and its derivatives (including **Ubuntu**, **Mint**) +- **Fedora** and its derivatives (including **Red Hat Enterprise Linux**, **CentOS**, **Amazon Machine Image**) +- **SuSe** Linux and its derivatives (including **openSuSe**) +- **SLE12** Must have your system registered with Suse Customer Center or have the DVD. See [#1162](https://github.com/netdata/netdata/issues/1162) + +Install the packages for having a **basic netdata installation** (system monitoring and many applications, without `mysql` / `mariadb`, `postgres`, `named`, hardware sensors and `SNMP`): + +```sh +curl -Ss 'https://raw.githubusercontent.com/netdata/netdata-demo-site/master/install-required-packages.sh' >/tmp/kickstart.sh && bash /tmp/kickstart.sh -i netdata +``` + +Install all the required packages for **monitoring everything netdata can monitor**: + +```sh +curl -Ss 'https://raw.githubusercontent.com/netdata/netdata-demo-site/master/install-required-packages.sh' >/tmp/kickstart.sh && bash /tmp/kickstart.sh -i netdata-all +``` + +If the above do not work for you, please [open a github issue](https://github.com/netdata/netdata/issues/new?title=packages%20installer%20failed&labels=installation%20help&body=The%20experimental%20packages%20installer%20failed.%0A%0AThis%20is%20what%20it%20says:%0A%0A%60%60%60txt%0A%0Aplease%20paste%20your%20screen%20here%0A%0A%60%60%60) with a copy of the message you get on screen. We are trying to make it work everywhere (this is also why the script [reports back](https://github.com/netdata/netdata/issues/2054) success or failure for all its runs). + +--- + +This is how to do it by hand: + +```sh +# Debian / Ubuntu +apt-get install zlib1g-dev uuid-dev libmnl-dev gcc make git autoconf autoconf-archive autogen automake pkg-config curl + +# Fedora +dnf install zlib-devel libuuid-devel libmnl-devel gcc make git autoconf autoconf-archive autogen automake pkgconfig curl findutils + +# CentOS / Red Hat Enterprise Linux +yum install autoconf automake curl gcc git libmnl-devel libuuid-devel lm_sensors make MySQL-python nc pkgconfig python python-psycopg2 PyYAML zlib-devel + +``` + +Please note that for RHEL/CentOS you might need [EPEL](http://www.tecmint.com/how-to-enable-epel-repository-for-rhel-centos-6-5/). + +Once netdata is compiled, to run it the following packages are required (already installed using the above commands): + +package|description +:-----:|----------- +`libuuid`|part of `util-linux` for GUIDs management +`zlib`|gzip compression for the internal netdata web server + +*netdata will fail to start without the above.* + +netdata plugins and various aspects of netdata can be enabled or benefit when these are installed (they are optional): + +package|description +:-----:|----------- +`bash`|for shell plugins and **alarm notifications** +`curl`|for shell plugins and **alarm notifications** +`iproute` or `iproute2`|for monitoring **Linux traffic QoS**<br/>use `iproute2` if `iproute` reports as not available or obsolete +`python`|for most of the external plugins +`python-yaml`|used for monitoring **beanstalkd** +`python-beanstalkc`|used for monitoring **beanstalkd** +`python-dnspython`|used for monitoring DNS query time +`python-ipaddress`|used for monitoring **DHCPd**<br/>this package is required only if the system has python v2. python v3 has this functionality embedded +`python-mysqldb`<br/>or<br/>`python-pymysql`|used for monitoring **mysql** or **mariadb** databases<br/>`python-mysqldb` is a lot faster and thus preferred +`python-psycopg2`|used for monitoring **postgresql** databases +`python-pymongo`|used for monitoring **mongodb** databases +`nodejs`|used for `node.js` plugins for monitoring **named** and **SNMP** devices +`lm-sensors`|for monitoring **hardware sensors** +`libmnl`|for collecting netfilter metrics +`netcat`|for shell plugins to collect metrics from remote systems + +*netdata will greatly benefit if you have the above packages installed, but it will still work without them.* + +--- + +### Install netdata + +Do this to install and run netdata: + +```sh + +# download it - the directory 'netdata' will be created +git clone https://github.com/netdata/netdata.git --depth=1 +cd netdata + +# run script with root privileges to build, install, start netdata +./netdata-installer.sh + +``` + +* If you don't want to run it straight-away, add `--dont-start-it` option. + +* If you don't want to install it on the default directories, you can run the installer like this: `./netdata-installer.sh --install /opt`. This one will install netdata in `/opt/netdata`. + +Once the installer completes, the file `/etc/netdata/netdata.conf` will be created (if you changed the installation directory, the configuration will appear in that directory too). + +You can edit this file to set options. One common option to tweak is `history`, which controls the size of the memory database netdata will use. By default is `3600` seconds (an hour of data at the charts) which makes netdata use about 10-15MB of RAM (depending on the number of charts detected on your system). Check **[[Memory Requirements]]**. + +To apply the changes you made, you have to restart netdata. + +--- + +## Other Systems + + + +##### FreeBSD + +You can install netdata from ports or packages collection. + +This is how to install the latest netdata version from sources on FreeBSD: + +```sh +# install required packages +pkg install bash e2fsprogs-libuuid git curl autoconf automake pkgconf pidof + +# download netdata +git clone https://github.com/netdata/netdata.git --depth=1 + +# install netdata in /opt/netdata +cd netdata +./netdata-installer.sh --install /opt +``` + +##### pfSense +To install netdata on pfSense run the following commands (within a shell or under Diagnostics/Command Prompt within the pfSense web interface). + +Change platform (i386/amd64, etc) and FreeBSD versions (10/11, etc) according to your environment and change netdata version (1.10.0 in example) according to latest version present within the FreeSBD repository:- + +Note first three packages are downloaded from the pfSense repository for maintaining compatibility with pfSense, netdata is downloaded from the FreeBSD repository. +``` +pkg install pkgconf +pkg install bash +pkg install e2fsprogs-libuuid +pkg add http://pkg.freebsd.org/FreeBSD:11:amd64/latest/All/netdata-1.11.0.txz +``` +To start netdata manually run `service netdata onestart` + +To start netdata automatically at each boot add `service netdata start` as a Shellcmd within the pfSense web interface (under **Services/Shellcmd**, which you need to install beforehand under **System/Package Manager/Available Packages**). +Shellcmd Type should be set to `Shellcmd`. + +Alternatively more information can be found in https://doc.pfsense.org/index.php/Installing_FreeBSD_Packages, for achieving the same via the command line and scripts. + +If you experience an issue with `/usr/bin/install` absense on pfSense 2.3 or earlier, update pfSense or use workaround from [https://redmine.pfsense.org/issues/6643](https://redmine.pfsense.org/issues/6643) + +##### FreeNAS +On FreeNAS-Corral-RELEASE (>=10.0.3), netdata is pre-installed. + +To use netdata, the service will need to be enabled and started from the FreeNAS **[CLI](https://github.com/freenas/cli)**. + +To enable the netdata service: +``` +service netdata config set enable=true +``` + +To start the netdata service: +``` +service netdata start +``` + +##### macOS + +netdata on macOS still has limited charts, but external plugins do work. + +You can either install netdata with [Homebrew](https://brew.sh/) + +```sh +brew install netdata +``` + +or from source: + +```sh +# install Xcode Command Line Tools +xcode-select --install +``` +click `Install` in the software update popup window, then +```sh +# install HomeBrew package manager +/usr/bin/ruby -e "$(curl -fsSL https://raw.githubusercontent.com/Homebrew/install/master/install)" + +# install required packages +brew install ossp-uuid autoconf automake pkg-config + +# download netdata +git clone https://github.com/netdata/netdata.git --depth=1 + +# install netdata in /usr/local/netdata +cd netdata +sudo ./netdata-installer.sh --install /usr/local +``` + +The installer will also install a startup plist to start netdata when your Mac boots. + +##### Alpine 3.x + +Execute these commands to install netdata in Alpine Linux 3.x: + +``` +# install required packages +apk add alpine-sdk bash curl zlib-dev util-linux-dev libmnl-dev gcc make git autoconf automake pkgconfig python logrotate + +# if you plan to run node.js netdata plugins +apk add nodejs + +# download netdata - the directory 'netdata' will be created +git clone https://github.com/netdata/netdata.git --depth=1 +cd netdata + + +# build it, install it, start it +./netdata-installer.sh + + +# make netdata start at boot +echo -e "#!/usr/bin/env bash\n/usr/sbin/netdata" >/etc/local.d/netdata.start +chmod 755 /etc/local.d/netdata.start + +# make netdata stop at shutdown +echo -e "#!/usr/bin/env bash\nkillall netdata" >/etc/local.d/netdata.stop +chmod 755 /etc/local.d/netdata.stop + +# enable the local service to start automatically +rc-update add local +``` + +##### Synology + +The documentation previously recommended installing the Debian Chroot package from the Synology community package sources and then running netdata from within the chroot. This does not work, as the chroot environment does not have access to `/proc`, and therefore exposes very few metrics to netdata. Additionally, [this issue](https://github.com/SynoCommunity/spksrc/issues/2758), still open as of 2018/06/24, indicates that the Debian Chroot package is not suitable for DSM versions greater than version 5 and may corrupt system libraries and render the NAS unable to boot. + +The good news is that the 64-bit static installer works fine if your NAS is one that uses the amd64 architecture. It will install the content into `/opt/netdata`, making future removal safe and simple. + +###### Additional Work + +When netdata is first installed, it will run as _root_. This may or may not be acceptable for you, and since other installations run it as the _netdata_ user, you might wish to do the same. This requires some extra work: + +1. Creat a group `netdata` via the Synology group interface. Give it no access to anything. +2. Create a user `netdata` via the Synology user interface. Give it no access to anything and a random password. Assign the user to the `netdata` group. Netdata will chuid to this user when running. +3. Change ownership of the following directories, as defined in [Netdata Security](../doc/netdata-security.md#netdata-security): + +``` +$ chown -R root:netdata /opt/netdata/usr/share/netdata +$ chown -R netdata:netdata /opt/netdata/var/lib/netdata /opt/netdata/var/cache/netdata +$ chown -R netdata:root /opt/netdata/var/log/netdata +``` + +Additionally, as of 2018/06/24, the netdata installer doesn't recognize DSM as an operating system, so no init script is installed. You'll have to do this manually: + +1. Add [this file](https://gist.github.com/oskapt/055d474d7bfef32c49469c1b53e8225f) as `/etc/rc.netdata`. Make it executable with `chmod 0755 /etc/rc.netdata`. +2. Edit `/etc/rc.local` and add a line calling `/etc/rc.netdata` to have it start on boot: + +``` +# Netdata startup +[ -x /etc/rc.netdata ] && /etc/rc.netdata start +``` diff --git a/installer/UNINSTALL.md b/installer/UNINSTALL.md new file mode 100644 index 000000000..4f9a84d03 --- /dev/null +++ b/installer/UNINSTALL.md @@ -0,0 +1,36 @@ +# Uninstalling netdata + +## netdata was installed from source (or `kickstart.sh`) + +The script `netdata-installer.sh` generates another script called `netdata-uninstaller.sh`. + +To uninstall netdata, run: + +``` +cd /path/to/netdata.git +./netdata-uninstaller.sh --force +``` + +The uninstaller will ask you to confirm all deletions. + +## netdata was installed with `kickstart-static64.sh` package + +Stop netdata with one of the following: + +- `service netdata stop` (non-systemd systems) +- `systemctl stop netdata` (systemd systems) + +Disable running netdata at startup, with one of the following (based on your distro): + +- `rc-update del netdata` +- `update-rc.d netdata disable` +- `chkconfig netdata off` +- `systemctl disable netdata` + +Delete the netdata files: + +1. `rm -rf /opt/netdata` +2. `groupdel netdata` +3. `userdel netdata` +4. `rm /etc/logrotate.d/netdata` +5. `rm /etc/systemd/system/netdata.service` or `rm /etc/init.d/netdata`, depending on the distro. diff --git a/installer/UPDATE.md b/installer/UPDATE.md new file mode 100644 index 000000000..cda21fc0f --- /dev/null +++ b/installer/UPDATE.md @@ -0,0 +1,71 @@ +# Updating netdata after its installation + + + + +We suggest to keep your netdata updated. We are actively developing it and you should always update to the latest version. + +The update procedure depends on how you installed it: + +## You downloaded it from github using git + +### Manual update + +The installer `netdata-installer.sh` generates a `netdata-updater.sh` script in the directory you downloaded netdata. +You can use this script to update your netdata installation with the same options you used to install it in the first place. +Just run it and it will download and install the latest version of netdata. The same script can be put in a cronjob to update your netdata at regular intervals. + +```sh +# go to the git downloaded directory +cd /path/to/git/downloaded/netdata + +# run the updater +./netdata-updater.sh +``` + +_Netdata will be restarted with the new version._ + +If you don't have this script (e.g. you deleted the directory where you downloaded netdata), just follow the **[[Installation]]** instructions again. The installer preserves your configuration. You can also update netdata to the latest version by hand, using this: + +```sh +# go to the git downloaded directory +cd /path/to/git/downloaded/netdata + +# download the latest version +git pull + +# rebuild it, install it, run it +./netdata-installer.sh +``` + +_Netdata will be restarted with the new version._ + +Keep in mind, netdata may now have new features, or certain old features may now behave differently. So pay some attention to it after updating. + +### Auto-update + +_Please, consider the risks of running an auto-update. Something can always go wrong. Keep an eye on your installation, and run a manual update if something ever fails._ + +You can call `netdata-updater.sh` from a cron-job. A successful update will not trigger an email from cron. + +```sh +# Edit your cron-jobs +crontab -e + +# add a cron-job at the bottom. This one will update netdata every day at 6:00AM: +# update netdata +0 6 * * * /path/to/git/downloaded/netdata/netdata-updater.sh +``` + +## You downloaded a binary package + +If you installed it from a binary package, the best way is to **obtain a newer copy** from the source you got it in the first place. + +If a newer version of netdata is not available from the source you got it, we suggest to uninstall the version you have and follow the **[[Installation]]** instructions for installing a fresh version of netdata. + + + + + + + diff --git a/installer/functions.sh b/installer/functions.sh index dc2833318..155edd79a 100644 --- a/installer/functions.sh +++ b/installer/functions.sh @@ -441,8 +441,8 @@ iscontainer() { issystemd() { local pids p myns ns systemctl - # if the directory /lib/systemd/system does not exit, it is not systemd - [ ! -d /lib/systemd/system ] && return 1 + # if the directory /lib/systemd/system OR /usr/lib/systemd/system (SLES 12.x) does not exit, it is not systemd + [ ! -d /lib/systemd/system -a ! -d /usr/lib/systemd/system ] && return 1 # if there is no systemctl command, it is not systemd # shellcheck disable=SC2230 @@ -563,15 +563,25 @@ install_netdata_service() { NETDATA_START_CMD="systemctl start netdata" NETDATA_STOP_CMD="systemctl stop netdata" + SYSTEMD_DIRECTORY="" + if [ -d "/lib/systemd/system" ] then + SYSTEMD_DIRECTORY="/lib/systemd/system" + elif [ -d "/usr/lib/systemd/system" ] + then + SYSTEMD_DIRECTORY="/usr/lib/systemd/system" + fi + + if [ "${SYSTEMD_DIRECTORY}x" != "x" ] + then echo >&2 "Installing systemd service..." - run cp system/netdata.service /lib/systemd/system/netdata.service && \ + run cp system/netdata.service "${SYSTEMD_DIRECTORY}/netdata.service" && \ run systemctl daemon-reload && \ run systemctl enable netdata && \ return 0 else - echo >&2 "no '/lib/systemd/system' directory; cannot install netdata.service" + echo >&2 "no systemd directory; cannot install netdata.service" fi else install_non_systemd_init diff --git a/libnetdata/storage_number/storage_number.c b/libnetdata/storage_number/storage_number.c index db4cb700b..6825fa7d0 100644 --- a/libnetdata/storage_number/storage_number.c +++ b/libnetdata/storage_number/storage_number.c @@ -2,19 +2,20 @@ #include "../libnetdata.h" -storage_number pack_storage_number(calculated_number value, uint32_t flags) -{ +storage_number pack_storage_number(calculated_number value, uint32_t flags) { // bit 32 = sign 0:positive, 1:negative // bit 31 = 0:divide, 1:multiply // bit 30, 29, 28 = (multiplier or divider) 0-7 (8 total) - // bit 27, 26, 25 flags + // bit 27 SN_EXISTS_100 + // bit 26 SN_EXISTS_RESET + // bit 25 SN_EXISTS // bit 24 to bit 1 = the value storage_number r = get_storage_number_flags(flags); if(!value) return r; int m = 0; - calculated_number n = value; + calculated_number n = value, factor = 10; // if the value is negative // add the sign bit and make it positive @@ -23,11 +24,16 @@ storage_number pack_storage_number(calculated_number value, uint32_t flags) n = -n; } + if(n / 10000000.0 > 0x00ffffff) { + factor = 100; + r |= SN_EXISTS_100; + } + // make its integer part fit in 0x00ffffff // by dividing it by 10 up to 7 times // and increasing the multiplier while(m < 7 && n > (calculated_number)0x00ffffff) { - n /= 10; + n /= factor; m++; } @@ -71,35 +77,44 @@ storage_number pack_storage_number(calculated_number value, uint32_t flags) return r; } -calculated_number unpack_storage_number(storage_number value) -{ +calculated_number unpack_storage_number(storage_number value) { if(!value) return 0; int sign = 0, exp = 0; + int factor = 10; - value ^= get_storage_number_flags(value); - - if(value & (1 << 31)) { + // bit 32 = 0:positive, 1:negative + if(unlikely(value & (1 << 31))) sign = 1; - value ^= 1 << 31; - } - if(value & (1 << 30)) { + // bit 31 = 0:divide, 1:multiply + if(unlikely(value & (1 << 30))) exp = 1; - value ^= 1 << 30; - } - int mul = value >> 27; - value ^= mul << 27; + // bit 27 SN_EXISTS_100 + if(unlikely(value & (1 << 26))) + factor = 100; + + // bit 26 SN_EXISTS_RESET + // bit 25 SN_EXISTS + + // bit 30, 29, 28 = (multiplier or divider) 0-7 (8 total) + int mul = (value & ((1<<29)|(1<<28)|(1<<27))) >> 27; + + // bit 24 to bit 1 = the value, so remove all other bits + value ^= value & ((1<<31)|(1<<30)|(1<<29)|(1<<28)|(1<<27)|(1<<26)|(1<<25)|(1<<24)); calculated_number n = value; - // fprintf(stderr, "UNPACK: %08X, sign = %d, exp = %d, mul = %d, n = " CALCULATED_NUMBER_FORMAT "\n", value, sign, exp, mul, n); + // fprintf(stderr, "UNPACK: %08X, sign = %d, exp = %d, mul = %d, factor = %d, n = " CALCULATED_NUMBER_FORMAT "\n", value, sign, exp, mul, factor, n); - while(mul > 0) { - if(exp) n *= 10; - else n /= 10; - mul--; + if(exp) { + for(; mul; mul--) + n *= factor; + } + else { + for( ; mul ; mul--) + n /= 10; } if(sign) n = -n; diff --git a/libnetdata/storage_number/storage_number.h b/libnetdata/storage_number/storage_number.h index 5353ab60b..af7d29f3a 100644 --- a/libnetdata/storage_number/storage_number.h +++ b/libnetdata/storage_number/storage_number.h @@ -23,7 +23,7 @@ typedef double calculated_number; #define LONG_DOUBLE_MODIFIER "f" typedef double LONG_DOUBLE; -#else +#else // NETDATA_WITHOUT_LONG_DOUBLE typedef long double calculated_number; #define CALCULATED_NUMBER_FORMAT "%0.7Lf" @@ -33,7 +33,7 @@ typedef long double calculated_number; #define LONG_DOUBLE_MODIFIER "Lf" typedef long double LONG_DOUBLE; -#endif +#endif // NETDATA_WITHOUT_LONG_DOUBLE //typedef long long calculated_number; //#define CALCULATED_NUMBER_FORMAT "%lld" @@ -50,6 +50,7 @@ typedef long double collected_number; #define calculated_number_llrint(x) llrintl(x) #define calculated_number_round(x) roundl(x) #define calculated_number_fabs(x) fabsl(x) +#define calculated_number_pow(x, y) powl(x, y) #define calculated_number_epsilon (calculated_number)0.0000001 #define calculated_number_equal(a, b) (calculated_number_fabs((a) - (b)) < calculated_number_epsilon) @@ -57,18 +58,12 @@ typedef long double collected_number; typedef uint32_t storage_number; #define STORAGE_NUMBER_FORMAT "%u" -#define SN_NOT_EXISTS (0x0 << 24) -#define SN_EXISTS (0x1 << 24) -#define SN_EXISTS_RESET (0x2 << 24) -#define SN_EXISTS_UNDEF1 (0x3 << 24) -#define SN_EXISTS_UNDEF2 (0x4 << 24) -#define SN_EXISTS_UNDEF3 (0x5 << 24) -#define SN_EXISTS_UNDEF4 (0x6 << 24) - -#define SN_FLAGS_MASK (~(0x6 << 24)) +#define SN_EXISTS (1 << 24) // the value exists +#define SN_EXISTS_RESET (1 << 25) // the value has been overflown +#define SN_EXISTS_100 (1 << 26) // very large value (multipler is 100 instead of 10) // extract the flags -#define get_storage_number_flags(value) ((((storage_number)(value)) & (1 << 24)) | (((storage_number)(value)) & (2 << 24)) | (((storage_number)(value)) & (4 << 24))) +#define get_storage_number_flags(value) ((((storage_number)(value)) & (1 << 24)) | (((storage_number)(value)) & (1 << 25)) | (((storage_number)(value)) & (1 << 26))) #define SN_EMPTY_SLOT 0x00000000 // checks @@ -80,13 +75,14 @@ calculated_number unpack_storage_number(storage_number value); int print_calculated_number(char *str, calculated_number value); -#define STORAGE_NUMBER_POSITIVE_MAX (167772150000000.0) -#define STORAGE_NUMBER_POSITIVE_MIN (0.0000001) -#define STORAGE_NUMBER_NEGATIVE_MAX (-0.0000001) -#define STORAGE_NUMBER_NEGATIVE_MIN (-167772150000000.0) +// sign div/mul <--- multiplier / divider ---> 10/100 RESET EXISTS VALUE +#define STORAGE_NUMBER_POSITIVE_MAX_RAW (storage_number)( (0 << 31) | (1 << 30) | (1 << 29) | (1 << 28) | (1<<27) | (1 << 26) | (0 << 25) | (1 << 24) | 0x00ffffff ) +#define STORAGE_NUMBER_POSITIVE_MIN_RAW (storage_number)( (0 << 31) | (0 << 30) | (1 << 29) | (1 << 28) | (1<<27) | (0 << 26) | (0 << 25) | (1 << 24) | 0x00000001 ) +#define STORAGE_NUMBER_NEGATIVE_MAX_RAW (storage_number)( (1 << 31) | (0 << 30) | (1 << 29) | (1 << 28) | (1<<27) | (0 << 26) | (0 << 25) | (1 << 24) | 0x00000001 ) +#define STORAGE_NUMBER_NEGATIVE_MIN_RAW (storage_number)( (1 << 31) | (1 << 30) | (1 << 29) | (1 << 28) | (1<<27) | (1 << 26) | (0 << 25) | (1 << 24) | 0x00ffffff ) // accepted accuracy loss -#define ACCURACY_LOSS 0.0001 +#define ACCURACY_LOSS_ACCEPTED_PERCENT 0.0001 #define accuracy_loss(t1, t2) (((t1) == (t2) || (t1) == 0.0 || (t2) == 0.0) ? 0.0 : (100.0 - (((t1) > (t2)) ? ((t2) * 100.0 / (t1) ) : ((t1) * 100.0 / (t2))))) #endif /* NETDATA_STORAGE_NUMBER_H */ diff --git a/netdata-installer.sh b/netdata-installer.sh index 3ca8ad320..dfeb56396 100755 --- a/netdata-installer.sh +++ b/netdata-installer.sh @@ -930,7 +930,7 @@ Update check on the dashboard, will not work. If you want to have version update check, please re-install it following the procedure in: -https://github.com/netdata/netdata/wiki/Installation +https://github.com/netdata/netdata/tree/master/installer#installation VERMSG fi diff --git a/netdata.spec b/netdata.spec index 544a23f85..903b8a7f8 100644 --- a/netdata.spec +++ b/netdata.spec @@ -81,11 +81,11 @@ Recommends: python2-psycopg2 \ Summary: Real-time performance monitoring, done right Name: netdata -Version: 1.10.1 +Version: 1.11.0 Release: 1%{?dist} License: GPLv3+ Group: Applications/System -Source0: https://github.com/netdata/%{name}/releases/download/v1.11.0_rolling/%{name}-1.11.0_rolling.tar.gz +Source0: https://github.com/netdata/%{name}/releases/download/v1.11.1_rolling/%{name}-1.11.1_rolling.tar.gz URL: http://my-netdata.io BuildRequires: pkgconfig BuildRequires: xz @@ -126,7 +126,7 @@ so that you can get insights of what is happening now and what just happened, on your systems and applications. %prep -%setup -q -n netdata-1.11.0_rolling +%setup -q -n netdata-1.11.1_rolling %build %configure \ diff --git a/registry/README.md b/registry/README.md index f1d125b77..de24b3018 100644 --- a/registry/README.md +++ b/registry/README.md @@ -1,32 +1,32 @@ -# netdata registry +# Netdata registry Netdata registry implements the `my-netdata` menu on netdata dashboards. The `my-netdata` menu lists the netdata servers you have visited. ## Why? -netdata provides distributed monitoring. +Netdata provides distributed monitoring. Traditional monitoring solutions centralize all the data to provide unified dashboards across all servers. Before netdata, this was the standard practice. However it has a few issues: 1. due to the resources required, the number of metrics collected is limited. -2. for the same reason, the data collection frequency is not that high, at best it will be once every 10 or 15 seconds, at worst every 5 or 10 mins. -2. the central monitoring solution needs dedicated resources, thus becoming "another bottleneck" in the whole ecosystem. It also requires maintenance, administration, etc. -3. most centralized monitoring solutions are usually only good for presenting *statistics of past performance* (i.e. cannot be used for real-time performance troubleshooting). +1. for the same reason, the data collection frequency is not that high, at best it will be once every 10 or 15 seconds, at worst every 5 or 10 mins. +1. the central monitoring solution needs dedicated resources, thus becoming "another bottleneck" in the whole ecosystem. It also requires maintenance, administration, etc. +1. most centralized monitoring solutions are usually only good for presenting *statistics of past performance* (i.e. cannot be used for real-time performance troubleshooting). -Netdata has a different approach: +Netdata follows a different approach: 1. data collection happens per second -2. thousands of metrics per server are collected -3. data do not leave the server where they are collected -4. netdata servers do not talk to each other -5. your browser connects all the netdata servers +1. thousands of metrics per server are collected +1. data do not leave the server where they are collected +1. netdata servers do not talk to each other +1. your browser connects all the netdata servers -Using netdata, your monitoring infrastructure is embedded on each server, limiting significantly the need of additional resources. netdata is blazingly fast, very resource efficient and utilizes server resources that already exist and are spare (on each server). This allows **scaling out** the monitoring infrastructure. +Using netdata, your monitoring infrastructure is embedded on each server, limiting significantly the need of additional resources. Netdata is blazingly fast, very resource efficient and utilizes server resources that already exist and are spare (on each server). This allows **scaling out** the monitoring infrastructure. However, the netdata approach introduces a few new issues that need to be addressed, one being **the list of netdata we have installed**, i.e. the URLs our netdata servers are listening. -To solve this, netdata utilizes a **central registry**. This registry, together with certain browser features, allow netdata to provide unified cross server dashboards. For example, when you jump from server to server using the `my-netdata` menu, several session settings (like the currently viewed charts, the current zoom and pan operations on the charts, etc) are propagated to the new server, so that the new dashboard will come with exactly the same view. +To solve this, netdata utilizes a **central registry**. This registry, together with certain browser features, allow netdata to provide unified cross-server dashboards. For example, when you jump from server to server using the `my-netdata` menu, several session settings (like the currently viewed charts, the current zoom and pan operations on the charts, etc.) are propagated to the new server, so that the new dashboard will come with exactly the same view. ## What is the registry? @@ -36,17 +36,17 @@ The registry keeps track of 3 entities: For each netdata installation (each `machine_guid`) the registry keeps track of the different URLs it is accessed. -2. **persons**: i.e. the web browsers accessing the netdata installations (a random GUID generated by the registry the first time it sees a new web browser; we call this **person_guid**) +1. **persons**: i.e. the web browsers accessing the netdata installations (a random GUID generated by the registry the first time it sees a new web browser; we call this **person_guid**) For each person, the registry keeps track of the netdata installations it has accessed and their URLs. -3. **URLs** of netdata installations (as seen by the web browsers) +1. **URLs** of netdata installations (as seen by the web browsers) For each URL, the registry keeps the URL and nothing more. Each URL is linked to *persons* and *machines*. The only way to find a URL is to know its **machine_guid** or have a **person_guid** it is linked to it. ## Who talks to the registry? -Your web browser **only**! Check here if this is against your policies: [how to not send any information to a thirdparty server](https://github.com/netdata/netdata/wiki/netdata-security#registry-or-how-to-not-send-any-information-to-a-thirdparty-server) +Your web browser **only**! Check here if this is against your policies: [how to not send any information to a thirdparty server](../doc/netdata-security.md#netdata-security) Your netdata servers do not talk to the registry. This is a UML diagram of its operation: @@ -66,7 +66,7 @@ For *persons* and *machines*, the registry keeps links to *URLs*, each link with `https://registry.my-netdata.io`, which is currently served by `https://london.my-netdata.io`. This registry listens to both HTTP and HTTPS requests but the default is HTTPS. -#### Can this registry handle the global load of netdata installations? +### Can this registry handle the global load of netdata installations? Yeap! The registry can handle 50.000 - 100.000 requests **per second per core** (depending on the type of CPU, the computer's memory bandwidth, etc). 50.000 is on J1900 (celeron 2Ghz). @@ -107,7 +107,7 @@ You may also want to give your server different names under the **my-netdata** m So this server will appear in **my-netdata** as `Group1 - Master DB`. The max name length is 50 characters. -#### limiting access to the registry +### Limiting access to the registry netdata v1.9+ support limiting access to the registry from given IPs, like this: ``` @@ -115,11 +115,11 @@ netdata v1.9+ support limiting access to the registry from given IPs, like this: allow from = * ``` -`allow from` settings are [netdata simple patterns](https://github.com/netdata/netdata/wiki/Configuration#netdata-simple-patterns): string matches that use `*` as wildcard (any number of times) and a `!` prefix for a negative match. So: `allow from = !10.1.2.3 10.*` will allow all IPs in `10.*` except `10.1.2.3`. The order is important: left to right, the first positive or negative match is used. +`allow from` settings are [netdata simple patterns](../libnetdata/simple_pattern/): string matches that use `*` as wildcard (any number of times) and a `!` prefix for a negative match. So: `allow from = !10.1.2.3 10.*` will allow all IPs in `10.*` except `10.1.2.3`. The order is important: left to right, the first positive or negative match is used. Keep in mind that connections to netdata API ports are filtered by `[web].allow connections from`. So, IPs allowed by `[registry].allow from` should also be allowed by `[web].allow connection from`. -#### Where is the registry database stored? +### Where is the registry database stored? `/var/lib/netdata/registry/*.db` @@ -149,4 +149,4 @@ To use the registry, your web browser needs to support **third party cookies**, ERROR 409: Cannot ACCESS netdata registry: https://registry.my-netdata.io responded with: {"status":"redirect","registry":"https://registry.my-netdata.io"} ``` -This error is printed on your web browser console (press F12 on your browser to show it). +This error is printed on your web browser console (press F12 on your browser to see it). diff --git a/requirements.txt b/requirements.txt new file mode 100644 index 000000000..502183108 --- /dev/null +++ b/requirements.txt @@ -0,0 +1,3 @@ +mkdocs>=1.0.1 +mkdocs-material + diff --git a/runtime.txt b/runtime.txt new file mode 100644 index 000000000..d70c8f8d8 --- /dev/null +++ b/runtime.txt @@ -0,0 +1 @@ +3.6 diff --git a/streaming/README.md b/streaming/README.md index 1f3bd7391..e455d1070 100644 --- a/streaming/README.md +++ b/streaming/README.md @@ -11,9 +11,9 @@ a netdata performs: - run health checks that trigger alarms and send alarm notifications - archive metrics to a backend time-series database -The following configurations are supported: +## Supported configurations -#### netdata without a database or web API (headless collector) +### netdata without a database or web API (headless collector) Local netdata (`slave`), **without any database or alarms**, collects metrics and sends them to another netdata (`master`). @@ -28,7 +28,7 @@ of maintaining a local database and accepting dashboard requests, it streams all The same `master` can collect data for any number of `slaves`. -#### database replication +### database replication Local netdata (`slave`), **with a local database (and possibly alarms)**, collects metrics and sends them to another netdata (`master`). @@ -41,7 +41,7 @@ The `slave` and the `master` may have different data retention policies for the Alarms for the `slave` are triggered by **both** the `slave` and the `master` (and actually each can have different alarms configurations or have alarms disabled). -#### netdata proxies +### netdata proxies Local netdata (`slave`), with or without a database, collects metrics and sends them to another netdata (`proxy`), which may or may not maintain a database, which forwards them to another @@ -52,7 +52,7 @@ Alarms for the slave can be triggered by any of the involved hosts that maintain Any number of daisy chaining netdata servers are supported, each with or without a database and with or without alarms for the `slave` metrics. -#### mix and match with backends +### mix and match with backends All nodes that maintain a database can also send their data to a backend database. This allows quite complex setups. @@ -67,7 +67,7 @@ Example: 6. alarms are triggered by `H` for all hosts 7. users can use all the netdata that maintain a database to view metrics (i.e. at `H` all hosts can be viewed). -#### netdata.conf configuration +## Configuration These are options that affect the operation of netdata in this area: @@ -98,7 +98,7 @@ This also disables the registry (there cannot be a registry without an API). `[backend]` configures data archiving to a backend (it archives all databases maintained on this host). -#### streaming configuration +### streaming configuration A new file is introduced: [stream.conf](stream.conf) (to edit it on your system run `/etc/netdata/edit-config stream.conf`). This file holds streaming configuration for both the @@ -167,7 +167,7 @@ the unique id the netdata generating the metrics (i.e. the netdata that original them `/var/lib/netdata/registry/netdata.unique.id`). So, metrics for netdata `A` that pass through any number of other netdata, will have the same `MACHINE_GUID`. -####### allow from +##### allow from `allow from` settings are [netdata simple patterns](../libnetdata/simple_pattern): string matches that use `*` as wildcard (any number of times) and a `!` prefix for a negative match. @@ -176,7 +176,7 @@ important: left to right, the first positive or negative match is used. `allow from` is available in netdata v1.9+ -#### tracing +##### tracing When a `slave` is trying to push metrics to a `master` or `proxy`, it logs entries like these: @@ -203,7 +203,7 @@ The receiving end (`proxy` or `master`) logs entries like these: For netdata v1.9+, streaming can also be monitored via `access.log`. -#### Viewing remote host dashboards, using mirrored databases +## Viewing remote host dashboards, using mirrored databases On any receiving netdata, that maintains remote databases and has its web server enabled, `my-netdata` menu will include a list of the mirrored databases. @@ -240,7 +240,7 @@ Following the netdata way of monitoring, we wanted: 3. **zero configuration**, all ephemeral servers should have exactly the same configuration, and nothing should be configured at any system for each of the ephemeral nodes. We shouldn't care if 10 or 100 servers are spawned to handle the load. 4. **self-cleanup**, so that nothing needs to be done for cleaning up the monitoring infrastructure from the hundreds of nodes that may have been monitored through time. -#### How it works +### How it works All monitoring solutions, including netdata, work like this: @@ -410,4 +410,3 @@ The sending side of a netdata proxy, connects and disconnects to the final desti metrics, following the same pattern of the receiving side. For a practical example see [Monitoring ephemeral nodes](#monitoring-ephemeral-nodes). - diff --git a/system/edit-config b/system/edit-config index 1696f9f34..e7f50e767 100644 --- a/system/edit-config +++ b/system/edit-config @@ -4,7 +4,12 @@ file="${1}" -EDITOR="${EDITOR-vi}" +if [ "$(command -v editor)" ] ; then + EDITOR="${EDITOR-editor}" +else + EDITOR="${EDITOR-vi}" +fi + [ -z "${NETDATA_USER_CONFIG_DIR}" ] && NETDATA_USER_CONFIG_DIR="/usr/local/etc/netdata" [ -z "${NETDATA_STOCK_CONFIG_DIR}" ] && NETDATA_STOCK_CONFIG_DIR="/usr/local/lib/netdata/conf.d" diff --git a/system/edit-config.in b/system/edit-config.in index 1b86549fa..abfd5a454 100755 --- a/system/edit-config.in +++ b/system/edit-config.in @@ -4,7 +4,12 @@ file="${1}" -EDITOR="${EDITOR-vi}" +if [ "$(command -v editor)" ] ; then + EDITOR="${EDITOR-editor}" +else + EDITOR="${EDITOR-vi}" +fi + [ -z "${NETDATA_USER_CONFIG_DIR}" ] && NETDATA_USER_CONFIG_DIR="@configdir_POST@" [ -z "${NETDATA_STOCK_CONFIG_DIR}" ] && NETDATA_STOCK_CONFIG_DIR="@libconfigdir_POST@" diff --git a/system/netdata-openrc.in b/system/netdata-openrc.in index e0070526f..2acf282e6 100644 --- a/system/netdata-openrc.in +++ b/system/netdata-openrc.in @@ -35,7 +35,9 @@ depend() { use logger need net after ${NETDATA_START_AFTER_SERVICES} +} +start_pre() { checkpath -o ${NETDATA_OWNER} -d @localstatedir_POST@/cache/netdata @localstatedir_POST@/run/netdata } diff --git a/tests/README.md b/tests/README.md index 4fc9b303b..3dd8859a4 100644 --- a/tests/README.md +++ b/tests/README.md @@ -1,8 +1,9 @@ +# Testing This readme is a manual on how to get started with unit testing on javascript and nodejs Original author: BrainDoctor (github), July 2017 -# Installation +## Installation Tested on Linux Mint 18.2 Sara (Ubuntu/debian derivative) @@ -19,7 +20,7 @@ That should install the necessary node modules. Other browsers work too (Chrome, Firefox). However, only the Chromium Browser 59 has been tested for headless unit testing. -## Versions +### Versions The commands above leave me with the following versions (July 2017): @@ -28,21 +29,21 @@ The commands above leave me with the following versions (July 2017): - chromium-browser: 59.0.3071.109 - WebStorm (optional): 2017.1.4 -# Configuration +## Configuration -## NPM +### NPM The dependencies are installed in `netdata/package.json`. If you install a new NPM module, it gets added here. Future developers just need to execute `npm install` and every dep gets added automatically. -## Karma +### Karma Karma configuration is in `tests/web/karma.conf.js`. Documentation is provided via comments. -## WebStorm +### WebStorm If you use the JetBrains WebStorm IDE, you can integrate the karma runtime. -### for Karma (Client side testing) +#### for Karma (Client side testing) Headless Chromium: 1. Run > Edit Configurations @@ -66,7 +67,7 @@ You may add other browsers too (comma separated). With the "Browsers to start" f Also it is recommended to install WebStorm IDE Extension/Addon to Chrome/Chromium for awesome debugging. -### for node.d plugins (nodejs) +#### for node.d plugins (nodejs) 1. Run > Edit Configurations 2. "+" > Node.js @@ -75,23 +76,23 @@ Also it is recommended to install WebStorm IDE Extension/Addon to Chrome/Chromiu - JavaScript file: node_modules/jasmine-node/bin/jasmine-node - Application parameters: --captureExceptions tests/node.d -# Running +## Running -## In WebStorm +### In WebStorm -### Karma +#### Karma Just run the configured run configurations and they produce nice test trees:  -### node.js +#### node.js Debugging is awesome too!  -## From CLI +### From CLI -### Karma +#### Karma ```sh cd /path/to/your/netdata @@ -103,7 +104,7 @@ will start the karma server, start chromium in headless mode and exit. If a test fails, it produces even a stack trace:  -### Node.d plugins +#### Node.d plugins ```sh cd /path/to/your/netdata @@ -114,9 +115,9 @@ nodejs node_modules/jasmine-node/bin/jasmine-node --captureExceptions tests/node will run the tests in `tests/node.d` and produce a stacktrace too on error:  -## Coverage +### Coverage -### Karma +#### Karma A nice HTML is produced from Karma which shows which code paths were executed. It is located somewhere in `/path/to/your/netdata/coverage/` @@ -124,11 +125,11 @@ A nice HTML is produced from Karma which shows which code paths were executed. I and  -### Node.d +#### Node.d Apparently, jasmine-node can produce a junit report with the `--junitreport` flag. But that output was not very useful. Maybe it's configurable? -## CI +### CI The karma and node.d runners can be integrated in Travis (AFAIK), but that is outside my ability. diff --git a/web/Makefile.am b/web/Makefile.am index 1ec8d586d..c4e5fd50a 100644 --- a/web/Makefile.am +++ b/web/Makefile.am @@ -11,4 +11,6 @@ SUBDIRS = \ dist_noinst_DATA = \ README.md \ + gui/confluence/README.md \ + gui/custom/README.md \ $(NULL) diff --git a/web/Makefile.in b/web/Makefile.in index d598811bc..661f819c5 100644 --- a/web/Makefile.in +++ b/web/Makefile.in @@ -338,6 +338,8 @@ SUBDIRS = \ dist_noinst_DATA = \ README.md \ + gui/confluence/README.md \ + gui/custom/README.md \ $(NULL) all: all-recursive diff --git a/web/README.md b/web/README.md index e69de29bb..8e59ca5fd 100644 --- a/web/README.md +++ b/web/README.md @@ -0,0 +1,26 @@ +# Web Dashboards Overview + +The default port is 19999; for example, to access the dashboard on localhost, use: http://localhost:19999 + +To view netdata collected data you access its **[REST API v1](api/)**. + +For our convenience, netdata provides 2 more layers: + +1. The `dashboard.js` javascript library that allows us to design custom dashboards using plain HTML. For information on creating custom dashboards, see **[Custom Dashboards](gui/custom/)** and **[Atlassian Confluence Dashboards](gui/confluence/)** + +2. Ready to be used web dashboards that render all the charts a netdata server maintains. + +## customizing the standard dashboards + +Charts information is stored at /usr/share/netdata/web/[dashboard_info.js](gui/dashboard_info.js). This file includes information that is rendered on the dashboard, controls chart colors, section and subsection heading, titles, etc. + +If you change that file, your changes will be overwritten when netdata is updated. You can preserve your settings by creating a new such file (there is /usr/share/netdata/web/[dashboard_info_custom.example.js](gui/dashboard_info_custom_example.js) you can use to start with). + +You have to copy the example file under a new name, so that it will not be overwritten with netdata updates. + +To configure your info file set in netdata.conf: + +``` +[web] + custom dashboard_info.js = your_file_name.js +``` diff --git a/web/api/README.md b/web/api/README.md index 973d1bb6b..813998016 100644 --- a/web/api/README.md +++ b/web/api/README.md @@ -1,10 +1,12 @@ -# netdata REST API +# API + +## Netdata REST API The complete documentation of the netdata API is available at the **[Swagger Editor](https://editor.swagger.io/?url=https://raw.githubusercontent.com/netdata/netdata/master/web/api/netdata-swagger.yaml)**. If your prefer it over the Swagger Editor, you can also use **[Swagger UI](https://registry.my-netdata.io/swagger/#!/default/get_data)**. This however does not provide all the information available. -## google charts +## Google charts API netdata is a [Google Visualization API datatable and datasource provider](https://developers.google.com/chart/interactive/docs/reference), so it can directly be used with [Google Charts](https://developers.google.com/chart/interactive/docs/). @@ -15,4 +17,3 @@ Check this [single chart, jsfiddle example](https://jsfiddle.net/ktsaou/ensu4uws and this [multi chart, jsfiddle example](https://jsfiddle.net/ktsaou/L5y2eqp2/):  - diff --git a/web/api/badges/README.md b/web/api/badges/README.md index cf0b22bea..11d04d064 100644 --- a/web/api/badges/README.md +++ b/web/api/badges/README.md @@ -20,7 +20,7 @@ Similarly, there is [a chart that shows outbound bandwidth per class](http://lon The right one is a **volume** calculation. Netdata calculated the total of the last 86.400 seconds (a day) which gives `kilobits`, then divided it by 8 to make it KB, then by 1024 to make it MB and then by 1024 to make it GB. Calculations like this are quite accurate, since for every value collected, every second, netdata interpolates it to second boundary using microsecond calculations. -Let's see a few more badge examples (they come from the [netdata registry](https://github.com/netdata/netdata/wiki/mynetdata-menu-item)): +Let's see a few more badge examples (they come from the [netdata registry](../../../registry/)): - **cpu usage of user `root`** (you can pick any user; 100% = 1 core). This will be `green <10%`, `yellow <20%`, `orange <50%`, `blue <100%` (1 core), `red` otherwise (you define thresholds and colors on the URL). @@ -56,14 +56,14 @@ Here is what you can put for `options` (these are standard netdata API options): ```html <a href="#"> - <img src="http://registry.my-netdata.io/api/v1/badge.svg?chart=system.cpu"></img> + <img src="https://registry.my-netdata.io/api/v1/badge.svg?chart=system.cpu"></img> </a> ``` Which produces this: <a href="#"> - <img src="http://registry.my-netdata.io/api/v1/badge.svg?chart=system.cpu"></img> + <img src="https://registry.my-netdata.io/api/v1/badge.svg?chart=system.cpu"></img> </a> - `alarm=NAME` @@ -84,14 +84,14 @@ Here is what you can put for `options` (these are standard netdata API options): ```html <a href="#"> - <img src="http://registry.my-netdata.io/api/v1/badge.svg?chart=system.cpu&dimensions=system%7Cnice"></img> + <img src="https://registry.my-netdata.io/api/v1/badge.svg?chart=system.cpu&dimensions=system%7Cnice"></img> </a> ``` Which produces this: <a href="#"> - <img src="http://registry.my-netdata.io/api/v1/badge.svg?chart=system.cpu&dimensions=system%7Cnice"></img> + <img src="https://registry.my-netdata.io/api/v1/badge.svg?chart=system.cpu&dimensions=system%7Cnice"></img> </a> - `before=SECONDS` and `after=SECONDS` @@ -106,28 +106,28 @@ Here is what you can put for `options` (these are standard netdata API options): ```html <a href="#"> - <img src="http://registry.my-netdata.io/api/v1/badge.svg?chart=system.cpu&after=-60"></img> + <img src="https://registry.my-netdata.io/api/v1/badge.svg?chart=system.cpu&after=-60"></img> </a> ``` Which produces the average of last complete minute (XX:XX:00 - XX:XX:59): <a href="#"> - <img src="http://registry.my-netdata.io/api/v1/badge.svg?chart=system.cpu&after=-60"></img> + <img src="https://registry.my-netdata.io/api/v1/badge.svg?chart=system.cpu&after=-60"></img> </a> While this is the previous minute (one minute before the last one, again aligned XX:XX:00 - XX:XX:59): ```html <a href="#"> - <img src="http://registry.my-netdata.io/api/v1/badge.svg?chart=system.cpu&before=-60&after=-60"></img> + <img src="https://registry.my-netdata.io/api/v1/badge.svg?chart=system.cpu&before=-60&after=-60"></img> </a> ``` It produces this: <a href="#"> - <img src="http://registry.my-netdata.io/api/v1/badge.svg?chart=system.cpu&before=-60&after=-60"></img> + <img src="https://registry.my-netdata.io/api/v1/badge.svg?chart=system.cpu&before=-60&after=-60"></img> </a> - `group=min` or `group=max` or `group=average` (the default) or `group=sum` or `group=incremental-sum` @@ -208,11 +208,11 @@ These are options dedicated to badges: This option scales the svg image. It accepts values above or equal to 100 (100% is the default scale). For example, lets get a few different sizes: - <img src="http://registry.my-netdata.io/api/v1/badge.svg?chart=system.cpu&after=-60&scale=100"></img> original<br/> - <img src="http://registry.my-netdata.io/api/v1/badge.svg?chart=system.cpu&after=-60&scale=125"></img> `scale=125`<br/> - <img src="http://registry.my-netdata.io/api/v1/badge.svg?chart=system.cpu&after=-60&scale=150"></img> `scale=150`<br/> - <img src="http://registry.my-netdata.io/api/v1/badge.svg?chart=system.cpu&after=-60&scale=175"></img> `scale=175`<br/> - <img src="http://registry.my-netdata.io/api/v1/badge.svg?chart=system.cpu&after=-60&scale=200"></img> `scale=200` + <img src="https://registry.my-netdata.io/api/v1/badge.svg?chart=system.cpu&after=-60&scale=100"></img> original<br/> + <img src="https://registry.my-netdata.io/api/v1/badge.svg?chart=system.cpu&after=-60&scale=125"></img> `scale=125`<br/> + <img src="https://registry.my-netdata.io/api/v1/badge.svg?chart=system.cpu&after=-60&scale=150"></img> `scale=150`<br/> + <img src="https://registry.my-netdata.io/api/v1/badge.svg?chart=system.cpu&after=-60&scale=175"></img> `scale=175`<br/> + <img src="https://registry.my-netdata.io/api/v1/badge.svg?chart=system.cpu&after=-60&scale=200"></img> `scale=200` - `refresh=auto` or `refresh=SECONDS` @@ -243,7 +243,7 @@ These are options dedicated to badges: </script> ``` -A more advanced badges refresh method is to include `http://your.netdata.ip:19999/refresh-badges.js` in your page. For more information and use example, [check this](https://github.com/netdata/netdata/blob/master/web/gui/refresh-badges.js). +A more advanced badges refresh method is to include `http://your.netdata.ip:19999/refresh-badges.js` in your page. For more information and use example, [check this](../../gui/refresh-badges.js). --- @@ -321,4 +321,4 @@ You can refresh them from your browser console though. Press F12 to open the web ```js var len = document.images.length; while(len--) { document.images[len].src = document.images[len].src.replace(/\?cacheBuster=\d*/, "") + "?cacheBuster=" + new Date().getTime().toString(); }; -```
\ No newline at end of file +``` diff --git a/web/api/exporters/README.md b/web/api/exporters/README.md index e69de29bb..02e04abbf 100644 --- a/web/api/exporters/README.md +++ b/web/api/exporters/README.md @@ -0,0 +1,3 @@ +# Exporters + +TBD diff --git a/web/api/web_api_v1.c b/web/api/web_api_v1.c index 1e03828e4..5c54d52fc 100644 --- a/web/api/web_api_v1.c +++ b/web/api/web_api_v1.c @@ -429,6 +429,20 @@ inline int web_client_api_request_v1_data(RRDHOST *host, struct web_client *w, c return ret; } +// Pings a netdata server: +// /api/v1/registry?action=hello +// +// Access to a netdata registry: +// /api/v1/registry?action=access&machine=${machine_guid}&name=${hostname}&url=${url} +// +// Delete from a netdata registry: +// /api/v1/registry?action=delete&machine=${machine_guid}&name=${hostname}&url=${url}&delete_url=${delete_url} +// +// Search for the URLs of a machine: +// /api/v1/registry?action=search&machine=${machine_guid}&name=${hostname}&url=${url}&for=${machine_guid} +// +// Impersonate: +// /api/v1/registry?action=switch&machine=${machine_guid}&name=${hostname}&url=${url}&to=${new_person_guid} inline int web_client_api_request_v1_registry(RRDHOST *host, struct web_client *w, char *url) { static uint32_t hash_action = 0, hash_access = 0, hash_hello = 0, hash_delete = 0, hash_search = 0, hash_switch = 0, hash_machine = 0, hash_url = 0, hash_name = 0, hash_delete_url = 0, hash_for = 0, diff --git a/web/gui/Makefile.am b/web/gui/Makefile.am index 314ca3773..05d6f6542 100644 --- a/web/gui/Makefile.am +++ b/web/gui/Makefile.am @@ -3,9 +3,46 @@ # SPDX-License-Identifier: GPL-3.0-or-later # MAINTAINERCLEANFILES= $(srcdir)/Makefile.in +CLEANFILES = \ + dashboard.js \ + version.txt \ + $(NULL) + +DASHBOARD_JS_FILES = \ + src/dashboard.js/prologue.js.inc \ + src/dashboard.js/utils.js \ + src/dashboard.js/server-detection.js \ + src/dashboard.js/dependencies.js \ + src/dashboard.js/error-handling.js \ + src/dashboard.js/compatibility.js \ + src/dashboard.js/xss.js \ + src/dashboard.js/colors.js \ + src/dashboard.js/units-conversion.js \ + src/dashboard.js/options.js \ + src/dashboard.js/localstorage.js \ + src/dashboard.js/timeout.js \ + src/dashboard.js/themes.js \ + src/dashboard.js/charting/dygraph.js \ + src/dashboard.js/charting/sparkline.js \ + src/dashboard.js/charting/google-charts.js \ + src/dashboard.js/charting/gauge.js \ + src/dashboard.js/charting/easy-pie-chart.js \ + src/dashboard.js/charting/d3pie.js \ + src/dashboard.js/charting/d3.js \ + src/dashboard.js/charting/peity.js \ + src/dashboard.js/charting.js \ + src/dashboard.js/chart-registry.js \ + src/dashboard.js/common.js \ + src/dashboard.js/main.js \ + src/dashboard.js/alarms.js \ + src/dashboard.js/registry.js \ + src/dashboard.js/boot.js \ + src/dashboard.js/epilogue.js.inc \ + $(NULL) dist_noinst_DATA = \ README.md \ + $(DASHBOARD_JS_FILES) \ $(NULL) dist_web_DATA = \ @@ -22,10 +59,11 @@ dist_web_DATA = \ favicon.ico \ goto-host-from-alarm.html \ index.html \ + main.css \ + main.js \ infographic.html \ robots.txt \ refresh-badges.js \ - registry.html \ sitemap.xml \ tv.html \ version.txt \ @@ -89,20 +127,37 @@ dist_webimages_DATA = \ images/check-mark-2-multi-size-green.ico \ images/netdata.svg \ images/post.png \ - images/seo-performance-16.png \ - images/seo-performance-24.png \ - images/seo-performance-32.png \ - images/seo-performance-48.png \ - images/seo-performance-64.png \ - images/seo-performance-72.png \ - images/seo-performance-114.png \ - images/seo-performance-128.png \ - images/seo-performance-256.png \ - images/seo-performance-512.png \ - images/seo-performance-multi-size.ico \ - images/seo-performance-multi-size.icns \ + images/android-icon-36x36.png \ + images/android-icon-48x48.png \ + images/android-icon-72x72.png \ + images/android-icon-96x96.png \ + images/android-icon-144x144.png \ + images/android-icon-192x192.png \ + images/apple-icon-57x57.png \ + images/apple-icon-60x60.png \ + images/apple-icon-72x72.png \ + images/apple-icon-76x76.png \ + images/apple-icon-114x114.png \ + images/apple-icon-120x120.png \ + images/apple-icon-144x144.png \ + images/apple-icon-152x152.png \ + images/apple-icon-180x180.png \ + images/apple-icon-precomposed.png \ + images/apple-icon.png \ + images/favicon-16x16.png \ + images/favicon-32x32.png \ + images/favicon-96x96.png \ + images/favicon.ico \ + images/ms-icon-70x70.png \ + images/ms-icon-144x144.png \ + images/ms-icon-150x150.png \ + images/ms-icon-310x310.png \ + images/banner-icon-144x144.png \ $(NULL) +dashboard.js: $(DASHBOARD_JS_FILES) + if test -f $@; then rm -f $@; fi + cat $(DASHBOARD_JS_FILES) > $@.tmp && mv $@.tmp $@ webwellknowndir=$(webdir)/.well-known dist_webwellknown_DATA = \ @@ -120,4 +175,5 @@ version.txt: test -s $@.tmp || echo 0 > $@.tmp mv $@.tmp $@ -.PHONY: version.txt +# regenerate these files, even if they are up to date +.PHONY: version.txt dashboard.js diff --git a/web/gui/Makefile.in b/web/gui/Makefile.in index 2f79809ef..76c157685 100644 --- a/web/gui/Makefile.in +++ b/web/gui/Makefile.in @@ -309,8 +309,46 @@ webdir = @webdir@ # SPDX-License-Identifier: GPL-3.0-or-later # MAINTAINERCLEANFILES = $(srcdir)/Makefile.in +CLEANFILES = \ + dashboard.js \ + version.txt \ + $(NULL) + +DASHBOARD_JS_FILES = \ + src/dashboard.js/prologue.js.inc \ + src/dashboard.js/utils.js \ + src/dashboard.js/server-detection.js \ + src/dashboard.js/dependencies.js \ + src/dashboard.js/error-handling.js \ + src/dashboard.js/compatibility.js \ + src/dashboard.js/xss.js \ + src/dashboard.js/colors.js \ + src/dashboard.js/units-conversion.js \ + src/dashboard.js/options.js \ + src/dashboard.js/localstorage.js \ + src/dashboard.js/timeout.js \ + src/dashboard.js/themes.js \ + src/dashboard.js/charting/dygraph.js \ + src/dashboard.js/charting/sparkline.js \ + src/dashboard.js/charting/google-charts.js \ + src/dashboard.js/charting/gauge.js \ + src/dashboard.js/charting/easy-pie-chart.js \ + src/dashboard.js/charting/d3pie.js \ + src/dashboard.js/charting/d3.js \ + src/dashboard.js/charting/peity.js \ + src/dashboard.js/charting.js \ + src/dashboard.js/chart-registry.js \ + src/dashboard.js/common.js \ + src/dashboard.js/main.js \ + src/dashboard.js/alarms.js \ + src/dashboard.js/registry.js \ + src/dashboard.js/boot.js \ + src/dashboard.js/epilogue.js.inc \ + $(NULL) + dist_noinst_DATA = \ README.md \ + $(DASHBOARD_JS_FILES) \ $(NULL) dist_web_DATA = \ @@ -327,10 +365,11 @@ dist_web_DATA = \ favicon.ico \ goto-host-from-alarm.html \ index.html \ + main.css \ + main.js \ infographic.html \ robots.txt \ refresh-badges.js \ - registry.html \ sitemap.xml \ tv.html \ version.txt \ @@ -394,18 +433,32 @@ dist_webimages_DATA = \ images/check-mark-2-multi-size-green.ico \ images/netdata.svg \ images/post.png \ - images/seo-performance-16.png \ - images/seo-performance-24.png \ - images/seo-performance-32.png \ - images/seo-performance-48.png \ - images/seo-performance-64.png \ - images/seo-performance-72.png \ - images/seo-performance-114.png \ - images/seo-performance-128.png \ - images/seo-performance-256.png \ - images/seo-performance-512.png \ - images/seo-performance-multi-size.ico \ - images/seo-performance-multi-size.icns \ + images/android-icon-36x36.png \ + images/android-icon-48x48.png \ + images/android-icon-72x72.png \ + images/android-icon-96x96.png \ + images/android-icon-144x144.png \ + images/android-icon-192x192.png \ + images/apple-icon-57x57.png \ + images/apple-icon-60x60.png \ + images/apple-icon-72x72.png \ + images/apple-icon-76x76.png \ + images/apple-icon-114x114.png \ + images/apple-icon-120x120.png \ + images/apple-icon-144x144.png \ + images/apple-icon-152x152.png \ + images/apple-icon-180x180.png \ + images/apple-icon-precomposed.png \ + images/apple-icon.png \ + images/favicon-16x16.png \ + images/favicon-32x32.png \ + images/favicon-96x96.png \ + images/favicon.ico \ + images/ms-icon-70x70.png \ + images/ms-icon-144x144.png \ + images/ms-icon-150x150.png \ + images/ms-icon-310x310.png \ + images/banner-icon-144x144.png \ $(NULL) webwellknowndir = $(webdir)/.well-known @@ -663,6 +716,7 @@ install-strip: mostlyclean-generic: clean-generic: + -test -z "$(CLEANFILES)" || rm -f $(CLEANFILES) distclean-generic: -test -z "$(CONFIG_CLEAN_FILES)" || rm -f $(CONFIG_CLEAN_FILES) @@ -765,6 +819,10 @@ uninstall-am: uninstall-dist_webDATA uninstall-dist_webcssDATA \ uninstall-dist_webwellknownDATA +dashboard.js: $(DASHBOARD_JS_FILES) + if test -f $@; then rm -f $@; fi + cat $(DASHBOARD_JS_FILES) > $@.tmp && mv $@.tmp $@ + version.txt: if test -d "$(top_srcdir)/.git"; then \ git --git-dir="$(top_srcdir)/.git" log -n 1 --format=%H; \ @@ -772,7 +830,8 @@ version.txt: test -s $@.tmp || echo 0 > $@.tmp mv $@.tmp $@ -.PHONY: version.txt +# regenerate these files, even if they are up to date +.PHONY: version.txt dashboard.js # Tell versions [3.59,3.63) of GNU make to not export all variables. # Otherwise a system limit (for SysV at least) may be exceeded. diff --git a/web/gui/README.md b/web/gui/README.md index e69de29bb..4cb050256 100644 --- a/web/gui/README.md +++ b/web/gui/README.md @@ -0,0 +1,106 @@ +# Netdata Agent Web GUI + +## Generating dashboard.js + +The monolithic `dashboards.js` file is automatically generated by concatenating the source files located in the `web/gui/src/dashboard.js/` directory by running the build script: + +```sh +cd web/gui +make +``` + +After every change in the `src` directory, the `dashboard.js` file should be regenerated and commited to the repository. + +## Custom Dashboards + +For information on creating custom dashboards, see **[Custom Dashboards](custom/)** and **[Atlassian Confluence Dashboards](confluence/)** + +## Supported chart libraries + +- Dygraph +- jQuery Sparkline +- Peity +- Google Charts +- Morris +- EasyPieChart +- Gauge.js +- D3 +- C3 + +### Dygraph + +#### Settings + +[Example settings here](https://github.com/netdata/netdata/blob/e91f00d99f4965e985981b93fa46ef33f94dd726/web/dashboard.js#L3793) + +#### Value Range + +You can set the min and max values of the y-axis using `data-dygraph-valuerange="[MIN, MAX]"` + +### EasyPieChart + +#### Settings + +TBD + +#### Value Range + +You can set the max value of the chart using the following snippet: +```html +<div data-netdata="unique.id" + data-chart-library="easypiechart" + data-easypiechart-max-value="40" + ></div> +``` +Be aware that values that exceed the max value will get expanded (e.g. "41" is still 100%). Similar for the minimum: +```html +<div data-netdata="unique.id" + data-chart-library="easypiechart" + data-easypiechart-min-value="20" + ></div> +``` +If you specify both minimum and maximum, the rendering behavior changes. Instead of displaying the `value` based from zero, it is now based on the range that is provided by the snippet: +```html +<div data-netdata="unique.id" + data-chart-library="easypiechart" + data-easypiechart-min-value="20" + data-easypiechart-max-value="40" + ></div> +``` +In the first example, a value of `30`, without specifying the minimum, fills the chart bar to `75%` (100% / 40 * 30). However, in this example the range is now `20` (40 - 20 = 20). The value `30` will fill the chart to **`50%`**, since it's in the middle between 20 and 40. + +This szenario is useful if you have metrics that change only within a specific range, e.g. temperatures that are very unlikely to fall out of range. In these cases it is more useful to have the chart render the values between the given min and max, to better highlight the changes within them. + +#### Negative Values + +EasyPieCharts can render negative values with the following flag: +```html +<div data-netdata="unique.id" + data-chart-library="easypiechart" + data-override-options="signed" + ></div> +``` +Negative values are rendered counter-clockwise. + +#### Full example + +This is a chart that displays the hotwater temperature in the given range of 40 to 50. +```html +<div data-netdata="stiebeleltron_system.hotwater.hotwatertemp" + data-title="Hot Water Temperature" + data-decimal-digits="1" + data-chart-library="easypiechart" + data-colors="#FE3912" + data-width="55%" + data-height="50%" + data-points="1200" + data-after="-1200" + data-dimensions="actual" + data-units="°C" + data-easypiechart-max-value="50" + data-easypiechart-min-value="40" + data-common-max="netdata-hotwater-max" + data-common-min="netdata-hotwater-min" +></div> +``` +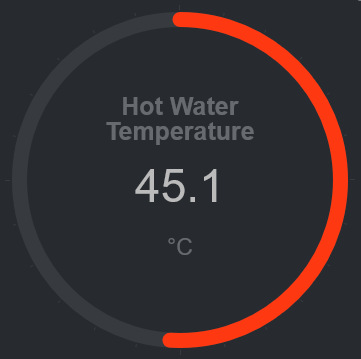 diff --git a/web/gui/confluence/README.md b/web/gui/confluence/README.md new file mode 100644 index 000000000..3973c10be --- /dev/null +++ b/web/gui/confluence/README.md @@ -0,0 +1,1012 @@ +# Atlassian Confluence Dashboards + +With netdata you can build **live, interactive, monitoring dashboards** directly on Atlassian's **Confluence** pages. + +I see you already asking "why should I do this?" + +Well... think a bit of it.... confluence is the perfect place for something like that: + +1. All the employees of your company already have access to it. + +2. Most probably you have already several spaces on confluence, one for each project or service. Adding live monitoring information there is ideal: everything in one place. Your users will just click on the page and instantly the monitoring page they need will appear with only the information they need to know. + +3. You can create monitoring pages for very specific purposes, hiding all the information that is too detailed for most users, or explaining in detail things that are difficult for them to understand. + +So, what can we expect? What can netdata do on confluence? + +You will be surprised! **Everything a netdata dashboard does!**. Example: + + + +Let me show you how. + +> Let's assume we have 2 web servers we want to monitor. We will create a simple dashboard with key information about them, directly on confluence. + +### Before you begin + +Most likely your confluence is accessible via HTTPS. So, you need to proxy your netdata servers via an apache or nginx to make them HTTPS too. If your Confluence is HTTPS but your netdata are not, you will not be able to fetch the netdata content from the confluence page. The netdata wiki has many examples for proxying netdata through another web server. + +> So, make sure netdata and confluence can be accessed with the same protocol (**http**, or **https**). + +For our example, I will use these 2 servers: + +server|url +----|---- +Server 1 | https://london.my-netdata.io +Server 2 | https://frankfurt.my-netdata.io + +I will use the first server for the static dashboard javascript files. + +--- + +Then, you need to enable the `html` plugin of confluence. We will add some plain html content on that page, and this plugin is required. + +### Create a new page + +Create a new confluence page and paste this into an `html` box: + +```html +<script> +// don't load bootstrap - confluence does not need this +var netdataNoBootstrap = true; + +// select the web notifications to show on this dashboard +// var netdataShowAlarms = true; +// var netdataAlarmsRecipients = [ 'sysadmin', 'webmaster' ]; +</script> + +<script src="https://london.my-netdata.io/dashboard.js"></script> +``` + +like this (type `{html` for the html box to appear - you need the confluence html plugin enabled): + + + +### Add a few badges + +Then, go to your netdata and copy an alarm badge (the `<embed>` version of it): + + + +Then add another HTML box on the page, and paste it, like this: + + + +Hit **update** and you will get this: + + + +This badge is now auto-refreshing. It will update itself based on the update frequency of the alarm. + +> Keep in mind you can add badges with custom netdata queries too. netdata automatically creates badges for all the alarms, but every chart, every dimension on every chart, can be used for a badge. And netdata badges are quite powerful! Check [Creating Badges](../../api/badges/) for more information on badges. + +So, let's create a table and add this badge for both our web servers: + + + +Now we get this: + +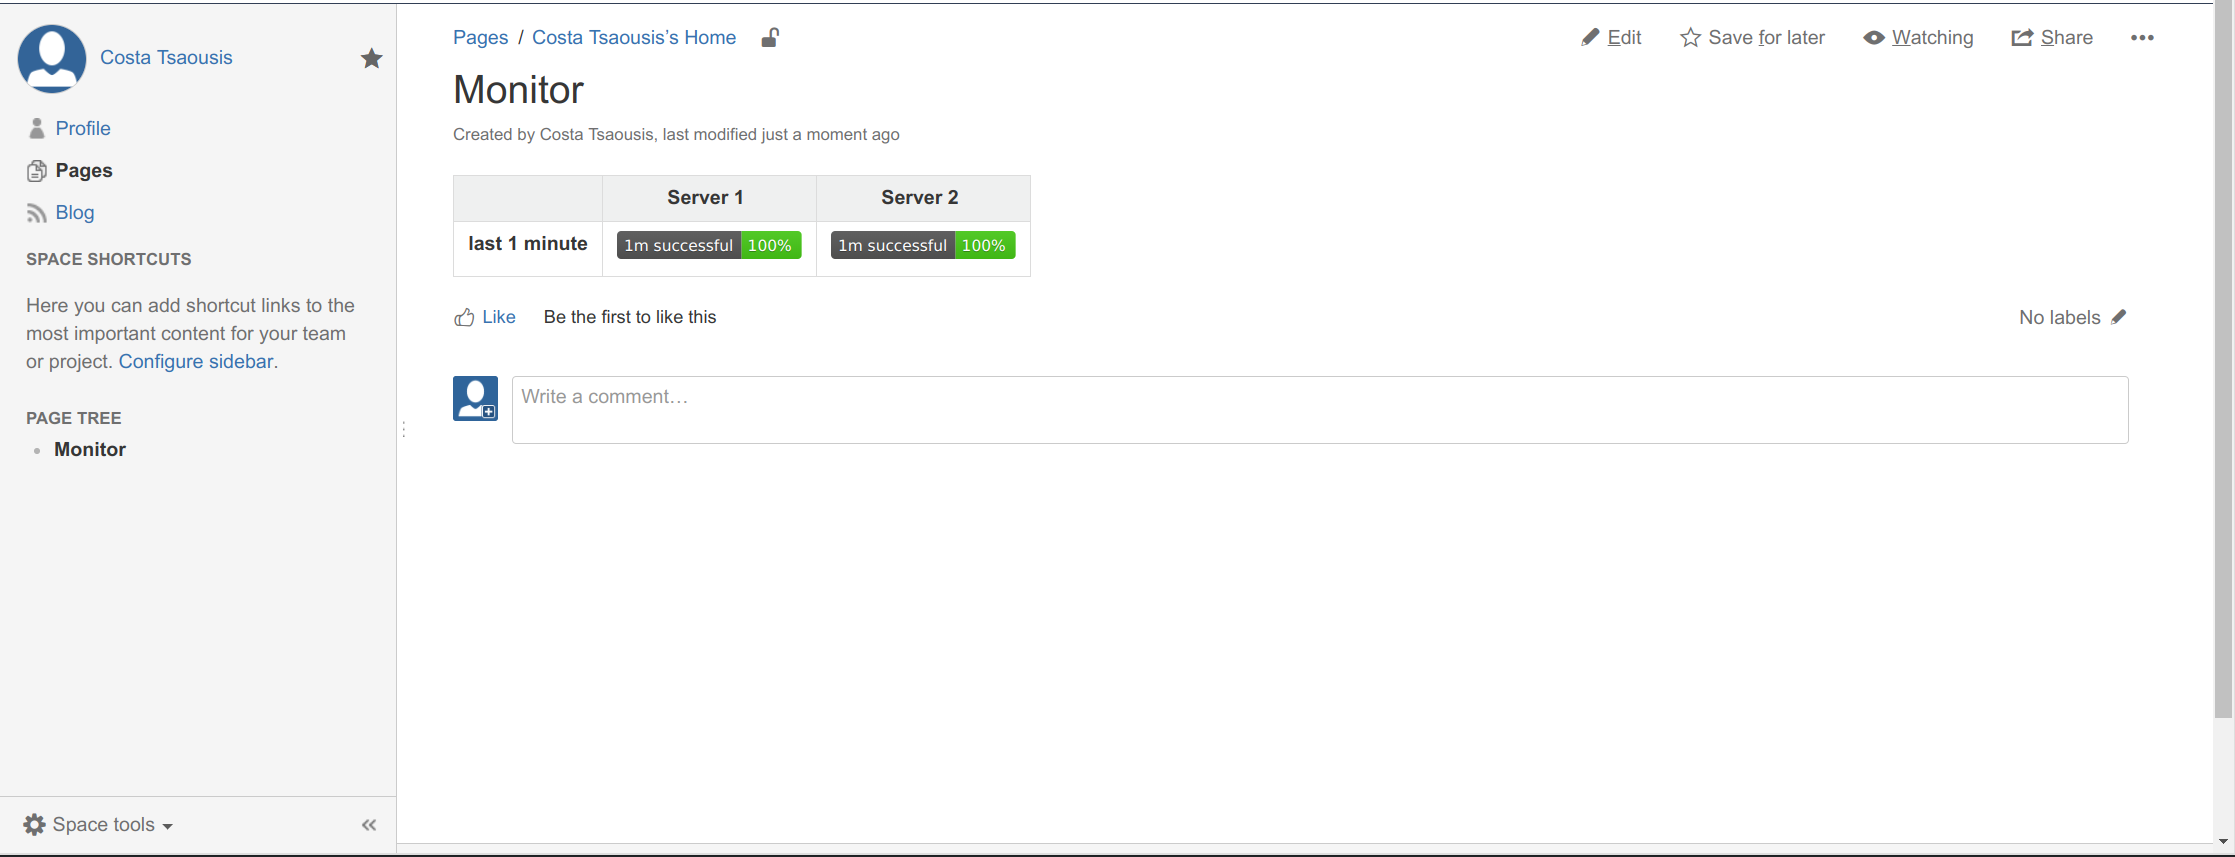 + +### Add a netdata chart + +The simplest form of a chart is this (it adds the chart `web_log_nginx_netdata.response_statuses`, using 100% of the width, 150px height, and the last 10 minutes of data): + +```html +<div + data-netdata="web_log_nginx_netdata.response_statuses" + data-width="100%" + data-height="150px" + data-before="0" + data-after="-600" +></div> +``` + +Add this to `html` block on confluence: + + + +And you will get this: + +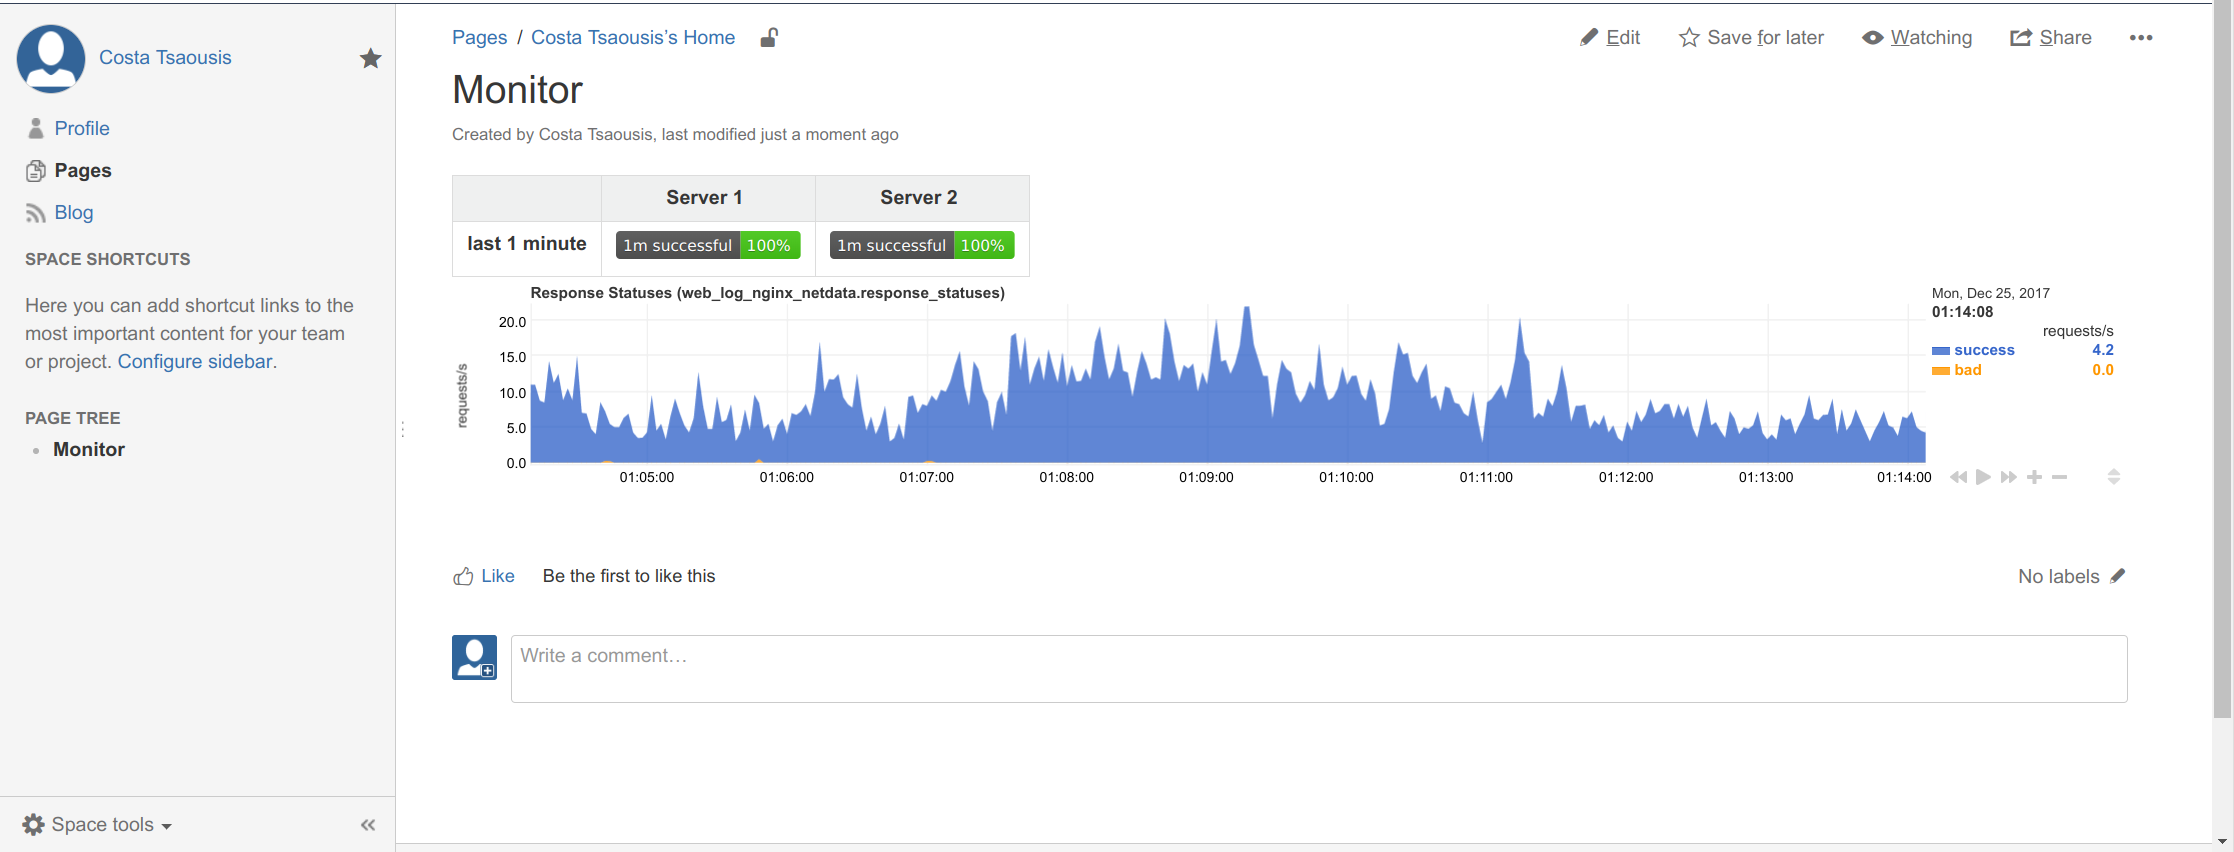 + +> This chart is **alive**, fully interactive. You can drag it, pan it, zoom it, etc like you do on netdata dashboards! + +Of course this too big. We need something smaller to add inside the table. Let's try this: + +```html +<div + data-netdata="web_log_nginx_netdata.response_statuses" + data-legend="false" + data-dygraph-yaxislabelwidth="35" + data-dygraph-ypixelsperlabel="8" + data-after="-600" + data-before="0" + data-title="" + data-height="100px" + data-width="300px" +></div> +``` + +The chart name is shown on all netdata charts, so just copy it from a netdata dashboard. + +We will fetch the same chart from both servers. To define the server we also added `data-host=` with the URL of each server, like this (we also added `<br/>` for a newline between the badge and the chart): + + + +Which gives us this: + +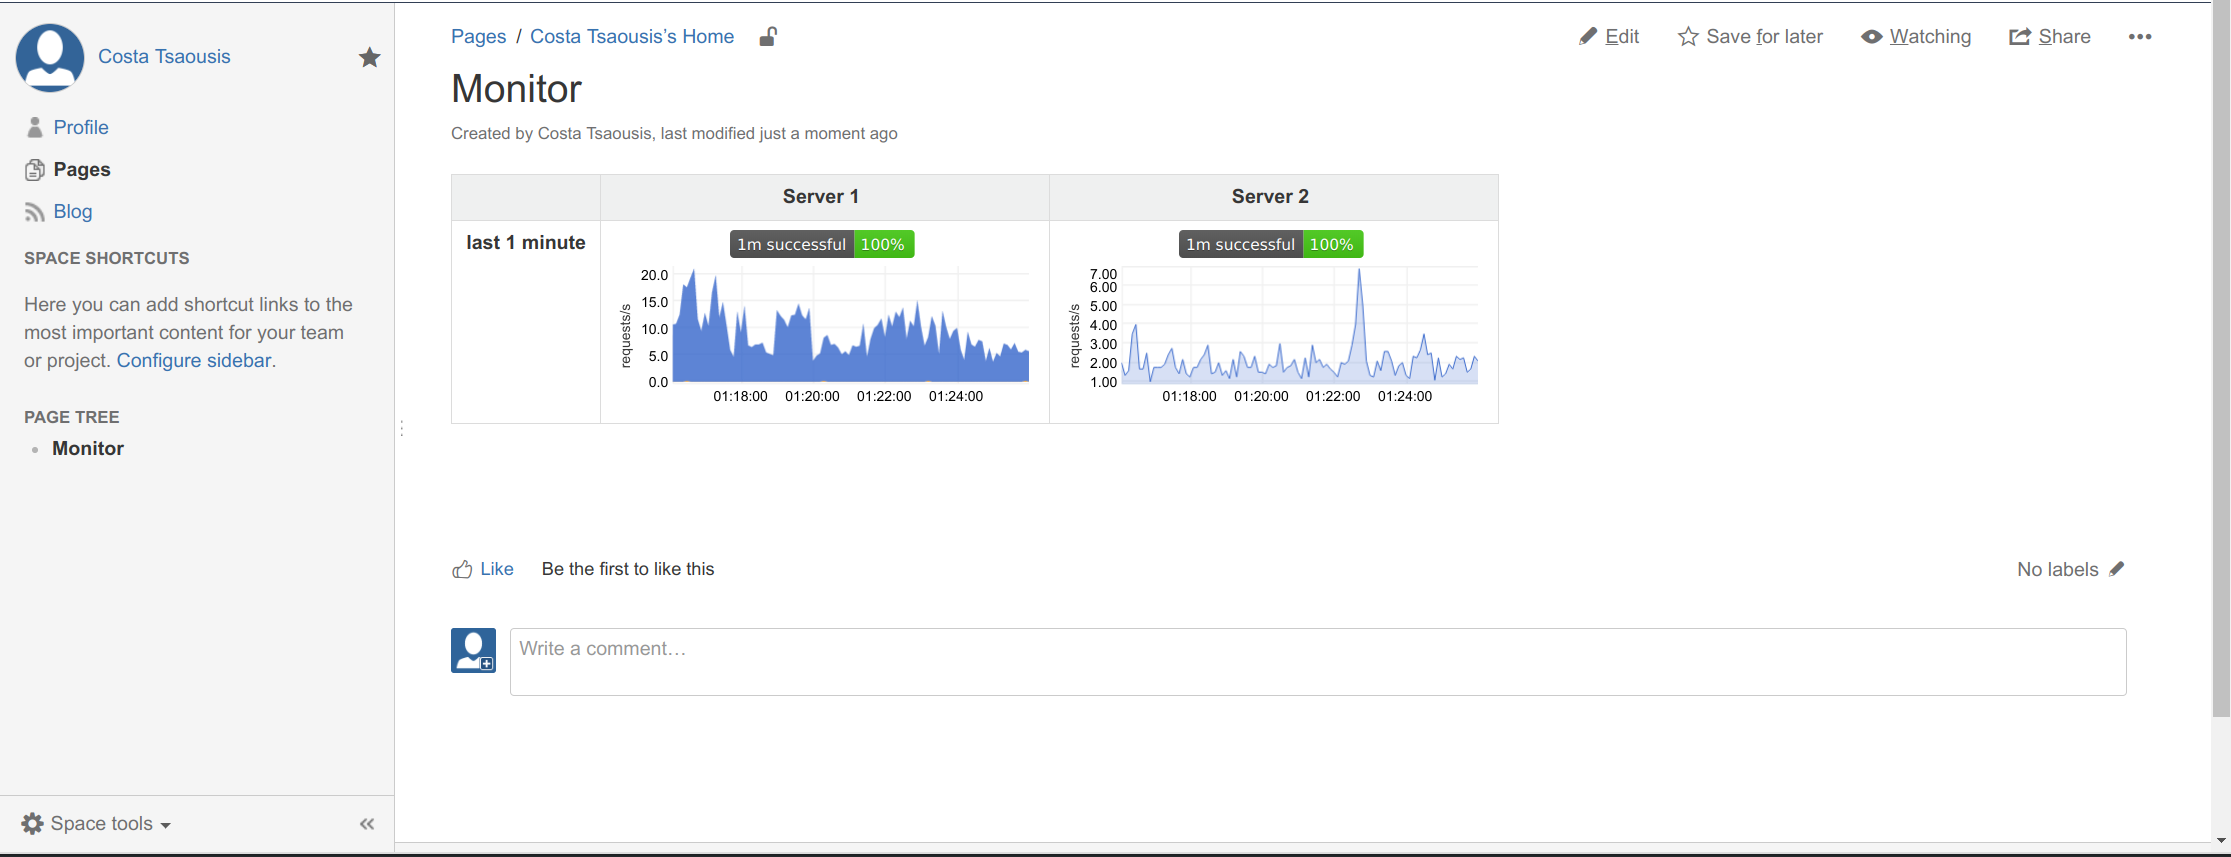 + +Note the color difference. This is because netdata automatically hides dimensions that are just zero (the frankfurt server has only successful requests). To instruct netdata to disable this feature, we need to add another html fragment at the bottom of the page (make sure this is added after loading `dashboard.js`). So we edit the first block we added, and append a new `<script>` section to it: + + +```html +<script> +// don't load bootstrap - confluence does not need this +var netdataNoBootstrap = true; + +// select the web notifications to show on this dashboard +// var netdataShowAlarms = true; +// var netdataAlarmsRecipients = [ 'sysadmin', 'webmaster' ]; +</script> + +<script src="https://london.my-netdata.io/dashboard.js"></script> + +<script> +// do not hide dimensions with just zeros +NETDATA.options.current.eliminate_zero_dimensions = false; +</script> +``` + +Now they match: + + + +#### more options + +If you want to change the colors append `data-colors="#001122 #334455 #667788"`. The colors will be used for the dimensions top to bottom, as shown on a netdata dashboard. Keep in mind the default netdata dashboards hide by default all dimensions that are just zero, so enable them at the dashboard settings to see them all. + +You can get a percentage chart, by adding these on these charts: + +```html + data-append-options="percentage" + data-decimal-digits="0" + data-dygraph-valuerange="[0, 100]" + data-dygraph-includezero="true" + data-units="%" +``` + +The first line instructs netdata to calculate the percentage of each dimension, the second strips any fractional digits, the third instructs the charting library to size the chart from 0 to 100, the next one instructs it to include 0 in the chart and the last changes the units of the chart to `%`. This is how it will look: + +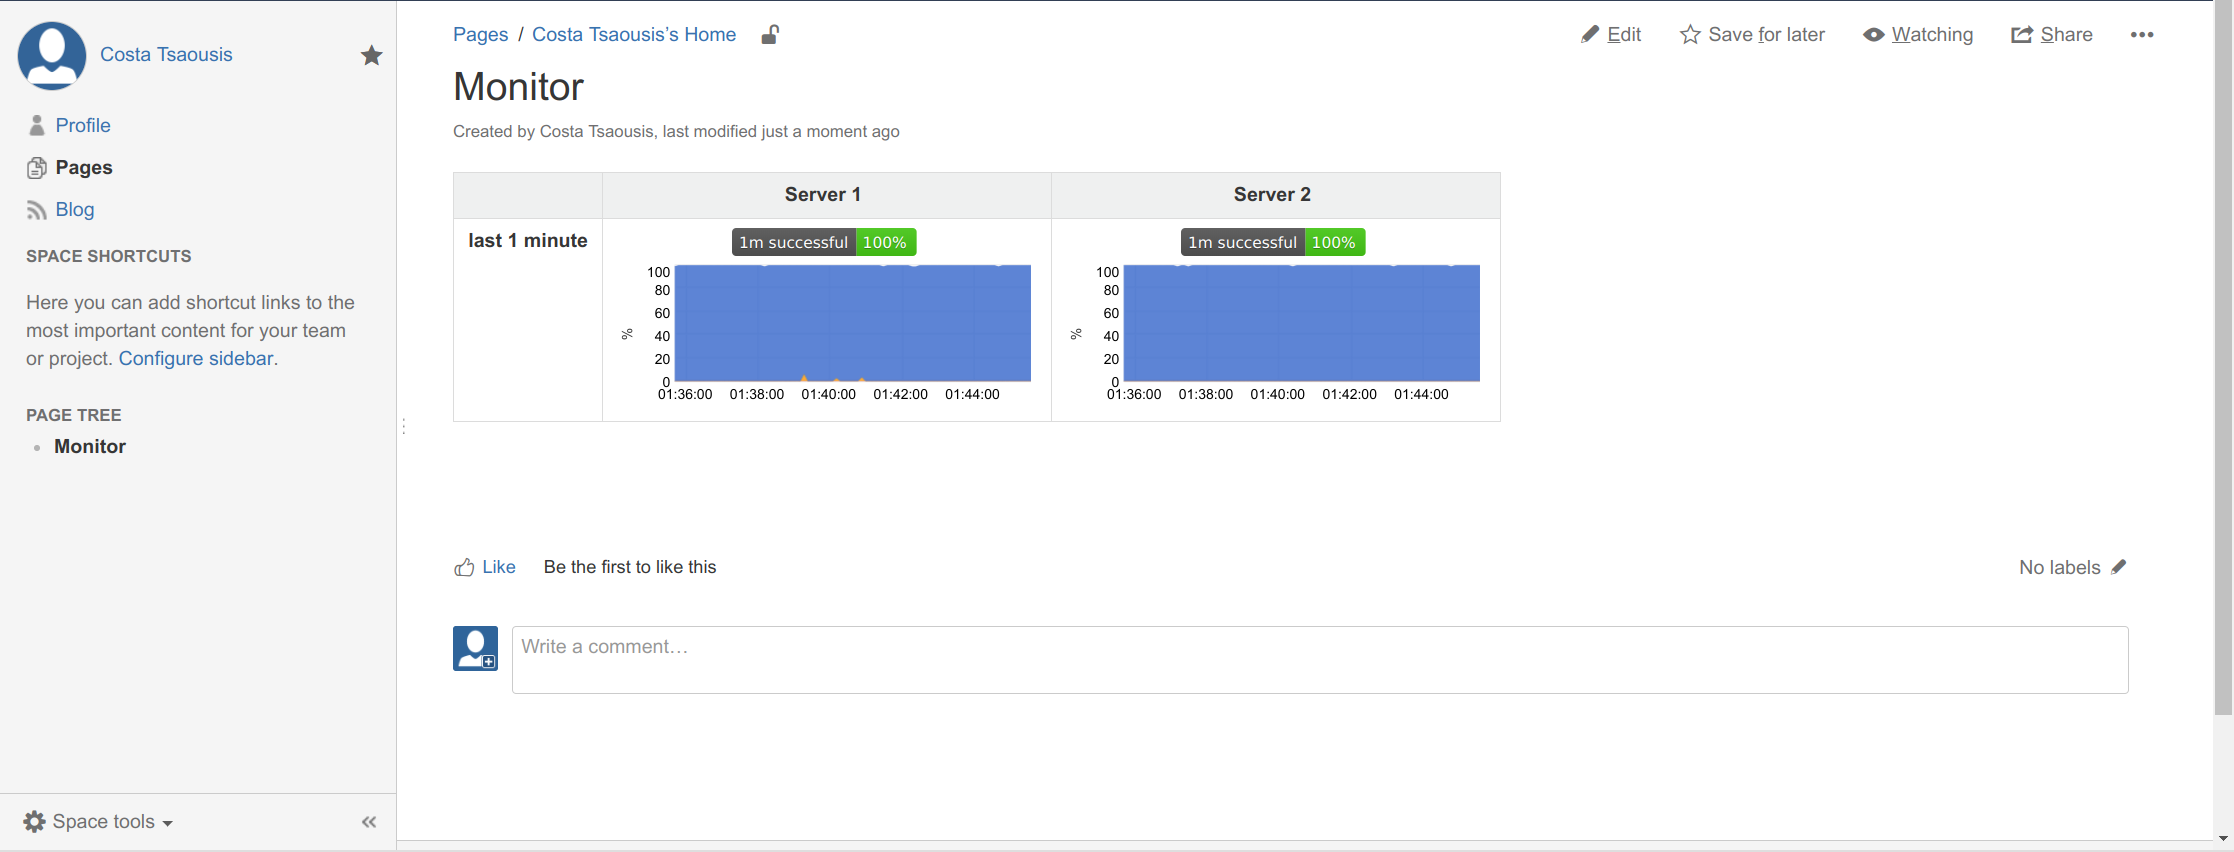 + +You can make any number of charts have common min and max on the y-range by adding `common-min="NAME"` and `common-max="NAME"`, where `NAME` is anything you like. Keep in mind for best results all the charts with the same `NAME` should be visible at once, otherwise a not-visible chart will influence the range and until it is updated the range will not adapt. + +### Add gauges + +Let's now add a few gauges. The chart we added has several dimensions: `success`, `error`, `redirect`, `bad` and `other`. + +Let's say we want to add 2 gauges: + +1. `success` and `redirect` together, in blue +2. `error`, `bad` and `other` together, in orange + +We will add the following for each server. We have enclosed them in another a `<div>` because Confluence will wrap them if the page width is not enough to fit them. With that additional `<div>` they will always be next to each other. + +```html +<div style="width: 300px; text-align: center;"> +<div + data-netdata="web_log_nginx_netdata.response_statuses" + data-host="https://london.my-netdata.io" + data-dimensions="success,redirect" + data-chart-library="gauge" + data-title="Good" + data-units="requests/s" + data-gauge-adjust="width" + data-width="120" + data-before="0" + data-after="-600" + data-points="600" + data-common-max="response_statuses" + data-colors="#007ec6" + data-decimal-digits="0" + ></div><div + data-netdata="web_log_nginx_netdata.response_statuses" + data-host="https://london.my-netdata.io" + data-dimensions="error,bad,other" + data-chart-library="gauge" + data-title="Bad" + data-units="requests/s" + data-gauge-adjust="width" + data-width="120" + data-before="0" + data-after="-600" + data-points="600" + data-common-max="response_statuses" + data-colors="#97CA00" + data-decimal-digits="0" + ></div> +</div> +``` + +Adding the above will give you this: + + + + +### Final source - for the confluence source editor + +If you enable the source editor of Confluence, you can paste the whole example (implementing the first image on this post and demonstrating everything discussed on this page): + +```html +<p class="auto-cursor-target">Monitoring the health of the web servers, by analyzing the response codes they send.</p> +<table> + <colgroup> + <col/> + <col/> + <col/> + <col/> + <col/> + </colgroup> + <tbody> + <tr> + <th style="text-align: center;"> + <br/> + </th> + <th style="text-align: center;">London</th> + <th style="text-align: center;">Frankfurt</th> + <th colspan="1" style="text-align: center;">San Francisco</th> + <th colspan="1" style="text-align: center;">Toronto</th> + </tr> + <tr> + <td colspan="1" style="text-align: right;"> + <strong>last hour</strong> + <br/> + <strong>requests</strong> + </td> + <td colspan="1" style="text-align: center;"> + <div class="content-wrapper"> + <p class="auto-cursor-target"> + <br/> + </p> + <ac:structured-macro ac:macro-id="5771a1db-b461-478f-a820-edcb67809eb1" ac:name="html" ac:schema-version="1"> + <ac:plain-text-body><![CDATA[<div + data-netdata="web_log_nginx_netdata.response_statuses" + data-host="https://london.my-netdata.io" + data-chart-library="easypiechart" + data-after="-14400" + data-before="0" + data-points="4" + data-title="london" + data-method="sum" + data-append-options="unaligned" + data-update-every="60" + data-width="120px" + data-common-max="1h_requests_pie" + data-decimal-digits="0" +></div>]]></ac:plain-text-body> + </ac:structured-macro> + <p class="auto-cursor-target"> + <br/> + </p> + </div> + </td> + <td colspan="1" style="text-align: center;"> + <div class="content-wrapper"> + <p class="auto-cursor-target"> + <br/> + </p> + <ac:structured-macro ac:macro-id="aff4446a-1432-407b-beb0-488c33eced18" ac:name="html" ac:schema-version="1"> + <ac:plain-text-body><![CDATA[<div + data-netdata="web_log_nginx_netdata.response_statuses" + data-host="https://frankfurt.my-netdata.io" + data-chart-library="easypiechart" + data-after="-14400" + data-before="0" + data-points="4" + data-title="frankfurt" + data-method="sum" + data-append-options="unaligned" + data-update-every="60" + data-width="120px" + data-common-max="1h_requests_pie" + data-decimal-digits="0" +></div>]]></ac:plain-text-body> + </ac:structured-macro> + <p class="auto-cursor-target"> + <br/> + </p> + </div> + </td> + <td colspan="1" style="text-align: center;"> + <div class="content-wrapper"> + <p class="auto-cursor-target"> + <br/> + </p> + <ac:structured-macro ac:macro-id="fd310534-627c-47bd-a184-361eb3f00489" ac:name="html" ac:schema-version="1"> + <ac:plain-text-body><![CDATA[<div + data-netdata="web_log_nginx_netdata.response_statuses" + data-host="https://sanfrancisco.my-netdata.io" + data-chart-library="easypiechart" + data-after="-14400" + data-before="0" + data-points="4" + data-title="sanfrancisco" + data-method="sum" + data-append-options="unaligned" + data-update-every="60" + data-width="120px" + data-common-max="1h_requests_pie" + data-decimal-digits="0" +></div>]]></ac:plain-text-body> + </ac:structured-macro> + <p class="auto-cursor-target"> + <br/> + </p> + </div> + </td> + <td colspan="1" style="text-align: center;"> + <div class="content-wrapper"> + <p class="auto-cursor-target"> + <br/> + </p> + <ac:structured-macro ac:macro-id="eb1261d5-8ff2-4a5c-8945-701bf04fb75b" ac:name="html" ac:schema-version="1"> + <ac:plain-text-body><![CDATA[<div + data-netdata="web_log_nginx_netdata.response_statuses" + data-host="https://toronto.my-netdata.io" + data-chart-library="easypiechart" + data-after="-14400" + data-before="0" + data-points="4" + data-title="toronto" + data-method="sum" + data-append-options="unaligned" + data-update-every="60" + data-width="120px" + data-common-max="1h_requests_pie" + data-decimal-digits="0" +></div>]]></ac:plain-text-body> + </ac:structured-macro> + <p class="auto-cursor-target"> + <br/> + </p> + </div> + </td> + </tr> + <tr> + <td colspan="1" style="text-align: right;"> + <strong>last<br/>1 hour</strong> + </td> + <td colspan="1" style="text-align: center;"> + <div class="content-wrapper"> + <p class="auto-cursor-target"> + <br/> + </p> + <ac:structured-macro ac:macro-id="d2ee8425-2c6c-4e26-8c5a-17f6153fdce1" ac:name="html" ac:schema-version="1"> + <ac:plain-text-body><![CDATA[<div + data-netdata="web_log_nginx_netdata.response_statuses" +data-host="https://london.my-netdata.io" + data-legend="false" + data-dygraph-yaxislabelwidth="35" + data-dygraph-ypixelsperlabel="8" +data-dygraph-xpixelsperlabel="30" +data-dygraph-xaxislabelwidth="26" + data-after="-3600" + data-before="0" + data-title="" + data-height="100px" + data-width="300px" +data-common-max="1h_requests" +data-decimal-digits="0" +></div>]]></ac:plain-text-body> + </ac:structured-macro> + <p class="auto-cursor-target"> + <br/> + </p> + </div> + </td> + <td colspan="1" style="text-align: center;"> + <div class="content-wrapper"> + <p class="auto-cursor-target"> + <br/> + </p> + <ac:structured-macro ac:macro-id="b3fb482a-4e9e-4b69-bb0b-9885d1687334" ac:name="html" ac:schema-version="1"> + <ac:plain-text-body><![CDATA[<div + data-netdata="web_log_nginx_netdata.response_statuses" +data-host="https://frankfurt.my-netdata.io" + data-legend="false" + data-dygraph-yaxislabelwidth="35" + data-dygraph-ypixelsperlabel="8" +data-dygraph-xpixelsperlabel="30" +data-dygraph-xaxislabelwidth="26" + data-after="-3600" + data-before="0" + data-title="" + data-height="100px" + data-width="300px" +data-common-max="1h_requests" +data-decimal-digits="0" +></div>]]></ac:plain-text-body> + </ac:structured-macro> + <p class="auto-cursor-target"> + <br/> + </p> + </div> + </td> + <td colspan="1" style="text-align: center;"> + <div class="content-wrapper"> + <p class="auto-cursor-target"> + <br/> + </p> + <ac:structured-macro ac:macro-id="199b1618-64be-4614-9662-f84cd01c6d8d" ac:name="html" ac:schema-version="1"> + <ac:plain-text-body><![CDATA[<div + data-netdata="web_log_nginx_netdata.response_statuses" +data-host="https://sanfrancisco.my-netdata.io" + data-legend="false" + data-dygraph-yaxislabelwidth="35" + data-dygraph-ypixelsperlabel="8" +data-dygraph-xpixelsperlabel="30" +data-dygraph-xaxislabelwidth="26" + data-after="-3600" + data-before="0" + data-title="" + data-height="100px" + data-width="300px" +data-common-max="1h_requests" +data-decimal-digits="0" +></div>]]></ac:plain-text-body> + </ac:structured-macro> + <p class="auto-cursor-target"> + <br/> + </p> + </div> + </td> + <td colspan="1" style="text-align: center;"> + <div class="content-wrapper"> + <p class="auto-cursor-target"> + <br/> + </p> + <ac:structured-macro ac:macro-id="61b2d444-fb2b-42e0-b4eb-611fb37dcb66" ac:name="html" ac:schema-version="1"> + <ac:plain-text-body><![CDATA[<div + data-netdata="web_log_nginx_netdata.response_statuses" +data-host="https://toronto.my-netdata.io" + data-legend="false" + data-dygraph-yaxislabelwidth="35" + data-dygraph-ypixelsperlabel="8" +data-dygraph-xpixelsperlabel="30" +data-dygraph-xaxislabelwidth="26" + data-after="-3600" + data-before="0" + data-title="" + data-height="100px" + data-width="300px" +data-common-max="1h_requests" +data-decimal-digits="0" +></div>]]></ac:plain-text-body> + </ac:structured-macro> + <p class="auto-cursor-target"> + <br/> + </p> + </div> + </td> + </tr> + <tr> + <td colspan="1" style="text-align: right;"> + <strong>last 10<br/>minutes</strong> + </td> + <td colspan="1" style="text-align: center;"> + <div class="content-wrapper"> + <p class="auto-cursor-target"> + <br/> + </p> + <ac:structured-macro ac:macro-id="f29e7663-f2e6-4e1d-a090-38704e0f2bd3" ac:name="html" ac:schema-version="1"> + <ac:plain-text-body><![CDATA[<div + data-netdata="web_log_nginx_netdata.response_statuses" +data-host="https://london.my-netdata.io" + data-legend="false" + data-dygraph-yaxislabelwidth="35" + data-dygraph-ypixelsperlabel="8" + data-after="-600" + data-before="0" + data-title="" + data-height="100px" + data-width="300px" +data-common-max="10m_requests" +data-decimal-digits="0" +></div>]]></ac:plain-text-body> + </ac:structured-macro> + <p class="auto-cursor-target"> + <br/> + </p> + </div> + </td> + <td colspan="1" style="text-align: center;"> + <div class="content-wrapper"> + <p class="auto-cursor-target"> + <br/> + </p> + <ac:structured-macro ac:macro-id="245ccc90-1505-430b-ba13-15e6a9793c11" ac:name="html" ac:schema-version="1"> + <ac:plain-text-body><![CDATA[<div + data-netdata="web_log_nginx_netdata.response_statuses" +data-host="https://frankfurt.my-netdata.io" + data-legend="false" + data-dygraph-yaxislabelwidth="35" + data-dygraph-ypixelsperlabel="8" + data-after="-600" + data-before="0" + data-title="" + data-height="100px" + data-width="300px" +data-common-max="10m_requests" +data-decimal-digits="0" +></div>]]></ac:plain-text-body> + </ac:structured-macro> + <p class="auto-cursor-target"> + <br/> + </p> + </div> + </td> + <td colspan="1" style="text-align: center;"> + <div class="content-wrapper"> + <p class="auto-cursor-target"> + <br/> + </p> + <ac:structured-macro ac:macro-id="864ff17f-f372-47e4-9d57-54e44b142240" ac:name="html" ac:schema-version="1"> + <ac:plain-text-body><![CDATA[<div + data-netdata="web_log_nginx_netdata.response_statuses" +data-host="https://sanfrancisco.my-netdata.io" + data-legend="false" + data-dygraph-yaxislabelwidth="35" + data-dygraph-ypixelsperlabel="8" + data-after="-600" + data-before="0" + data-title="" + data-height="100px" + data-width="300px" +data-common-max="10m_requests" +data-decimal-digits="0" +></div>]]></ac:plain-text-body> + </ac:structured-macro> + <p class="auto-cursor-target"> + <br/> + </p> + </div> + </td> + <td colspan="1" style="text-align: center;"> + <div class="content-wrapper"> + <p class="auto-cursor-target"> + <br/> + </p> + <ac:structured-macro ac:macro-id="e0072f2b-0169-4ecf-8ddf-724270d185b8" ac:name="html" ac:schema-version="1"> + <ac:plain-text-body><![CDATA[<div + data-netdata="web_log_nginx_netdata.response_statuses" +data-host="https://toronto.my-netdata.io" + data-legend="false" + data-dygraph-yaxislabelwidth="35" + data-dygraph-ypixelsperlabel="8" + data-after="-600" + data-before="0" + data-title="" + data-height="100px" + data-width="300px" +data-common-max="10m_requests" +data-decimal-digits="0" +></div>]]></ac:plain-text-body> + </ac:structured-macro> + <p class="auto-cursor-target"> + <br/> + </p> + </div> + </td> + </tr> + <tr> + <td style="text-align: right;"> + <strong>last 1<br/>minute</strong> + </td> + <td style="text-align: center;"> + <div class="content-wrapper"> + <p class="auto-cursor-target"> + <br/> + </p> + <ac:structured-macro ac:macro-id="8c041cfb-a5a0-425c-afe6-207f4986cb26" ac:name="html" ac:schema-version="1"> + <ac:plain-text-body><![CDATA[<embed src="https://london.my-netdata.io/api/v1/badge.svg?chart=web_log_nginx_netdata.response_statuses&alarm=1m_successful&refresh=auto&label=1m%20london%20successful%20requests" type="image/svg+xml" height="20"/> +<br/> +<div + data-netdata="web_log_nginx_netdata.response_statuses" +data-host="https://london.my-netdata.io" + data-legend="false" + data-dygraph-yaxislabelwidth="35" + data-dygraph-ypixelsperlabel="8" + data-after="-60" + data-before="0" + data-title="" + data-height="100px" + data-width="300px" + data-append-options="percentage" + data-decimal-digits="0" + data-dygraph-valuerange="[0, 100]" + data-dygraph-includezero="true" + data-units="%" +data-dimensions="success" +data-colors="#009900" +></div>]]></ac:plain-text-body> + </ac:structured-macro> + <p class="auto-cursor-target"> + <br/> + </p> + </div> + </td> + <td style="text-align: center;"> + <div class="content-wrapper"> + <p class="auto-cursor-target"> + <br/> + </p> + <ac:structured-macro ac:macro-id="a3777583-9919-4997-891c-94a8cec60604" ac:name="html" ac:schema-version="1"> + <ac:plain-text-body><![CDATA[<embed src="https://frankfurt.my-netdata.io/api/v1/badge.svg?chart=web_log_nginx_netdata.response_statuses&alarm=1m_successful&refresh=auto&label=1m%20frankfurt%20successful%20requests" type="image/svg+xml" height="20"/> +<br/> +<div + data-netdata="web_log_nginx_netdata.response_statuses" +data-host="https://frankfurt.my-netdata.io" + data-legend="false" + data-dygraph-yaxislabelwidth="35" + data-dygraph-ypixelsperlabel="8" + data-after="-60" + data-before="0" + data-title="" + data-height="100px" + data-width="300px" + data-append-options="percentage" + data-decimal-digits="0" + data-dygraph-valuerange="[0, 100]" + data-dygraph-includezero="true" + data-units="%" +data-dimensions="success" +data-colors="#009900" +></div>]]></ac:plain-text-body> + </ac:structured-macro> + <p class="auto-cursor-target"> + <br/> + </p> + </div> + </td> + <td colspan="1" style="text-align: center;"> + <div class="content-wrapper"> + <p class="auto-cursor-target"> + <br/> + </p> + <ac:structured-macro ac:macro-id="e003deba-82fa-4aec-8264-6cb7d814a299" ac:name="html" ac:schema-version="1"> + <ac:plain-text-body><![CDATA[<embed src="https://sanfrancisco.my-netdata.io/api/v1/badge.svg?chart=web_log_nginx_netdata.response_statuses&alarm=1m_successful&refresh=auto&label=1m%20sanfrancisco%20successful%20requests" type="image/svg+xml" height="20"/> +<br/> +<div + data-netdata="web_log_nginx_netdata.response_statuses" +data-host="https://sanfrancisco.my-netdata.io" + data-legend="false" + data-dygraph-yaxislabelwidth="35" + data-dygraph-ypixelsperlabel="8" + data-after="-60" + data-before="0" + data-title="" + data-height="100px" + data-width="300px" + data-append-options="percentage" + data-decimal-digits="0" + data-dygraph-valuerange="[0, 100]" + data-dygraph-includezero="true" + data-units="%" +data-dimensions="success" +data-colors="#009900" +></div>]]></ac:plain-text-body> + </ac:structured-macro> + <p class="auto-cursor-target"> + <br/> + </p> + </div> + </td> + <td colspan="1" style="text-align: center;"> + <div class="content-wrapper"> + <p class="auto-cursor-target"> + <br/> + </p> + <ac:structured-macro ac:macro-id="046fcda5-98db-4776-8c51-3981d0e68f38" ac:name="html" ac:schema-version="1"> + <ac:plain-text-body><![CDATA[<embed src="https://toronto.my-netdata.io/api/v1/badge.svg?chart=web_log_nginx_netdata.response_statuses&alarm=1m_successful&refresh=auto&label=1m%20toronto%20successful%20requests" type="image/svg+xml" height="20"/> +<br/> +<div + data-netdata="web_log_nginx_netdata.response_statuses" +data-host="https://toronto.my-netdata.io" + data-legend="false" + data-dygraph-yaxislabelwidth="35" + data-dygraph-ypixelsperlabel="8" + data-after="-60" + data-before="0" + data-title="" + data-height="100px" + data-width="300px" + data-append-options="percentage" + data-decimal-digits="0" + data-dygraph-valuerange="[0, 100]" + data-dygraph-includezero="true" + data-units="%" +data-dimensions="success" +data-colors="#009900" +></div>]]></ac:plain-text-body> + </ac:structured-macro> + <p class="auto-cursor-target"> + <br/> + </p> + </div> + </td> + </tr> + <tr> + <td colspan="1" style="text-align: right;"> + <strong>now</strong> + </td> + <td colspan="1" style="text-align: left;"> + <div class="content-wrapper"> + <p class="auto-cursor-target"> + <br/> + </p> + <ac:structured-macro ac:macro-id="4aef31d3-9439-439b-838d-7350a26bde5f" ac:name="html" ac:schema-version="1"> + <ac:plain-text-body><![CDATA[<div style="width: 300px; text-align: center;"> +<div + data-netdata="web_log_nginx_netdata.response_statuses" + data-host="https://london.my-netdata.io" + data-dimensions="success" + data-chart-library="gauge" + data-title="Success" + data-units="requests/s" + data-gauge-adjust="width" + data-width="120" + data-before="0" + data-after="-60" + data-points="60" + data-common-max="response_statuses" + data-colors="#009900" + data-decimal-digits="0" + ></div><div + data-netdata="web_log_nginx_netdata.response_statuses" + data-host="https://london.my-netdata.io" + data-dimensions="redirect,error,bad,other" + data-chart-library="gauge" + data-title="All Others" + data-units="requests/s" + data-gauge-adjust="width" + data-width="120" + data-before="0" + data-after="-60" + data-points="60" + data-common-max="response_statuses" + data-colors="#fe7d37" + data-decimal-digits="0" + ></div> +</div> +<br/> +<div + data-netdata="web_log_nginx_netdata.response_statuses" + data-host="https://london.my-netdata.io" + data-dygraph-theme="sparkline" + data-width="300" + data-height="20" + data-before="0" + data-after="-60" + data-points="60" + data-common-max="1m_requests_sparkline" + ></div>]]></ac:plain-text-body> + </ac:structured-macro> + <p class="auto-cursor-target"> + <br/> + </p> + </div> + </td> + <td colspan="1" style="text-align: left;"> + <div class="content-wrapper"> + <p class="auto-cursor-target"> + <br/> + </p> + <ac:structured-macro ac:macro-id="bf9fb1c4-ceaf-4ad8-972e-a64d23eb48f8" ac:name="html" ac:schema-version="1"> + <ac:plain-text-body><![CDATA[<div style="width: 300px; text-align: center;"> +<div + data-netdata="web_log_nginx_netdata.response_statuses" + data-host="https://frankfurt.my-netdata.io" + data-dimensions="success" + data-chart-library="gauge" + data-title="Success" + data-units="requests/s" + data-gauge-adjust="width" + data-width="120" + data-before="0" + data-after="-60" + data-points="60" + data-common-max="response_statuses" + data-colors="#009900" + data-decimal-digits="0" + ></div><div + data-netdata="web_log_nginx_netdata.response_statuses" + data-host="https://frankfurt.my-netdata.io" + data-dimensions="redirect,error,bad,other" + data-chart-library="gauge" + data-title="All Others" + data-units="requests/s" + data-gauge-adjust="width" + data-width="120" + data-before="0" + data-after="-60" + data-points="60" + data-common-max="response_statuses" + data-colors="#fe7d37" + data-decimal-digits="0" + ></div> +</div> +<br/> +<div + data-netdata="web_log_nginx_netdata.response_statuses" + data-host="https://frankfurt.my-netdata.io" + data-dygraph-theme="sparkline" + data-width="300" + data-height="20" + data-before="0" + data-after="-60" + data-points="60" + data-common-max="1m_requests_sparkline" + ></div>]]></ac:plain-text-body> + </ac:structured-macro> + <p class="auto-cursor-target"> + <br/> + </p> + </div> + </td> + <td colspan="1"> + <div class="content-wrapper"> + <p class="auto-cursor-target"> + <br/> + </p> + <ac:structured-macro ac:macro-id="60b4c9bc-353a-4e64-b7c8-365ae74156c4" ac:name="html" ac:schema-version="1"> + <ac:plain-text-body><![CDATA[<div style="width: 300px; text-align: center;"> +<div + data-netdata="web_log_nginx_netdata.response_statuses" + data-host="https://sanfrancisco.my-netdata.io" + data-dimensions="success" + data-chart-library="gauge" + data-title="Success" + data-units="requests/s" + data-gauge-adjust="width" + data-width="120" + data-before="0" + data-after="-60" + data-points="60" + data-common-max="response_statuses" + data-colors="#009900" + data-decimal-digits="0" + ></div><div + data-netdata="web_log_nginx_netdata.response_statuses" + data-host="https://sanfrancisco.my-netdata.io" + data-dimensions="redirect,error,bad,other" + data-chart-library="gauge" + data-title="All Others" + data-units="requests/s" + data-gauge-adjust="width" + data-width="120" + data-before="0" + data-after="-60" + data-points="60" + data-common-max="response_statuses" + data-colors="#fe7d37" + data-decimal-digits="0" + ></div> +</div> +<br/> +<div + data-netdata="web_log_nginx_netdata.response_statuses" + data-host="https://sanfrancisco.my-netdata.io" + data-dygraph-theme="sparkline" + data-width="300" + data-height="20" + data-before="0" + data-after="-60" + data-points="60" + data-common-max="1m_requests_sparkline" + ></div>]]></ac:plain-text-body> + </ac:structured-macro> + <p class="auto-cursor-target"> + <br/> + </p> + </div> + </td> + <td colspan="1"> + <div class="content-wrapper"> + <p class="auto-cursor-target"> + <br/> + </p> + <ac:structured-macro ac:macro-id="75e03235-9681-4aaf-bd85-b0ffbb9e3602" ac:name="html" ac:schema-version="1"> + <ac:plain-text-body><![CDATA[<div style="width: 300px; text-align: center;"> +<div + data-netdata="web_log_nginx_netdata.response_statuses" + data-host="https://toronto.my-netdata.io" + data-dimensions="success" + data-chart-library="gauge" + data-title="Success" + data-units="requests/s" + data-gauge-adjust="width" + data-width="120" + data-before="0" + data-after="-60" + data-points="60" + data-common-max="response_statuses" + data-colors="#009900" + data-decimal-digits="0" + ></div><div + data-netdata="web_log_nginx_netdata.response_statuses" + data-host="https://toronto.my-netdata.io" + data-dimensions="redirect,error,bad,other" + data-chart-library="gauge" + data-title="All Others" + data-units="requests/s" + data-gauge-adjust="width" + data-width="120" + data-before="0" + data-after="-60" + data-points="60" + data-common-max="response_statuses" + data-colors="#fe7d37" + data-decimal-digits="0" + ></div> +</div> +<br/> +<div + data-netdata="web_log_nginx_netdata.response_statuses" + data-host="https://toronto.my-netdata.io" + data-dygraph-theme="sparkline" + data-width="300" + data-height="20" + data-before="0" + data-after="-60" + data-points="60" + data-common-max="1m_requests_sparkline" + ></div>]]></ac:plain-text-body> + </ac:structured-macro> + <p class="auto-cursor-target"> + <br/> + </p> + </div> + </td> + </tr> + </tbody> +</table> +<p class="auto-cursor-target"> + <br/> +</p> +<p> + <br/> +</p> +<ac:structured-macro ac:macro-id="10bbb1a6-cd65-4a27-9b3a-cb86a5a0ebe1" ac:name="html" ac:schema-version="1"> + <ac:plain-text-body><![CDATA[<script> +// don't load bootstrap - confluence does not need this +var netdataNoBootstrap = true; + +// select the web notifications to show on this dashboard +// var netdataShowAlarms = true; +// var netdataAlarmsRecipients = [ 'sysadmin', 'webmaster' ]; +</script> + +<script src="https://london.my-netdata.io/dashboard.js"></script> + + +<script> +// do not hide dimensions with just zeros +NETDATA.options.current.eliminate_zero_dimensions = false; +</script>]]></ac:plain-text-body> +</ac:structured-macro> +<p class="auto-cursor-target"> + <br/> +</p> +<div> + <span style="color: rgb(52,52,52);font-family: "Source Code Pro" , monospace;font-size: 16.2px;white-space: pre-wrap;background-color: rgb(252,252,252);"> + <br/> + </span> +</div> +<div> + <span style="color: rgb(52,52,52);font-family: "Source Code Pro" , monospace;font-size: 16.2px;white-space: pre-wrap;background-color: rgb(252,252,252);"> + <br/> + </span> +</div> +``` diff --git a/web/gui/custom/README.md b/web/gui/custom/README.md new file mode 100644 index 000000000..7e1877a4d --- /dev/null +++ b/web/gui/custom/README.md @@ -0,0 +1,412 @@ +# Custom Dashboards + +You can: + +- create your own dashboards using simple HTML (no javascript is required for basic dashboards) +- utilizing any or all of the available chart libraries, on the same dashboard +- using data from one or more netdata servers, on the same dashboard +- host your dashboard HTML page on any web server, anywhere + +netdata charts can also be added to existing web pages. + +Check this **[very simple working example of a custom dashboard](http://netdata.firehol.org/demo.html)**, and its **[html source](../demo.html)**. + +If you plan to put it on TV, check **[tv.html](../tv.html)**. This is a screenshot of it, monitoring 2 servers on the same page: + + +-- + +## Web directory + +The default web root directory is `/usr/share/netdata/web` where you will find examples such as tv.html, and demo.html as well as the main dashboard contained in index.html. +Note: index.html have a different syntax. Don't use it as a template for simple custom dashboards. + +## Example empty dashboard + +If you need to create a new dashboard on an empty page, we suggest the following header: + +```html +<!DOCTYPE html> +<html lang="en"> +<head> + <title>Your dashboard</title> + + <meta http-equiv="Content-Type" content="text/html; charset=utf-8" /> + <meta charset="utf-8"> + <meta http-equiv="X-UA-Compatible" content="IE=edge,chrome=1"> + <meta name="viewport" content="width=device-width, initial-scale=1"> + <meta name="apple-mobile-web-app-capable" content="yes"> + <meta name="apple-mobile-web-app-status-bar-style" content="black-translucent"> + + <!-- here we will add dashboard.js --> + +</head> +<body> + +<!-- here we will add charts --> + +</body> +</html> +``` + + +## dashboard.js + +To add netdata charts to any web page (dedicated to netdata or not), you need to include the `/dashboard.js` file of a netdata server. + +For example, if your netdata server listens at `http://box:19999/`, you will need to add the following to the `head` section of your web page: + +```html +<script type="text/javascript" src="http://box:19999/dashboard.js"></script> +``` + +### what dashboard.js does? + +`dashboard.js` will automatically load the following: + +1. `dashboard.css`, required for the netdata charts + +2. `jquery.min.js`, (only if jquery is not already loaded for this web page) + +3. `bootstrap.min.js` (only if bootstrap is not already loaded) and `bootstrap.min.css`. + + You can disable this by adding the following before loading `dashboard.js`: + +```html +<script>var netdataNoBootstrap = true;</script> +``` + +4. `jquery.nanoscroller.min.js`, required for the scrollbar of the chart legends. + +5. `bootstrap-toggle.min.js` and `bootstrap-toggle.min.css`, required for the settings toggle buttons. + +6. `font-awesome.min.css`, for icons. + +When `dashboard.js` loads will scan the page for elements that define charts (see below) and immediately start refreshing them. Keep in mind more javascript modules may be loaded (every chart library is a different javascript file, that is loaded on first use). + +### Prevent dashboard.js from starting chart refreshes + +If your web page is not static and you plan to add charts using javascript, you can tell `dashboard.js` not to start processing charts immediately after loaded, by adding this fragment before loading it: + +```html +<script>var netdataDontStart = true;</script> +``` + +The above, will inform the `dashboard.js` to load everything, but not process the web page until you tell it to. +You can tell it to start processing the page, by running this javascript code: + +```js +NETDATA.start(); +``` + +Be careful not to call the `NETDATA.start()` multiple times. Each call to this function will spawn a new thread that will start refreshing the charts. + +If, after calling `NETDATA.start()` you need to update the page (or even get your javascript code synchronized with `dashboard.js`), you can call (after you loaded `dashboard.js`): + +```js +NETDATA.pause(function() { + // ok, it is paused + + // update the DOM as you wish + + // and then call this to let the charts refresh: + NETDATA.unpause(); +}); +``` + +### The default netdata server + +`dashboard.js` will attempt to auto-detect the URL of the netdata server it is loaded from, and set this server as the default netdata server for all charts. + +If you need to set any other URL as the default netdata server for all charts that do not specify a netdata server, add this before loading `dashboard.js`: + +```html +<script type="text/javascript">var netdataServer = "http://your.netdata.server:19999";</script> +``` + +--- + +# Adding charts + +To add charts, you need to add a `div` for each of them. Each of these `div` elements accept a few `data-` attributes: + +### The chart unique ID + +The unique ID of a chart is shown at the title of the chart of the default netdata dashboard. You can also find all the charts available at your netdata server with this URL: `http://your.netdata.server:19999/api/v1/charts` ([example](http://netdata.firehol.org/api/v1/charts)). + +To specify the unique id, use this: + +```html +<div data-netdata="unique.id"></div> +``` + +The above is enough for adding a chart. It most probably have the wrong visual settings though. Keep reading... + +### The duration of the chart + +You can specify the duration of the chart (how much time of data it will show) using: + +```html +<div data-netdata="unique.id" + data-after="AFTER_SECONDS" + data-before="BEFORE_SECONDS" + ></div> +``` + +`AFTER_SECONDS` and `BEFORE_SECONDS` are numbers representing a time-frame in seconds. + +The can be either: + +- **absolute** unix timestamps (in javascript terms, they are `new Date().getTime() / 1000`. Using absolute timestamps you can have a chart showing always the same time-frame. + +- **relative** number of seconds to now. To show the last 10 minutes of data, `AFTER_SECONDS` must be `-600` (relative to now) and `BEFORE_SECONDS` must be `0` (meaning: now). If you want the chart to auto-refresh the current values, you need to specify **relative** values. + +### Chart sizes + +You can set the size of the chart using this: + +```html +<div data-netdata="unique.id" + data-width="WIDTH" + data-height="HEIGHT" + ></div> +``` + +`WIDTH` and `HEIGHT` can be anything CSS accepts for width and height (e.g. percentages, pixels, etc). +Keep in mind that for certain chart libraries, `dashboard.js` may apply an aspect ratio to these. + +If you want `dashboard.js` to remember permanently (browser local storage) the dimensions of the chart (the user may resize it), you can add: `data-id="SETTINGS_ID"`, where `SETTINGS_ID` is anything that will be common for this chart across user sessions. + +### Netdata server + +Each chart can get data from a different netdata server. You can give per chart the netdata server using: + +```html +<div data-netdata="unique.id" + data-host="http://another.netdata.server:19999/" + ></div> +``` + +If you have ephemeral monitoring setup ([More info here](../../../streaming/#monitoring-ephemeral-nodes)) and have no direct access to the nodes dashboards, you can use the following: + +```html +<div data-netdata="unique.id" + data-host="http://yournetdata.server:19999/host/reported-hostname" + ></div> +``` +### Chart library + +The default chart library is `dygraph`. You set a different chart library per chart using this: + +```html +<div data-netdata="unique.id" + data-chart-library="gauge" + ></div> +``` + +Each chart library may support more chart-library specific settings. Please refer to the documentation of the chart library you are interested, in this wiki or the source code: + +- options `data-dygraph-XXX` [here](https://github.com/netdata/netdata/blob/643cfe20a8d8beba0ed31ec6afaade80853fd310/web/dashboard.js#L6251-L6361) +- options `data-easypiechart-XXX` [here](https://github.com/netdata/netdata/blob/643cfe20a8d8beba0ed31ec6afaade80853fd310/web/dashboard.js#L7954-L7966) +- options `data-gauge-XXX` [here](https://github.com/netdata/netdata/blob/643cfe20a8d8beba0ed31ec6afaade80853fd310/web/dashboard.js#L8182-L8189) +- options `data-d3pie-XXX` [here](https://github.com/netdata/netdata/blob/643cfe20a8d8beba0ed31ec6afaade80853fd310/web/dashboard.js#L7394-L7561) +- options `data-sparkline-XXX` [here](https://github.com/netdata/netdata/blob/643cfe20a8d8beba0ed31ec6afaade80853fd310/web/dashboard.js#L5940-L5985) +- options `data-peity-XXX` [here](https://github.com/netdata/netdata/blob/643cfe20a8d8beba0ed31ec6afaade80853fd310/web/dashboard.js#L5892) + + +### Data points + +For the time-frame requested, `dashboard.js` will use the chart dimensions and the settings of the chart library to find out how many data points it can show. + +For example, most line chart libraries are using 3 pixels per data point. If the chart shows 10 minutes of data (600 seconds), its update frequency is 1 second, and the chart width is 1800 pixels, then `dashboard.js` will request from the netdata server: 10 minutes of data, represented in 600 points, and the chart will be refreshed per second. If the user resizes the window so that the chart becomes 600 pixels wide, then `dashboard.js` will request the same 10 minutes of data, represented in 200 points and the chart will be refreshed once every 3 seconds. + +If you need to have a fixed number of points in the data source retrieved from the netdata server, you can set: + +```html +<div data-netdata="unique.id" + data-points="DATA_POINTS" + ></div> +``` + +Where `DATA_POINTS` is the number of points you need. + +You can also overwrite the pixels-per-point per chart using this: + +```html +<div data-netdata="unique.id" + data-pixels-per-point="PIXELS_PER_POINT" + ></div> +``` + +Where `PIXELS_PER_POINT` is the number of pixels each data point should occupy. + +### Data grouping method + +Netdata supports **average** (the default), **sum** and **max** grouping methods. The grouping method is used when the netdata server is requested to return fewer points for a time-frame, compared to the number of points available. + +You can give it per chart, using: + +```html +<div data-netdata="unique.id" + data-method="max" + ></div> +``` + +### Changing rates + +Netdata can change the rate of charts on the fly. So a charts that shows values **per second** can be turned to **per minute** (or any other, e.g. **per 10 seconds**), with this: + +```html +<div data-netdata="unique.id" + data-method="average" + data-gtime="60" + data-units="per minute" + ></div> +``` + +The above will provide the average rate per minute (60 seconds). +Use 60 for `/minute`, 3600 for `/hour`, 86400 for `/day` (provided you have that many data). + +- The `data-gtime` setting does not change the units of the chart. You have to change them yourself with `data-units`. +- This works only for `data-method="average"`. +- netdata may aggregate multiple points to satisfy the `data-points` setting. For example, you request `per minute` but the requested number of points to be returned are not enough to report every single minute. In this case netdata will sum the `per second` raw data of the database to find the `per minute` for every single minute and then **average** them to find the **average per minute rate of every X minutes**. So, it works as if the data collection frequency was per minute. + +### Selecting dimensions + +By default, `dashboard.js` will show all the dimensions of the chart. +You can select specific dimensions using this: + +```html +<div data-netdata="unique.id" + data-dimensions="dimension1,dimension2,dimension3,..." + ></div> +``` + +netdata supports coma (` , `) or pipe (` | `) separated [simple patterns](../../../libnetdata/simple_pattern/) for dimensions. By default it searches for both dimension IDs and dimension NAMEs. You can control the target of the match with: `data-append-options="match-ids"` or `data-append-options="match-names"`. Spaces in `data-dimensions=""` are matched in the dimension names and IDs. + +### Chart title + +You can overwrite the title of the chart using this: + +```html +<div data-netdata="unique.id" + data-title="my super chart" + ></div> +``` + +### Chart units + +You can overwrite the units of measurement of the dimensions of the chart, using this: + +```html +<div data-netdata="unique.id" + data-units="words/second" + ></div> +``` + +### Chart colors + +`dashboard.js` has an internal palette of colors for the dimensions of the charts. +You can prepend colors to it (so that your will be used first) using this: + +```html +<div data-netdata="unique.id" + data-colors="#AABBCC #DDEEFF ..." + ></div> +``` + +### Extracting dimension values + +`dashboard.js` can update the selected values of the chart at elements you specify. For example, let's assume we have a chart that measures the bandwidth of eth0, with 2 dimensions `in` and `out`. You can use this: + +```html +<div data-netdata="net.eth0" + data-show-value-of-in-at="eth0_in_value" + data-show-value-of-out-at="eth0_out_value" + ></div> + +My eth0 interface, is receiving <span id="eth0_in_value"></span> +and transmitting <span id="eth0_out_value"></span>. +``` + +### Hiding the legend of a chart + +On charts that by default have a legend managed by `dashboard.js` you can remove it, using this: + +```html +<div data-netdata="unique.id" + data-legend="no" + ></div> +``` + +### API options + +You can append netdata **[[REST API v1]]** data options, using this: + +```html +<div data-netdata="unique.id" + data-append-options="absolute,percentage" + ></div> +``` + +A few useful options are: + +- `absolute` to show all values are absolute (i.e. turn negative dimensions to positive) +- `percentage` to express the values as a percentage of the chart total (so, the values of the dimensions are added, and the sum of them if expressed as a percentage of the sum of all dimensions) +- `unaligned` to prevent netdata from aligning the charts (e.g. when requesting 60 seconds aggregation per point, netdata returns chart data aligned to XX:XX:00 to XX:XX:59 - similarly for hours, days, etc - the `unaligned` option disables this feature) +- `match-ids` or `match-names` is used to control what `data-dimensions=` will match. + +### Chart library performance + +`dashboard.js` measures the performance of the chart library when it renders the charts. You can specify an element ID you want this information to be visualized, using this: + +```html +<div data-netdata="unique.id" + data-dt-element-name="measurement1" + ></div> + +refreshed in <span id="measurement1"></span> milliseconds! +``` + +### Syncing charts y-range + +If you give the same `data-common-max="NAME"` to 2+ charts, then all of them will share the same max value of their y-range. If one spikes, all of them will be aligned to have the same scale. This is done for the cpu interrupts and and cpu softnet charts at the dashboard and also for the `gauge` and `easypiecharts` of the netdata home page. + +```html +<div data-netdata="chart1" + data-common-max="chart-group-1" + ></div> + +<div data-netdata="chart2" + data-common-max="chart-group-1" + ></div> +``` + +The same functionality exists for `data-common-min`. + +### Syncing chart units + +netdata dashboards support auto-scaling of units. So, `MB` can become `KB`, `GB`, etc dynamically, based on the value to be shown. + +Giving the same `NAME` with `data-common-units="NAME"`, 2+ charts can be forced to always have the same units. + +```html +<div data-netdata="chart1" + data-common-units="chart-group-1" + ></div> + +<div data-netdata="chart2" + data-common-units="chart-group-1" + ></div> +``` + +### Setting desired units + +Charts can be scaled to specific units with `data-desired-units="UNITS"`. If the dashboard can convert the units to the desired one, it will do. + +```html +<div data-netdata="chart1" + data-desired-units="GB" + ></div> +``` + diff --git a/web/gui/dashboard.html b/web/gui/dashboard.html index 4d0685b08..e0afefda0 100644 --- a/web/gui/dashboard.html +++ b/web/gui/dashboard.html @@ -56,7 +56,7 @@ This is a template for building custom dashboards. To build a dashboard you just <li>You can host your dashboard anywhere.</li> <li>You can add as many charts as you like.</li> <li>You can have charts from many different netdata servers (add <pre>data-host="http://another.netdata.server:19999/"</pre> to each chart).</li> - <li>You can use different chart libraries on the same page: <b>peity</b>, <b>sparkline</b>, <b>dygraph</b>, <b>google</b>, <b>morris</b></li> + <li>You can use different chart libraries on the same page: <b>peity</b>, <b>sparkline</b>, <b>dygraph</b>, <b>google</b></li> <li>You can customize each chart to your preferences. For each chart library most of their attributes can be given in <b>data-</b> attributes.</li> <li>Each chart can have each own duration - it is controlled with the <b>data-after</b> attribute to give that many seconds of data.</li> <li>Depending on the width of the chart and <b>data-after</b> attribute, netdata will automatically refresh the chart when it needs to be updated. For example giving 600 pixels for width for -600 seconds of data, using a chart library that needs 3 pixels per point, will yeld in a chart updated once every 3 seconds.</li> @@ -555,11 +555,8 @@ NetData is a complete Google Visualization API provider. <small>rendered in <span id="time303">X</span> ms</small> </div> - - - - - +<!-- + <hr> <h1>Morris Charts</h1> Unfortunatelly, Morris Charts are very slow. Here we force them to lower their detail to get acceptable results. @@ -644,6 +641,7 @@ So, to avoid flashing the charts, we destroy and re-create the charts on each up <small>rendered in <span id="time803">X</span> ms</small> </div> +--> <hr> <h1>d3pie Charts</h1> diff --git a/web/gui/dashboard.js b/web/gui/dashboard.js index 16fbf88d0..8a8061a55 100644 --- a/web/gui/dashboard.js +++ b/web/gui/dashboard.js @@ -1,7 +1,12 @@ // SPDX-License-Identifier: GPL-3.0-or-later + +// DO NOT EDIT: This file is automatically generated from the source files in src/ + // ---------------------------------------------------------------------------- // You can set the following variables before loading this script: +// 'use strict'; + /*global netdataNoDygraphs *//* boolean, disable dygraph charts * (default: false) */ /*global netdataNoSparklines *//* boolean, disable sparkline charts @@ -72,9441 +77,9973 @@ // ---------------------------------------------------------------------------- // global namespace -var NETDATA = window.NETDATA || {}; +const NETDATA = window.NETDATA || {}; (function(window, document, $, undefined) { - NETDATA.encodeURIComponent = function(s) { - if(typeof(s) === 'string') - return encodeURIComponent(s); - - return s; - }; - - // ------------------------------------------------------------------------ - // compatibility fixes - - // fix IE issue with console - if(!window.console) { window.console = { log: function(){} }; } - - // if string.endsWith is not defined, define it - if(typeof String.prototype.endsWith !== 'function') { - String.prototype.endsWith = function(s) { - if(s.length > this.length) return false; - return this.slice(-s.length) === s; - }; +// *** src/dashboard.js/utils.js + +NETDATA.name2id = function (s) { + return s + .replace(/ /g, '_') + .replace(/:/g, '_') + .replace(/\(/g, '_') + .replace(/\)/g, '_') + .replace(/\./g, '_') + .replace(/\//g, '_'); +}; + +NETDATA.encodeURIComponent = function (s) { + if (typeof(s) === 'string') { + return encodeURIComponent(s); } - // if string.startsWith is not defined, define it - if(typeof String.prototype.startsWith !== 'function') { - String.prototype.startsWith = function(s) { - if(s.length > this.length) return false; - return this.slice(s.length) === s; - }; - } - - NETDATA.name2id = function(s) { - return s - .replace(/ /g, '_') - .replace(/\(/g, '_') - .replace(/\)/g, '_') - .replace(/\./g, '_') - .replace(/\//g, '_'); - }; - - // ---------------------------------------------------------------------------------------------------------------- - // XSS checks - - NETDATA.xss = { - enabled: (typeof netdataCheckXSS === 'undefined')?false:netdataCheckXSS, - enabled_for_data: (typeof netdataCheckXSS === 'undefined')?false:netdataCheckXSS, - - string: function (s) { - return s.toString() - .replace(/</g, '<') - .replace(/>/g, '>') - .replace(/"/g, '"') - .replace(/'/g, '''); - }, - - object: function(name, obj, ignore_regex) { - if(typeof ignore_regex !== 'undefined' && ignore_regex.test(name) === true) { - // console.log('XSS: ignoring "' + name + '"'); - return obj; - } - - switch (typeof(obj)) { - case 'string': - var ret = this.string(obj); - if(ret !== obj) console.log('XSS protection changed string ' + name + ' from "' + obj + '" to "' + ret + '"'); - return ret; - - case 'object': - if(obj === null) return obj; + return s; +}; - if(Array.isArray(obj) === true) { - // console.log('checking array "' + name + '"'); +/// A heuristic for detecting slow devices. +let isSlowDeviceResult = undefined; +const isSlowDevice = function () { + if (!isSlowDeviceResult) { + return isSlowDeviceResult; + } - var len = obj.length; - while(len--) - obj[len] = this.object(name + '[' + len + ']', obj[len], ignore_regex); - } - else { - // console.log('checking object "' + name + '"'); + try { + let ua = navigator.userAgent.toLowerCase(); - for(var i in obj) { - if(obj.hasOwnProperty(i) === false) continue; - if(this.string(i) !== i) { - console.log('XSS protection removed invalid object member "' + name + '.' + i + '"'); - delete obj[i]; - } - else - obj[i] = this.object(name + '.' + i, obj[i], ignore_regex); - } - } - return obj; + let iOS = /ipad|iphone|ipod/.test(ua) && !window.MSStream; + let android = /android/.test(ua) && !window.MSStream; + isSlowDeviceResult = (iOS || android); + } catch (e) { + isSlowDeviceResult = false; + } - default: - return obj; - } - }, + return isSlowDeviceResult; +}; - checkOptional: function(name, obj, ignore_regex) { - if(this.enabled === true) { - //console.log('XSS: checking optional "' + name + '"...'); - return this.object(name, obj, ignore_regex); - } - return obj; - }, +NETDATA.guid = function () { + function s4() { + return Math.floor((1 + Math.random()) * 0x10000) + .toString(16) + .substring(1); + } - checkAlways: function(name, obj, ignore_regex) { - //console.log('XSS: checking always "' + name + '"...'); - return this.object(name, obj, ignore_regex); - }, + return s4() + s4() + '-' + s4() + '-' + s4() + '-' + s4() + '-' + s4() + s4() + s4(); +}; - checkData: function(name, obj, ignore_regex) { - if(this.enabled_for_data === true) { - //console.log('XSS: checking data "' + name + '"...'); - return this.object(name, obj, ignore_regex); +NETDATA.zeropad = function (x) { + if (x > -10 && x < 10) { + return '0' + x.toString(); + } else { + return x.toString(); + } +}; + +NETDATA.seconds4human = function (seconds, options) { + let defaultOptions = { + now: 'now', + space: ' ', + negative_suffix: 'ago', + day: 'day', + days: 'days', + hour: 'hour', + hours: 'hours', + minute: 'min', + minutes: 'mins', + second: 'sec', + seconds: 'secs', + and: 'and' + }; + + if (typeof options !== 'object') { + options = defaultOptions; + } else { + for (const x in defaultOptions) { + if (typeof options[x] !== 'string') { + options[x] = defaultOptions[x]; } - return obj; } - }; + } - // ---------------------------------------------------------------------------------------------------------------- - // Detect the netdata server + if (typeof seconds === 'string') { + seconds = parseInt(seconds, 10); + } - // http://stackoverflow.com/questions/984510/what-is-my-script-src-url - // http://stackoverflow.com/questions/6941533/get-protocol-domain-and-port-from-url - NETDATA._scriptSource = function() { - var script = null; + if (seconds === 0) { + return options.now; + } - if(typeof document.currentScript !== 'undefined') { - script = document.currentScript; - } - else { - var all_scripts = document.getElementsByTagName('script'); - script = all_scripts[all_scripts.length - 1]; + let suffix = ''; + if (seconds < 0) { + seconds = -seconds; + if (options.negative_suffix !== '') { + suffix = options.space + options.negative_suffix; } + } - if (typeof script.getAttribute.length !== 'undefined') - script = script.src; - else - script = script.getAttribute('src', -1); + let days = Math.floor(seconds / 86400); + seconds -= (days * 86400); - return script; - }; + let hours = Math.floor(seconds / 3600); + seconds -= (hours * 3600); - if(typeof netdataServer !== 'undefined') - NETDATA.serverDefault = netdataServer; - else { - var s = NETDATA._scriptSource(); - if(s) NETDATA.serverDefault = s.replace(/\/dashboard.js(\?.*)?$/g, ""); - else { - console.log('WARNING: Cannot detect the URL of the netdata server.'); - NETDATA.serverDefault = null; - } - } + let minutes = Math.floor(seconds / 60); + seconds -= (minutes * 60); - if(NETDATA.serverDefault === null) - NETDATA.serverDefault = ''; - else if(NETDATA.serverDefault.slice(-1) !== '/') - NETDATA.serverDefault += '/'; + let strings = []; - if(typeof netdataServerStatic !== 'undefined' && netdataServerStatic !== null && netdataServerStatic !== '') { - NETDATA.serverStatic = netdataServerStatic; - if(NETDATA.serverStatic.slice(-1) !== '/') - NETDATA.serverStatic += '/'; + if (days > 1) { + strings.push(days.toString() + options.space + options.days); + } else if (days === 1) { + strings.push(days.toString() + options.space + options.day); } - else { - NETDATA.serverStatic = NETDATA.serverDefault; - } - - - // default URLs for all the external files we need - // make them RELATIVE so that the whole thing can also be - // installed under a web server - NETDATA.jQuery = NETDATA.serverStatic + 'lib/jquery-2.2.4.min.js'; - NETDATA.peity_js = NETDATA.serverStatic + 'lib/jquery.peity-3.2.0.min.js'; - NETDATA.sparkline_js = NETDATA.serverStatic + 'lib/jquery.sparkline-2.1.2.min.js'; - NETDATA.easypiechart_js = NETDATA.serverStatic + 'lib/jquery.easypiechart-97b5824.min.js'; - NETDATA.gauge_js = NETDATA.serverStatic + 'lib/gauge-1.3.2.min.js'; - NETDATA.dygraph_js = NETDATA.serverStatic + 'lib/dygraph-c91c859.min.js'; - NETDATA.dygraph_smooth_js = NETDATA.serverStatic + 'lib/dygraph-smooth-plotter-c91c859.js'; - NETDATA.raphael_js = NETDATA.serverStatic + 'lib/raphael-2.2.4-min.js'; - NETDATA.c3_js = NETDATA.serverStatic + 'lib/c3-0.4.18.min.js'; - NETDATA.c3_css = NETDATA.serverStatic + 'css/c3-0.4.18.min.css'; - NETDATA.d3pie_js = NETDATA.serverStatic + 'lib/d3pie-0.2.1-netdata-3.js'; - NETDATA.d3_js = NETDATA.serverStatic + 'lib/d3-4.12.2.min.js'; - NETDATA.morris_js = NETDATA.serverStatic + 'lib/morris-0.5.1.min.js'; - NETDATA.morris_css = NETDATA.serverStatic + 'css/morris-0.5.1.css'; - NETDATA.google_js = 'https://www.google.com/jsapi'; - - NETDATA.themes = { - white: { - bootstrap_css: NETDATA.serverStatic + 'css/bootstrap-3.3.7.css', - dashboard_css: NETDATA.serverStatic + 'dashboard.css?v20180210-1', - background: '#FFFFFF', - foreground: '#000000', - grid: '#F0F0F0', - axis: '#F0F0F0', - highlight: '#F5F5F5', - colors: [ '#3366CC', '#DC3912', '#109618', '#FF9900', '#990099', '#DD4477', - '#3B3EAC', '#66AA00', '#0099C6', '#B82E2E', '#AAAA11', '#5574A6', - '#994499', '#22AA99', '#6633CC', '#E67300', '#316395', '#8B0707', - '#329262', '#3B3EAC' ], - easypiechart_track: '#f0f0f0', - easypiechart_scale: '#dfe0e0', - gauge_pointer: '#C0C0C0', - gauge_stroke: '#F0F0F0', - gauge_gradient: false, - d3pie: { - title: '#333333', - subtitle: '#666666', - footer: '#888888', - other: '#aaaaaa', - mainlabel: '#333333', - percentage: '#dddddd', - value: '#aaaa22', - tooltip_bg: '#000000', - tooltip_fg: '#efefef', - segment_stroke: "#ffffff", - gradient_color: '#000000' - } - }, - slate: { - bootstrap_css: NETDATA.serverStatic + 'css/bootstrap-slate-flat-3.3.7.css?v20161229-1', - dashboard_css: NETDATA.serverStatic + 'dashboard.slate.css?v20180210-1', - background: '#272b30', - foreground: '#C8C8C8', - grid: '#283236', - axis: '#283236', - highlight: '#383838', -/* colors: [ '#55bb33', '#ff2222', '#0099C6', '#faa11b', '#adbce0', '#DDDD00', - '#4178ba', '#f58122', '#a5cc39', '#f58667', '#f5ef89', '#cf93c0', - '#a5d18a', '#b8539d', '#3954a3', '#c8a9cf', '#c7de8a', '#fad20a', - '#a6a479', '#a66da8' ], -*/ - colors: [ '#66AA00', '#FE3912', '#3366CC', '#D66300', '#0099C6', '#DDDD00', - '#5054e6', '#EE9911', '#BB44CC', '#e45757', '#ef0aef', '#CC7700', - '#22AA99', '#109618', '#905bfd', '#f54882', '#4381bf', '#ff3737', - '#329262', '#3B3EFF' ], - easypiechart_track: '#373b40', - easypiechart_scale: '#373b40', - gauge_pointer: '#474b50', - gauge_stroke: '#373b40', - gauge_gradient: false, - d3pie: { - title: '#C8C8C8', - subtitle: '#283236', - footer: '#283236', - other: '#283236', - mainlabel: '#C8C8C8', - percentage: '#dddddd', - value: '#cccc44', - tooltip_bg: '#272b30', - tooltip_fg: '#C8C8C8', - segment_stroke: "#283236", - gradient_color: '#000000' - } - } - }; - - if(typeof netdataTheme !== 'undefined' && typeof NETDATA.themes[netdataTheme] !== 'undefined') - NETDATA.themes.current = NETDATA.themes[netdataTheme]; - else - NETDATA.themes.current = NETDATA.themes.white; - - NETDATA.colors = NETDATA.themes.current.colors; - - // these are the colors Google Charts are using - // we have them here to attempt emulate their look and feel on the other chart libraries - // http://there4.io/2012/05/02/google-chart-color-list/ - //NETDATA.colors = [ '#3366CC', '#DC3912', '#FF9900', '#109618', '#990099', '#3B3EAC', '#0099C6', - // '#DD4477', '#66AA00', '#B82E2E', '#316395', '#994499', '#22AA99', '#AAAA11', - // '#6633CC', '#E67300', '#8B0707', '#329262', '#5574A6', '#3B3EAC' ]; - - // an alternative set - // http://www.mulinblog.com/a-color-palette-optimized-for-data-visualization/ - // (blue) (red) (orange) (green) (pink) (brown) (purple) (yellow) (gray) - //NETDATA.colors = [ '#5DA5DA', '#F15854', '#FAA43A', '#60BD68', '#F17CB0', '#B2912F', '#B276B2', '#DECF3F', '#4D4D4D' ]; - - NETDATA.icons = { - left: '<i class="fas fa-backward"></i>', - reset: '<i class="fas fa-play"></i>', - right: '<i class="fas fa-forward"></i>', - zoomIn: '<i class="fas fa-plus"></i>', - zoomOut: '<i class="fas fa-minus"></i>', - resize: '<i class="fas fa-sort"></i>', - lineChart: '<i class="fas fa-chart-line"></i>', - areaChart: '<i class="fas fa-chart-area"></i>', - noChart: '<i class="fas fa-chart-area"></i>', - loading: '<i class="fas fa-sync-alt"></i>', - noData: '<i class="fas fa-exclamation-triangle"></i>' - }; - if(typeof netdataIcons === 'object') { - for(var icon in NETDATA.icons) { - if(NETDATA.icons.hasOwnProperty(icon) && typeof(netdataIcons[icon]) === 'string') - NETDATA.icons[icon] = netdataIcons[icon]; - } + if (hours > 1) { + strings.push(hours.toString() + options.space + options.hours); + } else if (hours === 1) { + strings.push(hours.toString() + options.space + options.hour); } - if(typeof netdataSnapshotData === 'undefined') - netdataSnapshotData = null; - - if(typeof netdataShowHelp === 'undefined') - netdataShowHelp = true; - - if(typeof netdataShowAlarms === 'undefined') - netdataShowAlarms = false; - - if(typeof netdataRegistryAfterMs !== 'number' || netdataRegistryAfterMs < 0) - netdataRegistryAfterMs = 1500; + if (minutes > 1) { + strings.push(minutes.toString() + options.space + options.minutes); + } else if (minutes === 1) { + strings.push(minutes.toString() + options.space + options.minute); + } - if(typeof netdataRegistry === 'undefined') { - // backward compatibility - netdataRegistry = (typeof netdataNoRegistry !== 'undefined' && netdataNoRegistry === false); + if (seconds > 1) { + strings.push(Math.floor(seconds).toString() + options.space + options.seconds); + } else if (seconds === 1) { + strings.push(Math.floor(seconds).toString() + options.space + options.second); } - if(netdataRegistry === false && typeof netdataRegistryCallback === 'function') - netdataRegistry = true; + if (strings.length === 1) { + return strings.pop() + suffix; + } - // ---------------------------------------------------------------------------------------------------------------- - // detect if this is probably a slow device + let last = strings.pop(); + return strings.join(", ") + " " + options.and + " " + last + suffix; +}; - var isSlowDeviceResult = undefined; - var isSlowDevice = function() { - if(isSlowDeviceResult !== undefined) - return isSlowDeviceResult; +// ---------------------------------------------------------------------------------------------------------------- +// element data attributes - try { - var ua = navigator.userAgent.toLowerCase(); +NETDATA.dataAttribute = function (element, attribute, def) { + let key = 'data-' + attribute.toString(); + if (element.hasAttribute(key)) { + let data = element.getAttribute(key); - var iOS = /ipad|iphone|ipod/.test(ua) && !window.MSStream; - var android = /android/.test(ua) && !window.MSStream; - isSlowDeviceResult = (iOS === true || android === true); + if (data === 'true') { + return true; } - catch (e) { - isSlowDeviceResult = false; + if (data === 'false') { + return false; + } + if (data === 'null') { + return null; } - return isSlowDeviceResult; - }; - - // ---------------------------------------------------------------------------------------------------------------- - // the defaults for all charts - - // if the user does not specify any of these, the following will be used - - NETDATA.chartDefaults = { - width: '100%', // the chart width - can be null - height: '100%', // the chart height - can be null - min_width: null, // the chart minimum width - can be null - library: 'dygraph', // the graphing library to use - method: 'average', // the grouping method - before: 0, // panning - after: -600, // panning - pixels_per_point: 1, // the detail of the chart - fill_luminance: 0.8 // luminance of colors in solid areas - }; - - // ---------------------------------------------------------------------------------------------------------------- - // global options - - NETDATA.options = { - pauseCallback: null, // a callback when we are really paused - - pause: false, // when enabled we don't auto-refresh the charts - - targets: [], // an array of all the state objects that are - // currently active (independently of their - // viewport visibility) - - updated_dom: true, // when true, the DOM has been updated with - // new elements we have to check. - - auto_refresher_fast_weight: 0, // this is the current time in ms, spent - // rendering charts continuously. - // used with .current.fast_render_timeframe + // Only convert to a number if it doesn't change the string + if (data === +data + '') { + return +data; + } - page_is_visible: true, // when true, this page is visible + if (/^(?:\{[\w\W]*\}|\[[\w\W]*\])$/.test(data)) { + return JSON.parse(data); + } - auto_refresher_stop_until: 0, // timestamp in ms - used internally, to stop the - // auto-refresher for some time (when a chart is - // performing pan or zoom, we need to stop refreshing - // all other charts, to have the maximum speed for - // rendering the chart that is panned or zoomed). - // Used with .current.global_pan_sync_time + return data; + } else { + return def; + } +}; - on_scroll_refresher_stop_until: 0, // timestamp in ms - used to stop evaluating - // charts for some time, after a page scroll +NETDATA.dataAttributeBoolean = function (element, attribute, def) { + let value = NETDATA.dataAttribute(element, attribute, def); - last_page_resize: Date.now(), // the timestamp of the last resize request + if (value === true || value === false) // gmosx: Love this :) + { + return value; + } - last_page_scroll: 0, // the timestamp the last time the page was scrolled + if (typeof(value) === 'string') { + if (value === 'yes' || value === 'on') { + return true; + } - browser_timezone: 'unknown', // timezone detected by javascript - server_timezone: 'unknown', // timezone reported by the server + if (value === '' || value === 'no' || value === 'off' || value === 'null') { + return false; + } - force_data_points: 0, // force the number of points to be returned for charts - fake_chart_rendering: false, // when set to true, the dashboard will download data but will not render the charts + return def; + } - passive_events: null, // true if the browser supports passive events + if (typeof(value) === 'number') { + return value !== 0; + } - // the current profile - // we may have many... - current: { - units: 'auto', // can be 'auto' or 'original' - temperature: 'celsius', // can be 'celsius' or 'fahrenheit' - seconds_as_time: true, // show seconds as DDd:HH:MM:SS ? - timezone: 'default', // the timezone to use, or 'default' - user_set_server_timezone: 'default', // as set by the user on the dashboard + return def; +}; - legend_toolbox: true, // show the legend toolbox on charts - resize_charts: true, // show the resize handler on charts +// ---------------------------------------------------------------------------------------------------------------- +// fast numbers formatting - pixels_per_point: isSlowDevice()?5:1, // the minimum pixels per point for all charts - // increase this to speed javascript up - // each chart library has its own limit too - // the max of this and the chart library is used - // the final is calculated every time, so a change - // here will have immediate effect on the next chart - // update +NETDATA.fastNumberFormat = { + formattersFixed: [], + formattersZeroBased: [], - idle_between_charts: 100, // ms - how much time to wait between chart updates + // this is the fastest and the preferred + getIntlNumberFormat: function (min, max) { + let key = max; + if (min === max) { + if (typeof this.formattersFixed[key] === 'undefined') { + this.formattersFixed[key] = new Intl.NumberFormat(undefined, { + // style: 'decimal', + // minimumIntegerDigits: 1, + // minimumSignificantDigits: 1, + // maximumSignificantDigits: 1, + useGrouping: true, + minimumFractionDigits: min, + maximumFractionDigits: max + }); + } - fast_render_timeframe: 200, // ms - render continuously until this time of continuous - // rendering has been reached - // this setting is used to make it render e.g. 10 - // charts at once, sleep idle_between_charts time - // and continue for another 10 charts. + return this.formattersFixed[key]; + } else if (min === 0) { + if (typeof this.formattersZeroBased[key] === 'undefined') { + this.formattersZeroBased[key] = new Intl.NumberFormat(undefined, { + // style: 'decimal', + // minimumIntegerDigits: 1, + // minimumSignificantDigits: 1, + // maximumSignificantDigits: 1, + useGrouping: true, + minimumFractionDigits: min, + maximumFractionDigits: max + }); + } - idle_between_loops: 500, // ms - if all charts have been updated, wait this - // time before starting again. + return this.formattersZeroBased[key]; + } else { + // this is never used + // it is added just for completeness + return new Intl.NumberFormat(undefined, { + // style: 'decimal', + // minimumIntegerDigits: 1, + // minimumSignificantDigits: 1, + // maximumSignificantDigits: 1, + useGrouping: true, + minimumFractionDigits: min, + maximumFractionDigits: max + }); + } + }, - idle_parallel_loops: 100, // ms - the time between parallel refresher updates + // this respects locale + getLocaleString: function (min, max) { + let key = max; + if (min === max) { + if (typeof this.formattersFixed[key] === 'undefined') { + this.formattersFixed[key] = { + format: function (value) { + return value.toLocaleString(undefined, { + // style: 'decimal', + // minimumIntegerDigits: 1, + // minimumSignificantDigits: 1, + // maximumSignificantDigits: 1, + useGrouping: true, + minimumFractionDigits: min, + maximumFractionDigits: max + }); + } + }; + } - idle_lost_focus: 500, // ms - when the window does not have focus, check - // if focus has been regained, every this time + return this.formattersFixed[key]; + } else if (min === 0) { + if (typeof this.formattersZeroBased[key] === 'undefined') { + this.formattersZeroBased[key] = { + format: function (value) { + return value.toLocaleString(undefined, { + // style: 'decimal', + // minimumIntegerDigits: 1, + // minimumSignificantDigits: 1, + // maximumSignificantDigits: 1, + useGrouping: true, + minimumFractionDigits: min, + maximumFractionDigits: max + }); + } + }; + } - global_pan_sync_time: 300, // ms - when you pan or zoom a chart, the background - // auto-refreshing of charts is paused for this amount - // of time + return this.formattersZeroBased[key]; + } else { + return { + format: function (value) { + return value.toLocaleString(undefined, { + // style: 'decimal', + // minimumIntegerDigits: 1, + // minimumSignificantDigits: 1, + // maximumSignificantDigits: 1, + useGrouping: true, + minimumFractionDigits: min, + maximumFractionDigits: max + }); + } + }; + } + }, - sync_selection_delay: 400, // ms - when you pan or zoom a chart, wait this amount - // of time before setting up synchronized selections - // on hover. + // the fallback + getFixed: function (min, max) { + let key = max; + if (min === max) { + if (typeof this.formattersFixed[key] === 'undefined') { + this.formattersFixed[key] = { + format: function (value) { + if (value === 0) { + return "0"; + } + return value.toFixed(max); + } + }; + } - sync_selection: true, // enable or disable selection sync + return this.formattersFixed[key]; + } else if (min === 0) { + if (typeof this.formattersZeroBased[key] === 'undefined') { + this.formattersZeroBased[key] = { + format: function (value) { + if (value === 0) { + return "0"; + } + return value.toFixed(max); + } + }; + } - pan_and_zoom_delay: 50, // when panning or zooming, how ofter to update the chart + return this.formattersZeroBased[key]; + } else { + return { + format: function (value) { + if (value === 0) { + return "0"; + } + return value.toFixed(max); + } + }; + } + }, - sync_pan_and_zoom: true, // enable or disable pan and zoom sync + testIntlNumberFormat: function () { + let value = 1.12345; + let e1 = "1.12", e2 = "1,12"; + let s = ""; - pan_and_zoom_data_padding: true, // fetch more data for the master chart when panning or zooming + try { + let x = new Intl.NumberFormat(undefined, { + useGrouping: true, + minimumFractionDigits: 2, + maximumFractionDigits: 2 + }); - update_only_visible: true, // enable or disable visibility management / used for printing + s = x.format(value); + } catch (e) { + s = ""; + } - parallel_refresher: (isSlowDevice() === false), // enable parallel refresh of charts + // console.log('NumberFormat: ', s); + return (s === e1 || s === e2); + }, - concurrent_refreshes: true, // when parallel_refresher is enabled, sync also the charts + testLocaleString: function () { + let value = 1.12345; + let e1 = "1.12", e2 = "1,12"; + let s = ""; - destroy_on_hide: (isSlowDevice() === true), // destroy charts when they are not visible + try { + s = value.toLocaleString(undefined, { + useGrouping: true, + minimumFractionDigits: 2, + maximumFractionDigits: 2 + }); + } catch (e) { + s = ""; + } + + // console.log('localeString: ', s); + return (s === e1 || s === e2); + }, + + // on first run we decide which formatter to use + get: function (min, max) { + if (this.testIntlNumberFormat()) { + // console.log('numberformat'); + this.get = this.getIntlNumberFormat; + } else if (this.testLocaleString()) { + // console.log('localestring'); + this.get = this.getLocaleString; + } else { + // console.log('fixed'); + this.get = this.getFixed; + } + return this.get(min, max); + } +}; - show_help: netdataShowHelp, // when enabled the charts will show some help - show_help_delay_show_ms: 500, - show_help_delay_hide_ms: 0, +// ---------------------------------------------------------------------------------------------------------------- +// Detect the netdata server - eliminate_zero_dimensions: true, // do not show dimensions with just zeros +// http://stackoverflow.com/questions/984510/what-is-my-script-src-url +// http://stackoverflow.com/questions/6941533/get-protocol-domain-and-port-from-url +NETDATA._scriptSource = function () { + let script = null; - stop_updates_when_focus_is_lost: true, // boolean - shall we stop auto-refreshes when document does not have user focus - stop_updates_while_resizing: 1000, // ms - time to stop auto-refreshes while resizing the charts + if (typeof document.currentScript !== 'undefined') { + script = document.currentScript; + } else { + const all_scripts = document.getElementsByTagName('script'); + script = all_scripts[all_scripts.length - 1]; + } - double_click_speed: 500, // ms - time between clicks / taps to detect double click/tap + if (typeof script.getAttribute.length !== 'undefined') { + script = script.src; + } else { + script = script.getAttribute('src', -1); + } - smooth_plot: (isSlowDevice() === false), // enable smooth plot, where possible + return script; +}; - color_fill_opacity_line: 1.0, - color_fill_opacity_area: 0.2, - color_fill_opacity_stacked: 0.8, +// *** src/dashboard.js/server-detection.js - pan_and_zoom_factor: 0.25, // the increment when panning and zooming with the toolbox - pan_and_zoom_factor_multiplier_control: 2.0, - pan_and_zoom_factor_multiplier_shift: 3.0, - pan_and_zoom_factor_multiplier_alt: 4.0, +if (typeof netdataServer !== 'undefined') { + NETDATA.serverDefault = netdataServer; +} else { + let s = NETDATA._scriptSource(); + if (s) { + NETDATA.serverDefault = s.replace(/\/dashboard.js(\?.*)?$/g, ""); + } else { + console.log('WARNING: Cannot detect the URL of the netdata server.'); + NETDATA.serverDefault = null; + } +} + +if (NETDATA.serverDefault === null) { + NETDATA.serverDefault = ''; +} else if (NETDATA.serverDefault.slice(-1) !== '/') { + NETDATA.serverDefault += '/'; +} + +if (typeof netdataServerStatic !== 'undefined' && netdataServerStatic !== null && netdataServerStatic !== '') { + NETDATA.serverStatic = netdataServerStatic; + if (NETDATA.serverStatic.slice(-1) !== '/') { + NETDATA.serverStatic += '/'; + } +} else { + NETDATA.serverStatic = NETDATA.serverDefault; +} + +// *** src/dashboard.js/dependencies.js + +// default URLs for all the external files we need +// make them RELATIVE so that the whole thing can also be +// installed under a web server +NETDATA.jQuery = NETDATA.serverStatic + 'lib/jquery-2.2.4.min.js'; +NETDATA.peity_js = NETDATA.serverStatic + 'lib/jquery.peity-3.2.0.min.js'; +NETDATA.sparkline_js = NETDATA.serverStatic + 'lib/jquery.sparkline-2.1.2.min.js'; +NETDATA.easypiechart_js = NETDATA.serverStatic + 'lib/jquery.easypiechart-97b5824.min.js'; +NETDATA.gauge_js = NETDATA.serverStatic + 'lib/gauge-1.3.2.min.js'; +NETDATA.dygraph_js = NETDATA.serverStatic + 'lib/dygraph-c91c859.min.js'; +NETDATA.dygraph_smooth_js = NETDATA.serverStatic + 'lib/dygraph-smooth-plotter-c91c859.js'; +// NETDATA.raphael_js = NETDATA.serverStatic + 'lib/raphael-2.2.4-min.js'; +// NETDATA.c3_js = NETDATA.serverStatic + 'lib/c3-0.4.18.min.js'; +// NETDATA.c3_css = NETDATA.serverStatic + 'css/c3-0.4.18.min.css'; +NETDATA.d3pie_js = NETDATA.serverStatic + 'lib/d3pie-0.2.1-netdata-3.js'; +NETDATA.d3_js = NETDATA.serverStatic + 'lib/d3-4.12.2.min.js'; +// NETDATA.morris_js = NETDATA.serverStatic + 'lib/morris-0.5.1.min.js'; +// NETDATA.morris_css = NETDATA.serverStatic + 'css/morris-0.5.1.css'; +NETDATA.google_js = 'https://www.google.com/jsapi'; +// Error Handling + +NETDATA.errorCodes = { + 100: {message: "Cannot load chart library", alert: true}, + 101: {message: "Cannot load jQuery", alert: true}, + 402: {message: "Chart library not found", alert: false}, + 403: {message: "Chart library not enabled/is failed", alert: false}, + 404: {message: "Chart not found", alert: false}, + 405: {message: "Cannot download charts index from server", alert: true}, + 406: {message: "Invalid charts index downloaded from server", alert: true}, + 407: {message: "Cannot HELLO netdata server", alert: false}, + 408: {message: "Netdata servers sent invalid response to HELLO", alert: false}, + 409: {message: "Cannot ACCESS netdata registry", alert: false}, + 410: {message: "Netdata registry ACCESS failed", alert: false}, + 411: {message: "Netdata registry server send invalid response to DELETE ", alert: false}, + 412: {message: "Netdata registry DELETE failed", alert: false}, + 413: {message: "Netdata registry server send invalid response to SWITCH ", alert: false}, + 414: {message: "Netdata registry SWITCH failed", alert: false}, + 415: {message: "Netdata alarms download failed", alert: false}, + 416: {message: "Netdata alarms log download failed", alert: false}, + 417: {message: "Netdata registry server send invalid response to SEARCH ", alert: false}, + 418: {message: "Netdata registry SEARCH failed", alert: false} +}; + +NETDATA.errorLast = { + code: 0, + message: "", + datetime: 0 +}; + +NETDATA.error = function (code, msg) { + NETDATA.errorLast.code = code; + NETDATA.errorLast.message = msg; + NETDATA.errorLast.datetime = Date.now(); + + console.log("ERROR " + code + ": " + NETDATA.errorCodes[code].message + ": " + msg); + + let ret = true; + if (typeof netdataErrorCallback === 'function') { + ret = netdataErrorCallback('system', code, msg); + } - abort_ajax_on_scroll: false, // kill pending ajax page scroll - async_on_scroll: false, // sync/async onscroll handler - onscroll_worker_duration_threshold: 30, // time in ms, for async scroll handler + if (ret && NETDATA.errorCodes[code].alert) { + alert("ERROR " + code + ": " + NETDATA.errorCodes[code].message + ": " + msg); + } +}; - retries_on_data_failures: 3, // how many retries to make if we can't fetch chart data from the server +NETDATA.errorReset = function () { + NETDATA.errorLast.code = 0; + NETDATA.errorLast.message = "You are doing fine!"; + NETDATA.errorLast.datetime = 0; +}; +// *** src/dashboard.js/compatibility.js - setOptionCallback: function() { } - }, +// Compatibility fixes. - debug: { - show_boxes: false, - main_loop: false, - focus: false, - visibility: false, - chart_data_url: false, - chart_errors: false, // remember to set it to false before merging - chart_timing: false, - chart_calls: false, - libraries: false, - dygraph: false, - globalSelectionSync:false, - globalPanAndZoom: false +// fix IE issue with console +if (!window.console) { + window.console = { + log: function () { } }; +} - NETDATA.statistics = { - refreshes_total: 0, - refreshes_active: 0, - refreshes_active_max: 0 +// if string.endsWith is not defined, define it +if (typeof String.prototype.endsWith !== 'function') { + String.prototype.endsWith = function (s) { + if (s.length > this.length) { + return false; + } + return this.slice(-s.length) === s; }; +} +// if string.startsWith is not defined, define it +if (typeof String.prototype.startsWith !== 'function') { + String.prototype.startsWith = function (s) { + if (s.length > this.length) { + return false; + } + return this.slice(s.length) === s; + }; +} +// ---------------------------------------------------------------------------------------------------------------- +// XSS checks - // ---------------------------------------------------------------------------------------------------------------- - - NETDATA.timeout = { - // by default, these are just wrappers to setTimeout() / clearTimeout() - - step: function(callback) { - return window.setTimeout(callback, 1000 / 60); - }, - - set: function(callback, delay) { - return window.setTimeout(callback, delay); - }, - - clear: function(id) { - return window.clearTimeout(id); - }, - - init: function() { - var custom = true; +NETDATA.xss = { + enabled: (typeof netdataCheckXSS === 'undefined') ? false : netdataCheckXSS, + enabled_for_data: (typeof netdataCheckXSS === 'undefined') ? false : netdataCheckXSS, - if(window.requestAnimationFrame) { - this.step = function(callback) { - return window.requestAnimationFrame(callback); - }; + string: function (s) { + return s.toString() + .replace(/</g, '<') + .replace(/>/g, '>') + .replace(/"/g, '"') + .replace(/'/g, '''); + }, - this.clear = function(handle) { - return window.cancelAnimationFrame(handle.value); - }; - } - else if(window.webkitRequestAnimationFrame) { - this.step = function(callback) { - return window.webkitRequestAnimationFrame(callback); - }; + object: function (name, obj, ignore_regex) { + if (typeof ignore_regex !== 'undefined' && ignore_regex.test(name)) { + // console.log('XSS: ignoring "' + name + '"'); + return obj; + } - if(window.webkitCancelAnimationFrame) { - this.clear = function (handle) { - return window.webkitCancelAnimationFrame(handle.value); - }; + switch (typeof(obj)) { + case 'string': + const ret = this.string(obj); + if (ret !== obj) { + console.log('XSS protection changed string ' + name + ' from "' + obj + '" to "' + ret + '"'); } - else if(window.webkitCancelRequestAnimationFrame) { - this.clear = function (handle) { - return window.webkitCancelRequestAnimationFrame(handle.value); - }; - } - } - else if(window.mozRequestAnimationFrame) { - this.step = function(callback) { - return window.mozRequestAnimationFrame(callback); - }; - - this.clear = function(handle) { - return window.mozCancelRequestAnimationFrame(handle.value); - }; - } - else if(window.oRequestAnimationFrame) { - this.step = function(callback) { - return window.oRequestAnimationFrame(callback); - }; + return ret; - this.clear = function(handle) { - return window.oCancelRequestAnimationFrame(handle.value); - }; - } - else if(window.msRequestAnimationFrame) { - this.step = function(callback) { - return window.msRequestAnimationFrame(callback); - }; - - this.clear = function(handle) { - return window.msCancelRequestAnimationFrame(handle.value); - }; - } - else - custom = false; - - - if(custom === true) { - // we have installed custom .step() / .clear() functions - // overwrite the .set() too - - this.set = function(callback, delay) { - var that = this; + case 'object': + if (obj === null) { + return obj; + } - var start = Date.now(), - handle = new Object(); + if (Array.isArray(obj)) { + // console.log('checking array "' + name + '"'); - function loop() { - var current = Date.now(), - delta = current - start; + let len = obj.length; + while (len--) { + obj[len] = this.object(name + '[' + len + ']', obj[len], ignore_regex); + } + } else { + // console.log('checking object "' + name + '"'); - if(delta >= delay) { - callback.call(); + for (const i in obj) { + if (obj.hasOwnProperty(i) === false) { + continue; } - else { - handle.value = that.step(loop); + if (this.string(i) !== i) { + console.log('XSS protection removed invalid object member "' + name + '.' + i + '"'); + delete obj[i]; + } else { + obj[i] = this.object(name + '.' + i, obj[i], ignore_regex); } } + } + return obj; - handle.value = that.step(loop); - return handle; - }; - } + default: + return obj; } - }; + }, - NETDATA.timeout.init(); - - - // ---------------------------------------------------------------------------------------------------------------- - // local storage options - - NETDATA.localStorage = { - default: {}, - current: {}, - callback: {} // only used for resetting back to defaults - }; + checkOptional: function (name, obj, ignore_regex) { + if (this.enabled) { + //console.log('XSS: checking optional "' + name + '"...'); + return this.object(name, obj, ignore_regex); + } + return obj; + }, - NETDATA.localStorageTested = -1; - NETDATA.localStorageTest = function() { - if(NETDATA.localStorageTested !== -1) - return NETDATA.localStorageTested; + checkAlways: function (name, obj, ignore_regex) { + //console.log('XSS: checking always "' + name + '"...'); + return this.object(name, obj, ignore_regex); + }, - if(typeof Storage !== "undefined" && typeof localStorage === 'object') { - var test = 'test'; - try { - localStorage.setItem(test, test); - localStorage.removeItem(test); - NETDATA.localStorageTested = true; - } - catch (e) { - NETDATA.localStorageTested = false; - } + checkData: function (name, obj, ignore_regex) { + if (this.enabled_for_data) { + //console.log('XSS: checking data "' + name + '"...'); + return this.object(name, obj, ignore_regex); } - else - NETDATA.localStorageTested = false; + return obj; + } +}; +NETDATA.colorHex2Rgb = function (hex) { + // Expand shorthand form (e.g. "03F") to full form (e.g. "0033FF") + let shorthandRegex = /^#?([a-f\d])([a-f\d])([a-f\d])$/i; + hex = hex.replace(shorthandRegex, function (m, r, g, b) { + return r + r + g + g + b + b; + }); - return NETDATA.localStorageTested; - }; + let result = /^#?([a-f\d]{2})([a-f\d]{2})([a-f\d]{2})$/i.exec(hex); + return result ? { + r: parseInt(result[1], 16), + g: parseInt(result[2], 16), + b: parseInt(result[3], 16) + } : null; +}; + +NETDATA.colorLuminance = function (hex, lum) { + // validate hex string + hex = String(hex).replace(/[^0-9a-f]/gi, ''); + if (hex.length < 6) { + hex = hex[0] + hex[0] + hex[1] + hex[1] + hex[2] + hex[2]; + } - NETDATA.localStorageGet = function(key, def, callback) { - var ret = def; + lum = lum || 0; - if(typeof NETDATA.localStorage.default[key.toString()] === 'undefined') { - NETDATA.localStorage.default[key.toString()] = def; - NETDATA.localStorage.callback[key.toString()] = callback; - } + // convert to decimal and change luminosity + let rgb = "#"; + for (let i = 0; i < 3; i++) { + let c = parseInt(hex.substr(i * 2, 2), 16); + c = Math.round(Math.min(Math.max(0, c + (c * lum)), 255)).toString(16); + rgb += ("00" + c).substr(c.length); + } - if(NETDATA.localStorageTest() === true) { - try { - // console.log('localStorage: loading "' + key.toString() + '"'); - ret = localStorage.getItem(key.toString()); - // console.log('netdata loaded: ' + key.toString() + ' = ' + ret.toString()); - if(ret === null || ret === 'undefined') { - // console.log('localStorage: cannot load it, saving "' + key.toString() + '" with value "' + JSON.stringify(def) + '"'); - localStorage.setItem(key.toString(), JSON.stringify(def)); - ret = def; + return rgb; +}; +NETDATA.unitsConversion = { + keys: {}, // keys for data-common-units + latest: {}, // latest selected units for data-common-units + + globalReset: function () { + this.keys = {}; + this.latest = {}; + }, + + scalableUnits: { + 'packets/s': { + 'pps': 1, + 'Kpps': 1000, + 'Mpps': 1000000 + }, + 'pps': { + 'pps': 1, + 'Kpps': 1000, + 'Mpps': 1000000 + }, + 'kilobits/s': { + 'bits/s': 1 / 1000, + 'kilobits/s': 1, + 'megabits/s': 1000, + 'gigabits/s': 1000000, + 'terabits/s': 1000000000 + }, + 'kilobytes/s': { + 'bytes/s': 1 / 1024, + 'kilobytes/s': 1, + 'megabytes/s': 1024, + 'gigabytes/s': 1024 * 1024, + 'terabytes/s': 1024 * 1024 * 1024 + }, + 'KB/s': { + 'B/s': 1 / 1024, + 'KB/s': 1, + 'MB/s': 1024, + 'GB/s': 1024 * 1024, + 'TB/s': 1024 * 1024 * 1024 + }, + 'KB': { + 'B': 1 / 1024, + 'KB': 1, + 'MB': 1024, + 'GB': 1024 * 1024, + 'TB': 1024 * 1024 * 1024 + }, + 'MB': { + 'B': 1 / (1024 * 1024), + 'KB': 1 / 1024, + 'MB': 1, + 'GB': 1024, + 'TB': 1024 * 1024, + 'PB': 1024 * 1024 * 1024 + }, + 'GB': { + 'B': 1 / (1024 * 1024 * 1024), + 'KB': 1 / (1024 * 1024), + 'MB': 1 / 1024, + 'GB': 1, + 'TB': 1024, + 'PB': 1024 * 1024, + 'EB': 1024 * 1024 * 1024 + } + /* + 'milliseconds': { + 'seconds': 1000 + }, + 'seconds': { + 'milliseconds': 0.001, + 'seconds': 1, + 'minutes': 60, + 'hours': 3600, + 'days': 86400 + } + */ + }, + + convertibleUnits: { + 'Celsius': { + 'Fahrenheit': { + check: function (max) { + void(max); + return NETDATA.options.current.temperature === 'fahrenheit'; + }, + convert: function (value) { + return value * 9 / 5 + 32; } - else { - // console.log('localStorage: got "' + key.toString() + '" with value "' + ret + '"'); - ret = JSON.parse(ret); - // console.log('localStorage: loaded "' + key.toString() + '" as value ' + ret + ' of type ' + typeof(ret)); + } + }, + 'celsius': { + 'fahrenheit': { + check: function (max) { + void(max); + return NETDATA.options.current.temperature === 'fahrenheit'; + }, + convert: function (value) { + return value * 9 / 5 + 32; } } - catch(error) { - console.log('localStorage: failed to read "' + key.toString() + '", using default: "' + def.toString() + '"'); - ret = def; + }, + 'seconds': { + 'time': { + check: function (max) { + void(max); + return NETDATA.options.current.seconds_as_time; + }, + convert: function (seconds) { + return NETDATA.unitsConversion.seconds2time(seconds); + } } - } + }, + 'milliseconds': { + 'milliseconds': { + check: function (max) { + return NETDATA.options.current.seconds_as_time && max < 1000; + }, + convert: function (milliseconds) { + let tms = Math.round(milliseconds * 10); + milliseconds = Math.floor(tms / 10); - if(typeof ret === 'undefined' || ret === 'undefined') { - console.log('localStorage: LOADED UNDEFINED "' + key.toString() + '" as value ' + ret + ' of type ' + typeof(ret)); - ret = def; - } + tms -= milliseconds * 10; - NETDATA.localStorage.current[key.toString()] = ret; - return ret; - }; + return (milliseconds).toString() + '.' + tms.toString(); + } + }, + 'seconds': { + check: function (max) { + return NETDATA.options.current.seconds_as_time && max >= 1000 && max < 60000; + }, + convert: function (milliseconds) { + milliseconds = Math.round(milliseconds); - NETDATA.localStorageSet = function(key, value, callback) { - if(typeof value === 'undefined' || value === 'undefined') { - console.log('localStorage: ATTEMPT TO SET UNDEFINED "' + key.toString() + '" as value ' + value + ' of type ' + typeof(value)); - } + let seconds = Math.floor(milliseconds / 1000); + milliseconds -= seconds * 1000; - if(typeof NETDATA.localStorage.default[key.toString()] === 'undefined') { - NETDATA.localStorage.default[key.toString()] = value; - NETDATA.localStorage.current[key.toString()] = value; - NETDATA.localStorage.callback[key.toString()] = callback; - } + milliseconds = Math.round(milliseconds / 10); - if(NETDATA.localStorageTest() === true) { - // console.log('localStorage: saving "' + key.toString() + '" with value "' + JSON.stringify(value) + '"'); - try { - localStorage.setItem(key.toString(), JSON.stringify(value)); - } - catch(e) { - console.log('localStorage: failed to save "' + key.toString() + '" with value: "' + value.toString() + '"'); + return seconds.toString() + '.' + + NETDATA.zeropad(milliseconds); + } + }, + 'M:SS.ms': { + check: function (max) { + return NETDATA.options.current.seconds_as_time && max >= 60000; + }, + convert: function (milliseconds) { + milliseconds = Math.round(milliseconds); + + let minutes = Math.floor(milliseconds / 60000); + milliseconds -= minutes * 60000; + + let seconds = Math.floor(milliseconds / 1000); + milliseconds -= seconds * 1000; + + milliseconds = Math.round(milliseconds / 10); + + return minutes.toString() + ':' + + NETDATA.zeropad(seconds) + '.' + + NETDATA.zeropad(milliseconds); + } } } + }, - NETDATA.localStorage.current[key.toString()] = value; - return value; - }; + seconds2time: function (seconds) { + seconds = Math.abs(seconds); - NETDATA.localStorageGetRecursive = function(obj, prefix, callback) { - var keys = Object.keys(obj); - var len = keys.length; - while(len--) { - var i = keys[len]; + let days = Math.floor(seconds / 86400); + seconds -= days * 86400; - if(typeof obj[i] === 'object') { - //console.log('object ' + prefix + '.' + i.toString()); - NETDATA.localStorageGetRecursive(obj[i], prefix + '.' + i.toString(), callback); - continue; - } + let hours = Math.floor(seconds / 3600); + seconds -= hours * 3600; - obj[i] = NETDATA.localStorageGet(prefix + '.' + i.toString(), obj[i], callback); - } - }; + let minutes = Math.floor(seconds / 60); + seconds -= minutes * 60; - NETDATA.setOption = function(key, value) { - if(key.toString() === 'setOptionCallback') { - if(typeof NETDATA.options.current.setOptionCallback === 'function') { - NETDATA.options.current[key.toString()] = value; - NETDATA.options.current.setOptionCallback(); - } - } - else if(NETDATA.options.current[key.toString()] !== value) { - var name = 'options.' + key.toString(); + seconds = Math.round(seconds); - if(typeof NETDATA.localStorage.default[name.toString()] === 'undefined') - console.log('localStorage: setOption() on unsaved option: "' + name.toString() + '", value: ' + value); + let ms_txt = ''; + /* + let ms = seconds - Math.floor(seconds); + seconds -= ms; + ms = Math.round(ms * 1000); - //console.log(NETDATA.localStorage); - //console.log('setOption: setting "' + key.toString() + '" to "' + value + '" of type ' + typeof(value) + ' original type ' + typeof(NETDATA.options.current[key.toString()])); - //console.log(NETDATA.options); - NETDATA.options.current[key.toString()] = NETDATA.localStorageSet(name.toString(), value, null); + if (ms > 1) { + if (ms < 10) + ms_txt = '.00' + ms.toString(); + else if (ms < 100) + ms_txt = '.0' + ms.toString(); + else + ms_txt = '.' + ms.toString(); + } + */ + + return ((days > 0) ? days.toString() + 'd:' : '').toString() + + NETDATA.zeropad(hours) + ':' + + NETDATA.zeropad(minutes) + ':' + + NETDATA.zeropad(seconds) + + ms_txt; + }, + + // get a function that converts the units + // + every time units are switched call the callback + get: function (uuid, min, max, units, desired_units, common_units_name, switch_units_callback) { + // validate the parameters + if (typeof units === 'undefined') { + units = 'undefined'; + } + + // check if we support units conversion + if (typeof this.scalableUnits[units] === 'undefined' && typeof this.convertibleUnits[units] === 'undefined') { + // we can't convert these units + //console.log('DEBUG: ' + uuid.toString() + ' can\'t convert units: ' + units.toString()); + return function (value) { + return value; + }; + } - if(typeof NETDATA.options.current.setOptionCallback === 'function') - NETDATA.options.current.setOptionCallback(); + // check if the caller wants the original units + if (typeof desired_units === 'undefined' || desired_units === null || desired_units === 'original' || desired_units === units) { + //console.log('DEBUG: ' + uuid.toString() + ' original units wanted'); + switch_units_callback(units); + return function (value) { + return value; + }; } - return true; - }; + // now we know we can convert the units + // and the caller wants some kind of conversion - NETDATA.getOption = function(key) { - return NETDATA.options.current[key.toString()]; - }; + let tunits = null; + let tdivider = 0; - // read settings from local storage - NETDATA.localStorageGetRecursive(NETDATA.options.current, 'options', null); + if (typeof this.scalableUnits[units] !== 'undefined') { + // units that can be scaled + // we decide a divider - // always start with this option enabled. - NETDATA.setOption('stop_updates_when_focus_is_lost', true); + // console.log('NETDATA.unitsConversion.get(' + units.toString() + ', ' + desired_units.toString() + ', function()) decide divider with min = ' + min.toString() + ', max = ' + max.toString()); - NETDATA.resetOptions = function() { - var keys = Object.keys(NETDATA.localStorage.default); - var len = keys.length; - while(len--) { - var i = keys[len]; - var a = i.split('.'); + if (desired_units === 'auto') { + // the caller wants to auto-scale the units - if(a[0] === 'options') { - if(a[1] === 'setOptionCallback') continue; - if(typeof NETDATA.localStorage.default[i] === 'undefined') continue; - if(NETDATA.options.current[i] === NETDATA.localStorage.default[i]) continue; + // find the absolute maximum value that is rendered on the chart + // based on this we decide the scale + min = Math.abs(min); + max = Math.abs(max); + if (min > max) { + max = min; + } - NETDATA.setOption(a[1], NETDATA.localStorage.default[i]); - } - else if(a[0] === 'chart_heights') { - if(typeof NETDATA.localStorage.callback[i] === 'function' && typeof NETDATA.localStorage.default[i] !== 'undefined') { - NETDATA.localStorage.callback[i](NETDATA.localStorage.default[i]); + // find the smallest scale that provides integers + // for (x in this.scalableUnits[units]) { + // if (this.scalableUnits[units].hasOwnProperty(x)) { + // let m = this.scalableUnits[units][x]; + // if (m <= max && m > tdivider) { + // tunits = x; + // tdivider = m; + // } + // } + // } + const sunit = this.scalableUnits[units]; + for (const x of Object.keys(sunit)) { + let m = sunit[x]; + if (m <= max && m > tdivider) { + tunits = x; + tdivider = m; + } } - } - } - NETDATA.dateTime.init(NETDATA.options.current.timezone); - }; + if (tunits === null || tdivider <= 0) { + // we couldn't find one + //console.log('DEBUG: ' + uuid.toString() + ' cannot find an auto-scaling candidate for units: ' + units.toString() + ' (max: ' + max.toString() + ')'); + switch_units_callback(units); + return function (value) { + return value; + }; + } - // ---------------------------------------------------------------------------------------------------------------- + if (typeof common_units_name === 'string' && typeof uuid === 'string') { + // the caller wants several charts to have the same units + // data-common-units - if(NETDATA.options.debug.main_loop === true) - console.log('welcome to NETDATA'); + let common_units_key = common_units_name + '-' + units; - NETDATA.onresizeCallback = null; - NETDATA.onresize = function() { - NETDATA.options.last_page_resize = Date.now(); - NETDATA.onscroll(); + // add our divider into the list of keys + let t = this.keys[common_units_key]; + if (typeof t === 'undefined') { + this.keys[common_units_key] = {}; + t = this.keys[common_units_key]; + } + t[uuid] = { + units: tunits, + divider: tdivider + }; - if(typeof NETDATA.onresizeCallback === 'function') - NETDATA.onresizeCallback(); - }; + // find the max divider of all charts + let common_units = t[uuid]; + for (const x in t) { + if (t.hasOwnProperty(x) && t[x].divider > common_units.divider) { + common_units = t[x]; + } + } + + // save our common_max to the latest keys + let latest = this.latest[common_units_key]; + if (typeof latest === 'undefined') { + this.latest[common_units_key] = {}; + latest = this.latest[common_units_key]; + } + latest.units = common_units.units; + latest.divider = common_units.divider; + + tunits = latest.units; + tdivider = latest.divider; + + //console.log('DEBUG: ' + uuid.toString() + ' converted units: ' + units.toString() + ' to units: ' + tunits.toString() + ' with divider ' + tdivider.toString() + ', common-units=' + common_units_name.toString() + ((t[uuid].divider !== tdivider)?' USED COMMON, mine was ' + t[uuid].units:' set common').toString()); + + // apply it to this chart + switch_units_callback(tunits); + return function (value) { + if (tdivider !== latest.divider) { + // another chart switched our common units + // we should switch them too + //console.log('DEBUG: ' + uuid + ' switching units due to a common-units change, from ' + tunits.toString() + ' to ' + latest.units.toString()); + tunits = latest.units; + tdivider = latest.divider; + switch_units_callback(tunits); + } - NETDATA.abort_all_refreshes = function() { - var targets = NETDATA.options.targets; - var len = targets.length; + return value / tdivider; + }; + } else { + // the caller did not give data-common-units + // this chart auto-scales independently of all others + //console.log('DEBUG: ' + uuid.toString() + ' converted units: ' + units.toString() + ' to units: ' + tunits.toString() + ' with divider ' + tdivider.toString() + ', autonomously'); + + switch_units_callback(tunits); + return function (value) { + return value / tdivider; + }; + } + } else { + // the caller wants specific units - while (len--) { - if (targets[len].fetching_data === true) { - if (typeof targets[len].xhr !== 'undefined') { - targets[len].xhr.abort(); - targets[len].running = false; - targets[len].fetching_data = false; + if (typeof this.scalableUnits[units][desired_units] !== 'undefined') { + // all good, set the new units + tdivider = this.scalableUnits[units][desired_units]; + // console.log('DEBUG: ' + uuid.toString() + ' converted units: ' + units.toString() + ' to units: ' + desired_units.toString() + ' with divider ' + tdivider.toString() + ', by reference'); + switch_units_callback(desired_units); + return function (value) { + return value / tdivider; + }; + } else { + // oops! switch back to original units + console.log('Units conversion from ' + units.toString() + ' to ' + desired_units.toString() + ' is not supported.'); + switch_units_callback(units); + return function (value) { + return value; + }; + } + } + } else if (typeof this.convertibleUnits[units] !== 'undefined') { + // units that can be converted + if (desired_units === 'auto') { + for (const x in this.convertibleUnits[units]) { + if (this.convertibleUnits[units].hasOwnProperty(x)) { + if (this.convertibleUnits[units][x].check(max)) { + //console.log('DEBUG: ' + uuid.toString() + ' converting ' + units.toString() + ' to: ' + x.toString()); + switch_units_callback(x); + return this.convertibleUnits[units][x].convert; + } + } } + + // none checked ok + //console.log('DEBUG: ' + uuid.toString() + ' no conversion available for ' + units.toString() + ' to: ' + desired_units.toString()); + switch_units_callback(units); + return function (value) { + return value; + }; + } else if (typeof this.convertibleUnits[units][desired_units] !== 'undefined') { + switch_units_callback(desired_units); + return this.convertibleUnits[units][desired_units].convert; + } else { + console.log('Units conversion from ' + units.toString() + ' to ' + desired_units.toString() + ' is not supported.'); + switch_units_callback(units); + return function (value) { + return value; + }; } + } else { + // hm... did we forget to implement the new type? + console.log(`Unmatched unit conversion method for units ${units.toString()}`); + switch_units_callback(units); + return function (value) { + return value; + }; } - }; + } +}; + +NETDATA.icons = { + left: '<i class="fas fa-backward"></i>', + reset: '<i class="fas fa-play"></i>', + right: '<i class="fas fa-forward"></i>', + zoomIn: '<i class="fas fa-plus"></i>', + zoomOut: '<i class="fas fa-minus"></i>', + resize: '<i class="fas fa-sort"></i>', + lineChart: '<i class="fas fa-chart-line"></i>', + areaChart: '<i class="fas fa-chart-area"></i>', + noChart: '<i class="fas fa-chart-area"></i>', + loading: '<i class="fas fa-sync-alt"></i>', + noData: '<i class="fas fa-exclamation-triangle"></i>' +}; + +if (typeof netdataIcons === 'object') { + // for (let icon in NETDATA.icons) { + // if (NETDATA.icons.hasOwnProperty(icon) && typeof(netdataIcons[icon]) === 'string') + // NETDATA.icons[icon] = netdataIcons[icon]; + // } + for (const icon of Object.keys(NETDATA.icons)) { + if (typeof(netdataIcons[icon]) === 'string') { + NETDATA.icons[icon] = netdataIcons[icon] + } + } +} - NETDATA.onscroll_start_delay = function() { - NETDATA.options.last_page_scroll = Date.now(); +if (typeof netdataSnapshotData === 'undefined') { + netdataSnapshotData = null; +} - NETDATA.options.on_scroll_refresher_stop_until = - NETDATA.options.last_page_scroll - + ((NETDATA.options.current.async_on_scroll === true) ? 1000 : 0); - }; +if (typeof netdataShowHelp === 'undefined') { + netdataShowHelp = true; +} - NETDATA.onscroll_end_delay = function() { - NETDATA.options.on_scroll_refresher_stop_until = - Date.now() - + ((NETDATA.options.current.async_on_scroll === true) ? NETDATA.options.current.onscroll_worker_duration_threshold : 0); - }; +if (typeof netdataShowAlarms === 'undefined') { + netdataShowAlarms = false; +} - NETDATA.onscroll_updater_timeout_id = undefined; - NETDATA.onscroll_updater = function() { - NETDATA.globalSelectionSync.stop(); +if (typeof netdataRegistryAfterMs !== 'number' || netdataRegistryAfterMs < 0) { + netdataRegistryAfterMs = 1500; +} - if(NETDATA.options.abort_ajax_on_scroll === true) - NETDATA.abort_all_refreshes(); +if (typeof netdataRegistry === 'undefined') { + // backward compatibility + netdataRegistry = (typeof netdataNoRegistry !== 'undefined' && netdataNoRegistry === false); +} - // when the user scrolls he sees that we have - // hidden all the not-visible charts - // using this little function we try to switch - // the charts back to visible quickly +if (netdataRegistry === false && typeof netdataRegistryCallback === 'function') { + netdataRegistry = true; +} - if(NETDATA.intersectionObserver.enabled() === false) { - if (NETDATA.options.current.parallel_refresher === false) { - var targets = NETDATA.options.targets; - var len = targets.length; +// ---------------------------------------------------------------------------------------------------------------- +// the defaults for all charts - while (len--) - if (targets[len].running === false) - targets[len].isVisible(); - } - } +// if the user does not specify any of these, the following will be used - NETDATA.onscroll_end_delay(); - }; +NETDATA.chartDefaults = { + width: '100%', // the chart width - can be null + height: '100%', // the chart height - can be null + min_width: null, // the chart minimum width - can be null + library: 'dygraph', // the graphing library to use + method: 'average', // the grouping method + before: 0, // panning + after: -600, // panning + pixels_per_point: 1, // the detail of the chart + fill_luminance: 0.8 // luminance of colors in solid areas +}; - NETDATA.scrollUp = false; - NETDATA.scrollY = window.scrollY; - NETDATA.onscroll = function() { - //console.log('onscroll() begin'); +// ---------------------------------------------------------------------------------------------------------------- +// global options - NETDATA.onscroll_start_delay(); - NETDATA.chartRefresherReschedule(); +NETDATA.options = { + pauseCallback: null, // a callback when we are really paused - NETDATA.scrollUp = (window.scrollY > NETDATA.scrollY); - NETDATA.scrollY = window.scrollY; + pause: false, // when enabled we don't auto-refresh the charts - if(NETDATA.onscroll_updater_timeout_id) - NETDATA.timeout.clear(NETDATA.onscroll_updater_timeout_id); + targets: [], // an array of all the state objects that are + // currently active (independently of their + // viewport visibility) - NETDATA.onscroll_updater_timeout_id = NETDATA.timeout.set(NETDATA.onscroll_updater, 0); - //console.log('onscroll() end'); - }; + updated_dom: true, // when true, the DOM has been updated with + // new elements we have to check. - NETDATA.supportsPassiveEvents = function() { - if(NETDATA.options.passive_events === null) { - var supportsPassive = false; - try { - var opts = Object.defineProperty({}, 'passive', { - get: function () { - supportsPassive = true; - } - }); - window.addEventListener("test", null, opts); - } catch (e) { - console.log('browser does not support passive events'); - } + auto_refresher_fast_weight: 0, // this is the current time in ms, spent + // rendering charts continuously. + // used with .current.fast_render_timeframe - NETDATA.options.passive_events = supportsPassive; - } + page_is_visible: true, // when true, this page is visible - // console.log('passive ' + NETDATA.options.passive_events); - return NETDATA.options.passive_events; - }; + auto_refresher_stop_until: 0, // timestamp in ms - used internally, to stop the + // auto-refresher for some time (when a chart is + // performing pan or zoom, we need to stop refreshing + // all other charts, to have the maximum speed for + // rendering the chart that is panned or zoomed). + // Used with .current.global_pan_sync_time - window.addEventListener('resize', NETDATA.onresize, NETDATA.supportsPassiveEvents() ? { passive: true } : false); - window.addEventListener('scroll', NETDATA.onscroll, NETDATA.supportsPassiveEvents() ? { passive: true } : false); - // window.onresize = NETDATA.onresize; - // window.onscroll = NETDATA.onscroll; + on_scroll_refresher_stop_until: 0, // timestamp in ms - used to stop evaluating + // charts for some time, after a page scroll - // ---------------------------------------------------------------------------------------------------------------- - // Error Handling - - NETDATA.errorCodes = { - 100: { message: "Cannot load chart library", alert: true }, - 101: { message: "Cannot load jQuery", alert: true }, - 402: { message: "Chart library not found", alert: false }, - 403: { message: "Chart library not enabled/is failed", alert: false }, - 404: { message: "Chart not found", alert: false }, - 405: { message: "Cannot download charts index from server", alert: true }, - 406: { message: "Invalid charts index downloaded from server", alert: true }, - 407: { message: "Cannot HELLO netdata server", alert: false }, - 408: { message: "Netdata servers sent invalid response to HELLO", alert: false }, - 409: { message: "Cannot ACCESS netdata registry", alert: false }, - 410: { message: "Netdata registry ACCESS failed", alert: false }, - 411: { message: "Netdata registry server send invalid response to DELETE ", alert: false }, - 412: { message: "Netdata registry DELETE failed", alert: false }, - 413: { message: "Netdata registry server send invalid response to SWITCH ", alert: false }, - 414: { message: "Netdata registry SWITCH failed", alert: false }, - 415: { message: "Netdata alarms download failed", alert: false }, - 416: { message: "Netdata alarms log download failed", alert: false }, - 417: { message: "Netdata registry server send invalid response to SEARCH ", alert: false }, - 418: { message: "Netdata registry SEARCH failed", alert: false } - }; - NETDATA.errorLast = { - code: 0, - message: "", - datetime: 0 - }; + last_page_resize: Date.now(), // the timestamp of the last resize request - NETDATA.error = function(code, msg) { - NETDATA.errorLast.code = code; - NETDATA.errorLast.message = msg; - NETDATA.errorLast.datetime = Date.now(); + last_page_scroll: 0, // the timestamp the last time the page was scrolled - console.log("ERROR " + code + ": " + NETDATA.errorCodes[code].message + ": " + msg); + browser_timezone: 'unknown', // timezone detected by javascript + server_timezone: 'unknown', // timezone reported by the server - var ret = true; - if(typeof netdataErrorCallback === 'function') { - ret = netdataErrorCallback('system', code, msg); - } + force_data_points: 0, // force the number of points to be returned for charts + fake_chart_rendering: false, // when set to true, the dashboard will download data but will not render the charts - if(ret && NETDATA.errorCodes[code].alert) - alert("ERROR " + code + ": " + NETDATA.errorCodes[code].message + ": " + msg); - }; + passive_events: null, // true if the browser supports passive events - NETDATA.errorReset = function() { - NETDATA.errorLast.code = 0; - NETDATA.errorLast.message = "You are doing fine!"; - NETDATA.errorLast.datetime = 0; - }; + // the current profile + // we may have many... + current: { + units: 'auto', // can be 'auto' or 'original' + temperature: 'celsius', // can be 'celsius' or 'fahrenheit' + seconds_as_time: true, // show seconds as DDd:HH:MM:SS ? + timezone: 'default', // the timezone to use, or 'default' + user_set_server_timezone: 'default', // as set by the user on the dashboard - // ---------------------------------------------------------------------------------------------------------------- - // fast numbers formatting - - NETDATA.fastNumberFormat = { - formatters_fixed: [], - formatters_zero_based: [], - - // this is the fastest and the preferred - getIntlNumberFormat: function(min, max) { - var key = max; - if(min === max) { - if(typeof this.formatters_fixed[key] === 'undefined') - this.formatters_fixed[key] = new Intl.NumberFormat(undefined, { - // style: 'decimal', - // minimumIntegerDigits: 1, - // minimumSignificantDigits: 1, - // maximumSignificantDigits: 1, - useGrouping: true, - minimumFractionDigits: min, - maximumFractionDigits: max - }); + legend_toolbox: true, // show the legend toolbox on charts + resize_charts: true, // show the resize handler on charts - return this.formatters_fixed[key]; - } - else if(min === 0) { - if(typeof this.formatters_zero_based[key] === 'undefined') - this.formatters_zero_based[key] = new Intl.NumberFormat(undefined, { - // style: 'decimal', - // minimumIntegerDigits: 1, - // minimumSignificantDigits: 1, - // maximumSignificantDigits: 1, - useGrouping: true, - minimumFractionDigits: min, - maximumFractionDigits: max - }); + pixels_per_point: isSlowDevice() ? 5 : 1, // the minimum pixels per point for all charts + // increase this to speed javascript up + // each chart library has its own limit too + // the max of this and the chart library is used + // the final is calculated every time, so a change + // here will have immediate effect on the next chart + // update - return this.formatters_zero_based[key]; - } - else { - // this is never used - // it is added just for completeness - return new Intl.NumberFormat(undefined, { - // style: 'decimal', - // minimumIntegerDigits: 1, - // minimumSignificantDigits: 1, - // maximumSignificantDigits: 1, - useGrouping: true, - minimumFractionDigits: min, - maximumFractionDigits: max - }); - } - }, + idle_between_charts: 100, // ms - how much time to wait between chart updates - // this respects locale - getLocaleString: function(min, max) { - var key = max; - if(min === max) { - if(typeof this.formatters_fixed[key] === 'undefined') - this.formatters_fixed[key] = { - format: function (value) { - return value.toLocaleString(undefined, { - // style: 'decimal', - // minimumIntegerDigits: 1, - // minimumSignificantDigits: 1, - // maximumSignificantDigits: 1, - useGrouping: true, - minimumFractionDigits: min, - maximumFractionDigits: max - }); - } - }; + fast_render_timeframe: 200, // ms - render continuously until this time of continuous + // rendering has been reached + // this setting is used to make it render e.g. 10 + // charts at once, sleep idle_between_charts time + // and continue for another 10 charts. - return this.formatters_fixed[key]; - } - else if(min === 0) { - if(typeof this.formatters_zero_based[key] === 'undefined') - this.formatters_zero_based[key] = { - format: function (value) { - return value.toLocaleString(undefined, { - // style: 'decimal', - // minimumIntegerDigits: 1, - // minimumSignificantDigits: 1, - // maximumSignificantDigits: 1, - useGrouping: true, - minimumFractionDigits: min, - maximumFractionDigits: max - }); - } - }; + idle_between_loops: 500, // ms - if all charts have been updated, wait this + // time before starting again. - return this.formatters_zero_based[key]; - } - else { - return { - format: function (value) { - return value.toLocaleString(undefined, { - // style: 'decimal', - // minimumIntegerDigits: 1, - // minimumSignificantDigits: 1, - // maximumSignificantDigits: 1, - useGrouping: true, - minimumFractionDigits: min, - maximumFractionDigits: max - }); - } - }; - } - }, + idle_parallel_loops: 100, // ms - the time between parallel refresher updates - // the fallback - getFixed: function(min, max) { - var key = max; - if(min === max) { - if(typeof this.formatters_fixed[key] === 'undefined') - this.formatters_fixed[key] = { - format: function (value) { - if(value === 0) return "0"; - return value.toFixed(max); - } - }; + idle_lost_focus: 500, // ms - when the window does not have focus, check + // if focus has been regained, every this time - return this.formatters_fixed[key]; - } - else if(min === 0) { - if(typeof this.formatters_zero_based[key] === 'undefined') - this.formatters_zero_based[key] = { - format: function (value) { - if(value === 0) return "0"; - return value.toFixed(max); - } - }; + global_pan_sync_time: 300, // ms - when you pan or zoom a chart, the background + // auto-refreshing of charts is paused for this amount + // of time - return this.formatters_zero_based[key]; - } - else { - return { - format: function (value) { - if(value === 0) return "0"; - return value.toFixed(max); - } - }; - } - }, + sync_selection_delay: 400, // ms - when you pan or zoom a chart, wait this amount + // of time before setting up synchronized selections + // on hover. - testIntlNumberFormat: function() { - var value = 1.12345; - var e1 = "1.12", e2 = "1,12"; - var s = ""; + sync_selection: true, // enable or disable selection sync - try { - var x = new Intl.NumberFormat(undefined, { - useGrouping: true, - minimumFractionDigits: 2, - maximumFractionDigits: 2 - }); + pan_and_zoom_delay: 50, // when panning or zooming, how ofter to update the chart - s = x.format(value); - } - catch(e) { - s = ""; - } - - // console.log('NumberFormat: ', s); - return (s === e1 || s === e2); - }, + sync_pan_and_zoom: true, // enable or disable pan and zoom sync - testLocaleString: function() { - var value = 1.12345; - var e1 = "1.12", e2 = "1,12"; - var s = ""; + pan_and_zoom_data_padding: true, // fetch more data for the master chart when panning or zooming - try { - s = value.toLocaleString(undefined, { - useGrouping: true, - minimumFractionDigits: 2, - maximumFractionDigits: 2 - }); - } - catch(e) { - s = ""; - } + update_only_visible: true, // enable or disable visibility management / used for printing - // console.log('localeString: ', s); - return (s === e1 || s === e2); - }, + parallel_refresher: !isSlowDevice(), // enable parallel refresh of charts - // on first run we decide which formatter to use - get: function(min, max) { - if(this.testIntlNumberFormat()) { - // console.log('numberformat'); - this.get = this.getIntlNumberFormat; - } - else if(this.testLocaleString()) { - // console.log('localestring'); - this.get = this.getLocaleString; - } - else { - // console.log('fixed'); - this.get = this.getFixed; - } - return this.get(min, max); - } - }; + concurrent_refreshes: true, // when parallel_refresher is enabled, sync also the charts - // ---------------------------------------------------------------------------------------------------------------- - // element data attributes + destroy_on_hide: isSlowDevice(), // destroy charts when they are not visible - NETDATA.dataAttribute = function(element, attribute, def) { - var key = 'data-' + attribute.toString(); - if(element.hasAttribute(key) === true) { - var data = element.getAttribute(key); + show_help: netdataShowHelp, // when enabled the charts will show some help + show_help_delay_show_ms: 500, + show_help_delay_hide_ms: 0, - if(data === 'true') return true; - if(data === 'false') return false; - if(data === 'null') return null; + eliminate_zero_dimensions: true, // do not show dimensions with just zeros - // Only convert to a number if it doesn't change the string - if(data === +data + '') return +data; + stop_updates_when_focus_is_lost: true, // boolean - shall we stop auto-refreshes when document does not have user focus + stop_updates_while_resizing: 1000, // ms - time to stop auto-refreshes while resizing the charts - if(/^(?:\{[\w\W]*\}|\[[\w\W]*\])$/.test(data)) - return JSON.parse(data); + double_click_speed: 500, // ms - time between clicks / taps to detect double click/tap - return data; - } - else return def; - }; + smooth_plot: !isSlowDevice(), // enable smooth plot, where possible - NETDATA.dataAttributeBoolean = function(element, attribute, def) { - var value = NETDATA.dataAttribute(element, attribute, def); + color_fill_opacity_line: 1.0, + color_fill_opacity_area: 0.2, + color_fill_opacity_stacked: 0.8, - if(value === true || value === false) - return value; + pan_and_zoom_factor: 0.25, // the increment when panning and zooming with the toolbox + pan_and_zoom_factor_multiplier_control: 2.0, + pan_and_zoom_factor_multiplier_shift: 3.0, + pan_and_zoom_factor_multiplier_alt: 4.0, - if(typeof(value) === 'string') { - if(value === 'yes' || value === 'on') - return true; + abort_ajax_on_scroll: false, // kill pending ajax page scroll + async_on_scroll: false, // sync/async onscroll handler + onscroll_worker_duration_threshold: 30, // time in ms, for async scroll handler - if(value === '' || value === 'no' || value === 'off' || value === 'null') - return false; + retries_on_data_failures: 3, // how many retries to make if we can't fetch chart data from the server - return def; + setOptionCallback: function () { } + }, - if(typeof(value) === 'number') - return value !== 0; + debug: { + show_boxes: false, + main_loop: false, + focus: false, + visibility: false, + chart_data_url: false, + chart_errors: true, // remember to set it to false before merging + chart_timing: false, + chart_calls: false, + libraries: false, + dygraph: false, + globalSelectionSync: false, + globalPanAndZoom: false + } +}; - return def; - }; +NETDATA.statistics = { + refreshes_total: 0, + refreshes_active: 0, + refreshes_active_max: 0 +}; - // ---------------------------------------------------------------------------------------------------------------- - // commonMin & commonMax +// local storage options - NETDATA.commonMin = { - keys: {}, - latest: {}, +NETDATA.localStorage = { + default: {}, + current: {}, + callback: {} // only used for resetting back to defaults +}; - globalReset: function() { - this.keys = {}; - this.latest = {}; - }, +NETDATA.localStorageTested = -1; +NETDATA.localStorageTest = function () { + if (NETDATA.localStorageTested !== -1) { + return NETDATA.localStorageTested; + } - get: function(state) { - if(typeof state.tmp.__commonMin === 'undefined') { - // get the commonMin setting - state.tmp.__commonMin = NETDATA.dataAttribute(state.element, 'common-min', null); - } + if (typeof Storage !== "undefined" && typeof localStorage === 'object') { + let test = 'test'; + try { + localStorage.setItem(test, test); + localStorage.removeItem(test); + NETDATA.localStorageTested = true; + } catch (e) { + NETDATA.localStorageTested = false; + } + } else { + NETDATA.localStorageTested = false; + } - var min = state.data.min; - var name = state.tmp.__commonMin; + return NETDATA.localStorageTested; +}; - if(name === null) { - // we don't need commonMin - //state.log('no need for commonMin'); - return min; - } +NETDATA.localStorageGet = function (key, def, callback) { + let ret = def; - var t = this.keys[name]; - if(typeof t === 'undefined') { - // add our commonMin - this.keys[name] = {}; - t = this.keys[name]; - } + if (typeof NETDATA.localStorage.default[key.toString()] === 'undefined') { + NETDATA.localStorage.default[key.toString()] = def; + NETDATA.localStorage.callback[key.toString()] = callback; + } - var uuid = state.uuid; - if(typeof t[uuid] !== 'undefined') { - if(t[uuid] === min) { - //state.log('commonMin ' + state.tmp.__commonMin + ' not changed: ' + this.latest[name]); - return this.latest[name]; - } - else if(min < this.latest[name]) { - //state.log('commonMin ' + state.tmp.__commonMin + ' increased: ' + min); - t[uuid] = min; - this.latest[name] = min; - return min; - } + if (NETDATA.localStorageTest()) { + try { + // console.log('localStorage: loading "' + key.toString() + '"'); + ret = localStorage.getItem(key.toString()); + // console.log('netdata loaded: ' + key.toString() + ' = ' + ret.toString()); + if (ret === null || ret === 'undefined') { + // console.log('localStorage: cannot load it, saving "' + key.toString() + '" with value "' + JSON.stringify(def) + '"'); + localStorage.setItem(key.toString(), JSON.stringify(def)); + ret = def; + } else { + // console.log('localStorage: got "' + key.toString() + '" with value "' + ret + '"'); + ret = JSON.parse(ret); + // console.log('localStorage: loaded "' + key.toString() + '" as value ' + ret + ' of type ' + typeof(ret)); } + } catch (error) { + console.log('localStorage: failed to read "' + key.toString() + '", using default: "' + def.toString() + '"'); + ret = def; + } + } - // add our min - t[uuid] = min; + if (typeof ret === 'undefined' || ret === 'undefined') { + console.log('localStorage: LOADED UNDEFINED "' + key.toString() + '" as value ' + ret + ' of type ' + typeof(ret)); + ret = def; + } - // find the common min - var m = min; - for(var i in t) - if(t.hasOwnProperty(i) && t[i] < m) m = t[i]; + NETDATA.localStorage.current[key.toString()] = ret; + return ret; +}; - //state.log('commonMin ' + state.tmp.__commonMin + ' updated: ' + m); - this.latest[name] = m; - return m; - } - }; +NETDATA.localStorageSet = function (key, value, callback) { + if (typeof value === 'undefined' || value === 'undefined') { + console.log('localStorage: ATTEMPT TO SET UNDEFINED "' + key.toString() + '" as value ' + value + ' of type ' + typeof(value)); + } - NETDATA.commonMax = { - keys: {}, - latest: {}, + if (typeof NETDATA.localStorage.default[key.toString()] === 'undefined') { + NETDATA.localStorage.default[key.toString()] = value; + NETDATA.localStorage.current[key.toString()] = value; + NETDATA.localStorage.callback[key.toString()] = callback; + } - globalReset: function() { - this.keys = {}; - this.latest = {}; - }, + if (NETDATA.localStorageTest()) { + // console.log('localStorage: saving "' + key.toString() + '" with value "' + JSON.stringify(value) + '"'); + try { + localStorage.setItem(key.toString(), JSON.stringify(value)); + } catch (e) { + console.log('localStorage: failed to save "' + key.toString() + '" with value: "' + value.toString() + '"'); + } + } - get: function(state) { - if(typeof state.tmp.__commonMax === 'undefined') { - // get the commonMax setting - state.tmp.__commonMax = NETDATA.dataAttribute(state.element, 'common-max', null); - } + NETDATA.localStorage.current[key.toString()] = value; + return value; +}; - var max = state.data.max; - var name = state.tmp.__commonMax; +NETDATA.localStorageGetRecursive = function (obj, prefix, callback) { + let keys = Object.keys(obj); + let len = keys.length; + while (len--) { + let i = keys[len]; - if(name === null) { - // we don't need commonMax - //state.log('no need for commonMax'); - return max; - } + if (typeof obj[i] === 'object') { + //console.log('object ' + prefix + '.' + i.toString()); + NETDATA.localStorageGetRecursive(obj[i], prefix + '.' + i.toString(), callback); + continue; + } - var t = this.keys[name]; - if(typeof t === 'undefined') { - // add our commonMax - this.keys[name] = {}; - t = this.keys[name]; - } + obj[i] = NETDATA.localStorageGet(prefix + '.' + i.toString(), obj[i], callback); + } +}; - var uuid = state.uuid; - if(typeof t[uuid] !== 'undefined') { - if(t[uuid] === max) { - //state.log('commonMax ' + state.tmp.__commonMax + ' not changed: ' + this.latest[name]); - return this.latest[name]; - } - else if(max > this.latest[name]) { - //state.log('commonMax ' + state.tmp.__commonMax + ' increased: ' + max); - t[uuid] = max; - this.latest[name] = max; - return max; - } - } +NETDATA.setOption = function (key, value) { + if (key.toString() === 'setOptionCallback') { + if (typeof NETDATA.options.current.setOptionCallback === 'function') { + NETDATA.options.current[key.toString()] = value; + NETDATA.options.current.setOptionCallback(); + } + } else if (NETDATA.options.current[key.toString()] !== value) { + let name = 'options.' + key.toString(); - // add our max - t[uuid] = max; + if (typeof NETDATA.localStorage.default[name.toString()] === 'undefined') { + console.log('localStorage: setOption() on unsaved option: "' + name.toString() + '", value: ' + value); + } - // find the common max - var m = max; - for(var i in t) - if(t.hasOwnProperty(i) && t[i] > m) m = t[i]; + //console.log(NETDATA.localStorage); + //console.log('setOption: setting "' + key.toString() + '" to "' + value + '" of type ' + typeof(value) + ' original type ' + typeof(NETDATA.options.current[key.toString()])); + //console.log(NETDATA.options); + NETDATA.options.current[key.toString()] = NETDATA.localStorageSet(name.toString(), value, null); - //state.log('commonMax ' + state.tmp.__commonMax + ' updated: ' + m); - this.latest[name] = m; - return m; + if (typeof NETDATA.options.current.setOptionCallback === 'function') { + NETDATA.options.current.setOptionCallback(); } - }; + } - NETDATA.commonColors = { - keys: {}, + return true; +}; - globalReset: function() { - this.keys = {}; - }, +NETDATA.getOption = function (key) { + return NETDATA.options.current[key.toString()]; +}; - get: function(state, label) { - var ret = this.refill(state); +// read settings from local storage +NETDATA.localStorageGetRecursive(NETDATA.options.current, 'options', null); - if(typeof ret.assigned[label] === 'undefined') - ret.assigned[label] = ret.available.shift(); +// always start with this option enabled. +NETDATA.setOption('stop_updates_when_focus_is_lost', true); - return ret.assigned[label]; - }, +NETDATA.resetOptions = function () { + let keys = Object.keys(NETDATA.localStorage.default); + let len = keys.length; - refill: function(state) { - var ret, len; + while (len--) { + let i = keys[len]; + let a = i.split('.'); - if(typeof state.tmp.__commonColors === 'undefined') - ret = this.prepare(state); - else { - ret = this.keys[state.tmp.__commonColors]; - if(typeof ret === 'undefined') - ret = this.prepare(state); + if (a[0] === 'options') { + if (a[1] === 'setOptionCallback') { + continue; + } + if (typeof NETDATA.localStorage.default[i] === 'undefined') { + continue; + } + if (NETDATA.options.current[i] === NETDATA.localStorage.default[i]) { + continue; } - if(ret.available.length === 0) { - if(ret.copy_theme === true || ret.custom.length === 0) { - // copy the theme colors - len = NETDATA.themes.current.colors.length; - while (len--) - ret.available.unshift(NETDATA.themes.current.colors[len]); - } - - // copy the custom colors - len = ret.custom.length; - while (len--) - ret.available.unshift(ret.custom[len]); + NETDATA.setOption(a[1], NETDATA.localStorage.default[i]); + } else if (a[0] === 'chart_heights') { + if (typeof NETDATA.localStorage.callback[i] === 'function' && typeof NETDATA.localStorage.default[i] !== 'undefined') { + NETDATA.localStorage.callback[i](NETDATA.localStorage.default[i]); } + } + } - state.colors_assigned = ret.assigned; - state.colors_available = ret.available; - state.colors_custom = ret.custom; + NETDATA.dateTime.init(NETDATA.options.current.timezone); +}; - return ret; - }, +// *** src/dashboard.js/timeout.js - __read_custom_colors: function(state, ret) { - // add the user supplied colors - var c = NETDATA.dataAttribute(state.element, 'colors', undefined); - if (typeof c === 'string' && c.length > 0) { - c = c.split(' '); - var len = c.length; +// TODO: Better name needed - if (len > 0 && c[len - 1] === 'ONLY') { - len--; - ret.copy_theme = false; - } +NETDATA.timeout = { + // by default, these are just wrappers to setTimeout() / clearTimeout() - while (len--) - ret.custom.unshift(c[len]); - } - }, + step: function (callback) { + return window.setTimeout(callback, 1000 / 60); + }, + + set: function (callback, delay) { + return window.setTimeout(callback, delay); + }, - prepare: function(state) { - var has_custom_colors = false; + clear: function (id) { + return window.clearTimeout(id); + }, - if(typeof state.tmp.__commonColors === 'undefined') { - var defname = state.chart.context; + init: function () { + let custom = true; + + if (window.requestAnimationFrame) { + this.step = function (callback) { + return window.requestAnimationFrame(callback); + }; - // if this chart has data-colors="" - // we should use the chart uuid as the default key (private palette) - // (data-common-colors="NAME" will be used anyways) - var c = NETDATA.dataAttribute(state.element, 'colors', undefined); - if (typeof c === 'string' && c.length > 0) { - defname = state.uuid; - has_custom_colors = true; + this.clear = function (handle) { + return window.cancelAnimationFrame(handle.value); + }; + // } else if (window.webkitRequestAnimationFrame) { + // this.step = function (callback) { + // return window.webkitRequestAnimationFrame(callback); + // }; + + // if (window.webkitCancelAnimationFrame) { + // this.clear = function (handle) { + // return window.webkitCancelAnimationFrame(handle.value); + // }; + // } else if (window.webkitCancelRequestAnimationFrame) { + // this.clear = function (handle) { + // return window.webkitCancelRequestAnimationFrame(handle.value); + // }; + // } + // } else if (window.mozRequestAnimationFrame) { + // this.step = function (callback) { + // return window.mozRequestAnimationFrame(callback); + // }; + + // this.clear = function (handle) { + // return window.mozCancelRequestAnimationFrame(handle.value); + // }; + // } else if (window.oRequestAnimationFrame) { + // this.step = function (callback) { + // return window.oRequestAnimationFrame(callback); + // }; + + // this.clear = function (handle) { + // return window.oCancelRequestAnimationFrame(handle.value); + // }; + // } else if (window.msRequestAnimationFrame) { + // this.step = function (callback) { + // return window.msRequestAnimationFrame(callback); + // }; + + // this.clear = function (handle) { + // return window.msCancelRequestAnimationFrame(handle.value); + // }; + } else { + custom = false; + } + + if (custom) { + // we have installed custom .step() / .clear() functions + // overwrite the .set() too + + this.set = function (callback, delay) { + let start = Date.now(), + handle = new Object(); + + const loop = () => { + let current = Date.now(), + delta = current - start; + + if (delta >= delay) { + callback.call(); + } else { + handle.value = this.step(loop); + } } - // get the commonColors setting - state.tmp.__commonColors = NETDATA.dataAttribute(state.element, 'common-colors', defname); - } + handle.value = this.step(loop); + return handle; + }; + } + } +}; + +NETDATA.timeout.init(); + +NETDATA.themes = { + white: { + bootstrap_css: NETDATA.serverStatic + 'css/bootstrap-3.3.7.css', + dashboard_css: NETDATA.serverStatic + 'dashboard.css?v20180210-1', + background: '#FFFFFF', + foreground: '#000000', + grid: '#F0F0F0', + axis: '#F0F0F0', + highlight: '#F5F5F5', + colors: ['#3366CC', '#DC3912', '#109618', '#FF9900', '#990099', '#DD4477', + '#3B3EAC', '#66AA00', '#0099C6', '#B82E2E', '#AAAA11', '#5574A6', + '#994499', '#22AA99', '#6633CC', '#E67300', '#316395', '#8B0707', + '#329262', '#3B3EAC'], + easypiechart_track: '#f0f0f0', + easypiechart_scale: '#dfe0e0', + gauge_pointer: '#C0C0C0', + gauge_stroke: '#F0F0F0', + gauge_gradient: false, + d3pie: { + title: '#333333', + subtitle: '#666666', + footer: '#888888', + other: '#aaaaaa', + mainlabel: '#333333', + percentage: '#dddddd', + value: '#aaaa22', + tooltip_bg: '#000000', + tooltip_fg: '#efefef', + segment_stroke: "#ffffff", + gradient_color: '#000000' + } + }, + slate: { + bootstrap_css: NETDATA.serverStatic + 'css/bootstrap-slate-flat-3.3.7.css?v20161229-1', + dashboard_css: NETDATA.serverStatic + 'dashboard.slate.css?v20180210-1', + background: '#272b30', + foreground: '#C8C8C8', + grid: '#283236', + axis: '#283236', + highlight: '#383838', + /* colors: [ '#55bb33', '#ff2222', '#0099C6', '#faa11b', '#adbce0', '#DDDD00', + '#4178ba', '#f58122', '#a5cc39', '#f58667', '#f5ef89', '#cf93c0', + '#a5d18a', '#b8539d', '#3954a3', '#c8a9cf', '#c7de8a', '#fad20a', + '#a6a479', '#a66da8' ], + */ + colors: ['#66AA00', '#FE3912', '#3366CC', '#D66300', '#0099C6', '#DDDD00', + '#5054e6', '#EE9911', '#BB44CC', '#e45757', '#ef0aef', '#CC7700', + '#22AA99', '#109618', '#905bfd', '#f54882', '#4381bf', '#ff3737', + '#329262', '#3B3EFF'], + easypiechart_track: '#373b40', + easypiechart_scale: '#373b40', + gauge_pointer: '#474b50', + gauge_stroke: '#373b40', + gauge_gradient: false, + d3pie: { + title: '#C8C8C8', + subtitle: '#283236', + footer: '#283236', + other: '#283236', + mainlabel: '#C8C8C8', + percentage: '#dddddd', + value: '#cccc44', + tooltip_bg: '#272b30', + tooltip_fg: '#C8C8C8', + segment_stroke: "#283236", + gradient_color: '#000000' + } + } +}; + +if (typeof netdataTheme !== 'undefined' && typeof NETDATA.themes[netdataTheme] !== 'undefined') { + NETDATA.themes.current = NETDATA.themes[netdataTheme]; +} else { + NETDATA.themes.current = NETDATA.themes.white; +} + +NETDATA.colors = NETDATA.themes.current.colors; + +// these are the colors Google Charts are using +// we have them here to attempt emulate their look and feel on the other chart libraries +// http://there4.io/2012/05/02/google-chart-color-list/ +//NETDATA.colors = [ '#3366CC', '#DC3912', '#FF9900', '#109618', '#990099', '#3B3EAC', '#0099C6', +// '#DD4477', '#66AA00', '#B82E2E', '#316395', '#994499', '#22AA99', '#AAAA11', +// '#6633CC', '#E67300', '#8B0707', '#329262', '#5574A6', '#3B3EAC' ]; + +// an alternative set +// http://www.mulinblog.com/a-color-palette-optimized-for-data-visualization/ +// (blue) (red) (orange) (green) (pink) (brown) (purple) (yellow) (gray) +//NETDATA.colors = [ '#5DA5DA', '#F15854', '#FAA43A', '#60BD68', '#F17CB0', '#B2912F', '#B276B2', '#DECF3F', '#4D4D4D' ]; +// dygraph + +NETDATA.dygraph = { + smooth: false +}; + +NETDATA.dygraphToolboxPanAndZoom = function (state, after, before) { + if (after < state.netdata_first) { + after = state.netdata_first; + } - var name = state.tmp.__commonColors; - var ret = this.keys[name]; + if (before > state.netdata_last) { + before = state.netdata_last; + } - if(typeof ret === 'undefined') { - // add our commonMax - this.keys[name] = { - assigned: {}, // name-value of dimensions and their colors - available: [], // an array of colors available to be used - custom: [], // the array of colors defined by the user - charts: {}, // the charts linked to this - copy_theme: true - }; - ret = this.keys[name]; - } + state.setMode('zoom'); + NETDATA.globalSelectionSync.stop(); + NETDATA.globalSelectionSync.delay(); + state.tmp.dygraph_user_action = true; + state.tmp.dygraph_force_zoom = true; + // state.log('toolboxPanAndZoom'); + state.updateChartPanOrZoom(after, before); + NETDATA.globalPanAndZoom.setMaster(state, after, before); +}; + +NETDATA.dygraphSetSelection = function (state, t) { + if (typeof state.tmp.dygraph_instance !== 'undefined') { + let r = state.calculateRowForTime(t); + if (r !== -1) { + state.tmp.dygraph_instance.setSelection(r); + return true; + } else { + state.tmp.dygraph_instance.clearSelection(); + state.legendShowUndefined(); + } + } - if(typeof ret.charts[state.uuid] === 'undefined') { - ret.charts[state.uuid] = state; + return false; +}; - if(has_custom_colors === true) - this.__read_custom_colors(state, ret); +NETDATA.dygraphClearSelection = function (state) { + if (typeof state.tmp.dygraph_instance !== 'undefined') { + state.tmp.dygraph_instance.clearSelection(); + } + return true; +}; + +NETDATA.dygraphSmoothInitialize = function (callback) { + $.ajax({ + url: NETDATA.dygraph_smooth_js, + cache: true, + dataType: "script", + xhrFields: {withCredentials: true} // required for the cookie + }) + .done(function () { + NETDATA.dygraph.smooth = true; + smoothPlotter.smoothing = 0.3; + }) + .fail(function () { + NETDATA.dygraph.smooth = false; + }) + .always(function () { + if (typeof callback === "function") { + return callback(); } + }); +}; - return ret; +NETDATA.dygraphInitialize = function (callback) { + if (typeof netdataNoDygraphs === 'undefined' || !netdataNoDygraphs) { + $.ajax({ + url: NETDATA.dygraph_js, + cache: true, + dataType: "script", + xhrFields: {withCredentials: true} // required for the cookie + }) + .done(function () { + NETDATA.registerChartLibrary('dygraph', NETDATA.dygraph_js); + }) + .fail(function () { + NETDATA.chartLibraries.dygraph.enabled = false; + NETDATA.error(100, NETDATA.dygraph_js); + }) + .always(function () { + if (NETDATA.chartLibraries.dygraph.enabled && NETDATA.options.current.smooth_plot) { + NETDATA.dygraphSmoothInitialize(callback); + } else if (typeof callback === "function") { + return callback(); + } + }); + } else { + NETDATA.chartLibraries.dygraph.enabled = false; + if (typeof callback === "function") { + return callback(); } - }; + } +}; - // ---------------------------------------------------------------------------------------------------------------- - // Chart Registry +NETDATA.dygraphChartUpdate = function (state, data) { + let dygraph = state.tmp.dygraph_instance; - // When multiple charts need the same chart, we avoid downloading it - // multiple times (and having it in browser memory multiple time) - // by using this registry. + if (typeof dygraph === 'undefined') { + return NETDATA.dygraphChartCreate(state, data); + } - // Every time we download a chart definition, we save it here with .add() - // Then we try to get it back with .get(). If that fails, we download it. + // when the chart is not visible, and hidden + // if there is a window resize, dygraph detects + // its element size as 0x0. + // this will make it re-appear properly - NETDATA.fixHost = function(host) { - while(host.slice(-1) === '/') - host = host.substring(0, host.length - 1); + if (state.tm.last_unhidden > state.tmp.dygraph_last_rendered) { + dygraph.resize(); + } - return host; + let options = { + file: data.result.data, + colors: state.chartColors(), + labels: data.result.labels, + //labelsDivWidth: state.chartWidth() - 70, + includeZero: state.tmp.dygraph_include_zero, + visibility: state.dimensions_visibility.selected2BooleanArray(state.data.dimension_names) }; - NETDATA.chartRegistry = { - charts: {}, - - globalReset: function() { - this.charts = {}; - }, - - add: function(host, id, data) { - if(typeof this.charts[host] === 'undefined') - this.charts[host] = {}; - - //console.log('added ' + host + '/' + id); - this.charts[host][id] = data; - }, + if (state.tmp.dygraph_chart_type === 'stacked') { + if (options.includeZero && state.dimensions_visibility.countSelected() < options.visibility.length) { + options.includeZero = 0; + } + } - get: function(host, id) { - if(typeof this.charts[host] === 'undefined') - return null; + if (!NETDATA.chartLibraries.dygraph.isSparkline(state)) { + options.ylabel = state.units_current; // (state.units_desired === 'auto')?"":state.units_current; + } - if(typeof this.charts[host][id] === 'undefined') - return null; + if (state.tmp.dygraph_force_zoom) { + if (NETDATA.options.debug.dygraph || state.debug) { + state.log('dygraphChartUpdate() forced zoom update'); + } - //console.log('cached ' + host + '/' + id); - return this.charts[host][id]; - }, + options.dateWindow = (state.requested_padding !== null) ? [state.view_after, state.view_before] : null; + //options.isZoomedIgnoreProgrammaticZoom = true; + state.tmp.dygraph_force_zoom = false; + } else if (state.current.name !== 'auto') { + if (NETDATA.options.debug.dygraph || state.debug) { + state.log('dygraphChartUpdate() loose update'); + } + } else { + if (NETDATA.options.debug.dygraph || state.debug) { + state.log('dygraphChartUpdate() strict update'); + } - downloadAll: function(host, callback) { - host = NETDATA.fixHost(host); + options.dateWindow = (state.requested_padding !== null) ? [state.view_after, state.view_before] : null; + //options.isZoomedIgnoreProgrammaticZoom = true; + } - var self = this; + options.valueRange = state.tmp.dygraph_options.valueRange; - function got_data(h, data, callback) { - if(data !== null) { - self.charts[h] = data.charts; + let oldMax = null, oldMin = null; + if (state.tmp.__commonMin !== null) { + state.data.min = state.tmp.dygraph_instance.axes_[0].extremeRange[0]; + oldMin = options.valueRange[0] = NETDATA.commonMin.get(state); + } + if (state.tmp.__commonMax !== null) { + state.data.max = state.tmp.dygraph_instance.axes_[0].extremeRange[1]; + oldMax = options.valueRange[1] = NETDATA.commonMax.get(state); + } - // update the server timezone in our options - if(typeof data.timezone === 'string') - NETDATA.options.server_timezone = data.timezone; - } - else NETDATA.error(406, h + '/api/v1/charts'); + if (state.tmp.dygraph_smooth_eligible) { + if ((NETDATA.options.current.smooth_plot && state.tmp.dygraph_options.plotter !== smoothPlotter) + || (NETDATA.options.current.smooth_plot === false && state.tmp.dygraph_options.plotter === smoothPlotter)) { + NETDATA.dygraphChartCreate(state, data); + return; + } + } - if(typeof callback === 'function') - callback(data); - } + if (netdataSnapshotData !== null && NETDATA.globalPanAndZoom.isActive() && NETDATA.globalPanAndZoom.isMaster(state) === false) { + // pan and zoom on snapshots + options.dateWindow = [NETDATA.globalPanAndZoom.force_after_ms, NETDATA.globalPanAndZoom.force_before_ms]; + //options.isZoomedIgnoreProgrammaticZoom = true; + } - if(netdataSnapshotData !== null) { - got_data(host, netdataSnapshotData.charts, callback); - } - else { - $.ajax({ - url: host + '/api/v1/charts', - async: true, - cache: false, - xhrFields: {withCredentials: true} // required for the cookie - }) - .done(function (data) { - data = NETDATA.xss.checkOptional('/api/v1/charts', data); - got_data(host, data, callback); - }) - .fail(function () { - NETDATA.error(405, host + '/api/v1/charts'); - - if (typeof callback === 'function') - callback(null); - }); - } + if (NETDATA.chartLibraries.dygraph.isLogScale(state)) { + if (Array.isArray(options.valueRange) && options.valueRange[0] <= 0) { + options.valueRange[0] = null; } - }; + } - // ---------------------------------------------------------------------------------------------------------------- - // Global Pan and Zoom on charts + dygraph.updateOptions(options); - // Using this structure are synchronize all the charts, so that - // when you pan or zoom one, all others are automatically refreshed - // to the same timespan. + let redraw = false; + if (oldMin !== null && oldMin > state.tmp.dygraph_instance.axes_[0].extremeRange[0]) { + state.data.min = state.tmp.dygraph_instance.axes_[0].extremeRange[0]; + options.valueRange[0] = NETDATA.commonMin.get(state); + redraw = true; + } + if (oldMax !== null && oldMax < state.tmp.dygraph_instance.axes_[0].extremeRange[1]) { + state.data.max = state.tmp.dygraph_instance.axes_[0].extremeRange[1]; + options.valueRange[1] = NETDATA.commonMax.get(state); + redraw = true; + } - NETDATA.globalPanAndZoom = { - seq: 0, // timestamp ms - // every time a chart is panned or zoomed - // we set the timestamp here - // then we use it as a sequence number - // to find if other charts are synchronized - // to this time-range + if (redraw) { + // state.log('forcing redraw to adapt to common- min/max'); + dygraph.updateOptions(options); + } - master: null, // the master chart (state), to which all others - // are synchronized + state.tmp.dygraph_last_rendered = Date.now(); + return true; +}; - force_before_ms: null, // the timespan to sync all other charts - force_after_ms: null, +NETDATA.dygraphChartCreate = function (state, data) { + if (NETDATA.options.debug.dygraph || state.debug) { + state.log('dygraphChartCreate()'); + } - callback: null, + state.tmp.dygraph_chart_type = NETDATA.dataAttribute(state.element, 'dygraph-type', state.chart.chart_type); + if (state.tmp.dygraph_chart_type === 'stacked' && data.dimensions === 1) { + state.tmp.dygraph_chart_type = 'area'; + } + if (state.tmp.dygraph_chart_type === 'stacked' && NETDATA.chartLibraries.dygraph.isLogScale(state)) { + state.tmp.dygraph_chart_type = 'area'; + } - globalReset: function() { - this.clearMaster(); - this.seq = 0; - this.master = null; - this.force_after_ms = null; - this.force_before_ms = null; - this.callback = null; - }, + let highlightCircleSize = NETDATA.chartLibraries.dygraph.isSparkline(state) ? 3 : 4; + + let smooth = NETDATA.dygraph.smooth + ? (NETDATA.dataAttributeBoolean(state.element, 'dygraph-smooth', (state.tmp.dygraph_chart_type === 'line' && NETDATA.chartLibraries.dygraph.isSparkline(state) === false))) + : false; + + state.tmp.dygraph_include_zero = NETDATA.dataAttribute(state.element, 'dygraph-includezero', (state.tmp.dygraph_chart_type === 'stacked')); + let drawAxis = NETDATA.dataAttributeBoolean(state.element, 'dygraph-drawaxis', true); + + state.tmp.dygraph_options = { + colors: NETDATA.dataAttribute(state.element, 'dygraph-colors', state.chartColors()), + + // leave a few pixels empty on the right of the chart + rightGap: NETDATA.dataAttribute(state.element, 'dygraph-rightgap', 5), + showRangeSelector: NETDATA.dataAttributeBoolean(state.element, 'dygraph-showrangeselector', false), + showRoller: NETDATA.dataAttributeBoolean(state.element, 'dygraph-showroller', false), + title: NETDATA.dataAttribute(state.element, 'dygraph-title', state.title), + titleHeight: NETDATA.dataAttribute(state.element, 'dygraph-titleheight', 19), + legend: NETDATA.dataAttribute(state.element, 'dygraph-legend', 'always'), // we need this to get selection events + labels: data.result.labels, + labelsDiv: NETDATA.dataAttribute(state.element, 'dygraph-labelsdiv', state.element_legend_childs.hidden), + //labelsDivStyles: NETDATA.dataAttribute(state.element, 'dygraph-labelsdivstyles', { 'fontSize':'1px' }), + //labelsDivWidth: NETDATA.dataAttribute(state.element, 'dygraph-labelsdivwidth', state.chartWidth() - 70), + labelsSeparateLines: NETDATA.dataAttributeBoolean(state.element, 'dygraph-labelsseparatelines', true), + labelsShowZeroValues: NETDATA.chartLibraries.dygraph.isLogScale(state) ? false : NETDATA.dataAttributeBoolean(state.element, 'dygraph-labelsshowzerovalues', true), + labelsKMB: false, + labelsKMG2: false, + showLabelsOnHighlight: NETDATA.dataAttributeBoolean(state.element, 'dygraph-showlabelsonhighlight', true), + hideOverlayOnMouseOut: NETDATA.dataAttributeBoolean(state.element, 'dygraph-hideoverlayonmouseout', true), + includeZero: state.tmp.dygraph_include_zero, + xRangePad: NETDATA.dataAttribute(state.element, 'dygraph-xrangepad', 0), + yRangePad: NETDATA.dataAttribute(state.element, 'dygraph-yrangepad', 1), + valueRange: NETDATA.dataAttribute(state.element, 'dygraph-valuerange', [null, null]), + ylabel: state.units_current, // (state.units_desired === 'auto')?"":state.units_current, + yLabelWidth: NETDATA.dataAttribute(state.element, 'dygraph-ylabelwidth', 12), + + // the function to plot the chart + plotter: null, + + // The width of the lines connecting data points. + // This can be used to increase the contrast or some graphs. + strokeWidth: NETDATA.dataAttribute(state.element, 'dygraph-strokewidth', ((state.tmp.dygraph_chart_type === 'stacked') ? 0.1 : ((smooth === true) ? 1.5 : 0.7))), + strokePattern: NETDATA.dataAttribute(state.element, 'dygraph-strokepattern', undefined), + + // The size of the dot to draw on each point in pixels (see drawPoints). + // A dot is always drawn when a point is "isolated", + // i.e. there is a missing point on either side of it. + // This also controls the size of those dots. + drawPoints: NETDATA.dataAttributeBoolean(state.element, 'dygraph-drawpoints', false), + + // Draw points at the edges of gaps in the data. + // This improves visibility of small data segments or other data irregularities. + drawGapEdgePoints: NETDATA.dataAttributeBoolean(state.element, 'dygraph-drawgapedgepoints', true), + connectSeparatedPoints: NETDATA.chartLibraries.dygraph.isLogScale(state) ? false : NETDATA.dataAttributeBoolean(state.element, 'dygraph-connectseparatedpoints', false), + pointSize: NETDATA.dataAttribute(state.element, 'dygraph-pointsize', 1), + + // enabling this makes the chart with little square lines + stepPlot: NETDATA.dataAttributeBoolean(state.element, 'dygraph-stepplot', false), + + // Draw a border around graph lines to make crossing lines more easily + // distinguishable. Useful for graphs with many lines. + strokeBorderColor: NETDATA.dataAttribute(state.element, 'dygraph-strokebordercolor', NETDATA.themes.current.background), + strokeBorderWidth: NETDATA.dataAttribute(state.element, 'dygraph-strokeborderwidth', (state.tmp.dygraph_chart_type === 'stacked') ? 0.0 : 0.0), + fillGraph: NETDATA.dataAttribute(state.element, 'dygraph-fillgraph', (state.tmp.dygraph_chart_type === 'area' || state.tmp.dygraph_chart_type === 'stacked')), + fillAlpha: NETDATA.dataAttribute(state.element, 'dygraph-fillalpha', + ((state.tmp.dygraph_chart_type === 'stacked') + ? NETDATA.options.current.color_fill_opacity_stacked + : NETDATA.options.current.color_fill_opacity_area) + ), + stackedGraph: NETDATA.dataAttribute(state.element, 'dygraph-stackedgraph', (state.tmp.dygraph_chart_type === 'stacked')), + stackedGraphNaNFill: NETDATA.dataAttribute(state.element, 'dygraph-stackedgraphnanfill', 'none'), + drawAxis: drawAxis, + axisLabelFontSize: NETDATA.dataAttribute(state.element, 'dygraph-axislabelfontsize', 10), + axisLineColor: NETDATA.dataAttribute(state.element, 'dygraph-axislinecolor', NETDATA.themes.current.axis), + axisLineWidth: NETDATA.dataAttribute(state.element, 'dygraph-axislinewidth', 1.0), + drawGrid: NETDATA.dataAttributeBoolean(state.element, 'dygraph-drawgrid', true), + gridLinePattern: NETDATA.dataAttribute(state.element, 'dygraph-gridlinepattern', null), + gridLineWidth: NETDATA.dataAttribute(state.element, 'dygraph-gridlinewidth', 1.0), + gridLineColor: NETDATA.dataAttribute(state.element, 'dygraph-gridlinecolor', NETDATA.themes.current.grid), + maxNumberWidth: NETDATA.dataAttribute(state.element, 'dygraph-maxnumberwidth', 8), + sigFigs: NETDATA.dataAttribute(state.element, 'dygraph-sigfigs', null), + digitsAfterDecimal: NETDATA.dataAttribute(state.element, 'dygraph-digitsafterdecimal', 2), + valueFormatter: NETDATA.dataAttribute(state.element, 'dygraph-valueformatter', undefined), + highlightCircleSize: NETDATA.dataAttribute(state.element, 'dygraph-highlightcirclesize', highlightCircleSize), + highlightSeriesOpts: NETDATA.dataAttribute(state.element, 'dygraph-highlightseriesopts', null), // TOO SLOW: { strokeWidth: 1.5 }, + highlightSeriesBackgroundAlpha: NETDATA.dataAttribute(state.element, 'dygraph-highlightseriesbackgroundalpha', null), // TOO SLOW: (state.tmp.dygraph_chart_type === 'stacked')?0.7:0.5, + pointClickCallback: NETDATA.dataAttribute(state.element, 'dygraph-pointclickcallback', undefined), + visibility: state.dimensions_visibility.selected2BooleanArray(state.data.dimension_names), + logscale: NETDATA.chartLibraries.dygraph.isLogScale(state) ? 'y' : undefined, + + axes: { + x: { + pixelsPerLabel: NETDATA.dataAttribute(state.element, 'dygraph-xpixelsperlabel', 50), + ticker: Dygraph.dateTicker, + axisLabelWidth: NETDATA.dataAttribute(state.element, 'dygraph-xaxislabelwidth', 60), + drawAxis: NETDATA.dataAttributeBoolean(state.element, 'dygraph-drawxaxis', drawAxis), + axisLabelFormatter: function (d, gran) { + void(gran); + return NETDATA.dateTime.xAxisTimeString(d); + } + }, + y: { + logscale: NETDATA.chartLibraries.dygraph.isLogScale(state) ? true : undefined, + pixelsPerLabel: NETDATA.dataAttribute(state.element, 'dygraph-ypixelsperlabel', 15), + axisLabelWidth: NETDATA.dataAttribute(state.element, 'dygraph-yaxislabelwidth', 50), + drawAxis: NETDATA.dataAttributeBoolean(state.element, 'dygraph-drawyaxis', drawAxis), + axisLabelFormatter: function (y) { + + // unfortunately, we have to call this every single time + state.legendFormatValueDecimalsFromMinMax( + this.axes_[0].extremeRange[0], + this.axes_[0].extremeRange[1] + ); - delay: function() { - if(NETDATA.options.debug.globalPanAndZoom === true) - console.log('globalPanAndZoom.delay()'); + let old_units = this.user_attrs_.ylabel; + let v = state.legendFormatValue(y); + let new_units = state.units_current; + + if (state.units_desired === 'auto' && typeof old_units !== 'undefined' && new_units !== old_units && !NETDATA.chartLibraries.dygraph.isSparkline(state)) { + // console.log(this); + // state.log('units discrepancy: old = ' + old_units + ', new = ' + new_units); + let len = this.plugins_.length; + while (len--) { + // console.log(this.plugins_[len]); + if (typeof this.plugins_[len].plugin.ylabel_div_ !== 'undefined' + && this.plugins_[len].plugin.ylabel_div_ !== null + && typeof this.plugins_[len].plugin.ylabel_div_.children !== 'undefined' + && this.plugins_[len].plugin.ylabel_div_.children !== null + && typeof this.plugins_[len].plugin.ylabel_div_.children[0].children !== 'undefined' + && this.plugins_[len].plugin.ylabel_div_.children[0].children !== null + ) { + this.plugins_[len].plugin.ylabel_div_.children[0].children[0].innerHTML = new_units; + this.user_attrs_.ylabel = new_units; + break; + } + } + + if (len < 0) { + state.log('units discrepancy, but cannot find dygraphs div to change: old = ' + old_units + ', new = ' + new_units); + } + } - NETDATA.options.auto_refresher_stop_until = Date.now() + NETDATA.options.current.global_pan_sync_time; + return v; + } + } }, + legendFormatter: function (data) { + if (state.tmp.dygraph_mouse_down) { + return; + } - // set a new master - setMaster: function(state, after, before) { - this.delay(); + let elements = state.element_legend_childs; - if(NETDATA.options.current.sync_pan_and_zoom === false) + // if the hidden div is not there + // we are not managing the legend + if (elements.hidden === null) { return; - - if(this.master === null) { - if(NETDATA.options.debug.globalPanAndZoom === true) - console.log('globalPanAndZoom.setMaster(' + state.id + ', ' + after + ', ' + before + ') SET MASTER'); } - else if(this.master !== state) { - if(NETDATA.options.debug.globalPanAndZoom === true) - console.log('globalPanAndZoom.setMaster(' + state.id + ', ' + after + ', ' + before + ') CHANGED MASTER'); - this.master.resetChart(true, true); + if (typeof data.x !== 'undefined') { + state.legendSetDate(data.x); + let i = data.series.length; + while (i--) { + let series = data.series[i]; + if (series.isVisible) { + state.legendSetLabelValue(series.label, series.y); + } else { + state.legendSetLabelValue(series.label, null); + } + } } - var now = Date.now(); - this.master = state; - this.seq = now; - this.force_after_ms = after; - this.force_before_ms = before; - - if(typeof this.callback === 'function') - this.callback(true, after, before); + return ''; }, + drawCallback: function (dygraph, is_initial) { - // clear the master - clearMaster: function() { - if(NETDATA.options.debug.globalPanAndZoom === true) - console.log('globalPanAndZoom.clearMaster()'); + // the user has panned the chart and this is called to re-draw the chart + // 1. refresh this chart by adding data to it + // 2. notify all the other charts about the update they need - if(this.master !== null) { - var st = this.master; - this.master = null; - st.resetChart(); - } + // to prevent an infinite loop (feedback), we use + // state.tmp.dygraph_user_action + // - when true, this is initiated by a user + // - when false, this is feedback - this.master = null; - this.seq = 0; - this.force_after_ms = null; - this.force_before_ms = null; - NETDATA.options.auto_refresher_stop_until = 0; + if (state.current.name !== 'auto' && state.tmp.dygraph_user_action) { + state.tmp.dygraph_user_action = false; - if(typeof this.callback === 'function') - this.callback(false, 0, 0); - }, + let x_range = dygraph.xAxisRange(); + let after = Math.round(x_range[0]); + let before = Math.round(x_range[1]); - // is the given state the master of the global - // pan and zoom sync? - isMaster: function(state) { - return (this.master === state); - }, + if (NETDATA.options.debug.dygraph) { + state.log('dygraphDrawCallback(dygraph, ' + is_initial + '): mode ' + state.current.name + ' ' + (after / 1000).toString() + ' - ' + (before / 1000).toString()); + //console.log(state); + } - // are we currently have a global pan and zoom sync? - isActive: function() { - return (this.master !== null && this.force_before_ms !== null && this.force_after_ms !== null && this.seq !== 0); + if (before <= state.netdata_last && after >= state.netdata_first) { + // update only when we are within the data limits + state.updateChartPanOrZoom(after, before); + } + } }, + zoomCallback: function (minDate, maxDate, yRanges) { - // check if a chart, other than the master - // needs to be refreshed, due to the global pan and zoom - shouldBeAutoRefreshed: function(state) { - if(this.master === null || this.seq === 0) - return false; + // the user has selected a range on the chart + // 1. refresh this chart by adding data to it + // 2. notify all the other charts about the update they need - //if(state.needsRecreation()) - // return true; + void(yRanges); - return (state.tm.pan_and_zoom_seq !== this.seq); - } - }; + if (NETDATA.options.debug.dygraph) { + state.log('dygraphZoomCallback(): ' + state.current.name); + } - // ---------------------------------------------------------------------------------------------------------------- - // global chart underlay (time-frame highlighting) - - NETDATA.globalChartUnderlay = { - callback: null, // what to call when a highlighted range is setup - after: null, // highlight after this time - before: null, // highlight before this time - view_after: null, // the charts after_ms viewport when the highlight was setup - view_before: null, // the charts before_ms viewport, when the highlight was setup - state: null, // the chart the highlight was setup - - isActive: function() { - return (this.after !== null && this.before !== null); - }, + NETDATA.globalSelectionSync.stop(); + NETDATA.globalSelectionSync.delay(); + state.setMode('zoom'); - hasViewport: function() { - return (this.state !== null && this.view_after !== null && this.view_before !== null); + // refresh it to the greatest possible zoom level + state.tmp.dygraph_user_action = true; + state.tmp.dygraph_force_zoom = true; + state.updateChartPanOrZoom(minDate, maxDate); }, + highlightCallback: function (event, x, points, row, seriesName) { + void(seriesName); - init: function(state, after, before, view_after, view_before) { - this.state = (typeof state !== 'undefined') ? state : null; - this.after = (typeof after !== 'undefined' && after !== null && after > 0) ? after : null; - this.before = (typeof before !== 'undefined' && before !== null && before > 0) ? before : null; - this.view_after = (typeof view_after !== 'undefined' && view_after !== null && view_after > 0) ? view_after : null; - this.view_before = (typeof view_before !== 'undefined' && view_before !== null && view_before > 0) ? view_before : null; - }, + state.pauseChart(); - setup: function() { - if(this.isActive() === true) { - if (this.state === null) - this.state = NETDATA.options.targets[0]; + // there is a bug in dygraph when the chart is zoomed enough + // the time it thinks is selected is wrong + // here we calculate the time t based on the row number selected + // which is ok + // let t = state.data_after + row * state.data_update_every; + // console.log('row = ' + row + ', x = ' + x + ', t = ' + t + ' ' + ((t === x)?'SAME':(Math.abs(x-t)<=state.data_update_every)?'SIMILAR':'DIFFERENT') + ', rows in db: ' + state.data_points + ' visible(x) = ' + state.timeIsVisible(x) + ' visible(t) = ' + state.timeIsVisible(t) + ' r(x) = ' + state.calculateRowForTime(x) + ' r(t) = ' + state.calculateRowForTime(t) + ' range: ' + state.data_after + ' - ' + state.data_before + ' real: ' + state.data.after + ' - ' + state.data.before + ' every: ' + state.data_update_every); - if (typeof this.callback === 'function') - this.callback(true, this.after, this.before); - } - else { - if (typeof this.callback === 'function') - this.callback(false, 0, 0); + if (state.tmp.dygraph_mouse_down !== true) { + NETDATA.globalSelectionSync.sync(state, x); } + + // fix legend zIndex using the internal structures of dygraph legend module + // this works, but it is a hack! + // state.tmp.dygraph_instance.plugins_[0].plugin.legend_div_.style.zIndex = 10000; }, + unhighlightCallback: function (event) { + void(event); - set: function(state, after, before, view_after, view_before) { - if(after > before) { - var t = after; - after = before; - before = t; + if (state.tmp.dygraph_mouse_down) { + return; } - this.init(state, after, before, view_after, view_before); - - if (this.hasViewport() === true) - NETDATA.globalPanAndZoom.setMaster(this.state, this.view_after, this.view_before); + if (NETDATA.options.debug.dygraph || state.debug) { + state.log('dygraphUnhighlightCallback()'); + } - this.setup(); + state.unpauseChart(); + NETDATA.globalSelectionSync.stop(); }, + underlayCallback: function (canvas, area, g) { - clear: function() { - this.after = null; - this.before = null; - this.state = null; - this.view_after = null; - this.view_before = null; + // the chart is about to be drawn + // this function renders global highlighted time-frame - if(typeof this.callback === 'function') - this.callback(false, 0, 0); - }, + if (NETDATA.globalChartUnderlay.isActive()) { + let after = NETDATA.globalChartUnderlay.after; + let before = NETDATA.globalChartUnderlay.before; - focus: function() { - if(this.isActive() === true && this.hasViewport() === true) { - if(this.state === null) - this.state = NETDATA.options.targets[0]; + if (after < state.view_after) { + after = state.view_after; + } + + if (before > state.view_before) { + before = state.view_before; + } + + if (after < before) { + let bottom_left = g.toDomCoords(after, -20); + let top_right = g.toDomCoords(before, +20); - if(NETDATA.globalPanAndZoom.isMaster(this.state) === true) - NETDATA.globalPanAndZoom.clearMaster(); + let left = bottom_left[0]; + let right = top_right[0]; - NETDATA.globalPanAndZoom.setMaster(this.state, this.view_after, this.view_before, true); + canvas.fillStyle = NETDATA.themes.current.highlight; + canvas.fillRect(left, area.y, right - left, area.h); + } } - } - }; + }, + interactionModel: { + mousedown: function (event, dygraph, context) { + if (NETDATA.options.debug.dygraph || state.debug) { + state.log('interactionModel.mousedown()'); + } - // ---------------------------------------------------------------------------------------------------------------- - // dimensions selection + state.tmp.dygraph_user_action = true; - // TODO - // move color assignment to dimensions, here + if (NETDATA.options.debug.dygraph) { + state.log('dygraphMouseDown()'); + } - var dimensionStatus = function(parent, label, name_div, value_div, color) { - this.enabled = false; - this.parent = parent; - this.label = label; - this.name_div = null; - this.value_div = null; - this.color = NETDATA.themes.current.foreground; - this.selected = (parent.unselected_count === 0); - - this.setOptions(name_div, value_div, color); - }; + // Right-click should not initiate anything. + if (event.button && event.button === 2) { + return; + } - dimensionStatus.prototype.invalidate = function() { - this.name_div = null; - this.value_div = null; - this.enabled = false; - }; + NETDATA.globalSelectionSync.stop(); + NETDATA.globalSelectionSync.delay(); - dimensionStatus.prototype.setOptions = function(name_div, value_div, color) { - this.color = color; + state.tmp.dygraph_mouse_down = true; + context.initializeMouseDown(event, dygraph, context); - if(this.name_div !== name_div) { - this.name_div = name_div; - this.name_div.title = this.label; - this.name_div.style.setProperty('color', this.color, 'important'); - if(this.selected === false) - this.name_div.className = 'netdata-legend-name not-selected'; - else - this.name_div.className = 'netdata-legend-name selected'; - } + //console.log(event); + if (event.button && event.button === 1) { + if (event.shiftKey) { + //console.log('middle mouse button dragging (PAN)'); - if(this.value_div !== value_div) { - this.value_div = value_div; - this.value_div.title = this.label; - this.value_div.style.setProperty('color', this.color, 'important'); - if(this.selected === false) - this.value_div.className = 'netdata-legend-value not-selected'; - else - this.value_div.className = 'netdata-legend-value selected'; - } + state.setMode('pan'); + // NETDATA.globalSelectionSync.delay(); + state.tmp.dygraph_highlight_after = null; + Dygraph.startPan(event, dygraph, context); + } else if (event.altKey || event.ctrlKey || event.metaKey) { + //console.log('middle mouse button highlight'); - this.enabled = true; - this.setHandler(); - }; + if (!(event.offsetX && event.offsetY)) { + event.offsetX = event.layerX - event.target.offsetLeft; + event.offsetY = event.layerY - event.target.offsetTop; + } + state.tmp.dygraph_highlight_after = dygraph.toDataXCoord(event.offsetX); + Dygraph.startZoom(event, dygraph, context); + } else { + //console.log('middle mouse button selection for zoom (ZOOM)'); - dimensionStatus.prototype.setHandler = function() { - if(this.enabled === false) return; + state.setMode('zoom'); + // NETDATA.globalSelectionSync.delay(); + state.tmp.dygraph_highlight_after = null; + Dygraph.startZoom(event, dygraph, context); + } + } else { + if (event.shiftKey) { + //console.log('left mouse button selection for zoom (ZOOM)'); - var ds = this; + state.setMode('zoom'); + // NETDATA.globalSelectionSync.delay(); + state.tmp.dygraph_highlight_after = null; + Dygraph.startZoom(event, dygraph, context); + } else if (event.altKey || event.ctrlKey || event.metaKey) { + //console.log('left mouse button highlight'); - // this.name_div.onmousedown = this.value_div.onmousedown = function(e) { - this.name_div.onclick = this.value_div.onclick = function(e) { - e.preventDefault(); - if(ds.isSelected()) { - // this is selected - if(e.shiftKey === true || e.ctrlKey === true) { - // control or shift key is pressed -> unselect this (except is none will remain selected, in which case select all) - ds.unselect(); + if (!(event.offsetX && event.offsetY)) { + event.offsetX = event.layerX - event.target.offsetLeft; + event.offsetY = event.layerY - event.target.offsetTop; + } + state.tmp.dygraph_highlight_after = dygraph.toDataXCoord(event.offsetX); + Dygraph.startZoom(event, dygraph, context); + } else { + //console.log('left mouse button dragging (PAN)'); - if(ds.parent.countSelected() === 0) - ds.parent.selectAll(); - } - else { - // no key is pressed -> select only this (except if it is the only selected already, in which case select all) - if(ds.parent.countSelected() === 1) { - ds.parent.selectAll(); - } - else { - ds.parent.selectNone(); - ds.select(); + state.setMode('pan'); + // NETDATA.globalSelectionSync.delay(); + state.tmp.dygraph_highlight_after = null; + Dygraph.startPan(event, dygraph, context); } } - } - else { - // this is not selected - if(e.shiftKey === true || e.ctrlKey === true) { - // control or shift key is pressed -> select this too - ds.select(); - } - else { - // no key is pressed -> select only this - ds.parent.selectNone(); - ds.select(); + }, + mousemove: function (event, dygraph, context) { + if (NETDATA.options.debug.dygraph || state.debug) { + state.log('interactionModel.mousemove()'); } - } - ds.parent.state.redrawChart(); - } - }; - - dimensionStatus.prototype.select = function() { - if(this.enabled === false) return; - - this.name_div.className = 'netdata-legend-name selected'; - this.value_div.className = 'netdata-legend-value selected'; - this.selected = true; - }; + if (state.tmp.dygraph_highlight_after !== null) { + //console.log('highlight selection...'); - dimensionStatus.prototype.unselect = function() { - if(this.enabled === false) return; - - this.name_div.className = 'netdata-legend-name not-selected'; - this.value_div.className = 'netdata-legend-value hidden'; - this.selected = false; - }; + NETDATA.globalSelectionSync.stop(); + NETDATA.globalSelectionSync.delay(); - dimensionStatus.prototype.isSelected = function() { - return(this.enabled === true && this.selected === true); - }; + state.tmp.dygraph_user_action = true; + Dygraph.moveZoom(event, dygraph, context); + event.preventDefault(); + } else if (context.isPanning) { + //console.log('panning...'); - // ---------------------------------------------------------------------------------------------------------------- + NETDATA.globalSelectionSync.stop(); + NETDATA.globalSelectionSync.delay(); - var dimensionsVisibility = function(state) { - this.state = state; - this.len = 0; - this.dimensions = {}; - this.selected_count = 0; - this.unselected_count = 0; - }; + state.tmp.dygraph_user_action = true; + //NETDATA.globalSelectionSync.stop(); + //NETDATA.globalSelectionSync.delay(); + state.setMode('pan'); + context.is2DPan = false; + Dygraph.movePan(event, dygraph, context); + } else if (context.isZooming) { + //console.log('zooming...'); - dimensionsVisibility.prototype.dimensionAdd = function(label, name_div, value_div, color) { - if(typeof this.dimensions[label] === 'undefined') { - this.len++; - this.dimensions[label] = new dimensionStatus(this, label, name_div, value_div, color); - } - else - this.dimensions[label].setOptions(name_div, value_div, color); + NETDATA.globalSelectionSync.stop(); + NETDATA.globalSelectionSync.delay(); - return this.dimensions[label]; - }; + state.tmp.dygraph_user_action = true; + //NETDATA.globalSelectionSync.stop(); + //NETDATA.globalSelectionSync.delay(); + state.setMode('zoom'); + Dygraph.moveZoom(event, dygraph, context); + } + }, + mouseup: function (event, dygraph, context) { + state.tmp.dygraph_mouse_down = false; - dimensionsVisibility.prototype.dimensionGet = function(label) { - return this.dimensions[label]; - }; + if (NETDATA.options.debug.dygraph || state.debug) { + state.log('interactionModel.mouseup()'); + } - dimensionsVisibility.prototype.invalidateAll = function() { - var keys = Object.keys(this.dimensions); - var len = keys.length; - while(len--) - this.dimensions[keys[len]].invalidate(); - }; + if (state.tmp.dygraph_highlight_after !== null) { + //console.log('done highlight selection'); - dimensionsVisibility.prototype.selectAll = function() { - var keys = Object.keys(this.dimensions); - var len = keys.length; - while(len--) - this.dimensions[keys[len]].select(); - }; + NETDATA.globalSelectionSync.stop(); + NETDATA.globalSelectionSync.delay(); - dimensionsVisibility.prototype.countSelected = function() { - var selected = 0; - var keys = Object.keys(this.dimensions); - var len = keys.length; - while(len--) - if(this.dimensions[keys[len]].isSelected()) selected++; + if (!(event.offsetX && event.offsetY)) { + event.offsetX = event.layerX - event.target.offsetLeft; + event.offsetY = event.layerY - event.target.offsetTop; + } - return selected; - }; + NETDATA.globalChartUnderlay.set(state + , state.tmp.dygraph_highlight_after + , dygraph.toDataXCoord(event.offsetX) + , state.view_after + , state.view_before + ); - dimensionsVisibility.prototype.selectNone = function() { - var keys = Object.keys(this.dimensions); - var len = keys.length; - while(len--) - this.dimensions[keys[len]].unselect(); - }; + state.tmp.dygraph_highlight_after = null; - dimensionsVisibility.prototype.selected2BooleanArray = function(array) { - var ret = []; - this.selected_count = 0; - this.unselected_count = 0; + context.isZooming = false; + dygraph.clearZoomRect_(); + dygraph.drawGraph_(false); - var len = array.length; - while(len--) { - var ds = this.dimensions[array[len]]; - if(typeof ds === 'undefined') { - // console.log(array[i] + ' is not found'); - ret.unshift(false); - } - else if(ds.isSelected()) { - ret.unshift(true); - this.selected_count++; - } - else { - ret.unshift(false); - this.unselected_count++; - } - } + // refresh all the charts immediately + NETDATA.options.auto_refresher_stop_until = 0; + } else if (context.isPanning) { + //console.log('done panning'); - if(this.selected_count === 0 && this.unselected_count !== 0) { - this.selectAll(); - return this.selected2BooleanArray(array); - } + NETDATA.globalSelectionSync.stop(); + NETDATA.globalSelectionSync.delay(); - return ret; - }; + state.tmp.dygraph_user_action = true; + Dygraph.endPan(event, dygraph, context); + // refresh all the charts immediately + NETDATA.options.auto_refresher_stop_until = 0; + } else if (context.isZooming) { + //console.log('done zomming'); - // ---------------------------------------------------------------------------------------------------------------- - // date/time conversion + NETDATA.globalSelectionSync.stop(); + NETDATA.globalSelectionSync.delay(); - NETDATA.dateTime = { - using_timezone: false, + state.tmp.dygraph_user_action = true; + Dygraph.endZoom(event, dygraph, context); - // these are the old netdata functions - // we fallback to these, if the new ones fail + // refresh all the charts immediately + NETDATA.options.auto_refresher_stop_until = 0; + } + }, + click: function (event, dygraph, context) { + void(dygraph); + void(context); - localeDateStringNative: function(d) { - return d.toLocaleDateString(); - }, + if (NETDATA.options.debug.dygraph || state.debug) { + state.log('interactionModel.click()'); + } - localeTimeStringNative: function(d) { - return d.toLocaleTimeString(); - }, + event.preventDefault(); + }, + dblclick: function (event, dygraph, context) { + void(event); + void(dygraph); + void(context); - xAxisTimeStringNative: function(d) { - return NETDATA.zeropad(d.getHours()) + ":" - + NETDATA.zeropad(d.getMinutes()) + ":" - + NETDATA.zeropad(d.getSeconds()); - }, + if (NETDATA.options.debug.dygraph || state.debug) { + state.log('interactionModel.dblclick()'); + } + NETDATA.resetAllCharts(state); + }, + wheel: function (event, dygraph, context) { + void(context); - // initialize the new date/time conversion - // functions. - // if this fails, we fallback to the above - init: function(timezone) { - //console.log('init with timezone: ' + timezone); + if (NETDATA.options.debug.dygraph || state.debug) { + state.log('interactionModel.wheel()'); + } - // detect browser timezone - try { - NETDATA.options.browser_timezone = Intl.DateTimeFormat().resolvedOptions().timeZone; - } - catch(e) { - console.log('failed to detect browser timezone: ' + e.toString()); - NETDATA.options.browser_timezone = 'cannot-detect-it'; - } + // Take the offset of a mouse event on the dygraph canvas and + // convert it to a pair of percentages from the bottom left. + // (Not top left, bottom is where the lower value is.) + function offsetToPercentage(g, offsetX, offsetY) { + // This is calculating the pixel offset of the leftmost date. + let xOffset = g.toDomCoords(g.xAxisRange()[0], null)[0]; + let yar0 = g.yAxisRange(0); + + // This is calculating the pixel of the highest value. (Top pixel) + let yOffset = g.toDomCoords(null, yar0[1])[1]; + + // x y w and h are relative to the corner of the drawing area, + // so that the upper corner of the drawing area is (0, 0). + let x = offsetX - xOffset; + let y = offsetY - yOffset; + + // This is computing the rightmost pixel, effectively defining the + // width. + let w = g.toDomCoords(g.xAxisRange()[1], null)[0] - xOffset; + + // This is computing the lowest pixel, effectively defining the height. + let h = g.toDomCoords(null, yar0[0])[1] - yOffset; + + // Percentage from the left. + let xPct = w === 0 ? 0 : (x / w); + // Percentage from the top. + let yPct = h === 0 ? 0 : (y / h); + + // The (1-) part below changes it from "% distance down from the top" + // to "% distance up from the bottom". + return [xPct, (1 - yPct)]; + } - var ret = false; + // Adjusts [x, y] toward each other by zoomInPercentage% + // Split it so the left/bottom axis gets xBias/yBias of that change and + // tight/top gets (1-xBias)/(1-yBias) of that change. + // + // If a bias is missing it splits it down the middle. + function zoomRange(g, zoomInPercentage, xBias, yBias) { + xBias = xBias || 0.5; + yBias = yBias || 0.5; + + function adjustAxis(axis, zoomInPercentage, bias) { + let delta = axis[1] - axis[0]; + let increment = delta * zoomInPercentage; + let foo = [increment * bias, increment * (1 - bias)]; + + return [axis[0] + foo[0], axis[1] - foo[1]]; + } - try { - var dateOptions ={ - localeMatcher: 'best fit', - formatMatcher: 'best fit', - weekday: 'short', - year: 'numeric', - month: 'short', - day: '2-digit' - }; + let yAxes = g.yAxisRanges(); + let newYAxes = []; + for (let i = 0; i < yAxes.length; i++) { + newYAxes[i] = adjustAxis(yAxes[i], zoomInPercentage, yBias); + } - var timeOptions = { - localeMatcher: 'best fit', - hour12: false, - formatMatcher: 'best fit', - hour: '2-digit', - minute: '2-digit', - second: '2-digit' - }; + return adjustAxis(g.xAxisRange(), zoomInPercentage, xBias); + } - var xAxisOptions = { - localeMatcher: 'best fit', - hour12: false, - formatMatcher: 'best fit', - hour: '2-digit', - minute: '2-digit', - second: '2-digit' - }; + if (event.altKey || event.shiftKey) { + state.tmp.dygraph_user_action = true; - if(typeof timezone === 'string' && timezone !== '' && timezone !== 'default') { - dateOptions.timeZone = timezone; - timeOptions.timeZone = timezone; - timeOptions.timeZoneName = 'short'; - xAxisOptions.timeZone = timezone; - this.using_timezone = true; - } - else { - timezone = 'default'; - this.using_timezone = false; - } + NETDATA.globalSelectionSync.stop(); + NETDATA.globalSelectionSync.delay(); - this.dateFormat = new Intl.DateTimeFormat(navigator.language, dateOptions); - this.timeFormat = new Intl.DateTimeFormat(navigator.language, timeOptions); - this.xAxisFormat = new Intl.DateTimeFormat(navigator.language, xAxisOptions); + // http://dygraphs.com/gallery/interaction-api.js + let normal_def; + if (typeof event.wheelDelta === 'number' && !isNaN(event.wheelDelta)) + // chrome + { + normal_def = event.wheelDelta / 40; + } else + // firefox + { + normal_def = event.deltaY * -1.2; + } - this.localeDateString = function(d) { - return this.dateFormat.format(d); - }; + let normal = (event.detail) ? event.detail * -1 : normal_def; + let percentage = normal / 50; - this.localeTimeString = function(d) { - return this.timeFormat.format(d); - }; + if (!(event.offsetX && event.offsetY)) { + event.offsetX = event.layerX - event.target.offsetLeft; + event.offsetY = event.layerY - event.target.offsetTop; + } - this.xAxisTimeString = function(d) { - return this.xAxisFormat.format(d); - }; + let percentages = offsetToPercentage(dygraph, event.offsetX, event.offsetY); + let xPct = percentages[0]; + let yPct = percentages[1]; - //var d = new Date(); - //var t = this.dateFormat.format(d) + ' ' + this.timeFormat.format(d) + ' ' + this.xAxisFormat.format(d); + let new_x_range = zoomRange(dygraph, percentage, xPct, yPct); + let after = new_x_range[0]; + let before = new_x_range[1]; - ret = true; - } - catch(e) { - console.log('Cannot setup Date/Time formatting: ' + e.toString()); + let first = state.netdata_first + state.data_update_every; + let last = state.netdata_last + state.data_update_every; - timezone = 'default'; - this.localeDateString = this.localeDateStringNative; - this.localeTimeString = this.localeTimeStringNative; - this.xAxisTimeString = this.xAxisTimeStringNative; - this.using_timezone = false; + if (before > last) { + after -= (before - last); + before = last; + } + if (after < first) { + after = first; + } - ret = false; - } + state.setMode('zoom'); + state.updateChartPanOrZoom(after, before, function () { + dygraph.updateOptions({dateWindow: [after, before]}); + }); - // save it - //console.log('init setOption timezone: ' + timezone); - NETDATA.setOption('timezone', timezone); + event.preventDefault(); + } + }, + touchstart: function (event, dygraph, context) { + state.tmp.dygraph_mouse_down = true; - return ret; - } - }; - NETDATA.dateTime.init(NETDATA.options.current.timezone); + if (NETDATA.options.debug.dygraph || state.debug) { + state.log('interactionModel.touchstart()'); + } + state.tmp.dygraph_user_action = true; + state.setMode('zoom'); + state.pauseChart(); - // ---------------------------------------------------------------------------------------------------------------- - // units conversion + NETDATA.globalSelectionSync.stop(); + NETDATA.globalSelectionSync.delay(); - NETDATA.unitsConversion = { - keys: {}, // keys for data-common-units - latest: {}, // latest selected units for data-common-units + Dygraph.defaultInteractionModel.touchstart(event, dygraph, context); - globalReset: function() { - this.keys = {}; - this.latest = {}; - }, + // we overwrite the touch directions at the end, to overwrite + // the internal default of dygraph + context.touchDirections = {x: true, y: false}; - scalableUnits: { - 'packets/s': { - 'pps': 1, - 'Kpps': 1000, - 'Mpps': 1000000 - }, - 'pps': { - 'pps': 1, - 'Kpps': 1000, - 'Mpps': 1000000 - }, - 'kilobits/s': { - 'bits/s': 1 / 1000, - 'kilobits/s': 1, - 'megabits/s': 1000, - 'gigabits/s': 1000000, - 'terabits/s': 1000000000 - }, - 'kilobytes/s': { - 'bytes/s': 1 / 1024, - 'kilobytes/s': 1, - 'megabytes/s': 1024, - 'gigabytes/s': 1024 * 1024, - 'terabytes/s': 1024 * 1024 * 1024 - }, - 'KB/s': { - 'B/s': 1 / 1024, - 'KB/s': 1, - 'MB/s': 1024, - 'GB/s': 1024 * 1024, - 'TB/s': 1024 * 1024 * 1024 - }, - 'KB': { - 'B': 1 / 1024, - 'KB': 1, - 'MB': 1024, - 'GB': 1024 * 1024, - 'TB': 1024 * 1024 * 1024 - }, - 'MB': { - 'B': 1 / (1024 * 1024), - 'KB': 1 / 1024, - 'MB': 1, - 'GB': 1024, - 'TB': 1024 * 1024, - 'PB': 1024 * 1024 * 1024 - }, - 'GB': { - 'B': 1 / (1024 * 1024 * 1024), - 'KB': 1 / (1024 * 1024), - 'MB': 1 / 1024, - 'GB': 1, - 'TB': 1024, - 'PB': 1024 * 1024, - 'EB': 1024 * 1024 * 1024 - } - /* - 'milliseconds': { - 'seconds': 1000 - }, - 'seconds': { - 'milliseconds': 0.001, - 'seconds': 1, - 'minutes': 60, - 'hours': 3600, - 'days': 86400 - } - */ - }, + state.dygraph_last_touch_start = Date.now(); + state.dygraph_last_touch_move = 0; - convertibleUnits: { - 'Celsius': { - 'Fahrenheit': { - check: function(max) { void(max); return NETDATA.options.current.temperature === 'fahrenheit'; }, - convert: function(value) { return value * 9 / 5 + 32; } - } - }, - 'celsius': { - 'fahrenheit': { - check: function(max) { void(max); return NETDATA.options.current.temperature === 'fahrenheit'; }, - convert: function(value) { return value * 9 / 5 + 32; } + if (typeof event.touches[0].pageX === 'number') { + state.dygraph_last_touch_page_x = event.touches[0].pageX; + } else { + state.dygraph_last_touch_page_x = 0; } }, - 'seconds': { - 'time': { - check: function (max) { void(max); return NETDATA.options.current.seconds_as_time; }, - convert: function(seconds) { return NETDATA.unitsConversion.seconds2time(seconds); } + touchmove: function (event, dygraph, context) { + if (NETDATA.options.debug.dygraph || state.debug) { + state.log('interactionModel.touchmove()'); } - }, - 'milliseconds': { - 'milliseconds': { - check: function (max) { return NETDATA.options.current.seconds_as_time && max < 1000; }, - convert: function(milliseconds) { - var tms = Math.round(milliseconds * 10); - milliseconds = Math.floor(tms / 10); - tms -= milliseconds * 10; + NETDATA.globalSelectionSync.stop(); + NETDATA.globalSelectionSync.delay(); - return (milliseconds).toString() + '.' + tms.toString(); - } - }, - 'seconds': { - check: function (max) { return NETDATA.options.current.seconds_as_time && max >= 1000 && max < 60000; }, - convert: function(milliseconds) { - milliseconds = Math.round(milliseconds); + state.tmp.dygraph_user_action = true; + Dygraph.defaultInteractionModel.touchmove(event, dygraph, context); - var seconds = Math.floor(milliseconds / 1000); - milliseconds -= seconds * 1000; + state.dygraph_last_touch_move = Date.now(); + }, + touchend: function (event, dygraph, context) { + state.tmp.dygraph_mouse_down = false; - milliseconds = Math.round(milliseconds / 10); + if (NETDATA.options.debug.dygraph || state.debug) { + state.log('interactionModel.touchend()'); + } - return seconds.toString() + '.' - + NETDATA.zeropad(milliseconds); - } - }, - 'M:SS.ms': { - check: function (max) { return NETDATA.options.current.seconds_as_time && max >= 60000; }, - convert: function(milliseconds) { - milliseconds = Math.round(milliseconds); + NETDATA.globalSelectionSync.stop(); + NETDATA.globalSelectionSync.delay(); - var minutes = Math.floor(milliseconds / 60000); - milliseconds -= minutes * 60000; + state.tmp.dygraph_user_action = true; + Dygraph.defaultInteractionModel.touchend(event, dygraph, context); - var seconds = Math.floor(milliseconds / 1000); - milliseconds -= seconds * 1000; + // if it didn't move, it is a selection + if (state.dygraph_last_touch_move === 0 && state.dygraph_last_touch_page_x !== 0) { + NETDATA.globalSelectionSync.dontSyncBefore = 0; + NETDATA.globalSelectionSync.setMaster(state); - milliseconds = Math.round(milliseconds / 10); + // internal api of dygraph + let pct = (state.dygraph_last_touch_page_x - (dygraph.plotter_.area.x + state.element.getBoundingClientRect().left)) / dygraph.plotter_.area.w; + console.log('pct: ' + pct.toString()); - return minutes.toString() + ':' - + NETDATA.zeropad(seconds) + '.' - + NETDATA.zeropad(milliseconds); + let t = Math.round(state.view_after + (state.view_before - state.view_after) * pct); + if (NETDATA.dygraphSetSelection(state, t)) { + NETDATA.globalSelectionSync.sync(state, t); } } - } - }, - seconds2time: function(seconds) { - seconds = Math.abs(seconds); - - var days = Math.floor(seconds / 86400); - seconds -= days * 86400; - - var hours = Math.floor(seconds / 3600); - seconds -= hours * 3600; - - var minutes = Math.floor(seconds / 60); - seconds -= minutes * 60; - - seconds = Math.round(seconds); - - var ms_txt = ''; - /* - var ms = seconds - Math.floor(seconds); - seconds -= ms; - ms = Math.round(ms * 1000); - - if(ms > 1) { - if(ms < 10) - ms_txt = '.00' + ms.toString(); - else if(ms < 100) - ms_txt = '.0' + ms.toString(); - else - ms_txt = '.' + ms.toString(); - } - */ - - return ((days > 0)?days.toString() + 'd:':'').toString() - + NETDATA.zeropad(hours) + ':' - + NETDATA.zeropad(minutes) + ':' - + NETDATA.zeropad(seconds) - + ms_txt; - }, + // if it was double tap within double click time, reset the charts + let now = Date.now(); + if (typeof state.dygraph_last_touch_end !== 'undefined') { + if (state.dygraph_last_touch_move === 0) { + let dt = now - state.dygraph_last_touch_end; + if (dt <= NETDATA.options.current.double_click_speed) { + NETDATA.resetAllCharts(state); + } + } + } - // get a function that converts the units - // + every time units are switched call the callback - get: function(uuid, min, max, units, desired_units, common_units_name, switch_units_callback) { - // validate the parameters - if(typeof units === 'undefined') - units = 'undefined'; + // remember the timestamp of the last touch end + state.dygraph_last_touch_end = now; - // check if we support units conversion - if(typeof this.scalableUnits[units] === 'undefined' && typeof this.convertibleUnits[units] === 'undefined') { - // we can't convert these units - //console.log('DEBUG: ' + uuid.toString() + ' can\'t convert units: ' + units.toString()); - return function(value) { return value; }; + // refresh all the charts immediately + NETDATA.options.auto_refresher_stop_until = 0; } + } + }; - // check if the caller wants the original units - if(typeof desired_units === 'undefined' || desired_units === null || desired_units === 'original' || desired_units === units) { - //console.log('DEBUG: ' + uuid.toString() + ' original units wanted'); - switch_units_callback(units); - return function(value) { return value; }; - } - - // now we know we can convert the units - // and the caller wants some kind of conversion - - var tunits = null; - var tdivider = 0; - var x; - - if(typeof this.scalableUnits[units] !== 'undefined') { - // units that can be scaled - // we decide a divider - - // console.log('NETDATA.unitsConversion.get(' + units.toString() + ', ' + desired_units.toString() + ', function()) decide divider with min = ' + min.toString() + ', max = ' + max.toString()); - - if (desired_units === 'auto') { - // the caller wants to auto-scale the units - - // find the absolute maximum value that is rendered on the chart - // based on this we decide the scale - min = Math.abs(min); - max = Math.abs(max); - if (min > max) max = min; + if (NETDATA.chartLibraries.dygraph.isLogScale(state)) { + if (Array.isArray(state.tmp.dygraph_options.valueRange) && state.tmp.dygraph_options.valueRange[0] <= 0) { + state.tmp.dygraph_options.valueRange[0] = null; + } + } - // find the smallest scale that provides integers - for (x in this.scalableUnits[units]) { - if (this.scalableUnits[units].hasOwnProperty(x)) { - var m = this.scalableUnits[units][x]; - if (m <= max && m > tdivider) { - tunits = x; - tdivider = m; - } - } - } + if (NETDATA.chartLibraries.dygraph.isSparkline(state)) { + state.tmp.dygraph_options.drawGrid = false; + state.tmp.dygraph_options.drawAxis = false; + state.tmp.dygraph_options.title = undefined; + state.tmp.dygraph_options.ylabel = undefined; + state.tmp.dygraph_options.yLabelWidth = 0; + //state.tmp.dygraph_options.labelsDivWidth = 120; + //state.tmp.dygraph_options.labelsDivStyles.width = '120px'; + state.tmp.dygraph_options.labelsSeparateLines = true; + state.tmp.dygraph_options.rightGap = 0; + state.tmp.dygraph_options.yRangePad = 1; + state.tmp.dygraph_options.axes.x.drawAxis = false; + state.tmp.dygraph_options.axes.y.drawAxis = false; + } - if(tunits === null || tdivider <= 0) { - // we couldn't find one - //console.log('DEBUG: ' + uuid.toString() + ' cannot find an auto-scaling candidate for units: ' + units.toString() + ' (max: ' + max.toString() + ')'); - switch_units_callback(units); - return function(value) { return value; }; - } + if (smooth) { + state.tmp.dygraph_smooth_eligible = true; - if(typeof common_units_name === 'string' && typeof uuid === 'string') { - // the caller wants several charts to have the same units - // data-common-units + if (NETDATA.options.current.smooth_plot) { + state.tmp.dygraph_options.plotter = smoothPlotter; + } + } + else { + state.tmp.dygraph_smooth_eligible = false; + } - var common_units_key = common_units_name + '-' + units; + if (netdataSnapshotData !== null && NETDATA.globalPanAndZoom.isActive() && NETDATA.globalPanAndZoom.isMaster(state) === false) { + // pan and zoom on snapshots + state.tmp.dygraph_options.dateWindow = [NETDATA.globalPanAndZoom.force_after_ms, NETDATA.globalPanAndZoom.force_before_ms]; + //state.tmp.dygraph_options.isZoomedIgnoreProgrammaticZoom = true; + } - // add our divider into the list of keys - var t = this.keys[common_units_key]; - if(typeof t === 'undefined') { - this.keys[common_units_key] = {}; - t = this.keys[common_units_key]; - } - t[uuid] = { - units: tunits, - divider: tdivider - }; - - // find the max divider of all charts - var common_units = t[uuid]; - for(x in t) { - if (t.hasOwnProperty(x) && t[x].divider > common_units.divider) - common_units = t[x]; - } + state.tmp.dygraph_instance = new Dygraph(state.element_chart, + data.result.data, state.tmp.dygraph_options); - // save our common_max to the latest keys - var latest = this.latest[common_units_key]; - if(typeof latest === 'undefined') { - this.latest[common_units_key] = {}; - latest = this.latest[common_units_key]; - } - latest.units = common_units.units; - latest.divider = common_units.divider; - - tunits = latest.units; - tdivider = latest.divider; - - //console.log('DEBUG: ' + uuid.toString() + ' converted units: ' + units.toString() + ' to units: ' + tunits.toString() + ' with divider ' + tdivider.toString() + ', common-units=' + common_units_name.toString() + ((t[uuid].divider !== tdivider)?' USED COMMON, mine was ' + t[uuid].units:' set common').toString()); - - // apply it to this chart - switch_units_callback(tunits); - return function(value) { - if(tdivider !== latest.divider) { - // another chart switched our common units - // we should switch them too - //console.log('DEBUG: ' + uuid + ' switching units due to a common-units change, from ' + tunits.toString() + ' to ' + latest.units.toString()); - tunits = latest.units; - tdivider = latest.divider; - switch_units_callback(tunits); - } + state.tmp.dygraph_force_zoom = false; + state.tmp.dygraph_user_action = false; + state.tmp.dygraph_last_rendered = Date.now(); + state.tmp.dygraph_highlight_after = null; - return value / tdivider; - }; - } - else { - // the caller did not give data-common-units - // this chart auto-scales independently of all others - //console.log('DEBUG: ' + uuid.toString() + ' converted units: ' + units.toString() + ' to units: ' + tunits.toString() + ' with divider ' + tdivider.toString() + ', autonomously'); + if (state.tmp.dygraph_options.valueRange[0] === null && state.tmp.dygraph_options.valueRange[1] === null) { + if (typeof state.tmp.dygraph_instance.axes_[0].extremeRange !== 'undefined') { + state.tmp.__commonMin = NETDATA.dataAttribute(state.element, 'common-min', null); + state.tmp.__commonMax = NETDATA.dataAttribute(state.element, 'common-max', null); + } else { + state.log('incompatible version of Dygraph detected'); + state.tmp.__commonMin = null; + state.tmp.__commonMax = null; + } + } else { + // if the user gave a valueRange, respect it + state.tmp.__commonMin = null; + state.tmp.__commonMax = null; + } - switch_units_callback(tunits); - return function (value) { return value / tdivider; }; - } - } - else { - // the caller wants specific units - - if(typeof this.scalableUnits[units][desired_units] !== 'undefined') { - // all good, set the new units - tdivider = this.scalableUnits[units][desired_units]; - // console.log('DEBUG: ' + uuid.toString() + ' converted units: ' + units.toString() + ' to units: ' + desired_units.toString() + ' with divider ' + tdivider.toString() + ', by reference'); - switch_units_callback(desired_units); - return function (value) { return value / tdivider; }; - } - else { - // oops! switch back to original units - console.log('Units conversion from ' + units.toString() + ' to ' + desired_units.toString() + ' is not supported.'); - switch_units_callback(units); - return function (value) { return value; }; - } - } - } - else if(typeof this.convertibleUnits[units] !== 'undefined') { - // units that can be converted - if(desired_units === 'auto') { - for(x in this.convertibleUnits[units]) { - if (this.convertibleUnits[units].hasOwnProperty(x)) { - if (this.convertibleUnits[units][x].check(max)) { - //console.log('DEBUG: ' + uuid.toString() + ' converting ' + units.toString() + ' to: ' + x.toString()); - switch_units_callback(x); - return this.convertibleUnits[units][x].convert; - } - } - } + return true; +}; +// ---------------------------------------------------------------------------------------------------------------- +// sparkline - // none checked ok - //console.log('DEBUG: ' + uuid.toString() + ' no conversion available for ' + units.toString() + ' to: ' + desired_units.toString()); - switch_units_callback(units); - return function (value) { return value; }; - } - else if(typeof this.convertibleUnits[units][desired_units] !== 'undefined') { - switch_units_callback(desired_units); - return this.convertibleUnits[units][desired_units].convert; - } - else { - console.log('Units conversion from ' + units.toString() + ' to ' + desired_units.toString() + ' is not supported.'); - switch_units_callback(units); - return function (value) { return value; }; +NETDATA.sparklineInitialize = function (callback) { + if (typeof netdataNoSparklines === 'undefined' || !netdataNoSparklines) { + $.ajax({ + url: NETDATA.sparkline_js, + cache: true, + dataType: "script", + xhrFields: {withCredentials: true} // required for the cookie + }) + .done(function () { + NETDATA.registerChartLibrary('sparkline', NETDATA.sparkline_js); + }) + .fail(function () { + NETDATA.chartLibraries.sparkline.enabled = false; + NETDATA.error(100, NETDATA.sparkline_js); + }) + .always(function () { + if (typeof callback === "function") { + return callback(); } - } - else { - // hm... did we forget to implement the new type? - console.log('Unmatched unit conversion method for units ' + units.toString()); - switch_units_callback(units); - return function (value) { return value; }; - } + }); + } else { + NETDATA.chartLibraries.sparkline.enabled = false; + if (typeof callback === "function") { + return callback(); } - }; - - // ---------------------------------------------------------------------------------------------------------------- - // global selection sync + } +}; + +NETDATA.sparklineChartUpdate = function (state, data) { + state.sparkline_options.width = state.chartWidth(); + state.sparkline_options.height = state.chartHeight(); + + $(state.element_chart).sparkline(data.result, state.sparkline_options); + return true; +}; + +NETDATA.sparklineChartCreate = function (state, data) { + let type = NETDATA.dataAttribute(state.element, 'sparkline-type', 'line'); + let lineColor = NETDATA.dataAttribute(state.element, 'sparkline-linecolor', state.chartCustomColors()[0]); + let fillColor = NETDATA.dataAttribute(state.element, 'sparkline-fillcolor', ((state.chart.chart_type === 'line') ? NETDATA.themes.current.background : NETDATA.colorLuminance(lineColor, NETDATA.chartDefaults.fill_luminance))); + let chartRangeMin = NETDATA.dataAttribute(state.element, 'sparkline-chartrangemin', undefined); + let chartRangeMax = NETDATA.dataAttribute(state.element, 'sparkline-chartrangemax', undefined); + let composite = NETDATA.dataAttribute(state.element, 'sparkline-composite', undefined); + let enableTagOptions = NETDATA.dataAttribute(state.element, 'sparkline-enabletagoptions', undefined); + let tagOptionPrefix = NETDATA.dataAttribute(state.element, 'sparkline-tagoptionprefix', undefined); + let tagValuesAttribute = NETDATA.dataAttribute(state.element, 'sparkline-tagvaluesattribute', undefined); + let disableHiddenCheck = NETDATA.dataAttribute(state.element, 'sparkline-disablehiddencheck', undefined); + let defaultPixelsPerValue = NETDATA.dataAttribute(state.element, 'sparkline-defaultpixelspervalue', undefined); + let spotColor = NETDATA.dataAttribute(state.element, 'sparkline-spotcolor', undefined); + let minSpotColor = NETDATA.dataAttribute(state.element, 'sparkline-minspotcolor', undefined); + let maxSpotColor = NETDATA.dataAttribute(state.element, 'sparkline-maxspotcolor', undefined); + let spotRadius = NETDATA.dataAttribute(state.element, 'sparkline-spotradius', undefined); + let valueSpots = NETDATA.dataAttribute(state.element, 'sparkline-valuespots', undefined); + let highlightSpotColor = NETDATA.dataAttribute(state.element, 'sparkline-highlightspotcolor', undefined); + let highlightLineColor = NETDATA.dataAttribute(state.element, 'sparkline-highlightlinecolor', undefined); + let lineWidth = NETDATA.dataAttribute(state.element, 'sparkline-linewidth', undefined); + let normalRangeMin = NETDATA.dataAttribute(state.element, 'sparkline-normalrangemin', undefined); + let normalRangeMax = NETDATA.dataAttribute(state.element, 'sparkline-normalrangemax', undefined); + let drawNormalOnTop = NETDATA.dataAttribute(state.element, 'sparkline-drawnormalontop', undefined); + let xvalues = NETDATA.dataAttribute(state.element, 'sparkline-xvalues', undefined); + let chartRangeClip = NETDATA.dataAttribute(state.element, 'sparkline-chartrangeclip', undefined); + let chartRangeMinX = NETDATA.dataAttribute(state.element, 'sparkline-chartrangeminx', undefined); + let chartRangeMaxX = NETDATA.dataAttribute(state.element, 'sparkline-chartrangemaxx', undefined); + let disableInteraction = NETDATA.dataAttributeBoolean(state.element, 'sparkline-disableinteraction', false); + let disableTooltips = NETDATA.dataAttributeBoolean(state.element, 'sparkline-disabletooltips', false); + let disableHighlight = NETDATA.dataAttributeBoolean(state.element, 'sparkline-disablehighlight', false); + let highlightLighten = NETDATA.dataAttribute(state.element, 'sparkline-highlightlighten', 1.4); + let highlightColor = NETDATA.dataAttribute(state.element, 'sparkline-highlightcolor', undefined); + let tooltipContainer = NETDATA.dataAttribute(state.element, 'sparkline-tooltipcontainer', undefined); + let tooltipClassname = NETDATA.dataAttribute(state.element, 'sparkline-tooltipclassname', undefined); + let tooltipFormat = NETDATA.dataAttribute(state.element, 'sparkline-tooltipformat', undefined); + let tooltipPrefix = NETDATA.dataAttribute(state.element, 'sparkline-tooltipprefix', undefined); + let tooltipSuffix = NETDATA.dataAttribute(state.element, 'sparkline-tooltipsuffix', ' ' + state.units_current); + let tooltipSkipNull = NETDATA.dataAttributeBoolean(state.element, 'sparkline-tooltipskipnull', true); + let tooltipValueLookups = NETDATA.dataAttribute(state.element, 'sparkline-tooltipvaluelookups', undefined); + let tooltipFormatFieldlist = NETDATA.dataAttribute(state.element, 'sparkline-tooltipformatfieldlist', undefined); + let tooltipFormatFieldlistKey = NETDATA.dataAttribute(state.element, 'sparkline-tooltipformatfieldlistkey', undefined); + let numberFormatter = NETDATA.dataAttribute(state.element, 'sparkline-numberformatter', function (n) { + return n.toFixed(2); + }); + let numberDigitGroupSep = NETDATA.dataAttribute(state.element, 'sparkline-numberdigitgroupsep', undefined); + let numberDecimalMark = NETDATA.dataAttribute(state.element, 'sparkline-numberdecimalmark', undefined); + let numberDigitGroupCount = NETDATA.dataAttribute(state.element, 'sparkline-numberdigitgroupcount', undefined); + let animatedZooms = NETDATA.dataAttributeBoolean(state.element, 'sparkline-animatedzooms', false); - NETDATA.globalSelectionSync = { - state: null, - dont_sync_before: 0, - last_t: 0, - slaves: [], - timeout_id: undefined, + if (spotColor === 'disable') { + spotColor = ''; + } + if (minSpotColor === 'disable') { + minSpotColor = ''; + } + if (maxSpotColor === 'disable') { + maxSpotColor = ''; + } - globalReset: function() { - this.stop(); - this.state = null; - this.dont_sync_before = 0; - this.last_t = 0; - this.slaves = []; - this.timeout_id = undefined; + // state.log('sparkline type ' + type + ', lineColor: ' + lineColor + ', fillColor: ' + fillColor); + + state.sparkline_options = { + type: type, + lineColor: lineColor, + fillColor: fillColor, + chartRangeMin: chartRangeMin, + chartRangeMax: chartRangeMax, + composite: composite, + enableTagOptions: enableTagOptions, + tagOptionPrefix: tagOptionPrefix, + tagValuesAttribute: tagValuesAttribute, + disableHiddenCheck: disableHiddenCheck, + defaultPixelsPerValue: defaultPixelsPerValue, + spotColor: spotColor, + minSpotColor: minSpotColor, + maxSpotColor: maxSpotColor, + spotRadius: spotRadius, + valueSpots: valueSpots, + highlightSpotColor: highlightSpotColor, + highlightLineColor: highlightLineColor, + lineWidth: lineWidth, + normalRangeMin: normalRangeMin, + normalRangeMax: normalRangeMax, + drawNormalOnTop: drawNormalOnTop, + xvalues: xvalues, + chartRangeClip: chartRangeClip, + chartRangeMinX: chartRangeMinX, + chartRangeMaxX: chartRangeMaxX, + disableInteraction: disableInteraction, + disableTooltips: disableTooltips, + disableHighlight: disableHighlight, + highlightLighten: highlightLighten, + highlightColor: highlightColor, + tooltipContainer: tooltipContainer, + tooltipClassname: tooltipClassname, + tooltipChartTitle: state.title, + tooltipFormat: tooltipFormat, + tooltipPrefix: tooltipPrefix, + tooltipSuffix: tooltipSuffix, + tooltipSkipNull: tooltipSkipNull, + tooltipValueLookups: tooltipValueLookups, + tooltipFormatFieldlist: tooltipFormatFieldlist, + tooltipFormatFieldlistKey: tooltipFormatFieldlistKey, + numberFormatter: numberFormatter, + numberDigitGroupSep: numberDigitGroupSep, + numberDecimalMark: numberDecimalMark, + numberDigitGroupCount: numberDigitGroupCount, + animatedZooms: animatedZooms, + width: state.chartWidth(), + height: state.chartHeight() + }; + + $(state.element_chart).sparkline(data.result, state.sparkline_options); + + return true; +}; +// google charts + +NETDATA.googleInitialize = function (callback) { + if (typeof netdataNoGoogleCharts === 'undefined' || !netdataNoGoogleCharts) { + $.ajax({ + url: NETDATA.google_js, + cache: true, + dataType: "script", + xhrFields: {withCredentials: true} // required for the cookie + }) + .done(function () { + NETDATA.registerChartLibrary('google', NETDATA.google_js); + google.load('visualization', '1.1', { + 'packages': ['corechart', 'controls'], + 'callback': callback + }); + }) + .fail(function () { + NETDATA.chartLibraries.google.enabled = false; + NETDATA.error(100, NETDATA.google_js); + if (typeof callback === "function") { + return callback(); + } + }); + } else { + NETDATA.chartLibraries.google.enabled = false; + if (typeof callback === "function") { + return callback(); + } + } +}; + +NETDATA.googleChartUpdate = function (state, data) { + let datatable = new google.visualization.DataTable(data.result); + state.google_instance.draw(datatable, state.google_options); + return true; +}; + +NETDATA.googleChartCreate = function (state, data) { + let datatable = new google.visualization.DataTable(data.result); + + state.google_options = { + colors: state.chartColors(), + + // do not set width, height - the chart resizes itself + //width: state.chartWidth(), + //height: state.chartHeight(), + lineWidth: 1, + title: state.title, + fontSize: 11, + hAxis: { + // title: "Time of Day", + // format:'HH:mm:ss', + viewWindowMode: 'maximized', + slantedText: false, + format: 'HH:mm:ss', + textStyle: { + fontSize: 9 + }, + gridlines: { + color: '#EEE' + } }, - - active: function() { - return (this.state !== null); + vAxis: { + title: state.units_current, + viewWindowMode: 'pretty', + minValue: -0.1, + maxValue: 0.1, + direction: 1, + textStyle: { + fontSize: 9 + }, + gridlines: { + color: '#EEE' + } }, - - // return true if global selection sync can be enabled now - enabled: function() { - // console.log('enabled()'); - // can we globally apply selection sync? - if(NETDATA.options.current.sync_selection === false) - return false; - - return (this.dont_sync_before <= Date.now()); + chartArea: { + width: '65%', + height: '80%' }, - - // set the global selection sync master - setMaster: function(state) { - if(this.enabled() === false) { - this.stop(); - return; + focusTarget: 'category', + annotation: { + '1': { + style: 'line' } + }, + pointsVisible: 0, + titlePosition: 'out', + titleTextStyle: { + fontSize: 11 + }, + tooltip: { + isHtml: false, + ignoreBounds: true, + textStyle: { + fontSize: 9 + } + }, + curveType: 'function', + areaOpacity: 0.3, + isStacked: false + }; + + switch (state.chart.chart_type) { + case "area": + state.google_options.vAxis.viewWindowMode = 'maximized'; + state.google_options.areaOpacity = NETDATA.options.current.color_fill_opacity_area; + state.google_instance = new google.visualization.AreaChart(state.element_chart); + break; + + case "stacked": + state.google_options.isStacked = true; + state.google_options.areaOpacity = NETDATA.options.current.color_fill_opacity_stacked; + state.google_options.vAxis.viewWindowMode = 'maximized'; + state.google_options.vAxis.minValue = null; + state.google_options.vAxis.maxValue = null; + state.google_instance = new google.visualization.AreaChart(state.element_chart); + break; + + default: + case "line": + state.google_options.lineWidth = 2; + state.google_instance = new google.visualization.LineChart(state.element_chart); + break; + } - if(this.state === state) - return; + state.google_instance.draw(datatable, state.google_options); + return true; +}; +// gauge.js - if(this.state !== null) - this.stop(); +NETDATA.gaugeInitialize = function (callback) { + if (typeof netdataNoGauge === 'undefined' || !netdataNoGauge) { + $.ajax({ + url: NETDATA.gauge_js, + cache: true, + dataType: "script", + xhrFields: {withCredentials: true} // required for the cookie + }) + .done(function () { + NETDATA.registerChartLibrary('gauge', NETDATA.gauge_js); + }) + .fail(function () { + NETDATA.chartLibraries.gauge.enabled = false; + NETDATA.error(100, NETDATA.gauge_js); + }) + .always(function () { + if (typeof callback === "function") { + return callback(); + } + }) + } + else { + NETDATA.chartLibraries.gauge.enabled = false; + if (typeof callback === "function") { + return callback(); + } + } +}; - if(NETDATA.options.debug.globalSelectionSync === true) - console.log('globalSelectionSync.setMaster(' + state.id + ')'); +NETDATA.gaugeAnimation = function (state, status) { + let speed = 32; - state.selected = true; - this.state = state; - this.last_t = 0; + if (typeof status === 'boolean' && status === false) { + speed = 1000000000; + } else if (typeof status === 'number') { + speed = status; + } - // find all slaves - var targets = NETDATA.intersectionObserver.targets(); - this.slaves = []; - var len = targets.length; - while(len--) { - var st = targets[len]; - if (this.state !== st && st.globalSelectionSyncIsEligible() === true) - this.slaves.push(st); - } + // console.log('gauge speed ' + speed); + state.tmp.gauge_instance.animationSpeed = speed; + state.tmp.___gaugeOld__.speed = speed; +}; - // this.delay(100); - }, +NETDATA.gaugeSet = function (state, value, min, max) { + if (typeof value !== 'number') { + value = 0; + } + if (typeof min !== 'number') { + min = 0; + } + if (typeof max !== 'number') { + max = 0; + } + if (value > max) { + max = value; + } + if (value < min) { + min = value; + } + if (min > max) { + let t = min; + min = max; + max = t; + } + else if (min === max) { + max = min + 1; + } - // stop global selection sync - stop: function() { - if(this.state !== null) { - if(NETDATA.options.debug.globalSelectionSync === true) - console.log('globalSelectionSync.stop()'); + state.legendFormatValueDecimalsFromMinMax(min, max); - var len = this.slaves.length; - while (len--) - this.slaves[len].clearSelection(); + // gauge.js has an issue if the needle + // is smaller than min or larger than max + // when we set the new values + // the needle will go crazy - this.state.clearSelection(); + // to prevent it, we always feed it + // with a percentage, so that the needle + // is always between min and max + let pcent = (value - min) * 100 / (max - min); - this.last_t = 0; - this.slaves = []; - this.state = null; - } - }, + // bug fix for gauge.js 1.3.1 + // if the value is the absolute min or max, the chart is broken + if (pcent < 0.001) { + pcent = 0.001; + } + if (pcent > 99.999) { + pcent = 99.999; + } - // delay global selection sync for some time - delay: function(ms) { - if(NETDATA.options.current.sync_selection === true) { - if(NETDATA.options.debug.globalSelectionSync === true) - console.log('globalSelectionSync.delay()'); + state.tmp.gauge_instance.set(pcent); + // console.log('gauge set ' + pcent + ', value ' + value + ', min ' + min + ', max ' + max); - if(typeof ms === 'number') - this.dont_sync_before = Date.now() + ms; - else - this.dont_sync_before = Date.now() + NETDATA.options.current.sync_selection_delay; - } - }, + state.tmp.___gaugeOld__.value = value; + state.tmp.___gaugeOld__.min = min; + state.tmp.___gaugeOld__.max = max; +}; - __syncSlaves: function() { - if(NETDATA.globalSelectionSync.enabled() === true) { - if(NETDATA.options.debug.globalSelectionSync === true) - console.log('globalSelectionSync.__syncSlaves()'); +NETDATA.gaugeSetLabels = function (state, value, min, max) { + if (state.tmp.___gaugeOld__.valueLabel !== value) { + state.tmp.___gaugeOld__.valueLabel = value; + state.tmp.gaugeChartLabel.innerText = state.legendFormatValue(value); + } + if (state.tmp.___gaugeOld__.minLabel !== min) { + state.tmp.___gaugeOld__.minLabel = min; + state.tmp.gaugeChartMin.innerText = state.legendFormatValue(min); + } + if (state.tmp.___gaugeOld__.maxLabel !== max) { + state.tmp.___gaugeOld__.maxLabel = max; + state.tmp.gaugeChartMax.innerText = state.legendFormatValue(max); + } +}; - var t = NETDATA.globalSelectionSync.last_t; - var len = NETDATA.globalSelectionSync.slaves.length; - while (len--) - NETDATA.globalSelectionSync.slaves[len].setSelection(t); +NETDATA.gaugeClearSelection = function (state, force) { + if (typeof state.tmp.gaugeEvent !== 'undefined' && typeof state.tmp.gaugeEvent.timer !== 'undefined') { + NETDATA.timeout.clear(state.tmp.gaugeEvent.timer); + state.tmp.gaugeEvent.timer = undefined; + } - this.timeout_id = undefined; - } - }, + if (state.isAutoRefreshable() && state.data !== null && force !== true) { + NETDATA.gaugeChartUpdate(state, state.data); + } else { + NETDATA.gaugeAnimation(state, false); + NETDATA.gaugeSetLabels(state, null, null, null); + NETDATA.gaugeSet(state, null, null, null); + } - // sync all the visible charts to the given time - // this is to be called from the chart libraries - sync: function(state, t) { - if(NETDATA.options.current.sync_selection === true) { - if(NETDATA.options.debug.globalSelectionSync === true) - console.log('globalSelectionSync.sync(' + state.id + ', ' + t.toString() + ')'); + NETDATA.gaugeAnimation(state, true); + return true; +}; - this.setMaster(state); +NETDATA.gaugeSetSelection = function (state, t) { + if (state.timeIsVisible(t) !== true) { + return NETDATA.gaugeClearSelection(state, true); + } - if(t === this.last_t) - return; + let slot = state.calculateRowForTime(t); + if (slot < 0 || slot >= state.data.result.length) { + return NETDATA.gaugeClearSelection(state, true); + } - this.last_t = t; + if (typeof state.tmp.gaugeEvent === 'undefined') { + state.tmp.gaugeEvent = { + timer: undefined, + value: 0, + min: 0, + max: 0 + }; + } - if (state.foreign_element_selection !== null) - state.foreign_element_selection.innerText = NETDATA.dateTime.localeDateString(t) + ' ' + NETDATA.dateTime.localeTimeString(t); + let value = state.data.result[state.data.result.length - 1 - slot]; + let min = (state.tmp.gaugeMin === null) ? NETDATA.commonMin.get(state) : state.tmp.gaugeMin; + let max = (state.tmp.gaugeMax === null) ? NETDATA.commonMax.get(state) : state.tmp.gaugeMax; - if (this.timeout_id) - NETDATA.timeout.clear(this.timeout_id); + // make sure it is zero based + // but only if it has not been set by the user + if (state.tmp.gaugeMin === null && min > 0) { + min = 0; + } + if (state.tmp.gaugeMax === null && max < 0) { + max = 0; + } - this.timeout_id = NETDATA.timeout.set(this.__syncSlaves, 0); - } - } - }; + state.tmp.gaugeEvent.value = value; + state.tmp.gaugeEvent.min = min; + state.tmp.gaugeEvent.max = max; + NETDATA.gaugeSetLabels(state, value, min, max); - NETDATA.intersectionObserver = { - observer: null, - visible_targets: [], + if (state.tmp.gaugeEvent.timer === undefined) { + NETDATA.gaugeAnimation(state, false); - options: { - root: null, - rootMargin: "0px", - threshold: null - }, + state.tmp.gaugeEvent.timer = NETDATA.timeout.set(function () { + state.tmp.gaugeEvent.timer = undefined; + NETDATA.gaugeSet(state, state.tmp.gaugeEvent.value, state.tmp.gaugeEvent.min, state.tmp.gaugeEvent.max); + }, 0); + } - enabled: function() { - return this.observer !== null; - }, + return true; +}; - globalReset: function() { - if(this.observer !== null) { - this.visible_targets = []; - this.observer.disconnect(); - this.init(); - } - }, +NETDATA.gaugeChartUpdate = function (state, data) { + let value, min, max; - targets: function() { - if(this.enabled() === true && this.visible_targets.length > 0) - return this.visible_targets; - else - return NETDATA.options.targets; - }, + if (NETDATA.globalPanAndZoom.isActive() || state.isAutoRefreshable() === false) { + NETDATA.gaugeSetLabels(state, null, null, null); + state.tmp.gauge_instance.set(0); + } else { + value = data.result[0]; + min = (state.tmp.gaugeMin === null) ? NETDATA.commonMin.get(state) : state.tmp.gaugeMin; + max = (state.tmp.gaugeMax === null) ? NETDATA.commonMax.get(state) : state.tmp.gaugeMax; + if (value < min) { + min = value; + } + if (value > max) { + max = value; + } - switchChartVisibility: function() { - var old = this.__visibilityRatioOld; + // make sure it is zero based + // but only if it has not been set by the user + if (state.tmp.gaugeMin === null && min > 0) { + min = 0; + } + if (state.tmp.gaugeMax === null && max < 0) { + max = 0; + } - if(old !== this.__visibilityRatio) { - if (old === 0 && this.__visibilityRatio > 0) - this.unhideChart(); - else if (old > 0 && this.__visibilityRatio === 0) - this.hideChart(); + NETDATA.gaugeSet(state, value, min, max); + NETDATA.gaugeSetLabels(state, value, min, max); + } - this.__visibilityRatioOld = this.__visibilityRatio; - } - }, + return true; +}; + +NETDATA.gaugeChartCreate = function (state, data) { + // let chart = $(state.element_chart); + + let value = data.result[0]; + let min = NETDATA.dataAttribute(state.element, 'gauge-min-value', null); + let max = NETDATA.dataAttribute(state.element, 'gauge-max-value', null); + // let adjust = NETDATA.dataAttribute(state.element, 'gauge-adjust', null); + let pointerColor = NETDATA.dataAttribute(state.element, 'gauge-pointer-color', NETDATA.themes.current.gauge_pointer); + let strokeColor = NETDATA.dataAttribute(state.element, 'gauge-stroke-color', NETDATA.themes.current.gauge_stroke); + let startColor = NETDATA.dataAttribute(state.element, 'gauge-start-color', state.chartCustomColors()[0]); + let stopColor = NETDATA.dataAttribute(state.element, 'gauge-stop-color', void 0); + let generateGradient = NETDATA.dataAttribute(state.element, 'gauge-generate-gradient', false); + + if (min === null) { + min = NETDATA.commonMin.get(state); + state.tmp.gaugeMin = null; + } else { + state.tmp.gaugeMin = min; + } - handler: function(entries, observer) { - entries.forEach(function(entry) { - var state = NETDATA.chartState(entry.target); - - var idx; - if(entry.intersectionRatio > 0) { - idx = NETDATA.intersectionObserver.visible_targets.indexOf(state); - if(idx === -1) { - if(NETDATA.scrollUp === true) - NETDATA.intersectionObserver.visible_targets.push(state); - else - NETDATA.intersectionObserver.visible_targets.unshift(state); - } - else if(state.__visibilityRatio === 0) - state.log("was not visible until now, but was already in visible_targets"); - } - else { - idx = NETDATA.intersectionObserver.visible_targets.indexOf(state); - if(idx !== -1) - NETDATA.intersectionObserver.visible_targets.splice(idx, 1); - else if(state.__visibilityRatio > 0) - state.log("was visible, but not found in visible_targets"); - } + if (max === null) { + max = NETDATA.commonMax.get(state); + state.tmp.gaugeMax = null; + } else { + state.tmp.gaugeMax = max; + } - state.__visibilityRatio = entry.intersectionRatio; + // make sure it is zero based + // but only if it has not been set by the user + if (state.tmp.gaugeMin === null && min > 0) { + min = 0; + } + if (state.tmp.gaugeMax === null && max < 0) { + max = 0; + } - if(NETDATA.options.current.async_on_scroll === false) { - if(window.requestIdleCallback) - window.requestIdleCallback(function() { - NETDATA.intersectionObserver.switchChartVisibility.call(state); - }, {timeout: 100}); - else - NETDATA.intersectionObserver.switchChartVisibility.call(state); - } - }); + let width = state.chartWidth(), height = state.chartHeight(); //, ratio = 1.5; + // console.log('gauge width: ' + width.toString() + ', height: ' + height.toString()); + //switch(adjust) { + // case 'width': width = height * ratio; break; + // case 'height': + // default: height = width / ratio; break; + //} + //state.element.style.width = width.toString() + 'px'; + //state.element.style.height = height.toString() + 'px'; + + let lum_d = 0.05; + + let options = { + lines: 12, // The number of lines to draw + angle: 0.14, // The span of the gauge arc + lineWidth: 0.57, // The line thickness + radiusScale: 1.0, // Relative radius + pointer: { + length: 0.85, // 0.9 The radius of the inner circle + strokeWidth: 0.045, // The rotation offset + color: pointerColor // Fill color }, + limitMax: true, // If false, the max value of the gauge will be updated if value surpass max + limitMin: true, // If true, the min value of the gauge will be fixed unless you set it manually + colorStart: startColor, // Colors + colorStop: stopColor, // just experiment with them + strokeColor: strokeColor, // to see which ones work best for you + generateGradient: (generateGradient === true), // gmosx: + gradientType: 0, + highDpiSupport: true // High resolution support + }; + + if (generateGradient.constructor === Array) { + // example options: + // data-gauge-generate-gradient="[0, 50, 100]" + // data-gauge-gradient-percent-color-0="#FFFFFF" + // data-gauge-gradient-percent-color-50="#999900" + // data-gauge-gradient-percent-color-100="#000000" + + options.percentColors = []; + let len = generateGradient.length; + while (len--) { + let pcent = generateGradient[len]; + let color = NETDATA.dataAttribute(state.element, 'gauge-gradient-percent-color-' + pcent.toString(), false); + if (color !== false) { + let a = []; + a[0] = pcent / 100; + a[1] = color; + options.percentColors.unshift(a); + } + } + if (options.percentColors.length === 0) { + delete options.percentColors; + } + } else if (generateGradient === false && NETDATA.themes.current.gauge_gradient) { + //noinspection PointlessArithmeticExpressionJS + options.percentColors = [ + [0.0, NETDATA.colorLuminance(startColor, (lum_d * 10) - (lum_d * 0))], + [0.1, NETDATA.colorLuminance(startColor, (lum_d * 10) - (lum_d * 1))], + [0.2, NETDATA.colorLuminance(startColor, (lum_d * 10) - (lum_d * 2))], + [0.3, NETDATA.colorLuminance(startColor, (lum_d * 10) - (lum_d * 3))], + [0.4, NETDATA.colorLuminance(startColor, (lum_d * 10) - (lum_d * 4))], + [0.5, NETDATA.colorLuminance(startColor, (lum_d * 10) - (lum_d * 5))], + [0.6, NETDATA.colorLuminance(startColor, (lum_d * 10) - (lum_d * 6))], + [0.7, NETDATA.colorLuminance(startColor, (lum_d * 10) - (lum_d * 7))], + [0.8, NETDATA.colorLuminance(startColor, (lum_d * 10) - (lum_d * 8))], + [0.9, NETDATA.colorLuminance(startColor, (lum_d * 10) - (lum_d * 9))], + [1.0, NETDATA.colorLuminance(startColor, 0.0)]]; + } - observe: function(state) { - if(this.enabled() === true) { - state.__visibilityRatioOld = 0; - state.__visibilityRatio = 0; - this.observer.observe(state.element); - - state.isVisible = function() { - if(NETDATA.options.current.update_only_visible === false) - return true; - - NETDATA.intersectionObserver.switchChartVisibility.call(this); + state.tmp.gauge_canvas = document.createElement('canvas'); + state.tmp.gauge_canvas.id = 'gauge-' + state.uuid + '-canvas'; + state.tmp.gauge_canvas.className = 'gaugeChart'; + state.tmp.gauge_canvas.width = width; + state.tmp.gauge_canvas.height = height; + state.element_chart.appendChild(state.tmp.gauge_canvas); + + let valuefontsize = Math.floor(height / 5); + let valuetop = Math.round((height - valuefontsize) / 3.2); + state.tmp.gaugeChartLabel = document.createElement('span'); + state.tmp.gaugeChartLabel.className = 'gaugeChartLabel'; + state.tmp.gaugeChartLabel.style.fontSize = valuefontsize + 'px'; + state.tmp.gaugeChartLabel.style.top = valuetop.toString() + 'px'; + state.element_chart.appendChild(state.tmp.gaugeChartLabel); + + let titlefontsize = Math.round(valuefontsize / 2.1); + let titletop = 0; + state.tmp.gaugeChartTitle = document.createElement('span'); + state.tmp.gaugeChartTitle.className = 'gaugeChartTitle'; + state.tmp.gaugeChartTitle.innerText = state.title; + state.tmp.gaugeChartTitle.style.fontSize = titlefontsize + 'px'; + state.tmp.gaugeChartTitle.style.lineHeight = titlefontsize + 'px'; + state.tmp.gaugeChartTitle.style.top = titletop.toString() + 'px'; + state.element_chart.appendChild(state.tmp.gaugeChartTitle); + + let unitfontsize = Math.round(titlefontsize * 0.9); + state.tmp.gaugeChartUnits = document.createElement('span'); + state.tmp.gaugeChartUnits.className = 'gaugeChartUnits'; + state.tmp.gaugeChartUnits.innerText = state.units_current; + state.tmp.gaugeChartUnits.style.fontSize = unitfontsize + 'px'; + state.element_chart.appendChild(state.tmp.gaugeChartUnits); + + state.tmp.gaugeChartMin = document.createElement('span'); + state.tmp.gaugeChartMin.className = 'gaugeChartMin'; + state.tmp.gaugeChartMin.style.fontSize = Math.round(valuefontsize * 0.75).toString() + 'px'; + state.element_chart.appendChild(state.tmp.gaugeChartMin); + + state.tmp.gaugeChartMax = document.createElement('span'); + state.tmp.gaugeChartMax.className = 'gaugeChartMax'; + state.tmp.gaugeChartMax.style.fontSize = Math.round(valuefontsize * 0.75).toString() + 'px'; + state.element_chart.appendChild(state.tmp.gaugeChartMax); + + // when we just re-create the chart + // do not animate the first update + let animate = true; + if (typeof state.tmp.gauge_instance !== 'undefined') { + animate = false; + } - return this.__visibilityRatio > 0; - } - } - }, + state.tmp.gauge_instance = new Gauge(state.tmp.gauge_canvas).setOptions(options); // create sexy gauge! - init: function() { - if(typeof netdataIntersectionObserver === 'undefined' || netdataIntersectionObserver === true) { - try { - this.observer = new IntersectionObserver(this.handler, this.options); - } - catch (e) { - console.log("IntersectionObserver is not supported on this browser"); - this.observer = null; - } - } - //else { - // console.log("IntersectionObserver is disabled"); - //} - } + state.tmp.___gaugeOld__ = { + value: value, + min: min, + max: max, + valueLabel: null, + minLabel: null, + maxLabel: null }; - NETDATA.intersectionObserver.init(); - // ---------------------------------------------------------------------------------------------------------------- - // Our state object, where all per-chart values are stored + // we will always feed a percentage + state.tmp.gauge_instance.minValue = 0; + state.tmp.gauge_instance.maxValue = 100; - var chartState = function(element) { - this.element = element; + NETDATA.gaugeAnimation(state, animate); + NETDATA.gaugeSet(state, value, min, max); + NETDATA.gaugeSetLabels(state, value, min, max); + NETDATA.gaugeAnimation(state, true); - // IMPORTANT: - // all private functions should use 'that', instead of 'this' - var that = this; + state.legendSetUnitsString = function (units) { + if (typeof state.tmp.gaugeChartUnits !== 'undefined' && state.tmp.units !== units) { + state.tmp.gaugeChartUnits.innerText = units; + state.tmp.___gaugeOld__.valueLabel = null; + state.tmp.___gaugeOld__.minLabel = null; + state.tmp.___gaugeOld__.maxLabel = null; + state.tmp.units = units; + } + }; + state.legendShowUndefined = function () { + if (typeof state.tmp.gauge_instance !== 'undefined') { + NETDATA.gaugeClearSelection(state); + } + }; - // ============================================================================================================ - // ERROR HANDLING + return true; +}; +// ---------------------------------------------------------------------------------------------------------------- - /* error() - private - * show an error instead of the chart - */ - var error = function(msg) { - var ret = true; +NETDATA.easypiechartPercentFromValueMinMax = function (state, value, min, max) { + if (typeof value !== 'number') { + value = 0; + } + if (typeof min !== 'number') { + min = 0; + } + if (typeof max !== 'number') { + max = 0; + } - if(typeof netdataErrorCallback === 'function') { - ret = netdataErrorCallback('chart', that.id, msg); - } + if (min > max) { + let t = min; + min = max; + max = t; + } - if(ret) { - that.element.innerHTML = that.id + ': ' + msg; - that.enabled = false; - that.current = that.pan; - } - }; + if (min > value) { + min = value; + } + if (max < value) { + max = value; + } - // console logging - this.log = function(msg) { - console.log(this.id + ' (' + this.library_name + ' ' + this.uuid + '): ' + msg); - }; + state.legendFormatValueDecimalsFromMinMax(min, max); + if (state.tmp.easyPieChartMin === null && min > 0) { + min = 0; + } + if (state.tmp.easyPieChartMax === null && max < 0) { + max = 0; + } - // ============================================================================================================ - // EARLY INITIALIZATION + let pcent; + + if (min < 0 && max > 0) { + // it is both positive and negative + // zero at the top center of the chart + max = (-min > max) ? -min : max; + pcent = Math.round(value * 100 / max); + } else if (value >= 0 && min >= 0 && max >= 0) { + // clockwise + pcent = Math.round((value - min) * 100 / (max - min)); + if (pcent === 0) { + pcent = 0.1; + } + } else { + // counter clockwise + pcent = Math.round((value - max) * 100 / (max - min)); + if (pcent === 0) { + pcent = -0.1; + } + } - // These are variables that should exist even if the chart is never to be rendered. - // Be careful what you add here - there may be thousands of charts on the page. + return pcent; +}; - // GUID - a unique identifier for the chart - this.uuid = NETDATA.guid(); +// ---------------------------------------------------------------------------------------------------------------- +// easy-pie-chart - // string - the name of chart - this.id = NETDATA.dataAttribute(this.element, 'netdata', undefined); - if(typeof this.id === 'undefined') { - error("netdata elements need data-netdata"); - return; +NETDATA.easypiechartInitialize = function (callback) { + if (typeof netdataNoEasyPieChart === 'undefined' || !netdataNoEasyPieChart) { + $.ajax({ + url: NETDATA.easypiechart_js, + cache: true, + dataType: "script", + xhrFields: {withCredentials: true} // required for the cookie + }) + .done(function () { + NETDATA.registerChartLibrary('easypiechart', NETDATA.easypiechart_js); + }) + .fail(function () { + NETDATA.chartLibraries.easypiechart.enabled = false; + NETDATA.error(100, NETDATA.easypiechart_js); + }) + .always(function () { + if (typeof callback === "function") { + return callback(); + } + }) + } else { + NETDATA.chartLibraries.easypiechart.enabled = false; + if (typeof callback === "function") { + return callback(); } + } +}; - // string - the key for localStorage settings - this.settings_id = NETDATA.dataAttribute(this.element, 'id', null); - - // the user given dimensions of the element - this.width = NETDATA.dataAttribute(this.element, 'width', NETDATA.chartDefaults.width); - this.height = NETDATA.dataAttribute(this.element, 'height', NETDATA.chartDefaults.height); - this.height_original = this.height; +NETDATA.easypiechartClearSelection = function (state, force) { + if (typeof state.tmp.easyPieChartEvent !== 'undefined' && typeof state.tmp.easyPieChartEvent.timer !== 'undefined') { + NETDATA.timeout.clear(state.tmp.easyPieChartEvent.timer); + state.tmp.easyPieChartEvent.timer = undefined; + } - if(this.settings_id !== null) { - this.height = NETDATA.localStorageGet('chart_heights.' + this.settings_id, this.height, function(height) { - // this is the callback that will be called - // if and when the user resets all localStorage variables - // to their defaults + if (state.isAutoRefreshable() && state.data !== null && force !== true) { + NETDATA.easypiechartChartUpdate(state, state.data); + } + else { + state.tmp.easyPieChartLabel.innerText = state.legendFormatValue(null); + state.tmp.easyPieChart_instance.update(0); + } + state.tmp.easyPieChart_instance.enableAnimation(); - resizeChartToHeight(height); - }); - } + return true; +}; - // the chart library requested by the user - this.library_name = NETDATA.dataAttribute(this.element, 'chart-library', NETDATA.chartDefaults.library); +NETDATA.easypiechartSetSelection = function (state, t) { + if (state.timeIsVisible(t) !== true) { + return NETDATA.easypiechartClearSelection(state, true); + } - // check the requested library is available - // we don't initialize it here - it will be initialized when - // this chart will be first used - if(typeof NETDATA.chartLibraries[this.library_name] === 'undefined') { - NETDATA.error(402, this.library_name); - error('chart library "' + this.library_name + '" is not found'); - this.enabled = false; - } - else if(NETDATA.chartLibraries[this.library_name].enabled === false) { - NETDATA.error(403, this.library_name); - error('chart library "' + this.library_name + '" is not enabled'); - this.enabled = false; - } - else - this.library = NETDATA.chartLibraries[this.library_name]; + let slot = state.calculateRowForTime(t); + if (slot < 0 || slot >= state.data.result.length) { + return NETDATA.easypiechartClearSelection(state, true); + } - this.auto = { - name: 'auto', - autorefresh: true, - force_update_at: 0, // the timestamp to force the update at - force_before_ms: null, - force_after_ms: null - }; - this.pan = { - name: 'pan', - autorefresh: false, - force_update_at: 0, // the timestamp to force the update at - force_before_ms: null, - force_after_ms: null - }; - this.zoom = { - name: 'zoom', - autorefresh: false, - force_update_at: 0, // the timestamp to force the update at - force_before_ms: null, - force_after_ms: null + if (typeof state.tmp.easyPieChartEvent === 'undefined') { + state.tmp.easyPieChartEvent = { + timer: undefined, + value: 0, + pcent: 0 }; + } - // this is a pointer to one of the sub-classes below - // auto, pan, zoom - this.current = this.auto; - - this.running = false; // boolean - true when the chart is being refreshed now - this.enabled = true; // boolean - is the chart enabled for refresh? - - this.force_update_every = null; // number - overwrite the visualization update frequency of the chart - - this.tmp = {}; - - this.foreign_element_before = null; - this.foreign_element_after = null; - this.foreign_element_duration = null; - this.foreign_element_update_every = null; - this.foreign_element_selection = null; - - // ============================================================================================================ - // PRIVATE FUNCTIONS - - // reset the runtime status variables to their defaults - var runtimeInit = function() { - that.paused = false; // boolean - is the chart paused for any reason? - that.selected = false; // boolean - is the chart shown a selection? - - that.chart_created = false; // boolean - is the library.create() been called? - that.dom_created = false; // boolean - is the chart DOM been created? - that.fetching_data = false; // boolean - true while we fetch data via ajax - - that.updates_counter = 0; // numeric - the number of refreshes made so far - that.updates_since_last_unhide = 0; // numeric - the number of refreshes made since the last time the chart was unhidden - that.updates_since_last_creation = 0; // numeric - the number of refreshes made since the last time the chart was created - - that.tm = { - last_initialized: 0, // milliseconds - the timestamp it was last initialized - last_dom_created: 0, // milliseconds - the timestamp its DOM was last created - last_mode_switch: 0, // milliseconds - the timestamp it switched modes - - last_info_downloaded: 0, // milliseconds - the timestamp we downloaded the chart - last_updated: 0, // the timestamp the chart last updated with data - pan_and_zoom_seq: 0, // the sequence number of the global synchronization - // between chart. - // Used with NETDATA.globalPanAndZoom.seq - last_visible_check: 0, // the time we last checked if it is visible - last_resized: 0, // the time the chart was resized - last_hidden: 0, // the time the chart was hidden - last_unhidden: 0, // the time the chart was unhidden - last_autorefreshed: 0 // the time the chart was last refreshed - }; + let value = state.data.result[state.data.result.length - 1 - slot]; + let min = (state.tmp.easyPieChartMin === null) ? NETDATA.commonMin.get(state) : state.tmp.easyPieChartMin; + let max = (state.tmp.easyPieChartMax === null) ? NETDATA.commonMax.get(state) : state.tmp.easyPieChartMax; + let pcent = NETDATA.easypiechartPercentFromValueMinMax(state, value, min, max); - that.data = null; // the last data as downloaded from the netdata server - that.data_url = 'invalid://'; // string - the last url used to update the chart - that.data_points = 0; // number - the number of points returned from netdata - that.data_after = 0; // milliseconds - the first timestamp of the data - that.data_before = 0; // milliseconds - the last timestamp of the data - that.data_update_every = 0; // milliseconds - the frequency to update the data + state.tmp.easyPieChartEvent.value = value; + state.tmp.easyPieChartEvent.pcent = pcent; + state.tmp.easyPieChartLabel.innerText = state.legendFormatValue(value); - that.tmp = {}; // members that can be destroyed to save memory - }; + if (state.tmp.easyPieChartEvent.timer === undefined) { + state.tmp.easyPieChart_instance.disableAnimation(); - // initialize all the variables that are required for the chart to be rendered - var lateInitialization = function() { - if(typeof that.host !== 'undefined') - return; + state.tmp.easyPieChartEvent.timer = NETDATA.timeout.set(function () { + state.tmp.easyPieChartEvent.timer = undefined; + state.tmp.easyPieChart_instance.update(state.tmp.easyPieChartEvent.pcent); + }, 0); + } - // string - the netdata server URL, without any path - that.host = NETDATA.dataAttribute(that.element, 'host', NETDATA.serverDefault); + return true; +}; - // make sure the host does not end with / - // all netdata API requests use absolute paths - while(that.host.slice(-1) === '/') - that.host = that.host.substring(0, that.host.length - 1); +NETDATA.easypiechartChartUpdate = function (state, data) { + let value, min, max, pcent; - // string - the grouping method requested by the user - that.method = NETDATA.dataAttribute(that.element, 'method', NETDATA.chartDefaults.method); - that.gtime = NETDATA.dataAttribute(that.element, 'gtime', 0); + if (NETDATA.globalPanAndZoom.isActive() || state.isAutoRefreshable() === false) { + value = null; + pcent = 0; + } + else { + value = data.result[0]; + min = (state.tmp.easyPieChartMin === null) ? NETDATA.commonMin.get(state) : state.tmp.easyPieChartMin; + max = (state.tmp.easyPieChartMax === null) ? NETDATA.commonMax.get(state) : state.tmp.easyPieChartMax; + pcent = NETDATA.easypiechartPercentFromValueMinMax(state, value, min, max); + } - // the time-range requested by the user - that.after = NETDATA.dataAttribute(that.element, 'after', NETDATA.chartDefaults.after); - that.before = NETDATA.dataAttribute(that.element, 'before', NETDATA.chartDefaults.before); + state.tmp.easyPieChartLabel.innerText = state.legendFormatValue(value); + state.tmp.easyPieChart_instance.update(pcent); + return true; +}; - // the pixels per point requested by the user - that.pixels_per_point = NETDATA.dataAttribute(that.element, 'pixels-per-point', 1); - that.points = NETDATA.dataAttribute(that.element, 'points', null); +NETDATA.easypiechartChartCreate = function (state, data) { + let chart = $(state.element_chart); - // the forced update_every - that.force_update_every = NETDATA.dataAttribute(that.element, 'update-every', null); - if(typeof that.force_update_every !== 'number' || that.force_update_every <= 1) { - if(that.force_update_every !== null) - that.log('ignoring invalid value of property data-update-every'); + let value = data.result[0]; + let min = NETDATA.dataAttribute(state.element, 'easypiechart-min-value', null); + let max = NETDATA.dataAttribute(state.element, 'easypiechart-max-value', null); - that.force_update_every = null; - } - else - that.force_update_every *= 1000; + if (min === null) { + min = NETDATA.commonMin.get(state); + state.tmp.easyPieChartMin = null; + } + else { + state.tmp.easyPieChartMin = min; + } - // the dimensions requested by the user - that.dimensions = NETDATA.encodeURIComponent(NETDATA.dataAttribute(that.element, 'dimensions', null)); + if (max === null) { + max = NETDATA.commonMax.get(state); + state.tmp.easyPieChartMax = null; + } + else { + state.tmp.easyPieChartMax = max; + } - that.title = NETDATA.dataAttribute(that.element, 'title', null); // the title of the chart - that.units = NETDATA.dataAttribute(that.element, 'units', null); // the units of the chart dimensions - that.units_desired = NETDATA.dataAttribute(that.element, 'desired-units', NETDATA.options.current.units); // the units of the chart dimensions - that.units_current = that.units; - that.units_common = NETDATA.dataAttribute(that.element, 'common-units', null); + let size = state.chartWidth(); + let stroke = Math.floor(size / 22); + if (stroke < 3) { + stroke = 2; + } - // additional options to pass to netdata - that.append_options = NETDATA.encodeURIComponent(NETDATA.dataAttribute(that.element, 'append-options', null)); + let valuefontsize = Math.floor((size * 2 / 3) / 5); + let valuetop = Math.round((size - valuefontsize - (size / 40)) / 2); + state.tmp.easyPieChartLabel = document.createElement('span'); + state.tmp.easyPieChartLabel.className = 'easyPieChartLabel'; + state.tmp.easyPieChartLabel.innerText = state.legendFormatValue(value); + state.tmp.easyPieChartLabel.style.fontSize = valuefontsize + 'px'; + state.tmp.easyPieChartLabel.style.top = valuetop.toString() + 'px'; + state.element_chart.appendChild(state.tmp.easyPieChartLabel); + + let titlefontsize = Math.round(valuefontsize * 1.6 / 3); + let titletop = Math.round(valuetop - (titlefontsize * 2) - (size / 40)); + state.tmp.easyPieChartTitle = document.createElement('span'); + state.tmp.easyPieChartTitle.className = 'easyPieChartTitle'; + state.tmp.easyPieChartTitle.innerText = state.title; + state.tmp.easyPieChartTitle.style.fontSize = titlefontsize + 'px'; + state.tmp.easyPieChartTitle.style.lineHeight = titlefontsize + 'px'; + state.tmp.easyPieChartTitle.style.top = titletop.toString() + 'px'; + state.element_chart.appendChild(state.tmp.easyPieChartTitle); + + let unitfontsize = Math.round(titlefontsize * 0.9); + let unittop = Math.round(valuetop + (valuefontsize + unitfontsize) + (size / 40)); + state.tmp.easyPieChartUnits = document.createElement('span'); + state.tmp.easyPieChartUnits.className = 'easyPieChartUnits'; + state.tmp.easyPieChartUnits.innerText = state.units_current; + state.tmp.easyPieChartUnits.style.fontSize = unitfontsize + 'px'; + state.tmp.easyPieChartUnits.style.top = unittop.toString() + 'px'; + state.element_chart.appendChild(state.tmp.easyPieChartUnits); + + let barColor = NETDATA.dataAttribute(state.element, 'easypiechart-barcolor', undefined); + if (typeof barColor === 'undefined' || barColor === null) { + barColor = state.chartCustomColors()[0]; + } else { + // <div ... data-easypiechart-barcolor="(function(percent){return(percent < 50 ? '#5cb85c' : percent < 85 ? '#f0ad4e' : '#cb3935');})" ...></div> + let tmp = eval(barColor); + if (typeof tmp === 'function') { + barColor = tmp; + } + } - // override options to pass to netdata - that.override_options = NETDATA.encodeURIComponent(NETDATA.dataAttribute(that.element, 'override-options', null)); + let pcent = NETDATA.easypiechartPercentFromValueMinMax(state, value, min, max); + chart.data('data-percent', pcent); + + chart.easyPieChart({ + barColor: barColor, + trackColor: NETDATA.dataAttribute(state.element, 'easypiechart-trackcolor', NETDATA.themes.current.easypiechart_track), + scaleColor: NETDATA.dataAttribute(state.element, 'easypiechart-scalecolor', NETDATA.themes.current.easypiechart_scale), + scaleLength: NETDATA.dataAttribute(state.element, 'easypiechart-scalelength', 5), + lineCap: NETDATA.dataAttribute(state.element, 'easypiechart-linecap', 'round'), + lineWidth: NETDATA.dataAttribute(state.element, 'easypiechart-linewidth', stroke), + trackWidth: NETDATA.dataAttribute(state.element, 'easypiechart-trackwidth', undefined), + size: NETDATA.dataAttribute(state.element, 'easypiechart-size', size), + rotate: NETDATA.dataAttribute(state.element, 'easypiechart-rotate', 0), + animate: NETDATA.dataAttribute(state.element, 'easypiechart-animate', {duration: 500, enabled: true}), + easing: NETDATA.dataAttribute(state.element, 'easypiechart-easing', undefined) + }); - that.debug = NETDATA.dataAttributeBoolean(that.element, 'debug', false); + // when we just re-create the chart + // do not animate the first update + let animate = true; + if (typeof state.tmp.easyPieChart_instance !== 'undefined') { + animate = false; + } - that.value_decimal_detail = -1; - var d = NETDATA.dataAttribute(that.element, 'decimal-digits', -1); - if(typeof d === 'number') - that.value_decimal_detail = d; - else if(typeof d !== 'undefined') - that.log('ignoring decimal-digits value: ' + d.toString()); + state.tmp.easyPieChart_instance = chart.data('easyPieChart'); + if (animate === false) { + state.tmp.easyPieChart_instance.disableAnimation(); + } + state.tmp.easyPieChart_instance.update(pcent); + if (animate === false) { + state.tmp.easyPieChart_instance.enableAnimation(); + } - // if we need to report the rendering speed - // find the element that needs to be updated - var refresh_dt_element_name = NETDATA.dataAttribute(that.element, 'dt-element-name', null); // string - the element to print refresh_dt_ms + state.legendSetUnitsString = function (units) { + if (typeof state.tmp.easyPieChartUnits !== 'undefined' && state.tmp.units !== units) { + state.tmp.easyPieChartUnits.innerText = units; + state.tmp.units = units; + } + }; + state.legendShowUndefined = function () { + if (typeof state.tmp.easyPieChart_instance !== 'undefined') { + NETDATA.easypiechartClearSelection(state); + } + }; - if(refresh_dt_element_name !== null) { - that.refresh_dt_element = document.getElementById(refresh_dt_element_name) || null; - } - else - that.refresh_dt_element = null; - - that.dimensions_visibility = new dimensionsVisibility(that); - - that.netdata_first = 0; // milliseconds - the first timestamp in netdata - that.netdata_last = 0; // milliseconds - the last timestamp in netdata - that.requested_after = null; // milliseconds - the timestamp of the request after param - that.requested_before = null; // milliseconds - the timestamp of the request before param - that.requested_padding = null; - that.view_after = 0; - that.view_before = 0; - - that.refresh_dt_ms = 0; // milliseconds - the time the last refresh took - - // how many retries we have made to load chart data from the server - that.retries_on_data_failures = 0; - - // color management - that.colors = null; - that.colors_assigned = null; - that.colors_available = null; - that.colors_custom = null; - - that.element_message = null; // the element already created by the user - that.element_chart = null; // the element with the chart - that.element_legend = null; // the element with the legend of the chart (if created by us) - that.element_legend_childs = { - content: null, - hidden: null, - title_date: null, - title_time: null, - title_units: null, - perfect_scroller: null, // the container to apply perfect scroller to - series: null - }; + return true; +}; - that.chart_url = null; // string - the url to download chart info - that.chart = null; // object - the chart as downloaded from the server +// d3pie - function get_foreign_element_by_id(opt) { - var id = NETDATA.dataAttribute(that.element, opt, null); - if(id === null) { - //that.log('option "' + opt + '" is undefined'); - return null; - } +NETDATA.d3pieInitialize = function (callback) { + if (typeof netdataNoD3pie === 'undefined' || !netdataNoD3pie) { - var el = document.getElementById(id); - if(typeof el === 'undefined') { - that.log('cannot find an element with name "' + id.toString() + '"'); - return null; + // d3pie requires D3 + if (!NETDATA.chartLibraries.d3.initialized) { + if (NETDATA.chartLibraries.d3.enabled) { + NETDATA.d3Initialize(function () { + NETDATA.d3pieInitialize(callback); + }); + } else { + NETDATA.chartLibraries.d3pie.enabled = false; + if (typeof callback === "function") { + return callback(); } - - return el; } + } else { + $.ajax({ + url: NETDATA.d3pie_js, + cache: true, + dataType: "script", + xhrFields: {withCredentials: true} // required for the cookie + }) + .done(function () { + NETDATA.registerChartLibrary('d3pie', NETDATA.d3pie_js); + }) + .fail(function () { + NETDATA.chartLibraries.d3pie.enabled = false; + NETDATA.error(100, NETDATA.d3pie_js); + }) + .always(function () { + if (typeof callback === "function") { + return callback(); + } + }); + } + } else { + NETDATA.chartLibraries.d3pie.enabled = false; + if (typeof callback === "function") { + return callback(); + } + } +}; + +NETDATA.d3pieSetContent = function (state, data, index) { + state.legendFormatValueDecimalsFromMinMax( + data.min, + data.max + ); + + let content = []; + let colors = state.chartColors(); + let len = data.result.labels.length; + for (let i = 1; i < len; i++) { + let label = data.result.labels[i]; + let value = data.result.data[index][label]; + let color = colors[i - 1]; + + if (value !== null && value > 0) { + content.push({ + label: label, + value: value, + color: color + }); + } + } - that.foreign_element_before = get_foreign_element_by_id('show-before-at'); - that.foreign_element_after = get_foreign_element_by_id('show-after-at'); - that.foreign_element_duration = get_foreign_element_by_id('show-duration-at'); - that.foreign_element_update_every = get_foreign_element_by_id('show-update-every-at'); - that.foreign_element_selection = get_foreign_element_by_id('show-selection-at'); - }; - - var destroyDOM = function() { - if(that.enabled === false) return; + if (content.length === 0) { + content.push({ + label: 'no data', + value: 100, + color: '#666666' + }); + } - if(that.debug === true) - that.log('destroyDOM()'); + state.tmp.d3pie_last_slot = index; + return content; +}; - // that.element.className = 'netdata-message icon'; - // that.element.innerHTML = '<i class="fas fa-sync"></i> netdata'; - that.element.innerHTML = ''; - that.element_message = null; - that.element_legend = null; - that.element_chart = null; - that.element_legend_childs.series = null; +NETDATA.d3pieDateRange = function (state, data, index) { + let dt = Math.round((data.before - data.after + 1) / data.points); + let dt_str = NETDATA.seconds4human(dt); - that.chart_created = false; - that.dom_created = false; + let before = data.result.data[index].time; + let after = before - (dt * 1000); - that.tm.last_resized = 0; - that.tm.last_dom_created = 0; - }; + let d1 = NETDATA.dateTime.localeDateString(after); + let t1 = NETDATA.dateTime.localeTimeString(after); + let d2 = NETDATA.dateTime.localeDateString(before); + let t2 = NETDATA.dateTime.localeTimeString(before); - var createDOM = function() { - if(that.enabled === false) return; - lateInitialization(); + if (d1 === d2) { + return d1 + ' ' + t1 + ' to ' + t2 + ', ' + dt_str; + } - destroyDOM(); + return d1 + ' ' + t1 + ' to ' + d2 + ' ' + t2 + ', ' + dt_str; +}; - if(that.debug === true) - that.log('createDOM()'); +NETDATA.d3pieSetSelection = function (state, t) { + if (state.timeIsVisible(t) !== true) { + return NETDATA.d3pieClearSelection(state, true); + } - that.element_message = document.createElement('div'); - that.element_message.className = 'netdata-message icon hidden'; - that.element.appendChild(that.element_message); + let slot = state.calculateRowForTime(t); + slot = state.data.result.data.length - slot - 1; - that.dom_created = true; - that.chart_created = false; + if (slot < 0 || slot >= state.data.result.length) { + return NETDATA.d3pieClearSelection(state, true); + } - that.tm.last_dom_created = - that.tm.last_resized = Date.now(); + if (state.tmp.d3pie_last_slot === slot) { + // we already show this slot, don't do anything + return true; + } - showLoading(); - }; + if (state.tmp.d3pie_timer === undefined) { + state.tmp.d3pie_timer = NETDATA.timeout.set(function () { + state.tmp.d3pie_timer = undefined; + NETDATA.d3pieChange(state, NETDATA.d3pieSetContent(state, state.data, slot), NETDATA.d3pieDateRange(state, state.data, slot)); + }, 0); + } - var initDOM = function() { - that.element.className = that.library.container_class(that); + return true; +}; - if(typeof(that.width) === 'string') - that.element.style.width = that.width; - else if(typeof(that.width) === 'number') - that.element.style.width = that.width.toString() + 'px'; +NETDATA.d3pieClearSelection = function (state, force) { + if (typeof state.tmp.d3pie_timer !== 'undefined') { + NETDATA.timeout.clear(state.tmp.d3pie_timer); + state.tmp.d3pie_timer = undefined; + } - if(typeof(that.library.aspect_ratio) === 'undefined') { - if(typeof(that.height) === 'string') - that.element.style.height = that.height; - else if(typeof(that.height) === 'number') - that.element.style.height = that.height.toString() + 'px'; - } + if (state.isAutoRefreshable() && state.data !== null && force !== true) { + NETDATA.d3pieChartUpdate(state, state.data); + } else { + if (state.tmp.d3pie_last_slot !== -1) { + state.tmp.d3pie_last_slot = -1; + NETDATA.d3pieChange(state, [{label: 'no data', value: 1, color: '#666666'}], 'no data available'); + } + } - if(NETDATA.chartDefaults.min_width !== null) - that.element.style.min_width = NETDATA.chartDefaults.min_width; - }; + return true; +}; - var invisibleSearchableText = function() { - return '<span style="position:absolute; opacity: 0; width: 0px;">' + that.id + '</span>'; - }; +NETDATA.d3pieChange = function (state, content, footer) { + if (state.d3pie_forced_subtitle === null) { + //state.d3pie_instance.updateProp("header.subtitle.text", state.units_current); + state.d3pie_instance.options.header.subtitle.text = state.units_current; + } - /* init() private - * initialize state variables - * destroy all (possibly) created state elements - * create the basic DOM for a chart - */ - var init = function(opt) { - if(that.enabled === false) return; + if (state.d3pie_forced_footer === null) { + //state.d3pie_instance.updateProp("footer.text", footer); + state.d3pie_instance.options.footer.text = footer; + } - runtimeInit(); - that.element.innerHTML = invisibleSearchableText(); + //state.d3pie_instance.updateProp("data.content", content); + state.d3pie_instance.options.data.content = content; + state.d3pie_instance.destroy(); + state.d3pie_instance.recreate(); + return true; +}; - that.tm.last_initialized = Date.now(); - that.setMode('auto'); +NETDATA.d3pieChartUpdate = function (state, data) { + return NETDATA.d3pieChange(state, NETDATA.d3pieSetContent(state, data, 0), NETDATA.d3pieDateRange(state, data, 0)); +}; - if(opt !== 'fast') { - if (that.isVisible(true) || opt === 'force') - createDOM(); - } - }; +NETDATA.d3pieChartCreate = function (state, data) { - var maxMessageFontSize = function() { - var screenHeight = screen.height; - var el = that.element; + state.element_chart.id = 'd3pie-' + state.uuid; + // console.log('id = ' + state.element_chart.id); - // normally we want a font size, as tall as the element - var h = el.clientHeight; + let content = NETDATA.d3pieSetContent(state, data, 0); - // but give it some air, 20% let's say, or 5 pixels min - var lost = Math.max(h * 0.2, 5); - h -= lost; + state.d3pie_forced_title = NETDATA.dataAttribute(state.element, 'd3pie-title', null); + state.d3pie_forced_subtitle = NETDATA.dataAttribute(state.element, 'd3pie-subtitle', null); + state.d3pie_forced_footer = NETDATA.dataAttribute(state.element, 'd3pie-footer', null); - // center the text, vertically - var paddingTop = (lost - 5) / 2; + state.d3pie_options = { + header: { + title: { + text: (state.d3pie_forced_title !== null) ? state.d3pie_forced_title : state.title, + color: NETDATA.dataAttribute(state.element, 'd3pie-title-color', NETDATA.themes.current.d3pie.title), + fontSize: NETDATA.dataAttribute(state.element, 'd3pie-title-fontsize', 12), + fontWeight: NETDATA.dataAttribute(state.element, 'd3pie-title-fontweight', "bold"), + font: NETDATA.dataAttribute(state.element, 'd3pie-title-font', "arial") + }, + subtitle: { + text: (state.d3pie_forced_subtitle !== null) ? state.d3pie_forced_subtitle : state.units_current, + color: NETDATA.dataAttribute(state.element, 'd3pie-subtitle-color', NETDATA.themes.current.d3pie.subtitle), + fontSize: NETDATA.dataAttribute(state.element, 'd3pie-subtitle-fontsize', 10), + fontWeight: NETDATA.dataAttribute(state.element, 'd3pie-subtitle-fontweight', "normal"), + font: NETDATA.dataAttribute(state.element, 'd3pie-subtitle-font', "arial") + }, + titleSubtitlePadding: 1 + }, + footer: { + text: (state.d3pie_forced_footer !== null) ? state.d3pie_forced_footer : NETDATA.d3pieDateRange(state, data, 0), + color: NETDATA.dataAttribute(state.element, 'd3pie-footer-color', NETDATA.themes.current.d3pie.footer), + fontSize: NETDATA.dataAttribute(state.element, 'd3pie-footer-fontsize', 9), + fontWeight: NETDATA.dataAttribute(state.element, 'd3pie-footer-fontweight', "bold"), + font: NETDATA.dataAttribute(state.element, 'd3pie-footer-font', "arial"), + location: NETDATA.dataAttribute(state.element, 'd3pie-footer-location', "bottom-center") // bottom-left, bottom-center, bottom-right + }, + size: { + canvasHeight: state.chartHeight(), + canvasWidth: state.chartWidth(), + pieInnerRadius: NETDATA.dataAttribute(state.element, 'd3pie-pieinnerradius', "45%"), + pieOuterRadius: NETDATA.dataAttribute(state.element, 'd3pie-pieouterradius', "80%") + }, + data: { + // none, random, value-asc, value-desc, label-asc, label-desc + sortOrder: NETDATA.dataAttribute(state.element, 'd3pie-sortorder', "value-desc"), + smallSegmentGrouping: { + enabled: NETDATA.dataAttributeBoolean(state.element, "d3pie-smallsegmentgrouping-enabled", false), + value: NETDATA.dataAttribute(state.element, 'd3pie-smallsegmentgrouping-value', 1), + // percentage, value + valueType: NETDATA.dataAttribute(state.element, 'd3pie-smallsegmentgrouping-valuetype', "percentage"), + label: NETDATA.dataAttribute(state.element, 'd3pie-smallsegmentgrouping-label', "other"), + color: NETDATA.dataAttribute(state.element, 'd3pie-smallsegmentgrouping-color', NETDATA.themes.current.d3pie.other) + }, - // but check the width too - // it should fit 10 characters in it - var w = el.clientWidth / 10; - if(h > w) { - paddingTop += (h - w) / 2; - h = w; - } + // REQUIRED! This is where you enter your pie data; it needs to be an array of objects + // of this form: { label: "label", value: 1.5, color: "#000000" } - color is optional + content: content + }, + labels: { + outer: { + // label, value, percentage, label-value1, label-value2, label-percentage1, label-percentage2 + format: NETDATA.dataAttribute(state.element, 'd3pie-labels-outer-format', "label-value1"), + hideWhenLessThanPercentage: NETDATA.dataAttribute(state.element, 'd3pie-labels-outer-hidewhenlessthanpercentage', null), + pieDistance: NETDATA.dataAttribute(state.element, 'd3pie-labels-outer-piedistance', 15) + }, + inner: { + // label, value, percentage, label-value1, label-value2, label-percentage1, label-percentage2 + format: NETDATA.dataAttribute(state.element, 'd3pie-labels-inner-format', "percentage"), + hideWhenLessThanPercentage: NETDATA.dataAttribute(state.element, 'd3pie-labels-inner-hidewhenlessthanpercentage', 2) + }, + mainLabel: { + color: NETDATA.dataAttribute(state.element, 'd3pie-labels-mainLabel-color', NETDATA.themes.current.d3pie.mainlabel), // or 'segment' for dynamic color + font: NETDATA.dataAttribute(state.element, 'd3pie-labels-mainLabel-font', "arial"), + fontSize: NETDATA.dataAttribute(state.element, 'd3pie-labels-mainLabel-fontsize', 10), + fontWeight: NETDATA.dataAttribute(state.element, 'd3pie-labels-mainLabel-fontweight', "normal") + }, + percentage: { + color: NETDATA.dataAttribute(state.element, 'd3pie-labels-percentage-color', NETDATA.themes.current.d3pie.percentage), + font: NETDATA.dataAttribute(state.element, 'd3pie-labels-percentage-font', "arial"), + fontSize: NETDATA.dataAttribute(state.element, 'd3pie-labels-percentage-fontsize', 10), + fontWeight: NETDATA.dataAttribute(state.element, 'd3pie-labels-percentage-fontweight', "bold"), + decimalPlaces: 0 + }, + value: { + color: NETDATA.dataAttribute(state.element, 'd3pie-labels-value-color', NETDATA.themes.current.d3pie.value), + font: NETDATA.dataAttribute(state.element, 'd3pie-labels-value-font', "arial"), + fontSize: NETDATA.dataAttribute(state.element, 'd3pie-labels-value-fontsize', 10), + fontWeight: NETDATA.dataAttribute(state.element, 'd3pie-labels-value-fontweight', "bold") + }, + lines: { + enabled: NETDATA.dataAttributeBoolean(state.element, 'd3pie-labels-lines-enabled', true), + style: NETDATA.dataAttribute(state.element, 'd3pie-labels-lines-style', "curved"), + color: NETDATA.dataAttribute(state.element, 'd3pie-labels-lines-color', "segment") // "segment" or a hex color + }, + truncation: { + enabled: NETDATA.dataAttributeBoolean(state.element, 'd3pie-labels-truncation-enabled', false), + truncateLength: NETDATA.dataAttribute(state.element, 'd3pie-labels-truncation-truncatelength', 30) + }, + formatter: function (context) { + // console.log(context); + if (context.part === 'value') { + return state.legendFormatValue(context.value); + } + if (context.part === 'percentage') { + return context.label + '%'; + } - // and don't make it too huge - // 5% of the screen size is good - if(h > screenHeight / 20) { - paddingTop += (h - (screenHeight / 20)) / 2; - h = screenHeight / 20; + return context.label; } - - // set it - that.element_message.style.fontSize = h.toString() + 'px'; - that.element_message.style.paddingTop = paddingTop.toString() + 'px'; - }; - - var showMessageIcon = function(icon) { - that.element_message.innerHTML = icon; - maxMessageFontSize(); - $(that.element_message).removeClass('hidden'); - that.tmp.___messageHidden___ = undefined; - }; - - var hideMessage = function() { - if(typeof that.tmp.___messageHidden___ === 'undefined') { - that.tmp.___messageHidden___ = true; - $(that.element_message).addClass('hidden'); + }, + effects: { + load: { + effect: "none", // none / default + speed: 0 // commented in the d3pie code to speed it up + }, + pullOutSegmentOnClick: { + effect: "bounce", // none / linear / bounce / elastic / back + speed: 400, + size: 5 + }, + highlightSegmentOnMouseover: true, + highlightLuminosity: -0.2 + }, + tooltips: { + enabled: false, + type: "placeholder", // caption|placeholder + string: "", + placeholderParser: null, // function + styles: { + fadeInSpeed: 250, + backgroundColor: NETDATA.themes.current.d3pie.tooltip_bg, + backgroundOpacity: 0.5, + color: NETDATA.themes.current.d3pie.tooltip_fg, + borderRadius: 2, + font: "arial", + fontSize: 12, + padding: 4 } - }; + }, + misc: { + colors: { + background: 'transparent', // transparent or color # + // segments: state.chartColors(), + segmentStroke: NETDATA.dataAttribute(state.element, 'd3pie-misc-colors-segmentstroke', NETDATA.themes.current.d3pie.segment_stroke) + }, + gradient: { + enabled: NETDATA.dataAttributeBoolean(state.element, 'd3pie-misc-gradient-enabled', false), + percentage: NETDATA.dataAttribute(state.element, 'd3pie-misc-colors-percentage', 95), + color: NETDATA.dataAttribute(state.element, 'd3pie-misc-gradient-color', NETDATA.themes.current.d3pie.gradient_color) + }, + canvasPadding: { + top: 5, + right: 5, + bottom: 5, + left: 5 + }, + pieCenterOffset: { + x: 0, + y: 0 + }, + cssPrefix: NETDATA.dataAttribute(state.element, 'd3pie-cssprefix', null) + }, + callbacks: { + onload: null, + onMouseoverSegment: null, + onMouseoutSegment: null, + onClickSegment: null + } + }; - var showRendering = function() { - var icon; - if(that.chart !== null) { - if(that.chart.chart_type === 'line') - icon = NETDATA.icons.lineChart; - else - icon = NETDATA.icons.areaChart; - } - else - icon = NETDATA.icons.noChart; + state.d3pie_instance = new d3pie(state.element_chart, state.d3pie_options); + return true; +}; - showMessageIcon(icon + ' netdata' + invisibleSearchableText()); - }; +// ---------------------------------------------------------------------------------------------------------------- +// D3 - var showLoading = function() { - if(that.chart_created === false) { - showMessageIcon(NETDATA.icons.loading + ' netdata'); - return true; - } - return false; - }; +NETDATA.d3Initialize = function(callback) { + if (typeof netdataStopD3 === 'undefined' || !netdataStopD3) { + $.ajax({ + url: NETDATA.d3_js, + cache: true, + dataType: "script", + xhrFields: { withCredentials: true } // required for the cookie + }) + .done(function() { + NETDATA.registerChartLibrary('d3', NETDATA.d3_js); + }) + .fail(function() { + NETDATA.chartLibraries.d3.enabled = false; + NETDATA.error(100, NETDATA.d3_js); + }) + .always(function() { + if (typeof callback === "function") + return callback(); + }); + } else { + NETDATA.chartLibraries.d3.enabled = false; + if (typeof callback === "function") + return callback(); + } +}; - var isHidden = function() { - return (typeof that.tmp.___chartIsHidden___ !== 'undefined'); - }; +NETDATA.d3ChartUpdate = function(state, data) { + void(state); + void(data); - // hide the chart, when it is not visible - called from isVisible() - this.hideChart = function() { - // hide it, if it is not already hidden - if(isHidden() === true) return; - - if(this.chart_created === true) { - if(NETDATA.options.current.show_help === true) { - if(this.element_legend_childs.toolbox !== null) { - if(this.debug === true) - this.log('hideChart(): hidding legend popovers'); - - $(this.element_legend_childs.toolbox_left).popover('hide'); - $(this.element_legend_childs.toolbox_reset).popover('hide'); - $(this.element_legend_childs.toolbox_right).popover('hide'); - $(this.element_legend_childs.toolbox_zoomin).popover('hide'); - $(this.element_legend_childs.toolbox_zoomout).popover('hide'); - } + return false; +}; - if(this.element_legend_childs.resize_handler !== null) - $(this.element_legend_childs.resize_handler).popover('hide'); +NETDATA.d3ChartCreate = function(state, data) { + void(state); + void(data); - if(this.element_legend_childs.content !== null) - $(this.element_legend_childs.content).popover('hide'); - } + return false; +}; - if(NETDATA.options.current.destroy_on_hide === true) { - if(this.debug === true) - this.log('hideChart(): initializing chart'); +// peity - // we should destroy it - init('force'); +NETDATA.peityInitialize = function (callback) { + if (typeof netdataNoPeitys === 'undefined' || !netdataNoPeitys) { + $.ajax({ + url: NETDATA.peity_js, + cache: true, + dataType: "script", + xhrFields: {withCredentials: true} // required for the cookie + }) + .done(function () { + NETDATA.registerChartLibrary('peity', NETDATA.peity_js); + }) + .fail(function () { + NETDATA.chartLibraries.peity.enabled = false; + NETDATA.error(100, NETDATA.peity_js); + }) + .always(function () { + if (typeof callback === "function") { + return callback(); } - else { - if(this.debug === true) - this.log('hideChart(): hiding chart'); + }); + } else { + NETDATA.chartLibraries.peity.enabled = false; + if (typeof callback === "function") { + return callback(); + } + } +}; - showRendering(); - this.element_chart.style.display = 'none'; - this.element.style.willChange = 'auto'; - if(this.element_legend !== null) this.element_legend.style.display = 'none'; - if(this.element_legend_childs.toolbox !== null) this.element_legend_childs.toolbox.style.display = 'none'; - if(this.element_legend_childs.resize_handler !== null) this.element_legend_childs.resize_handler.style.display = 'none'; +NETDATA.peityChartUpdate = function (state, data) { + state.peity_instance.innerHTML = data.result; - this.tm.last_hidden = Date.now(); + if (state.peity_options.stroke !== state.chartCustomColors()[0]) { + state.peity_options.stroke = state.chartCustomColors()[0]; + if (state.chart.chart_type === 'line') { + state.peity_options.fill = NETDATA.themes.current.background; + } else { + state.peity_options.fill = NETDATA.colorLuminance(state.chartCustomColors()[0], NETDATA.chartDefaults.fill_luminance); + } + } - // de-allocate data - // This works, but I not sure there are no corner cases somewhere - // so it is commented - if the user has memory issues he can - // set Destroy on Hide for all charts - // this.data = null; - } - } + $(state.peity_instance).peity('line', state.peity_options); + return true; +}; - this.tmp.___chartIsHidden___ = true; - }; +NETDATA.peityChartCreate = function (state, data) { + state.peity_instance = document.createElement('div'); + state.element_chart.appendChild(state.peity_instance); - // unhide the chart, when it is visible - called from isVisible() - this.unhideChart = function() { - if(isHidden() === false) return; + state.peity_options = { + stroke: NETDATA.themes.current.foreground, + strokeWidth: NETDATA.dataAttribute(state.element, 'peity-strokewidth', 1), + width: state.chartWidth(), + height: state.chartHeight(), + fill: NETDATA.themes.current.foreground + }; - this.tmp.___chartIsHidden___ = undefined; - this.updates_since_last_unhide = 0; + NETDATA.peityChartUpdate(state, data); + return true; +}; - if(this.chart_created === false) { - if(this.debug === true) - this.log('unhideChart(): initializing chart'); +// Charts Libraries Registration - // we need to re-initialize it, to show our background - // logo in bootstrap tabs, until the chart loads - init('force'); +NETDATA.chartLibraries = { + "dygraph": { + initialize: NETDATA.dygraphInitialize, + create: NETDATA.dygraphChartCreate, + update: NETDATA.dygraphChartUpdate, + resize: function (state) { + if (typeof state.tmp.dygraph_instance !== 'undefined' && typeof state.tmp.dygraph_instance.resize === 'function') { + state.tmp.dygraph_instance.resize(); } - else { - if(this.debug === true) - this.log('unhideChart(): unhiding chart'); - - this.element.style.willChange = 'transform'; - this.tm.last_unhidden = Date.now(); - this.element_chart.style.display = ''; - if(this.element_legend !== null) this.element_legend.style.display = ''; - if(this.element_legend_childs.toolbox !== null) this.element_legend_childs.toolbox.style.display = ''; - if(this.element_legend_childs.resize_handler !== null) this.element_legend_childs.resize_handler.style.display = ''; - resizeChart(); - hideMessage(); + }, + setSelection: NETDATA.dygraphSetSelection, + clearSelection: NETDATA.dygraphClearSelection, + toolboxPanAndZoom: NETDATA.dygraphToolboxPanAndZoom, + initialized: false, + enabled: true, + xssRegexIgnore: new RegExp('^/api/v1/data\.result.data$'), + format: function (state) { + void(state); + return 'json'; + }, + options: function (state) { + return 'ms' + '%7C' + 'flip' + (this.isLogScale(state) ? ('%7C' + 'abs') : '').toString(); + }, + legend: function (state) { + return (this.isSparkline(state) === false && NETDATA.dataAttributeBoolean(state.element, 'legend', true) === true) ? 'right-side' : null; + }, + autoresize: function (state) { + void(state); + return true; + }, + max_updates_to_recreate: function (state) { + void(state); + return 5000; + }, + track_colors: function (state) { + void(state); + return true; + }, + pixels_per_point: function (state) { + return (this.isSparkline(state) === false) ? 3 : 2; + }, + isSparkline: function (state) { + if (typeof state.tmp.dygraph_sparkline === 'undefined') { + state.tmp.dygraph_sparkline = (this.theme(state) === 'sparkline'); } + return state.tmp.dygraph_sparkline; + }, + isLogScale: function (state) { + if (typeof state.tmp.dygraph_logscale === 'undefined') { + state.tmp.dygraph_logscale = (this.theme(state) === 'logscale'); + } + return state.tmp.dygraph_logscale; + }, + theme: function (state) { + if (typeof state.tmp.dygraph_theme === 'undefined') { + state.tmp.dygraph_theme = NETDATA.dataAttribute(state.element, 'dygraph-theme', 'default'); + } + return state.tmp.dygraph_theme; + }, + container_class: function (state) { + if (this.legend(state) !== null) { + return 'netdata-container-with-legend'; + } + return 'netdata-container'; + } + }, + "sparkline": { + initialize: NETDATA.sparklineInitialize, + create: NETDATA.sparklineChartCreate, + update: NETDATA.sparklineChartUpdate, + resize: null, + setSelection: undefined, // function(state, t) { void(state); return true; }, + clearSelection: undefined, // function(state) { void(state); return true; }, + toolboxPanAndZoom: null, + initialized: false, + enabled: true, + xssRegexIgnore: new RegExp('^/api/v1/data\.result$'), + format: function (state) { + void(state); + return 'array'; + }, + options: function (state) { + void(state); + return 'flip' + '%7C' + 'abs'; + }, + legend: function (state) { + void(state); + return null; + }, + autoresize: function (state) { + void(state); + return false; + }, + max_updates_to_recreate: function (state) { + void(state); + return 5000; + }, + track_colors: function (state) { + void(state); + return false; + }, + pixels_per_point: function (state) { + void(state); + return 3; + }, + container_class: function (state) { + void(state); + return 'netdata-container'; + } + }, + "peity": { + initialize: NETDATA.peityInitialize, + create: NETDATA.peityChartCreate, + update: NETDATA.peityChartUpdate, + resize: null, + setSelection: undefined, // function(state, t) { void(state); return true; }, + clearSelection: undefined, // function(state) { void(state); return true; }, + toolboxPanAndZoom: null, + initialized: false, + enabled: true, + xssRegexIgnore: new RegExp('^/api/v1/data\.result$'), + format: function (state) { + void(state); + return 'ssvcomma'; + }, + options: function (state) { + void(state); + return 'null2zero' + '%7C' + 'flip' + '%7C' + 'abs'; + }, + legend: function (state) { + void(state); + return null; + }, + autoresize: function (state) { + void(state); + return false; + }, + max_updates_to_recreate: function (state) { + void(state); + return 5000; + }, + track_colors: function (state) { + void(state); + return false; + }, + pixels_per_point: function (state) { + void(state); + return 3; + }, + container_class: function (state) { + void(state); + return 'netdata-container'; + } + }, + // "morris": { + // initialize: NETDATA.morrisInitialize, + // create: NETDATA.morrisChartCreate, + // update: NETDATA.morrisChartUpdate, + // resize: null, + // setSelection: undefined, // function(state, t) { void(state); return true; }, + // clearSelection: undefined, // function(state) { void(state); return true; }, + // toolboxPanAndZoom: null, + // initialized: false, + // enabled: true, + // xssRegexIgnore: new RegExp('^/api/v1/data\.result.data$'), + // format: function(state) { void(state); return 'json'; }, + // options: function(state) { void(state); return 'objectrows' + '%7C' + 'ms'; }, + // legend: function(state) { void(state); return null; }, + // autoresize: function(state) { void(state); return false; }, + // max_updates_to_recreate: function(state) { void(state); return 50; }, + // track_colors: function(state) { void(state); return false; }, + // pixels_per_point: function(state) { void(state); return 15; }, + // container_class: function(state) { void(state); return 'netdata-container'; } + // }, + "google": { + initialize: NETDATA.googleInitialize, + create: NETDATA.googleChartCreate, + update: NETDATA.googleChartUpdate, + resize: null, + setSelection: undefined, //function(state, t) { void(state); return true; }, + clearSelection: undefined, //function(state) { void(state); return true; }, + toolboxPanAndZoom: null, + initialized: false, + enabled: true, + xssRegexIgnore: new RegExp('^/api/v1/data\.result.rows$'), + format: function (state) { + void(state); + return 'datatable'; + }, + options: function (state) { + void(state); + return ''; + }, + legend: function (state) { + void(state); + return null; + }, + autoresize: function (state) { + void(state); + return false; + }, + max_updates_to_recreate: function (state) { + void(state); + return 300; + }, + track_colors: function (state) { + void(state); + return false; + }, + pixels_per_point: function (state) { + void(state); + return 4; + }, + container_class: function (state) { + void(state); + return 'netdata-container'; + } + }, + // "raphael": { + // initialize: NETDATA.raphaelInitialize, + // create: NETDATA.raphaelChartCreate, + // update: NETDATA.raphaelChartUpdate, + // resize: null, + // setSelection: undefined, // function(state, t) { void(state); return true; }, + // clearSelection: undefined, // function(state) { void(state); return true; }, + // toolboxPanAndZoom: null, + // initialized: false, + // enabled: true, + // xssRegexIgnore: new RegExp('^/api/v1/data\.result.data$'), + // format: function(state) { void(state); return 'json'; }, + // options: function(state) { void(state); return ''; }, + // legend: function(state) { void(state); return null; }, + // autoresize: function(state) { void(state); return false; }, + // max_updates_to_recreate: function(state) { void(state); return 5000; }, + // track_colors: function(state) { void(state); return false; }, + // pixels_per_point: function(state) { void(state); return 3; }, + // container_class: function(state) { void(state); return 'netdata-container'; } + // }, + // "c3": { + // initialize: NETDATA.c3Initialize, + // create: NETDATA.c3ChartCreate, + // update: NETDATA.c3ChartUpdate, + // resize: null, + // setSelection: undefined, // function(state, t) { void(state); return true; }, + // clearSelection: undefined, // function(state) { void(state); return true; }, + // toolboxPanAndZoom: null, + // initialized: false, + // enabled: true, + // xssRegexIgnore: new RegExp('^/api/v1/data\.result$'), + // format: function(state) { void(state); return 'csvjsonarray'; }, + // options: function(state) { void(state); return 'milliseconds'; }, + // legend: function(state) { void(state); return null; }, + // autoresize: function(state) { void(state); return false; }, + // max_updates_to_recreate: function(state) { void(state); return 5000; }, + // track_colors: function(state) { void(state); return false; }, + // pixels_per_point: function(state) { void(state); return 15; }, + // container_class: function(state) { void(state); return 'netdata-container'; } + // }, + "d3pie": { + initialize: NETDATA.d3pieInitialize, + create: NETDATA.d3pieChartCreate, + update: NETDATA.d3pieChartUpdate, + resize: null, + setSelection: NETDATA.d3pieSetSelection, + clearSelection: NETDATA.d3pieClearSelection, + toolboxPanAndZoom: null, + initialized: false, + enabled: true, + xssRegexIgnore: new RegExp('^/api/v1/data\.result.data$'), + format: function (state) { + void(state); + return 'json'; + }, + options: function (state) { + void(state); + return 'objectrows' + '%7C' + 'ms'; + }, + legend: function (state) { + void(state); + return null; + }, + autoresize: function (state) { + void(state); + return false; + }, + max_updates_to_recreate: function (state) { + void(state); + return 5000; + }, + track_colors: function (state) { + void(state); + return false; + }, + pixels_per_point: function (state) { + void(state); + return 15; + }, + container_class: function (state) { + void(state); + return 'netdata-container'; + } + }, + "d3": { + initialize: NETDATA.d3Initialize, + create: NETDATA.d3ChartCreate, + update: NETDATA.d3ChartUpdate, + resize: null, + setSelection: undefined, // function(state, t) { void(state); return true; }, + clearSelection: undefined, // function(state) { void(state); return true; }, + toolboxPanAndZoom: null, + initialized: false, + enabled: true, + xssRegexIgnore: new RegExp('^/api/v1/data\.result.data$'), + format: function (state) { + void(state); + return 'json'; + }, + options: function (state) { + void(state); + return ''; + }, + legend: function (state) { + void(state); + return null; + }, + autoresize: function (state) { + void(state); + return false; + }, + max_updates_to_recreate: function (state) { + void(state); + return 5000; + }, + track_colors: function (state) { + void(state); + return false; + }, + pixels_per_point: function (state) { + void(state); + return 3; + }, + container_class: function (state) { + void(state); + return 'netdata-container'; + } + }, + "easypiechart": { + initialize: NETDATA.easypiechartInitialize, + create: NETDATA.easypiechartChartCreate, + update: NETDATA.easypiechartChartUpdate, + resize: null, + setSelection: NETDATA.easypiechartSetSelection, + clearSelection: NETDATA.easypiechartClearSelection, + toolboxPanAndZoom: null, + initialized: false, + enabled: true, + xssRegexIgnore: new RegExp('^/api/v1/data\.result$'), + format: function (state) { + void(state); + return 'array'; + }, + options: function (state) { + void(state); + return 'absolute'; + }, + legend: function (state) { + void(state); + return null; + }, + autoresize: function (state) { + void(state); + return false; + }, + max_updates_to_recreate: function (state) { + void(state); + return 5000; + }, + track_colors: function (state) { + void(state); + return true; + }, + pixels_per_point: function (state) { + void(state); + return 3; + }, + aspect_ratio: 100, + container_class: function (state) { + void(state); + return 'netdata-container-easypiechart'; + } + }, + "gauge": { + initialize: NETDATA.gaugeInitialize, + create: NETDATA.gaugeChartCreate, + update: NETDATA.gaugeChartUpdate, + resize: null, + setSelection: NETDATA.gaugeSetSelection, + clearSelection: NETDATA.gaugeClearSelection, + toolboxPanAndZoom: null, + initialized: false, + enabled: true, + xssRegexIgnore: new RegExp('^/api/v1/data\.result$'), + format: function (state) { + void(state); + return 'array'; + }, + options: function (state) { + void(state); + return 'absolute'; + }, + legend: function (state) { + void(state); + return null; + }, + autoresize: function (state) { + void(state); + return false; + }, + max_updates_to_recreate: function (state) { + void(state); + return 5000; + }, + track_colors: function (state) { + void(state); + return true; + }, + pixels_per_point: function (state) { + void(state); + return 3; + }, + aspect_ratio: 60, + container_class: function (state) { + void(state); + return 'netdata-container-gauge'; + } + } +}; - if(this.__redraw_on_unhide === true) { - - if(this.debug === true) - this.log("redrawing chart on unhide"); +NETDATA.registerChartLibrary = function (library, url) { + if (NETDATA.options.debug.libraries) { + console.log("registering chart library: " + library); + } - this.__redraw_on_unhide = undefined; - this.redrawChart(); - } - }; + NETDATA.chartLibraries[library].url = url; + NETDATA.chartLibraries[library].initialized = true; + NETDATA.chartLibraries[library].enabled = true; +}; - var canBeRendered = function(uncached_visibility) { - if(that.debug === true) - that.log('canBeRendered() called'); +// *** src/dashboard.js/chart-registry.js - if(NETDATA.options.current.update_only_visible === false) - return true; +// Chart Registry - var ret = ( - ( - NETDATA.options.page_is_visible === true || - NETDATA.options.current.stop_updates_when_focus_is_lost === false || - that.updates_since_last_unhide === 0 - ) - && isHidden() === false && that.isVisible(uncached_visibility) === true - ); +// When multiple charts need the same chart, we avoid downloading it +// multiple times (and having it in browser memory multiple time) +// by using this registry. - if(that.debug === true) - that.log('canBeRendered(): ' + ret); +// Every time we download a chart definition, we save it here with .add() +// Then we try to get it back with .get(). If that fails, we download it. - return ret; - }; +NETDATA.fixHost = function (host) { + while (host.slice(-1) === '/') { + host = host.substring(0, host.length - 1); + } - // https://github.com/petkaantonov/bluebird/wiki/Optimization-killers - var callChartLibraryUpdateSafely = function(data) { - var status; + return host; +}; - // we should not do this here - // if we prevent rendering the chart then: - // 1. globalSelectionSync will be wrong - // 2. globalPanAndZoom will be wrong - //if(canBeRendered(true) === false) - // return false; +NETDATA.chartRegistry = { + charts: {}, - if(NETDATA.options.fake_chart_rendering === true) - return true; + globalReset: function () { + this.charts = {}; + }, - that.updates_counter++; - that.updates_since_last_unhide++; - that.updates_since_last_creation++; + add: function (host, id, data) { + if (typeof this.charts[host] === 'undefined') { + this.charts[host] = {}; + } - if(NETDATA.options.debug.chart_errors === true) - status = that.library.update(that, data); - else { - try { - status = that.library.update(that, data); - } - catch(err) { - status = false; - } - } + //console.log('added ' + host + '/' + id); + this.charts[host][id] = data; + }, - if(status === false) { - error('chart failed to be updated as ' + that.library_name); - return false; - } + get: function (host, id) { + if (typeof this.charts[host] === 'undefined') { + return null; + } - return true; - }; + if (typeof this.charts[host][id] === 'undefined') { + return null; + } - // https://github.com/petkaantonov/bluebird/wiki/Optimization-killers - var callChartLibraryCreateSafely = function(data) { - var status; + //console.log('cached ' + host + '/' + id); + return this.charts[host][id]; + }, - // we should not do this here - // if we prevent rendering the chart then: - // 1. globalSelectionSync will be wrong - // 2. globalPanAndZoom will be wrong - //if(canBeRendered(true) === false) - // return false; + downloadAll: function (host, callback) { + host = NETDATA.fixHost(host); - if(NETDATA.options.fake_chart_rendering === true) - return true; + let self = this; - that.updates_counter++; - that.updates_since_last_unhide++; - that.updates_since_last_creation++; + function got_data(h, data, callback) { + if (data !== null) { + self.charts[h] = data.charts; - if(NETDATA.options.debug.chart_errors === true) - status = that.library.create(that, data); - else { - try { - status = that.library.create(that, data); - } - catch(err) { - status = false; + // update the server timezone in our options + if (typeof data.timezone === 'string') { + NETDATA.options.server_timezone = data.timezone; } + } else { + NETDATA.error(406, h + '/api/v1/charts'); } - if(status === false) { - error('chart failed to be created as ' + that.library_name); - return false; + if (typeof callback === 'function') { + callback(data); } + } - that.chart_created = true; - that.updates_since_last_creation = 0; - return true; - }; + if (netdataSnapshotData !== null) { + got_data(host, netdataSnapshotData.charts, callback); + } else { + $.ajax({ + url: host + '/api/v1/charts', + async: true, + cache: false, + xhrFields: {withCredentials: true} // required for the cookie + }) + .done(function (data) { + data = NETDATA.xss.checkOptional('/api/v1/charts', data); + got_data(host, data, callback); + }) + .fail(function () { + NETDATA.error(405, host + '/api/v1/charts'); - // ---------------------------------------------------------------------------------------------------------------- - // Chart Resize + if (typeof callback === 'function') { + callback(null); + } + }); + } + } +}; - // resizeChart() - private - // to be called just before the chart library to make sure that - // a properly sized dom is available - var resizeChart = function() { - if(that.tm.last_resized < NETDATA.options.last_page_resize) { - if(that.chart_created === false) return; +// Compute common (joint) values over multiple charts. - if(that.needsRecreation()) { - if(that.debug === true) - that.log('resizeChart(): initializing chart'); - init('force'); - } - else if(typeof that.library.resize === 'function') { - if(that.debug === true) - that.log('resizeChart(): resizing chart'); +// commonMin & commonMax - that.library.resize(that); +NETDATA.commonMin = { + keys: {}, + latest: {}, - if(that.element_legend_childs.perfect_scroller !== null) - Ps.update(that.element_legend_childs.perfect_scroller); + globalReset: function () { + this.keys = {}; + this.latest = {}; + }, - maxMessageFontSize(); - } + get: function (state) { + if (typeof state.tmp.__commonMin === 'undefined') { + // get the commonMin setting + state.tmp.__commonMin = NETDATA.dataAttribute(state.element, 'common-min', null); + } - that.tm.last_resized = Date.now(); - } - }; + let min = state.data.min; + let name = state.tmp.__commonMin; - // this is the actual chart resize algorithm - // it will: - // - resize the entire container - // - update the internal states - // - resize the chart as the div changes height - // - update the scrollbar of the legend - var resizeChartToHeight = function(h) { - // console.log(h); - that.element.style.height = h; - - if(that.settings_id !== null) - NETDATA.localStorageSet('chart_heights.' + that.settings_id, h); - - var now = Date.now(); - NETDATA.options.last_page_scroll = now; - NETDATA.options.auto_refresher_stop_until = now + NETDATA.options.current.stop_updates_while_resizing; - - // force a resize - that.tm.last_resized = 0; - resizeChart(); - }; + if (name === null) { + // we don't need commonMin + //state.log('no need for commonMin'); + return min; + } - this.resizeForPrint = function() { - if(typeof this.element_legend_childs !== 'undefined' && this.element_legend_childs.perfect_scroller !== null) { - var current = this.element.clientHeight; - var optimal = current - + this.element_legend_childs.perfect_scroller.scrollHeight - - this.element_legend_childs.perfect_scroller.clientHeight; + let t = this.keys[name]; + if (typeof t === 'undefined') { + // add our commonMin + this.keys[name] = {}; + t = this.keys[name]; + } - if(optimal > current) { - // this.log('resized'); - this.element.style.height = optimal + 'px'; - this.library.resize(this); - } + let uuid = state.uuid; + if (typeof t[uuid] !== 'undefined') { + if (t[uuid] === min) { + //state.log('commonMin ' + state.tmp.__commonMin + ' not changed: ' + this.latest[name]); + return this.latest[name]; + } else if (min < this.latest[name]) { + //state.log('commonMin ' + state.tmp.__commonMin + ' increased: ' + min); + t[uuid] = min; + this.latest[name] = min; + return min; } - }; - - this.resizeHandler = function(e) { - e.preventDefault(); + } - if(typeof this.event_resize === 'undefined' - || this.event_resize.chart_original_w === 'undefined' - || this.event_resize.chart_original_h === 'undefined') - this.event_resize = { - chart_original_w: this.element.clientWidth, - chart_original_h: this.element.clientHeight, - last: 0 - }; + // add our min + t[uuid] = min; - if(e.type === 'touchstart') { - this.event_resize.mouse_start_x = e.touches.item(0).pageX; - this.event_resize.mouse_start_y = e.touches.item(0).pageY; - } - else { - this.event_resize.mouse_start_x = e.clientX; - this.event_resize.mouse_start_y = e.clientY; + // find the common min + let m = min; + // for (let i in t) { + // if (t.hasOwnProperty(i) && t[i] < m) m = t[i]; + // } + for (const ti of Object.values(t)) { + if (ti < m) { + m = ti; } + } - this.event_resize.chart_start_w = this.element.clientWidth; - this.event_resize.chart_start_h = this.element.clientHeight; - this.event_resize.chart_last_w = this.element.clientWidth; - this.event_resize.chart_last_h = this.element.clientHeight; + //state.log('commonMin ' + state.tmp.__commonMin + ' updated: ' + m); + this.latest[name] = m; + return m; + } +}; - var now = Date.now(); - if(now - this.event_resize.last <= NETDATA.options.current.double_click_speed && this.element_legend_childs.perfect_scroller !== null) { - // double click / double tap event +NETDATA.commonMax = { + keys: {}, + latest: {}, - // console.dir(this.element_legend_childs.content); - // console.dir(this.element_legend_childs.perfect_scroller); + globalReset: function () { + this.keys = {}; + this.latest = {}; + }, - // the optimal height of the chart - // showing the entire legend - var optimal = this.event_resize.chart_last_h - + this.element_legend_childs.perfect_scroller.scrollHeight - - this.element_legend_childs.perfect_scroller.clientHeight; + get: function (state) { + if (typeof state.tmp.__commonMax === 'undefined') { + // get the commonMax setting + state.tmp.__commonMax = NETDATA.dataAttribute(state.element, 'common-max', null); + } - // if we are not optimal, be optimal - if(this.event_resize.chart_last_h !== optimal) { - // this.log('resize to optimal, current = ' + this.event_resize.chart_last_h.toString() + 'px, original = ' + this.event_resize.chart_original_h.toString() + 'px, optimal = ' + optimal.toString() + 'px, internal = ' + this.height_original.toString()); - resizeChartToHeight(optimal.toString() + 'px'); - } + let max = state.data.max; + let name = state.tmp.__commonMax; - // else if the current height is not the original/saved height - // reset to the original/saved height - else if(this.event_resize.chart_last_h !== this.event_resize.chart_original_h) { - // this.log('resize to original, current = ' + this.event_resize.chart_last_h.toString() + 'px, original = ' + this.event_resize.chart_original_h.toString() + 'px, optimal = ' + optimal.toString() + 'px, internal = ' + this.height_original.toString()); - resizeChartToHeight(this.event_resize.chart_original_h.toString() + 'px'); - } + if (name === null) { + // we don't need commonMax + //state.log('no need for commonMax'); + return max; + } - // else if the current height is not the internal default height - // reset to the internal default height - else if((this.event_resize.chart_last_h.toString() + 'px') !== this.height_original) { - // this.log('resize to internal default, current = ' + this.event_resize.chart_last_h.toString() + 'px, original = ' + this.event_resize.chart_original_h.toString() + 'px, optimal = ' + optimal.toString() + 'px, internal = ' + this.height_original.toString()); - resizeChartToHeight(this.height_original.toString()); - } + let t = this.keys[name]; + if (typeof t === 'undefined') { + // add our commonMax + this.keys[name] = {}; + t = this.keys[name]; + } - // else if the current height is not the firstchild's clientheight - // resize to it - else if(typeof this.element_legend_childs.perfect_scroller.firstChild !== 'undefined') { - var parent_rect = this.element.getBoundingClientRect(); - var content_rect = this.element_legend_childs.perfect_scroller.firstElementChild.getBoundingClientRect(); - var wanted = content_rect.top - parent_rect.top + this.element_legend_childs.perfect_scroller.firstChild.clientHeight + 18; // 15 = toolbox + 3 space + let uuid = state.uuid; + if (typeof t[uuid] !== 'undefined') { + if (t[uuid] === max) { + //state.log('commonMax ' + state.tmp.__commonMax + ' not changed: ' + this.latest[name]); + return this.latest[name]; + } else if (max > this.latest[name]) { + //state.log('commonMax ' + state.tmp.__commonMax + ' increased: ' + max); + t[uuid] = max; + this.latest[name] = max; + return max; + } + } - // console.log(parent_rect); - // console.log(content_rect); - // console.log(wanted); + // add our max + t[uuid] = max; - // this.log('resize to firstChild, current = ' + this.event_resize.chart_last_h.toString() + 'px, original = ' + this.event_resize.chart_original_h.toString() + 'px, optimal = ' + optimal.toString() + 'px, internal = ' + this.height_original.toString() + 'px, firstChild = ' + wanted.toString() + 'px' ); - if(this.event_resize.chart_last_h !== wanted) - resizeChartToHeight(wanted.toString() + 'px'); - } + // find the common max + let m = max; + // for (let i in t) { + // if (t.hasOwnProperty(i) && t[i] > m) m = t[i]; + // } + for (const ti of Object.values(t)) { + if (ti > m) { + m = ti; } - else { - this.event_resize.last = now; + } - // process movement event - document.onmousemove = - document.ontouchmove = - this.element_legend_childs.resize_handler.onmousemove = - this.element_legend_childs.resize_handler.ontouchmove = - function(e) { - var y = null; - - switch(e.type) { - case 'mousemove': y = e.clientY; break; - case 'touchmove': y = e.touches.item(e.touches - 1).pageY; break; - } + //state.log('commonMax ' + state.tmp.__commonMax + ' updated: ' + m); + this.latest[name] = m; + return m; + } +}; - if(y !== null) { - var newH = that.event_resize.chart_start_h + y - that.event_resize.mouse_start_y; +NETDATA.commonColors = { + keys: {}, - if(newH >= 70 && newH !== that.event_resize.chart_last_h) { - resizeChartToHeight(newH.toString() + 'px'); - that.event_resize.chart_last_h = newH; - } - } - }; + globalReset: function () { + this.keys = {}; + }, - // process end event - document.onmouseup = - document.ontouchend = - this.element_legend_childs.resize_handler.onmouseup = - this.element_legend_childs.resize_handler.ontouchend = - function(e) { - void(e); - - // remove all the hooks - document.onmouseup = - document.onmousemove = - document.ontouchmove = - document.ontouchend = - that.element_legend_childs.resize_handler.onmousemove = - that.element_legend_childs.resize_handler.ontouchmove = - that.element_legend_childs.resize_handler.onmouseout = - that.element_legend_childs.resize_handler.onmouseup = - that.element_legend_childs.resize_handler.ontouchend = - null; - - // allow auto-refreshes - NETDATA.options.auto_refresher_stop_until = 0; - }; - } - }; + get: function (state, label) { + let ret = this.refill(state); + if (typeof ret.assigned[label] === 'undefined') { + ret.assigned[label] = ret.available.shift(); + } - var noDataToShow = function() { - showMessageIcon(NETDATA.icons.noData + ' empty'); - that.legendUpdateDOM(); - that.tm.last_autorefreshed = Date.now(); - // that.data_update_every = 30 * 1000; - //that.element_chart.style.display = 'none'; - //if(that.element_legend !== null) that.element_legend.style.display = 'none'; - //that.tmp.___chartIsHidden___ = true; - }; + return ret.assigned[label]; + }, - // ============================================================================================================ - // PUBLIC FUNCTIONS + refill: function (state) { + let ret, len; - this.error = function(msg) { - error(msg); - }; + if (typeof state.tmp.__commonColors === 'undefined') { + ret = this.prepare(state); + } else { + ret = this.keys[state.tmp.__commonColors]; + if (typeof ret === 'undefined') { + ret = this.prepare(state); + } + } - this.setMode = function(m) { - if(this.current !== null && this.current.name === m) return; + if (ret.available.length === 0) { + if (ret.copy_theme || ret.custom.length === 0) { + // copy the theme colors + len = NETDATA.themes.current.colors.length; + while (len--) { + ret.available.unshift(NETDATA.themes.current.colors[len]); + } + } - if(m === 'auto') - this.current = this.auto; - else if(m === 'pan') - this.current = this.pan; - else if(m === 'zoom') - this.current = this.zoom; - else - this.current = this.auto; + // copy the custom colors + len = ret.custom.length; + while (len--) { + ret.available.unshift(ret.custom[len]); + } + } - this.current.force_update_at = 0; - this.current.force_before_ms = null; - this.current.force_after_ms = null; + state.colors_assigned = ret.assigned; + state.colors_available = ret.available; + state.colors_custom = ret.custom; - this.tm.last_mode_switch = Date.now(); - }; + return ret; + }, - // ---------------------------------------------------------------------------------------------------------------- - // global selection sync for slaves + __read_custom_colors: function (state, ret) { + // add the user supplied colors + let c = NETDATA.dataAttribute(state.element, 'colors', undefined); + if (typeof c === 'string' && c.length > 0) { + c = c.split(' '); + let len = c.length; - // can the chart participate to the global selection sync as a slave? - this.globalSelectionSyncIsEligible = function() { - return (this.enabled === true - && this.library !== null - && typeof this.library.setSelection === 'function' - && this.isVisible() === true - && this.chart_created === true); - }; + if (len > 0 && c[len - 1] === 'ONLY') { + len--; + ret.copy_theme = false; + } - this.setSelection = function(t) { - if(typeof this.library.setSelection === 'function') - this.selected = (this.library.setSelection(this, t) === true); - else - this.selected = true; + while (len--) { + ret.custom.unshift(c[len]); + } + } + }, - if(this.selected === true && this.debug === true) - this.log('selection set to ' + t.toString()); + prepare: function (state) { + let has_custom_colors = false; - if (this.foreign_element_selection !== null) - this.foreign_element_selection.innerText = NETDATA.dateTime.localeDateString(t) + ' ' + NETDATA.dateTime.localeTimeString(t); + if (typeof state.tmp.__commonColors === 'undefined') { + let defname = state.chart.context; - return this.selected; - }; + // if this chart has data-colors="" + // we should use the chart uuid as the default key (private palette) + // (data-common-colors="NAME" will be used anyways) + let c = NETDATA.dataAttribute(state.element, 'colors', undefined); + if (typeof c === 'string' && c.length > 0) { + defname = state.uuid; + has_custom_colors = true; + } - this.clearSelection = function() { - if(this.selected === true) { - if(typeof this.library.clearSelection === 'function') - this.selected = (this.library.clearSelection(this) !== true); - else - this.selected = false; + // get the commonColors setting + state.tmp.__commonColors = NETDATA.dataAttribute(state.element, 'common-colors', defname); + } - if(this.selected === false && this.debug === true) - this.log('selection cleared'); + let name = state.tmp.__commonColors; + let ret = this.keys[name]; - if (this.foreign_element_selection !== null) - this.foreign_element_selection.innerText = ''; + if (typeof ret === 'undefined') { + // add our commonMax + this.keys[name] = { + assigned: {}, // name-value of dimensions and their colors + available: [], // an array of colors available to be used + custom: [], // the array of colors defined by the user + charts: {}, // the charts linked to this + copy_theme: true + }; + ret = this.keys[name]; + } - this.legendReset(); + if (typeof ret.charts[state.uuid] === 'undefined') { + ret.charts[state.uuid] = state; + + if (has_custom_colors) { + this.__read_custom_colors(state, ret); } + } - return this.selected; - }; + return ret; + } +}; - // ---------------------------------------------------------------------------------------------------------------- +// *** src/dashboard.js/main.js - // find if a timestamp (ms) is shown in the current chart - this.timeIsVisible = function(t) { - return (t >= this.data_after && t <= this.data_before); - }; +if (NETDATA.options.debug.main_loop) { + console.log('welcome to NETDATA'); +} - this.calculateRowForTime = function(t) { - if(this.timeIsVisible(t) === false) return -1; - return Math.floor((t - this.data_after) / this.data_update_every); - }; +NETDATA.onresizeCallback = null; +NETDATA.onresize = function () { + NETDATA.options.last_page_resize = Date.now(); + NETDATA.onscroll(); - // ---------------------------------------------------------------------------------------------------------------- + if (typeof NETDATA.onresizeCallback === 'function') { + NETDATA.onresizeCallback(); + } +}; - this.pauseChart = function() { - if(this.paused === false) { - if(this.debug === true) - this.log('pauseChart()'); +NETDATA.abortAllRefreshes = function () { + let targets = NETDATA.options.targets; + let len = targets.length; - this.paused = true; + while (len--) { + if (targets[len].fetching_data) { + if (typeof targets[len].xhr !== 'undefined') { + targets[len].xhr.abort(); + targets[len].running = false; + targets[len].fetching_data = false; } - }; + } + } +}; - this.unpauseChart = function() { - if(this.paused === true) { - if(this.debug === true) - this.log('unpauseChart()'); +NETDATA.onscrollStartDelay = function () { + NETDATA.options.last_page_scroll = Date.now(); - this.paused = false; - } - }; + NETDATA.options.on_scroll_refresher_stop_until = + NETDATA.options.last_page_scroll + + (NETDATA.options.current.async_on_scroll ? 1000 : 0); +}; - this.resetChart = function(dont_clear_master, dont_update) { - if(this.debug === true) - this.log('resetChart(' + dont_clear_master + ', ' + dont_update + ') called'); +NETDATA.onscrollEndDelay = function () { + NETDATA.options.on_scroll_refresher_stop_until = + Date.now() + + (NETDATA.options.current.async_on_scroll ? NETDATA.options.current.onscroll_worker_duration_threshold : 0); +}; - if(typeof dont_clear_master === 'undefined') - dont_clear_master = false; +NETDATA.onscroll_updater_timeout_id = undefined; +NETDATA.onscrollUpdater = function () { + NETDATA.globalSelectionSync.stop(); - if(typeof dont_update === 'undefined') - dont_update = false; + if (NETDATA.options.abort_ajax_on_scroll) { + NETDATA.abortAllRefreshes(); + } - if(dont_clear_master !== true && NETDATA.globalPanAndZoom.isMaster(this) === true) { - if(this.debug === true) - this.log('resetChart() diverting to clearMaster().'); - // this will call us back with master === true - NETDATA.globalPanAndZoom.clearMaster(); - return; + // when the user scrolls he sees that we have + // hidden all the not-visible charts + // using this little function we try to switch + // the charts back to visible quickly + + if (!NETDATA.intersectionObserver.enabled()) { + if (!NETDATA.options.current.parallel_refresher) { + let targets = NETDATA.options.targets; + let len = targets.length; + + while (len--) { + if (!targets[len].running) { + targets[len].isVisible(); + } } + } + } - this.clearSelection(); + NETDATA.onscrollEndDelay(); +}; - this.tm.pan_and_zoom_seq = 0; +NETDATA.scrollUp = false; +NETDATA.scrollY = window.scrollY; +NETDATA.onscroll = function () { + //console.log('onscroll() begin'); - this.setMode('auto'); - this.current.force_update_at = 0; - this.current.force_before_ms = null; - this.current.force_after_ms = null; - this.tm.last_autorefreshed = 0; - this.paused = false; - this.selected = false; - this.enabled = true; - // this.debug = false; + NETDATA.onscrollStartDelay(); + NETDATA.chartRefresherReschedule(); - // do not update the chart here - // or the chart will flip-flop when it is the master - // of a selection sync and another chart becomes - // the new master + NETDATA.scrollUp = (window.scrollY > NETDATA.scrollY); + NETDATA.scrollY = window.scrollY; - if(dont_update !== true && this.isVisible() === true) { - this.updateChart(); - } - }; + if (NETDATA.onscroll_updater_timeout_id) { + NETDATA.timeout.clear(NETDATA.onscroll_updater_timeout_id); + } - this.updateChartPanOrZoom = function(after, before, callback) { - var logme = 'updateChartPanOrZoom(' + after + ', ' + before + '): '; - var ret = true; + NETDATA.onscroll_updater_timeout_id = NETDATA.timeout.set(NETDATA.onscrollUpdater, 0); + //console.log('onscroll() end'); +}; - NETDATA.globalPanAndZoom.delay(); - NETDATA.globalSelectionSync.delay(); +NETDATA.supportsPassiveEvents = function () { + if (NETDATA.options.passive_events === null) { + let supportsPassive = false; + try { + let opts = Object.defineProperty({}, 'passive', { + get: function () { + supportsPassive = true; + } + }); + window.addEventListener("test", null, opts); + } catch (e) { + console.log('browser does not support passive events'); + } - if(this.debug === true) - this.log(logme); + NETDATA.options.passive_events = supportsPassive; + } - if(before < after) { - if(this.debug === true) - this.log(logme + 'flipped parameters, rejecting it.'); + // console.log('passive ' + NETDATA.options.passive_events); + return NETDATA.options.passive_events; +}; - return false; - } +window.addEventListener('resize', NETDATA.onresize, NETDATA.supportsPassiveEvents() ? {passive: true} : false); +window.addEventListener('scroll', NETDATA.onscroll, NETDATA.supportsPassiveEvents() ? {passive: true} : false); +// window.onresize = NETDATA.onresize; +// window.onscroll = NETDATA.onscroll; - if(typeof this.fixed_min_duration === 'undefined') - this.fixed_min_duration = Math.round((this.chartWidth() / 30) * this.chart.update_every * 1000); +// ---------------------------------------------------------------------------------------------------------------- +// Global Pan and Zoom on charts - var min_duration = this.fixed_min_duration; - var current_duration = Math.round(this.view_before - this.view_after); +// Using this structure are synchronize all the charts, so that +// when you pan or zoom one, all others are automatically refreshed +// to the same timespan. - // round the numbers - after = Math.round(after); - before = Math.round(before); +NETDATA.globalPanAndZoom = { + seq: 0, // timestamp ms + // every time a chart is panned or zoomed + // we set the timestamp here + // then we use it as a sequence number + // to find if other charts are synchronized + // to this time-range - // align them to update_every - // stretching them further away - after -= after % this.data_update_every; - before += this.data_update_every - (before % this.data_update_every); + master: null, // the master chart (state), to which all others + // are synchronized - // the final wanted duration - var wanted_duration = before - after; + force_before_ms: null, // the timespan to sync all other charts + force_after_ms: null, - // to allow panning, accept just a point below our minimum - if((current_duration - this.data_update_every) < min_duration) - min_duration = current_duration - this.data_update_every; + callback: null, - // we do it, but we adjust to minimum size and return false - // when the wanted size is below the current and the minimum - // and we zoom - if(wanted_duration < current_duration && wanted_duration < min_duration) { - if(this.debug === true) - this.log(logme + 'too small: min_duration: ' + (min_duration / 1000).toString() + ', wanted: ' + (wanted_duration / 1000).toString()); + globalReset: function () { + this.clearMaster(); + this.seq = 0; + this.master = null; + this.force_after_ms = null; + this.force_before_ms = null; + this.callback = null; + }, - min_duration = this.fixed_min_duration; + delay: function () { + if (NETDATA.options.debug.globalPanAndZoom) { + console.log('globalPanAndZoom.delay()'); + } - var dt = (min_duration - wanted_duration) / 2; - before += dt; - after -= dt; - wanted_duration = before - after; - ret = false; - } + NETDATA.options.auto_refresher_stop_until = Date.now() + NETDATA.options.current.global_pan_sync_time; + }, - var tolerance = this.data_update_every * 2; - var movement = Math.abs(before - this.view_before); + // set a new master + setMaster: function (state, after, before) { + this.delay(); - if(Math.abs(current_duration - wanted_duration) <= tolerance && movement <= tolerance && ret === true) { - if(this.debug === true) - this.log(logme + 'REJECTING UPDATE: current/min duration: ' + (current_duration / 1000).toString() + '/' + (this.fixed_min_duration / 1000).toString() + ', wanted duration: ' + (wanted_duration / 1000).toString() + ', duration diff: ' + (Math.round(Math.abs(current_duration - wanted_duration) / 1000)).toString() + ', movement: ' + (movement / 1000).toString() + ', tolerance: ' + (tolerance / 1000).toString() + ', returning: ' + false); - return false; - } + if (!NETDATA.options.current.sync_pan_and_zoom) { + return; + } - if(this.current.name === 'auto') { - this.log(logme + 'caller called me with mode: ' + this.current.name); - this.setMode('pan'); + if (this.master === null) { + if (NETDATA.options.debug.globalPanAndZoom) { + console.log('globalPanAndZoom.setMaster(' + state.id + ', ' + after + ', ' + before + ') SET MASTER'); + } + } else if (this.master !== state) { + if (NETDATA.options.debug.globalPanAndZoom) { + console.log('globalPanAndZoom.setMaster(' + state.id + ', ' + after + ', ' + before + ') CHANGED MASTER'); } - if(this.debug === true) - this.log(logme + 'ACCEPTING UPDATE: current/min duration: ' + (current_duration / 1000).toString() + '/' + (this.fixed_min_duration / 1000).toString() + ', wanted duration: ' + (wanted_duration / 1000).toString() + ', duration diff: ' + (Math.round(Math.abs(current_duration - wanted_duration) / 1000)).toString() + ', movement: ' + (movement / 1000).toString() + ', tolerance: ' + (tolerance / 1000).toString() + ', returning: ' + ret); + this.master.resetChart(true, true); + } - this.current.force_update_at = Date.now() + NETDATA.options.current.pan_and_zoom_delay; - this.current.force_after_ms = after; - this.current.force_before_ms = before; - NETDATA.globalPanAndZoom.setMaster(this, after, before); + let now = Date.now(); + this.master = state; + this.seq = now; + this.force_after_ms = after; + this.force_before_ms = before; - if(ret === true && typeof callback === 'function') - callback(); + if (typeof this.callback === 'function') { + this.callback(true, after, before); + } + }, - return ret; - }; + // clear the master + clearMaster: function () { + // if (NETDATA.options.debug.globalPanAndZoom === true) + // console.log('globalPanAndZoom.clearMaster()'); + if (NETDATA.options.debug.globalPanAndZoom) { + console.log('globalPanAndZoom.clearMaster()'); + } - this.updateChartPanOrZoomAsyncTimeOutId = undefined; - this.updateChartPanOrZoomAsync = function(after, before, callback) { - NETDATA.globalPanAndZoom.delay(); - NETDATA.globalSelectionSync.delay(); + if (this.master !== null) { + let st = this.master; + this.master = null; + st.resetChart(); + } - if(NETDATA.globalPanAndZoom.isMaster(this) === false) { - this.pauseChart(); - NETDATA.globalPanAndZoom.setMaster(this, after, before); - // NETDATA.globalSelectionSync.stop(); - NETDATA.globalSelectionSync.setMaster(this); - } + this.master = null; + this.seq = 0; + this.force_after_ms = null; + this.force_before_ms = null; + NETDATA.options.auto_refresher_stop_until = 0; - if(this.updateChartPanOrZoomAsyncTimeOutId) - NETDATA.timeout.clear(this.updateChartPanOrZoomAsyncTimeOutId); + if (typeof this.callback === 'function') { + this.callback(false, 0, 0); + } + }, - NETDATA.timeout.set(function() { - that.updateChartPanOrZoomAsyncTimeOutId = undefined; - that.updateChartPanOrZoom(after, before, callback); - }, 0); - }; + // is the given state the master of the global + // pan and zoom sync? + isMaster: function (state) { + return (this.master === state); + }, - var __unitsConversionLastUnits = undefined; - var __unitsConversionLastUnitsDesired = undefined; - var __unitsConversionLastMin = undefined; - var __unitsConversionLastMax = undefined; - var __unitsConversion = function(value) { return value; }; - this.unitsConversionSetup = function(min, max) { - if(this.units !== __unitsConversionLastUnits - || this.units_desired !== __unitsConversionLastUnitsDesired - || min !== __unitsConversionLastMin - || max !== __unitsConversionLastMax) { - - __unitsConversionLastUnits = this.units; - __unitsConversionLastUnitsDesired = this.units_desired; - __unitsConversionLastMin = min; - __unitsConversionLastMax = max; - - __unitsConversion = NETDATA.unitsConversion.get(this.uuid, min, max, this.units, this.units_desired, this.units_common, function (units) { - // console.log('switching units from ' + that.units.toString() + ' to ' + units.toString()); - that.units_current = units; - that.legendSetUnitsString(that.units_current); - }); - } - }; + // are we currently have a global pan and zoom sync? + isActive: function () { + return (this.master !== null && this.force_before_ms !== null && this.force_after_ms !== null && this.seq !== 0); + }, - var __legendFormatValueChartDecimalsLastMin = undefined; - var __legendFormatValueChartDecimalsLastMax = undefined; - var __legendFormatValueChartDecimals = -1; - var __intlNumberFormat = null; - this.legendFormatValueDecimalsFromMinMax = function(min, max) { - if(min === __legendFormatValueChartDecimalsLastMin && max === __legendFormatValueChartDecimalsLastMax) - return; + // check if a chart, other than the master + // needs to be refreshed, due to the global pan and zoom + shouldBeAutoRefreshed: function (state) { + if (this.master === null || this.seq === 0) { + return false; + } - this.unitsConversionSetup(min, max); - if(__unitsConversion !== null) { - min = __unitsConversion(min); - max = __unitsConversion(max); + //if (state.needsRecreation()) + // return true; - if(typeof min !== 'number' || typeof max !== 'number') - return; + return (state.tm.pan_and_zoom_seq !== this.seq); + } +}; + +// ---------------------------------------------------------------------------------------------------------------- +// global chart underlay (time-frame highlighting) + +NETDATA.globalChartUnderlay = { + callback: null, // what to call when a highlighted range is setup + after: null, // highlight after this time + before: null, // highlight before this time + view_after: null, // the charts after_ms viewport when the highlight was setup + view_before: null, // the charts before_ms viewport, when the highlight was setup + state: null, // the chart the highlight was setup + + isActive: function () { + return (this.after !== null && this.before !== null); + }, + + hasViewport: function () { + return (this.state !== null && this.view_after !== null && this.view_before !== null); + }, + + init: function (state, after, before, view_after, view_before) { + this.state = (typeof state !== 'undefined') ? state : null; + this.after = (typeof after !== 'undefined' && after !== null && after > 0) ? after : null; + this.before = (typeof before !== 'undefined' && before !== null && before > 0) ? before : null; + this.view_after = (typeof view_after !== 'undefined' && view_after !== null && view_after > 0) ? view_after : null; + this.view_before = (typeof view_before !== 'undefined' && view_before !== null && view_before > 0) ? view_before : null; + }, + + setup: function () { + if (this.isActive()) { + if (this.state === null) { + this.state = NETDATA.options.targets[0]; + } + + if (typeof this.callback === 'function') { + this.callback(true, this.after, this.before); + } + } else { + if (typeof this.callback === 'function') { + this.callback(false, 0, 0); } + } + }, - __legendFormatValueChartDecimalsLastMin = min; - __legendFormatValueChartDecimalsLastMax = max; + set: function (state, after, before, view_after, view_before) { + if (after > before) { + let t = after; + after = before; + before = t; + } - var old = __legendFormatValueChartDecimals; + this.init(state, after, before, view_after, view_before); - if(this.data !== null && this.data.min === this.data.max) - // it is a fixed number, let the visualizer decide based on the value - __legendFormatValueChartDecimals = -1; + // if (this.hasViewport() === true) + // NETDATA.globalPanAndZoom.setMaster(this.state, this.view_after, this.view_before); + if (this.hasViewport()) { + NETDATA.globalPanAndZoom.setMaster(this.state, this.view_after, this.view_before); + } - else if(this.value_decimal_detail !== -1) - // there is an override - __legendFormatValueChartDecimals = this.value_decimal_detail; + this.setup(); + }, - else { - // ok, let's calculate the proper number of decimal points - var delta; - - if (min === max) - delta = Math.abs(min); - else - delta = Math.abs(max - min); - - if (delta > 1000) __legendFormatValueChartDecimals = 0; - else if (delta > 10) __legendFormatValueChartDecimals = 1; - else if (delta > 1) __legendFormatValueChartDecimals = 2; - else if (delta > 0.1) __legendFormatValueChartDecimals = 2; - else if (delta > 0.01) __legendFormatValueChartDecimals = 4; - else if (delta > 0.001) __legendFormatValueChartDecimals = 5; - else if (delta > 0.0001) __legendFormatValueChartDecimals = 6; - else __legendFormatValueChartDecimals = 7; - } - - if(__legendFormatValueChartDecimals !== old) { - if(__legendFormatValueChartDecimals < 0) - __intlNumberFormat = null; - else - __intlNumberFormat = NETDATA.fastNumberFormat.get( - __legendFormatValueChartDecimals, - __legendFormatValueChartDecimals - ); - } - }; + clear: function () { + this.after = null; + this.before = null; + this.state = null; + this.view_after = null; + this.view_before = null; - this.legendFormatValue = function(value) { - if(typeof value !== 'number') - return '-'; + if (typeof this.callback === 'function') { + this.callback(false, 0, 0); + } + }, - value = __unitsConversion(value); + focus: function () { + if (this.isActive() && this.hasViewport()) { + if (this.state === null) { + this.state = NETDATA.options.targets[0]; + } - if(typeof value !== 'number') - return value; + if (NETDATA.globalPanAndZoom.isMaster(this.state)) { + NETDATA.globalPanAndZoom.clearMaster(); + } - if(__intlNumberFormat !== null) - return __intlNumberFormat.format(value); + NETDATA.globalPanAndZoom.setMaster(this.state, this.view_after, this.view_before, true); + } + } +}; + +// ---------------------------------------------------------------------------------------------------------------- +// dimensions selection + +// TODO +// move color assignment to dimensions, here + +let dimensionStatus = function (parent, label, name_div, value_div, color) { + this.enabled = false; + this.parent = parent; + this.label = label; + this.name_div = null; + this.value_div = null; + this.color = NETDATA.themes.current.foreground; + this.selected = (parent.unselected_count === 0); + + this.setOptions(name_div, value_div, color); +}; + +dimensionStatus.prototype.invalidate = function () { + this.name_div = null; + this.value_div = null; + this.enabled = false; +}; + +dimensionStatus.prototype.setOptions = function (name_div, value_div, color) { + this.color = color; + + if (this.name_div !== name_div) { + this.name_div = name_div; + this.name_div.title = this.label; + this.name_div.style.setProperty('color', this.color, 'important'); + if (!this.selected) { + this.name_div.className = 'netdata-legend-name not-selected'; + } else { + this.name_div.className = 'netdata-legend-name selected'; + } + } - var dmin, dmax; - if(this.value_decimal_detail !== -1) { - dmin = dmax = this.value_decimal_detail; - } - else { - dmin = 0; - var abs = (value < 0) ? -value : value; - if (abs > 1000) dmax = 0; - else if (abs > 10) dmax = 1; - else if (abs > 1) dmax = 2; - else if (abs > 0.1) dmax = 2; - else if (abs > 0.01) dmax = 4; - else if (abs > 0.001) dmax = 5; - else if (abs > 0.0001) dmax = 6; - else dmax = 7; - } - - return NETDATA.fastNumberFormat.get(dmin, dmax).format(value); - }; + if (this.value_div !== value_div) { + this.value_div = value_div; + this.value_div.title = this.label; + this.value_div.style.setProperty('color', this.color, 'important'); + if (!this.selected) { + this.value_div.className = 'netdata-legend-value not-selected'; + } else { + this.value_div.className = 'netdata-legend-value selected'; + } + } - this.legendSetLabelValue = function(label, value) { - var series = this.element_legend_childs.series[label]; - if(typeof series === 'undefined') return; - if(series.value === null && series.user === null) return; + this.enabled = true; + this.setHandler(); +}; - /* - // this slows down firefox and edge significantly - // since it requires to use innerHTML(), instead of innerText() +dimensionStatus.prototype.setHandler = function () { + if (!this.enabled) { + return; + } - // if the value has not changed, skip DOM update - //if(series.last === value) return; + let ds = this; - var s, r; - if(typeof value === 'number') { - var v = Math.abs(value); - s = r = this.legendFormatValue(value); + // this.name_div.onmousedown = this.value_div.onmousedown = function(e) { + this.name_div.onclick = this.value_div.onclick = function (e) { + e.preventDefault(); + if (ds.isSelected()) { + // this is selected + if (e.shiftKey || e.ctrlKey) { + // control or shift key is pressed -> unselect this (except is none will remain selected, in which case select all) + ds.unselect(); - if(typeof series.last === 'number') { - if(v > series.last) s += '<i class="fas fa-angle-up" style="width: 8px; text-align: center; overflow: hidden; vertical-align: middle;"></i>'; - else if(v < series.last) s += '<i class="fas fa-angle-down" style="width: 8px; text-align: center; overflow: hidden; vertical-align: middle;"></i>'; - else s += '<i class="fas fa-angle-left" style="width: 8px; text-align: center; overflow: hidden; vertical-align: middle;"></i>'; + if (ds.parent.countSelected() === 0) { + ds.parent.selectAll(); + } + } else { + // no key is pressed -> select only this (except if it is the only selected already, in which case select all) + if (ds.parent.countSelected() === 1) { + ds.parent.selectAll(); + } else { + ds.parent.selectNone(); + ds.select(); } - else s += '<i class="fas fa-angle-right" style="width: 8px; text-align: center; overflow: hidden; vertical-align: middle;"></i>'; - - series.last = v; } - else { - if(value === null) - s = r = ''; - else - s = r = value; - - series.last = value; + } + else { + // this is not selected + if (e.shiftKey || e.ctrlKey) { + // control or shift key is pressed -> select this too + ds.select(); + } else { + // no key is pressed -> select only this + ds.parent.selectNone(); + ds.select(); } - */ - - var s = this.legendFormatValue(value); - - // caching: do not update the update to show the same value again - if(s === series.last_shown_value) return; - series.last_shown_value = s; + } - if(series.value !== null) series.value.innerText = s; - if(series.user !== null) series.user.innerText = s; - }; + ds.parent.state.redrawChart(); + } +}; - this.legendSetDateString = function(date) { - if(this.element_legend_childs.title_date !== null && date !== this.tmp.__last_shown_legend_date) { - this.element_legend_childs.title_date.innerText = date; - this.tmp.__last_shown_legend_date = date; - } - }; +dimensionStatus.prototype.select = function () { + if (!this.enabled) { + return; + } - this.legendSetTimeString = function(time) { - if(this.element_legend_childs.title_time !== null && time !== this.tmp.__last_shown_legend_time) { - this.element_legend_childs.title_time.innerText = time; - this.tmp.__last_shown_legend_time = time; - } - }; + this.name_div.className = 'netdata-legend-name selected'; + this.value_div.className = 'netdata-legend-value selected'; + this.selected = true; +}; - this.legendSetUnitsString = function(units) { - if(this.element_legend_childs.title_units !== null && units !== this.tmp.__last_shown_legend_units) { - this.element_legend_childs.title_units.innerText = units; - this.tmp.__last_shown_legend_units = units; - } - }; +dimensionStatus.prototype.unselect = function () { + if (!this.enabled) { + return; + } - this.legendSetDateLast = { - ms: 0, - date: undefined, - time: undefined - }; + this.name_div.className = 'netdata-legend-name not-selected'; + this.value_div.className = 'netdata-legend-value hidden'; + this.selected = false; +}; + +dimensionStatus.prototype.isSelected = function () { + // return(this.enabled === true && this.selected === true); + return this.enabled && this.selected; +}; + +// ---------------------------------------------------------------------------------------------------------------- + +let dimensionsVisibility = function (state) { + this.state = state; + this.len = 0; + this.dimensions = {}; + this.selected_count = 0; + this.unselected_count = 0; +}; + +dimensionsVisibility.prototype.dimensionAdd = function (label, name_div, value_div, color) { + if (typeof this.dimensions[label] === 'undefined') { + this.len++; + this.dimensions[label] = new dimensionStatus(this, label, name_div, value_div, color); + } else { + this.dimensions[label].setOptions(name_div, value_div, color); + } - this.legendSetDate = function(ms) { - if(typeof ms !== 'number') { - this.legendShowUndefined(); - return; - } + return this.dimensions[label]; +}; - if(this.legendSetDateLast.ms !== ms) { - var d = new Date(ms); - this.legendSetDateLast.ms = ms; - this.legendSetDateLast.date = NETDATA.dateTime.localeDateString(d); - this.legendSetDateLast.time = NETDATA.dateTime.localeTimeString(d); - } +dimensionsVisibility.prototype.dimensionGet = function (label) { + return this.dimensions[label]; +}; - this.legendSetDateString(this.legendSetDateLast.date); - this.legendSetTimeString(this.legendSetDateLast.time); - this.legendSetUnitsString(this.units_current) - }; +dimensionsVisibility.prototype.invalidateAll = function () { + let keys = Object.keys(this.dimensions); + let len = keys.length; + while (len--) { + this.dimensions[keys[len]].invalidate(); + } +}; - this.legendShowUndefined = function() { - this.legendSetDateString(this.legendPluginModuleString(false)); - this.legendSetTimeString(this.chart.context.toString()); - // this.legendSetUnitsString(' '); +dimensionsVisibility.prototype.selectAll = function () { + let keys = Object.keys(this.dimensions); + let len = keys.length; + while (len--) { + this.dimensions[keys[len]].select(); + } +}; - if(this.data && this.element_legend_childs.series !== null) { - var labels = this.data.dimension_names; - var i = labels.length; - while(i--) { - var label = labels[i]; +dimensionsVisibility.prototype.countSelected = function () { + let selected = 0; + let keys = Object.keys(this.dimensions); + let len = keys.length; + while (len--) { + if (this.dimensions[keys[len]].isSelected()) { + selected++; + } + } - if(typeof label === 'undefined' || typeof this.element_legend_childs.series[label] === 'undefined') continue; - this.legendSetLabelValue(label, null); - } - } - }; + return selected; +}; - this.legendShowLatestValues = function() { - if(this.chart === null) return; - if(this.selected) return; +dimensionsVisibility.prototype.selectNone = function () { + let keys = Object.keys(this.dimensions); + let len = keys.length; + while (len--) { + this.dimensions[keys[len]].unselect(); + } +}; + +dimensionsVisibility.prototype.selected2BooleanArray = function (array) { + let ret = []; + this.selected_count = 0; + this.unselected_count = 0; + + let len = array.length; + while (len--) { + let ds = this.dimensions[array[len]]; + if (typeof ds === 'undefined') { + // console.log(array[i] + ' is not found'); + ret.unshift(false); + } else if (ds.isSelected()) { + ret.unshift(true); + this.selected_count++; + } else { + ret.unshift(false); + this.unselected_count++; + } + } - if(this.data === null || this.element_legend_childs.series === null) { - this.legendShowUndefined(); - return; - } + if (this.selected_count === 0 && this.unselected_count !== 0) { + this.selectAll(); + return this.selected2BooleanArray(array); + } - var show_undefined = true; - if(Math.abs(this.netdata_last - this.view_before) <= this.data_update_every) - show_undefined = false; + return ret; +}; - if(show_undefined) { - this.legendShowUndefined(); - return; - } +// ---------------------------------------------------------------------------------------------------------------- +// date/time conversion - this.legendSetDate(this.view_before); +NETDATA.dateTime = { + using_timezone: false, - var labels = this.data.dimension_names; - var i = labels.length; - while(i--) { - var label = labels[i]; + // these are the old netdata functions + // we fallback to these, if the new ones fail - if(typeof label === 'undefined') continue; - if(typeof this.element_legend_childs.series[label] === 'undefined') continue; + localeDateStringNative: function (d) { + return d.toLocaleDateString(); + }, - this.legendSetLabelValue(label, this.data.view_latest_values[i]); - } - }; + localeTimeStringNative: function (d) { + return d.toLocaleTimeString(); + }, - this.legendReset = function() { - this.legendShowLatestValues(); - }; + xAxisTimeStringNative: function (d) { + return NETDATA.zeropad(d.getHours()) + ":" + + NETDATA.zeropad(d.getMinutes()) + ":" + + NETDATA.zeropad(d.getSeconds()); + }, - // this should be called just ONCE per dimension per chart - this.__chartDimensionColor = function(label) { - var c = NETDATA.commonColors.get(this, label); + // initialize the new date/time conversion + // functions. + // if this fails, we fallback to the above + init: function (timezone) { + //console.log('init with timezone: ' + timezone); - // it is important to maintain a list of colors - // for this chart only, since the chart library - // uses this to assign colors to dimensions in the same - // order the dimension are given to it - this.colors.push(c); + // detect browser timezone + try { + NETDATA.options.browser_timezone = Intl.DateTimeFormat().resolvedOptions().timeZone; + } catch (e) { + console.log('failed to detect browser timezone: ' + e.toString()); + NETDATA.options.browser_timezone = 'cannot-detect-it'; + } - return c; - }; + let ret = false; - this.chartPrepareColorPalette = function() { - NETDATA.commonColors.refill(this); - }; + try { + let dateOptions = { + localeMatcher: 'best fit', + formatMatcher: 'best fit', + weekday: 'short', + year: 'numeric', + month: 'short', + day: '2-digit' + }; - // get the ordered list of chart colors - // this includes user defined colors - this.chartCustomColors = function() { - this.chartPrepareColorPalette(); + let timeOptions = { + localeMatcher: 'best fit', + hour12: false, + formatMatcher: 'best fit', + hour: '2-digit', + minute: '2-digit', + second: '2-digit' + }; - var colors; - if(this.colors_custom.length) - colors = this.colors_custom; - else - colors = this.colors; + let xAxisOptions = { + localeMatcher: 'best fit', + hour12: false, + formatMatcher: 'best fit', + hour: '2-digit', + minute: '2-digit', + second: '2-digit' + }; - if(this.debug === true) { - this.log("chartCustomColors() returns:"); - this.log(colors); + if (typeof timezone === 'string' && timezone !== '' && timezone !== 'default') { + dateOptions.timeZone = timezone; + timeOptions.timeZone = timezone; + timeOptions.timeZoneName = 'short'; + xAxisOptions.timeZone = timezone; + this.using_timezone = true; + } else { + timezone = 'default'; + this.using_timezone = false; } - return colors; - }; + this.dateFormat = new Intl.DateTimeFormat(navigator.language, dateOptions); + this.timeFormat = new Intl.DateTimeFormat(navigator.language, timeOptions); + this.xAxisFormat = new Intl.DateTimeFormat(navigator.language, xAxisOptions); - // get the ordered list of chart ASSIGNED colors - // (this returns only the colors that have been - // assigned to dimensions, prepended with any - // custom colors defined) - this.chartColors = function() { - this.chartPrepareColorPalette(); + this.localeDateString = function (d) { + return this.dateFormat.format(d); + }; - if(this.debug === true) { - this.log("chartColors() returns:"); - this.log(this.colors); - } + this.localeTimeString = function (d) { + return this.timeFormat.format(d); + }; - return this.colors; - }; + this.xAxisTimeString = function (d) { + return this.xAxisFormat.format(d); + }; - this.legendPluginModuleString = function(withContext) { - var str = ' '; - var context = ''; + //let d = new Date(); + //let t = this.dateFormat.format(d) + ' ' + this.timeFormat.format(d) + ' ' + this.xAxisFormat.format(d); - if(typeof this.chart !== 'undefined') { - if(withContext && typeof this.chart.context === 'string') - context = this.chart.context; + ret = true; + } catch (e) { + console.log('Cannot setup Date/Time formatting: ' + e.toString()); - if (typeof this.chart.plugin === 'string' && this.chart.plugin !== '') { - str = this.chart.plugin; + timezone = 'default'; + this.localeDateString = this.localeDateStringNative; + this.localeTimeString = this.localeTimeStringNative; + this.xAxisTimeString = this.xAxisTimeStringNative; + this.using_timezone = false; - if(str.endsWith(".plugin")) - str = str.substring(0, str.length - 7); + ret = false; + } - if (typeof this.chart.module === 'string' && this.chart.module !== '') - str += ':' + this.chart.module; + // save it + //console.log('init setOption timezone: ' + timezone); + NETDATA.setOption('timezone', timezone); - if (withContext && context !== '') - str += ', ' + context; - } - else if (withContext && context !== '') - str = context; - } + return ret; + } +}; +NETDATA.dateTime.init(NETDATA.options.current.timezone); + +// ---------------------------------------------------------------------------------------------------------------- +// global selection sync + +NETDATA.globalSelectionSync = { + state: null, + dontSyncBefore: 0, + last_t: 0, + slaves: [], + timeoutId: undefined, + + globalReset: function () { + this.stop(); + this.state = null; + this.dontSyncBefore = 0; + this.last_t = 0; + this.slaves = []; + this.timeoutId = undefined; + }, + + active: function () { + return (this.state !== null); + }, + + // return true if global selection sync can be enabled now + enabled: function () { + // console.log('enabled()'); + // can we globally apply selection sync? + if (!NETDATA.options.current.sync_selection) { + return false; + } - return str; - }; + return (this.dontSyncBefore <= Date.now()); + }, - this.legendResolutionTooltip = function () { - if(!this.chart) return ''; + // set the global selection sync master + setMaster: function (state) { + if (!this.enabled()) { + this.stop(); + return; + } - var collected = this.chart.update_every; - var viewed = (this.data)?this.data.view_update_every:collected; + if (this.state === state) { + return; + } - if(collected === viewed) - return "resolution " + NETDATA.seconds4human(collected); + if (this.state !== null) { + this.stop(); + } - return "resolution " + NETDATA.seconds4human(viewed) + ", collected every " + NETDATA.seconds4human(collected); - }; + if (NETDATA.options.debug.globalSelectionSync) { + console.log('globalSelectionSync.setMaster(' + state.id + ')'); + } - this.legendUpdateDOM = function() { - var needed = false, dim, keys, len, i; + state.selected = true; + this.state = state; + this.last_t = 0; - // check that the legend DOM is up to date for the downloaded dimensions - if(typeof this.element_legend_childs.series !== 'object' || this.element_legend_childs.series === null) { - // this.log('the legend does not have any series - requesting legend update'); - needed = true; - } - else if(this.data === null) { - // this.log('the chart does not have any data - requesting legend update'); - needed = true; + // find all slaves + let targets = NETDATA.intersectionObserver.targets(); + this.slaves = []; + let len = targets.length; + while (len--) { + let st = targets[len]; + if (this.state !== st && st.globalSelectionSyncIsEligible()) { + this.slaves.push(st); } - else if(typeof this.element_legend_childs.series.labels_key === 'undefined') { - needed = true; + } + + // this.delay(100); + }, + + // stop global selection sync + stop: function () { + if (this.state !== null) { + if (NETDATA.options.debug.globalSelectionSync) { + console.log('globalSelectionSync.stop()'); } - else { - var labels = this.data.dimension_names.toString(); - if(labels !== this.element_legend_childs.series.labels_key) { - needed = true; - if(this.debug === true) - this.log('NEW LABELS: "' + labels + '" NOT EQUAL OLD LABELS: "' + this.element_legend_childs.series.labels_key + '"'); - } + let len = this.slaves.length; + while (len--) { + this.slaves[len].clearSelection(); } - if(needed === false) { - // make sure colors available - this.chartPrepareColorPalette(); + this.state.clearSelection(); - // do we have to update the current values? - // we do this, only when the visible chart is current - if(Math.abs(this.netdata_last - this.view_before) <= this.data_update_every) { - if(this.debug === true) - this.log('chart is in latest position... updating values on legend...'); + this.last_t = 0; + this.slaves = []; + this.state = null; + } + }, - //var labels = this.data.dimension_names; - //var i = labels.length; - //while(i--) - // this.legendSetLabelValue(labels[i], this.data.view_latest_values[i]); - } - return; + // delay global selection sync for some time + delay: function (ms) { + if (NETDATA.options.current.sync_selection) { + // if (NETDATA.options.debug.globalSelectionSync === true) { + if (NETDATA.options.debug.globalSelectionSync) { + console.log('globalSelectionSync.delay()'); } - if(this.colors === null) { - // this is the first time we update the chart - // let's assign colors to all dimensions - if(this.library.track_colors() === true) { - this.colors = []; - keys = Object.keys(this.chart.dimensions); - len = keys.length; - for(i = 0; i < len ;i++) - NETDATA.commonColors.get(this, this.chart.dimensions[keys[i]].name); - } + if (typeof ms === 'number') { + this.dontSyncBefore = Date.now() + ms; + } else { + this.dontSyncBefore = Date.now() + NETDATA.options.current.sync_selection_delay; } + } + }, - // we will re-generate the colors for the chart - // based on the dimensions this result has data for - this.colors = []; + __syncSlaves: function () { + // if (NETDATA.globalSelectionSync.enabled() === true) { + if (NETDATA.globalSelectionSync.enabled()) { + // if (NETDATA.options.debug.globalSelectionSync === true) + if (NETDATA.options.debug.globalSelectionSync) { + console.log('globalSelectionSync.__syncSlaves()'); + } - if(this.debug === true) - this.log('updating Legend DOM'); + let t = NETDATA.globalSelectionSync.last_t; + let len = NETDATA.globalSelectionSync.slaves.length; + while (len--) { + NETDATA.globalSelectionSync.slaves[len].setSelection(t); + } - // mark all dimensions as invalid - this.dimensions_visibility.invalidateAll(); + this.timeoutId = undefined; + } + }, - var genLabel = function(state, parent, dim, name, count) { - var color = state.__chartDimensionColor(name); + // sync all the visible charts to the given time + // this is to be called from the chart libraries + sync: function (state, t) { + // if (NETDATA.options.current.sync_selection === true) { + if (NETDATA.options.current.sync_selection) { + // if (NETDATA.options.debug.globalSelectionSync === true) + if (NETDATA.options.debug.globalSelectionSync) { + console.log('globalSelectionSync.sync(' + state.id + ', ' + t.toString() + ')'); + } - var user_element = null; - var user_id = NETDATA.dataAttribute(state.element, 'show-value-of-' + name.toLowerCase() + '-at', null); - if(user_id === null) - user_id = NETDATA.dataAttribute(state.element, 'show-value-of-' + dim.toLowerCase() + '-at', null); - if(user_id !== null) { - user_element = document.getElementById(user_id) || null; - if (user_element === null) - state.log('Cannot find element with id: ' + user_id); - } + this.setMaster(state); - state.element_legend_childs.series[name] = { - name: document.createElement('span'), - value: document.createElement('span'), - user: user_element, - last: null, - last_shown_value: null - }; + if (t === this.last_t) { + return; + } - var label = state.element_legend_childs.series[name]; + this.last_t = t; - // create the dimension visibility tracking for this label - state.dimensions_visibility.dimensionAdd(name, label.name, label.value, color); + if (state.foreignElementSelection !== null) { + state.foreignElementSelection.innerText = NETDATA.dateTime.localeDateString(t) + ' ' + NETDATA.dateTime.localeTimeString(t); + } - var rgb = NETDATA.colorHex2Rgb(color); - label.name.innerHTML = '<table class="netdata-legend-name-table-' - + state.chart.chart_type - + '" style="background-color: ' - + 'rgba(' + rgb.r + ',' + rgb.g + ',' + rgb.b + ',' + NETDATA.options.current['color_fill_opacity_' + state.chart.chart_type] + ') !important' - + '"><tr class="netdata-legend-name-tr"><td class="netdata-legend-name-td"></td></tr></table>'; + if (this.timeoutId) { + NETDATA.timeout.clear(this.timeoutId); + } - var text = document.createTextNode(' ' + name); - label.name.appendChild(text); + this.timeoutId = NETDATA.timeout.set(this.__syncSlaves, 0); + } + } +}; - if(count > 0) - parent.appendChild(document.createElement('br')); +NETDATA.intersectionObserver = { + observer: null, + visible_targets: [], - parent.appendChild(label.name); - parent.appendChild(label.value); - }; + options: { + root: null, + rootMargin: "0px", + threshold: null + }, - var content = document.createElement('div'); - - if(this.element_chart === null) { - this.element_chart = document.createElement('div'); - this.element_chart.id = this.library_name + '-' + this.uuid + '-chart'; - this.element.appendChild(this.element_chart); - - if(this.hasLegend() === true) - this.element_chart.className = 'netdata-chart-with-legend-right netdata-' + this.library_name + '-chart-with-legend-right'; - else - this.element_chart.className = ' netdata-chart netdata-' + this.library_name + '-chart'; - } - - if(this.hasLegend() === true) { - if(this.element_legend === null) { - this.element_legend = document.createElement('div'); - this.element_legend.className = 'netdata-chart-legend netdata-' + this.library_name + '-legend'; - this.element.appendChild(this.element_legend); - } - else - this.element_legend.innerHTML = ''; - - this.element_legend_childs = { - content: content, - resize_handler: null, - toolbox: null, - toolbox_left: null, - toolbox_right: null, - toolbox_reset: null, - toolbox_zoomin: null, - toolbox_zoomout: null, - toolbox_volume: null, - title_date: document.createElement('span'), - title_time: document.createElement('span'), - title_units: document.createElement('span'), - perfect_scroller: document.createElement('div'), - series: {} - }; + enabled: function () { + return this.observer !== null; + }, - if(NETDATA.options.current.legend_toolbox === true && this.library.toolboxPanAndZoom !== null) { - this.element_legend_childs.toolbox = document.createElement('div'); - this.element_legend_childs.toolbox_left = document.createElement('div'); - this.element_legend_childs.toolbox_right = document.createElement('div'); - this.element_legend_childs.toolbox_reset = document.createElement('div'); - this.element_legend_childs.toolbox_zoomin = document.createElement('div'); - this.element_legend_childs.toolbox_zoomout = document.createElement('div'); - this.element_legend_childs.toolbox_volume = document.createElement('div'); - - var get_pan_and_zoom_step = function(event) { - if (event.ctrlKey) - return NETDATA.options.current.pan_and_zoom_factor * NETDATA.options.current.pan_and_zoom_factor_multiplier_control; + globalReset: function () { + if (this.observer !== null) { + this.visible_targets = []; + this.observer.disconnect(); + this.init(); + } + }, - else if (event.shiftKey) - return NETDATA.options.current.pan_and_zoom_factor * NETDATA.options.current.pan_and_zoom_factor_multiplier_shift; + targets: function () { + if (this.enabled() && this.visible_targets.length > 0) { + return this.visible_targets; + } else { + return NETDATA.options.targets; + } + }, - else if (event.altKey) - return NETDATA.options.current.pan_and_zoom_factor * NETDATA.options.current.pan_and_zoom_factor_multiplier_alt; + switchChartVisibility: function () { + let old = this.__visibilityRatioOld; - else - return NETDATA.options.current.pan_and_zoom_factor; - }; + if (old !== this.__visibilityRatio) { + if (old === 0 && this.__visibilityRatio > 0) { + this.unhideChart(); + } else if (old > 0 && this.__visibilityRatio === 0) { + this.hideChart(); + } - this.element_legend_childs.toolbox.className += ' netdata-legend-toolbox'; - this.element.appendChild(this.element_legend_childs.toolbox); + this.__visibilityRatioOld = this.__visibilityRatio; + } + }, - this.element_legend_childs.toolbox_left.className += ' netdata-legend-toolbox-button'; - this.element_legend_childs.toolbox_left.innerHTML = NETDATA.icons.left; - this.element_legend_childs.toolbox.appendChild(this.element_legend_childs.toolbox_left); - this.element_legend_childs.toolbox_left.onclick = function(e) { - e.preventDefault(); + handler: function (entries, observer) { + entries.forEach(function (entry) { + let state = NETDATA.chartState(entry.target); - var step = (that.view_before - that.view_after) * get_pan_and_zoom_step(e); - var before = that.view_before - step; - var after = that.view_after - step; - if(after >= that.netdata_first) - that.library.toolboxPanAndZoom(that, after, before); - }; - if(NETDATA.options.current.show_help === true) - $(this.element_legend_childs.toolbox_left).popover({ - container: "body", - animation: false, - html: true, - trigger: 'hover', - placement: 'bottom', - delay: { show: NETDATA.options.current.show_help_delay_show_ms, hide: NETDATA.options.current.show_help_delay_hide_ms }, - title: 'Pan Left', - content: 'Pan the chart to the left. You can also <b>drag it</b> with your mouse or your finger (on touch devices).<br/><small>Help can be disabled from the settings.</small>' - }); + let idx; + if (entry.intersectionRatio > 0) { + idx = NETDATA.intersectionObserver.visible_targets.indexOf(state); + if (idx === -1) { + if (NETDATA.scrollUp) { + NETDATA.intersectionObserver.visible_targets.push(state); + } else { + NETDATA.intersectionObserver.visible_targets.unshift(state); + } + } + else if (state.__visibilityRatio === 0) { + state.log("was not visible until now, but was already in visible_targets"); + } + } else { + idx = NETDATA.intersectionObserver.visible_targets.indexOf(state); + if (idx !== -1) { + NETDATA.intersectionObserver.visible_targets.splice(idx, 1); + } else if (state.__visibilityRatio > 0) { + state.log("was visible, but not found in visible_targets"); + } + } + state.__visibilityRatio = entry.intersectionRatio; - this.element_legend_childs.toolbox_reset.className += ' netdata-legend-toolbox-button'; - this.element_legend_childs.toolbox_reset.innerHTML = NETDATA.icons.reset; - this.element_legend_childs.toolbox.appendChild(this.element_legend_childs.toolbox_reset); - this.element_legend_childs.toolbox_reset.onclick = function(e) { - e.preventDefault(); - NETDATA.resetAllCharts(that); - }; - if(NETDATA.options.current.show_help === true) - $(this.element_legend_childs.toolbox_reset).popover({ - container: "body", - animation: false, - html: true, - trigger: 'hover', - placement: 'bottom', - delay: { show: NETDATA.options.current.show_help_delay_show_ms, hide: NETDATA.options.current.show_help_delay_hide_ms }, - title: 'Chart Reset', - content: 'Reset all the charts to their default auto-refreshing state. You can also <b>double click</b> the chart contents with your mouse or your finger (on touch devices).<br/><small>Help can be disabled from the settings.</small>' - }); + if (!NETDATA.options.current.async_on_scroll) { + if (window.requestIdleCallback) { + window.requestIdleCallback(function () { + NETDATA.intersectionObserver.switchChartVisibility.call(state); + }, {timeout: 100}); + } else { + NETDATA.intersectionObserver.switchChartVisibility.call(state); + } + } + }); + }, - this.element_legend_childs.toolbox_right.className += ' netdata-legend-toolbox-button'; - this.element_legend_childs.toolbox_right.innerHTML = NETDATA.icons.right; - this.element_legend_childs.toolbox.appendChild(this.element_legend_childs.toolbox_right); - this.element_legend_childs.toolbox_right.onclick = function(e) { - e.preventDefault(); - var step = (that.view_before - that.view_after) * get_pan_and_zoom_step(e); - var before = that.view_before + step; - var after = that.view_after + step; - if(before <= that.netdata_last) - that.library.toolboxPanAndZoom(that, after, before); - }; - if(NETDATA.options.current.show_help === true) - $(this.element_legend_childs.toolbox_right).popover({ - container: "body", - animation: false, - html: true, - trigger: 'hover', - placement: 'bottom', - delay: { show: NETDATA.options.current.show_help_delay_show_ms, hide: NETDATA.options.current.show_help_delay_hide_ms }, - title: 'Pan Right', - content: 'Pan the chart to the right. You can also <b>drag it</b> with your mouse or your finger (on touch devices).<br/><small>Help, can be disabled from the settings.</small>' - }); + observe: function (state) { + if (this.enabled()) { + state.__visibilityRatioOld = 0; + state.__visibilityRatio = 0; + this.observer.observe(state.element); + state.isVisible = function () { + if (!NETDATA.options.current.update_only_visible) { + return true; + } - this.element_legend_childs.toolbox_zoomin.className += ' netdata-legend-toolbox-button'; - this.element_legend_childs.toolbox_zoomin.innerHTML = NETDATA.icons.zoomIn; - this.element_legend_childs.toolbox.appendChild(this.element_legend_childs.toolbox_zoomin); - this.element_legend_childs.toolbox_zoomin.onclick = function(e) { - e.preventDefault(); - var dt = ((that.view_before - that.view_after) * (get_pan_and_zoom_step(e) * 0.8) / 2); - var before = that.view_before - dt; - var after = that.view_after + dt; - that.library.toolboxPanAndZoom(that, after, before); - }; - if(NETDATA.options.current.show_help === true) - $(this.element_legend_childs.toolbox_zoomin).popover({ - container: "body", - animation: false, - html: true, - trigger: 'hover', - placement: 'bottom', - delay: { show: NETDATA.options.current.show_help_delay_show_ms, hide: NETDATA.options.current.show_help_delay_hide_ms }, - title: 'Chart Zoom In', - content: 'Zoom in the chart. You can also press SHIFT and select an area of the chart, or press SHIFT or ALT and use the mouse wheel or 2-finger touchpad scroll to zoom in or out.<br/><small>Help, can be disabled from the settings.</small>' - }); + NETDATA.intersectionObserver.switchChartVisibility.call(this); - this.element_legend_childs.toolbox_zoomout.className += ' netdata-legend-toolbox-button'; - this.element_legend_childs.toolbox_zoomout.innerHTML = NETDATA.icons.zoomOut; - this.element_legend_childs.toolbox.appendChild(this.element_legend_childs.toolbox_zoomout); - this.element_legend_childs.toolbox_zoomout.onclick = function(e) { - e.preventDefault(); - var dt = (((that.view_before - that.view_after) / (1.0 - (get_pan_and_zoom_step(e) * 0.8)) - (that.view_before - that.view_after)) / 2); - var before = that.view_before + dt; - var after = that.view_after - dt; + return this.__visibilityRatio > 0; + } + } + }, - that.library.toolboxPanAndZoom(that, after, before); - }; - if(NETDATA.options.current.show_help === true) - $(this.element_legend_childs.toolbox_zoomout).popover({ - container: "body", - animation: false, - html: true, - trigger: 'hover', - placement: 'bottom', - delay: { show: NETDATA.options.current.show_help_delay_show_ms, hide: NETDATA.options.current.show_help_delay_hide_ms }, - title: 'Chart Zoom Out', - content: 'Zoom out the chart. You can also press SHIFT or ALT and use the mouse wheel, or 2-finger touchpad scroll to zoom in or out.<br/><small>Help, can be disabled from the settings.</small>' - }); + init: function () { + if (typeof netdataIntersectionObserver === 'undefined' || netdataIntersectionObserver) { + try { + this.observer = new IntersectionObserver(this.handler, this.options); + } catch (e) { + console.log("IntersectionObserver is not supported on this browser"); + this.observer = null; + } + } + //else { + // console.log("IntersectionObserver is disabled"); + //} + } +}; +NETDATA.intersectionObserver.init(); - //this.element_legend_childs.toolbox_volume.className += ' netdata-legend-toolbox-button'; - //this.element_legend_childs.toolbox_volume.innerHTML = '<i class="fas fa-sort-amount-down"></i>'; - //this.element_legend_childs.toolbox_volume.title = 'Visible Volume'; - //this.element_legend_childs.toolbox.appendChild(this.element_legend_childs.toolbox_volume); - //this.element_legend_childs.toolbox_volume.onclick = function(e) { - //e.preventDefault(); - //alert('clicked toolbox_volume on ' + that.id); - //} - } - - if(NETDATA.options.current.resize_charts === true) { - this.element_legend_childs.resize_handler = document.createElement('div'); - - this.element_legend_childs.resize_handler.className += " netdata-legend-resize-handler"; - this.element_legend_childs.resize_handler.innerHTML = NETDATA.icons.resize; - this.element.appendChild(this.element_legend_childs.resize_handler); - if (NETDATA.options.current.show_help === true) - $(this.element_legend_childs.resize_handler).popover({ - container: "body", - animation: false, - html: true, - trigger: 'hover', - placement: 'bottom', - delay: { - show: NETDATA.options.current.show_help_delay_show_ms, - hide: NETDATA.options.current.show_help_delay_hide_ms - }, - title: 'Chart Resize', - content: 'Drag this point with your mouse or your finger (on touch devices), to resize the chart vertically. You can also <b>double click it</b> or <b>double tap it</b> to reset between 2 states: the default and the one that fits all the values.<br/><small>Help, can be disabled from the settings.</small>' - }); +// ---------------------------------------------------------------------------------------------------------------- +// Our state object, where all per-chart values are stored - // mousedown event - this.element_legend_childs.resize_handler.onmousedown = - function (e) { - that.resizeHandler(e); - }; +let chartState = function (element) { + this.element = element; - // touchstart event - this.element_legend_childs.resize_handler.addEventListener('touchstart', function (e) { - that.resizeHandler(e); - }, false); - } + // IMPORTANT: + // all private functions should use 'that', instead of 'this' + // Alternatively, you can use arrow functions (related issue #4514) + let that = this; - if(this.chart) { - this.element_legend_childs.title_date.title = this.legendPluginModuleString(true); - this.element_legend_childs.title_time.title = this.legendResolutionTooltip(); - } + // ============================================================================================================ + // ERROR HANDLING - this.element_legend_childs.title_date.className += " netdata-legend-title-date"; - this.element_legend.appendChild(this.element_legend_childs.title_date); - this.tmp.__last_shown_legend_date = undefined; + /* error() - private + * show an error instead of the chart + */ + let error = (msg) => { + let ret = true; - this.element_legend.appendChild(document.createElement('br')); + if (typeof netdataErrorCallback === 'function') { + ret = netdataErrorCallback('chart', this.id, msg); + } - this.element_legend_childs.title_time.className += " netdata-legend-title-time"; - this.element_legend.appendChild(this.element_legend_childs.title_time); - this.tmp.__last_shown_legend_time = undefined; + if (ret) { + this.element.innerHTML = this.id + ': ' + msg; + this.enabled = false; + this.current = this.pan; + } + }; - this.element_legend.appendChild(document.createElement('br')); + // console logging + this.log = function (msg) { + console.log(this.id + ' (' + this.library_name + ' ' + this.uuid + '): ' + msg); + }; - this.element_legend_childs.title_units.className += " netdata-legend-title-units"; - this.element_legend_childs.title_units.innerText = this.units_current; - this.element_legend.appendChild(this.element_legend_childs.title_units); - this.tmp.__last_shown_legend_units = undefined; + this.debugLog = function (msg) { + if (this.debug) { + this.log(msg); + } + }; - this.element_legend.appendChild(document.createElement('br')); + // ============================================================================================================ + // EARLY INITIALIZATION - this.element_legend_childs.perfect_scroller.className = 'netdata-legend-series'; - this.element_legend.appendChild(this.element_legend_childs.perfect_scroller); + // These are variables that should exist even if the chart is never to be rendered. + // Be careful what you add here - there may be thousands of charts on the page. - content.className = 'netdata-legend-series-content'; - this.element_legend_childs.perfect_scroller.appendChild(content); + // GUID - a unique identifier for the chart + this.uuid = NETDATA.guid(); - this.element_legend_childs.content = content; + // string - the name of chart + this.id = NETDATA.dataAttribute(this.element, 'netdata', undefined); + if (typeof this.id === 'undefined') { + error("netdata elements need data-netdata"); + return; + } - if(NETDATA.options.current.show_help === true) - $(content).popover({ - container: "body", - animation: false, - html: true, - trigger: 'hover', - placement: 'bottom', - title: 'Chart Legend', - delay: { show: NETDATA.options.current.show_help_delay_show_ms, hide: NETDATA.options.current.show_help_delay_hide_ms }, - content: 'You can click or tap on the values or the labels to select dimensions. By pressing SHIFT or CONTROL, you can enable or disable multiple dimensions.<br/><small>Help, can be disabled from the settings.</small>' - }); - } - else { - this.element_legend_childs = { - content: content, - resize_handler: null, - toolbox: null, - toolbox_left: null, - toolbox_right: null, - toolbox_reset: null, - toolbox_zoomin: null, - toolbox_zoomout: null, - toolbox_volume: null, - title_date: null, - title_time: null, - title_units: null, - perfect_scroller: null, - series: {} - }; - } + // string - the key for localStorage settings + this.settings_id = NETDATA.dataAttribute(this.element, 'id', null); - if(this.data) { - this.element_legend_childs.series.labels_key = this.data.dimension_names.toString(); - if(this.debug === true) - this.log('labels from data: "' + this.element_legend_childs.series.labels_key + '"'); + // the user given dimensions of the element + this.width = NETDATA.dataAttribute(this.element, 'width', NETDATA.chartDefaults.width); + this.height = NETDATA.dataAttribute(this.element, 'height', NETDATA.chartDefaults.height); + this.height_original = this.height; - for(i = 0, len = this.data.dimension_names.length; i < len ;i++) { - genLabel(this, content, this.data.dimension_ids[i], this.data.dimension_names[i], i); - } - } - else { - var tmp = []; - keys = Object.keys(this.chart.dimensions); - for(i = 0, len = keys.length; i < len ;i++) { - dim = keys[i]; - tmp.push(this.chart.dimensions[dim].name); - genLabel(this, content, dim, this.chart.dimensions[dim].name, i); - } - this.element_legend_childs.series.labels_key = tmp.toString(); - if(this.debug === true) - this.log('labels from chart: "' + this.element_legend_childs.series.labels_key + '"'); - } - - // create a hidden div to be used for hidding - // the original legend of the chart library - var el = document.createElement('div'); - if(this.element_legend !== null) - this.element_legend.appendChild(el); - el.style.display = 'none'; - - this.element_legend_childs.hidden = document.createElement('div'); - el.appendChild(this.element_legend_childs.hidden); - - if(this.element_legend_childs.perfect_scroller !== null) { - Ps.initialize(this.element_legend_childs.perfect_scroller, { - wheelSpeed: 0.2, - wheelPropagation: true, - swipePropagation: true, - minScrollbarLength: null, - maxScrollbarLength: null, - useBothWheelAxes: false, - suppressScrollX: true, - suppressScrollY: false, - scrollXMarginOffset: 0, - scrollYMarginOffset: 0, - theme: 'default' - }); - Ps.update(this.element_legend_childs.perfect_scroller); - } + if (this.settings_id !== null) { + this.height = NETDATA.localStorageGet('chart_heights.' + this.settings_id, this.height, function (height) { + // this is the callback that will be called + // if and when the user resets all localStorage variables + // to their defaults - this.legendShowLatestValues(); - }; + resizeChartToHeight(height); + }); + } - this.hasLegend = function() { - if(typeof this.tmp.___hasLegendCache___ !== 'undefined') - return this.tmp.___hasLegendCache___; + // the chart library requested by the user + this.library_name = NETDATA.dataAttribute(this.element, 'chart-library', NETDATA.chartDefaults.library); - var leg = false; - if(this.library && this.library.legend(this) === 'right-side') - leg = true; + // check the requested library is available + // we don't initialize it here - it will be initialized when + // this chart will be first used + if (typeof NETDATA.chartLibraries[this.library_name] === 'undefined') { + NETDATA.error(402, this.library_name); + error('chart library "' + this.library_name + '" is not found'); + this.enabled = false; + } else if (!NETDATA.chartLibraries[this.library_name].enabled) { + NETDATA.error(403, this.library_name); + error('chart library "' + this.library_name + '" is not enabled'); + this.enabled = false; + } else { + this.library = NETDATA.chartLibraries[this.library_name]; + } - this.tmp.___hasLegendCache___ = leg; - return leg; + this.auto = { + name: 'auto', + autorefresh: true, + force_update_at: 0, // the timestamp to force the update at + force_before_ms: null, + force_after_ms: null + }; + this.pan = { + name: 'pan', + autorefresh: false, + force_update_at: 0, // the timestamp to force the update at + force_before_ms: null, + force_after_ms: null + }; + this.zoom = { + name: 'zoom', + autorefresh: false, + force_update_at: 0, // the timestamp to force the update at + force_before_ms: null, + force_after_ms: null + }; + + // this is a pointer to one of the sub-classes below + // auto, pan, zoom + this.current = this.auto; + + this.running = false; // boolean - true when the chart is being refreshed now + this.enabled = true; // boolean - is the chart enabled for refresh? + + this.force_update_every = null; // number - overwrite the visualization update frequency of the chart + + this.tmp = {}; + + this.foreignElementBefore = null; + this.foreignElementAfter = null; + this.foreignElementDuration = null; + this.foreignElementUpdateEvery = null; + this.foreignElementSelection = null; + + // ============================================================================================================ + // PRIVATE FUNCTIONS + + // reset the runtime status variables to their defaults + const runtimeInit = () => { + this.paused = false; // boolean - is the chart paused for any reason? + this.selected = false; // boolean - is the chart shown a selection? + + this.chart_created = false; // boolean - is the library.create() been called? + this.dom_created = false; // boolean - is the chart DOM been created? + this.fetching_data = false; // boolean - true while we fetch data via ajax + + this.updates_counter = 0; // numeric - the number of refreshes made so far + this.updates_since_last_unhide = 0; // numeric - the number of refreshes made since the last time the chart was unhidden + this.updates_since_last_creation = 0; // numeric - the number of refreshes made since the last time the chart was created + + this.tm = { + last_initialized: 0, // milliseconds - the timestamp it was last initialized + last_dom_created: 0, // milliseconds - the timestamp its DOM was last created + last_mode_switch: 0, // milliseconds - the timestamp it switched modes + + last_info_downloaded: 0, // milliseconds - the timestamp we downloaded the chart + last_updated: 0, // the timestamp the chart last updated with data + pan_and_zoom_seq: 0, // the sequence number of the global synchronization + // between chart. + // Used with NETDATA.globalPanAndZoom.seq + last_visible_check: 0, // the time we last checked if it is visible + last_resized: 0, // the time the chart was resized + last_hidden: 0, // the time the chart was hidden + last_unhidden: 0, // the time the chart was unhidden + last_autorefreshed: 0 // the time the chart was last refreshed }; - this.legendWidth = function() { - return (this.hasLegend())?140:0; - }; + this.data = null; // the last data as downloaded from the netdata server + this.data_url = 'invalid://'; // string - the last url used to update the chart + this.data_points = 0; // number - the number of points returned from netdata + this.data_after = 0; // milliseconds - the first timestamp of the data + this.data_before = 0; // milliseconds - the last timestamp of the data + this.data_update_every = 0; // milliseconds - the frequency to update the data - this.legendHeight = function() { - return $(this.element).height(); - }; + this.tmp = {}; // members that can be destroyed to save memory + }; - this.chartWidth = function() { - return $(this.element).width() - this.legendWidth(); - }; + // initialize all the variables that are required for the chart to be rendered + const lateInitialization = () => { + if (typeof this.host !== 'undefined') { + return; + } - this.chartHeight = function() { - return $(this.element).height(); - }; + // string - the netdata server URL, without any path + this.host = NETDATA.dataAttribute(this.element, 'host', NETDATA.serverDefault); - this.chartPixelsPerPoint = function() { - // force an options provided detail - var px = this.pixels_per_point; + // make sure the host does not end with / + // all netdata API requests use absolute paths + while (this.host.slice(-1) === '/') { + this.host = this.host.substring(0, this.host.length - 1); + } - if(this.library && px < this.library.pixels_per_point(this)) - px = this.library.pixels_per_point(this); + // string - the grouping method requested by the user + this.method = NETDATA.dataAttribute(this.element, 'method', NETDATA.chartDefaults.method); + this.gtime = NETDATA.dataAttribute(this.element, 'gtime', 0); - if(px < NETDATA.options.current.pixels_per_point) - px = NETDATA.options.current.pixels_per_point; + // the time-range requested by the user + this.after = NETDATA.dataAttribute(this.element, 'after', NETDATA.chartDefaults.after); + this.before = NETDATA.dataAttribute(this.element, 'before', NETDATA.chartDefaults.before); - return px; - }; + // the pixels per point requested by the user + this.pixels_per_point = NETDATA.dataAttribute(this.element, 'pixels-per-point', 1); + this.points = NETDATA.dataAttribute(this.element, 'points', null); - this.needsRecreation = function() { - var ret = ( - this.chart_created === true - && this.library - && this.library.autoresize() === false - && this.tm.last_resized < NETDATA.options.last_page_resize - ); + // the forced update_every + this.force_update_every = NETDATA.dataAttribute(this.element, 'update-every', null); + if (typeof this.force_update_every !== 'number' || this.force_update_every <= 1) { + if (this.force_update_every !== null) { + this.log('ignoring invalid value of property data-update-every'); + } - if(this.debug === true) - this.log('needsRecreation(): ' + ret.toString() + ', chart_created = ' + this.chart_created.toString()); + this.force_update_every = null; + } else { + this.force_update_every *= 1000; + } - return ret; - }; + // the dimensions requested by the user + this.dimensions = NETDATA.encodeURIComponent(NETDATA.dataAttribute(this.element, 'dimensions', null)); - this.chartDataUniqueID = function() { - return this.id + ',' + this.library_name + ',' + this.dimensions + ',' + this.chartURLOptions(); - }; + this.title = NETDATA.dataAttribute(this.element, 'title', null); // the title of the chart + this.units = NETDATA.dataAttribute(this.element, 'units', null); // the units of the chart dimensions + this.units_desired = NETDATA.dataAttribute(this.element, 'desired-units', NETDATA.options.current.units); // the units of the chart dimensions + this.units_current = this.units; + this.units_common = NETDATA.dataAttribute(this.element, 'common-units', null); - this.chartURLOptions = function() { - var ret = ''; + // additional options to pass to netdata + this.append_options = NETDATA.encodeURIComponent(NETDATA.dataAttribute(this.element, 'append-options', null)); - if(this.override_options !== null) - ret = this.override_options.toString(); - else - ret = this.library.options(this); + // override options to pass to netdata + this.override_options = NETDATA.encodeURIComponent(NETDATA.dataAttribute(this.element, 'override-options', null)); - if(this.append_options !== null) - ret += '%7C' + this.append_options.toString(); + this.debug = NETDATA.dataAttributeBoolean(this.element, 'debug', false); - ret += '%7C' + 'jsonwrap'; + this.value_decimal_detail = -1; + let d = NETDATA.dataAttribute(this.element, 'decimal-digits', -1); + if (typeof d === 'number') { + this.value_decimal_detail = d; + } else if (typeof d !== 'undefined') { + this.log('ignoring decimal-digits value: ' + d.toString()); + } - if(NETDATA.options.current.eliminate_zero_dimensions === true) - ret += '%7C' + 'nonzero'; + // if we need to report the rendering speed + // find the element that needs to be updated + let refresh_dt_element_name = NETDATA.dataAttribute(this.element, 'dt-element-name', null); // string - the element to print refresh_dt_ms - return ret; + if (refresh_dt_element_name !== null) { + this.refresh_dt_element = document.getElementById(refresh_dt_element_name) || null; + } + else { + this.refresh_dt_element = null; + } + + this.dimensions_visibility = new dimensionsVisibility(that); + + this.netdata_first = 0; // milliseconds - the first timestamp in netdata + this.netdata_last = 0; // milliseconds - the last timestamp in netdata + this.requested_after = null; // milliseconds - the timestamp of the request after param + this.requested_before = null; // milliseconds - the timestamp of the request before param + this.requested_padding = null; + this.view_after = 0; + this.view_before = 0; + + this.refresh_dt_ms = 0; // milliseconds - the time the last refresh took + + // how many retries we have made to load chart data from the server + this.retries_on_data_failures = 0; + + // color management + this.colors = null; + this.colors_assigned = null; + this.colors_available = null; + this.colors_custom = null; + + this.element_message = null; // the element already created by the user + this.element_chart = null; // the element with the chart + this.element_legend = null; // the element with the legend of the chart (if created by us) + this.element_legend_childs = { + content: null, + hidden: null, + title_date: null, + title_time: null, + title_units: null, + perfect_scroller: null, // the container to apply perfect scroller to + series: null }; - this.chartURL = function() { - var after, before, points_multiplier = 1; - if(NETDATA.globalPanAndZoom.isActive()) { - if(this.current.force_before_ms !== null && this.current.force_after_ms !== null) { - this.tm.pan_and_zoom_seq = 0; - - before = Math.round(this.current.force_before_ms / 1000); - after = Math.round(this.current.force_after_ms / 1000); - this.view_after = after * 1000; - this.view_before = before * 1000; - - if(NETDATA.options.current.pan_and_zoom_data_padding === true) { - this.requested_padding = Math.round((before - after) / 2); - after -= this.requested_padding; - before += this.requested_padding; - this.requested_padding *= 1000; - points_multiplier = 2; - } + this.chart_url = null; // string - the url to download chart info + this.chart = null; // object - the chart as downloaded from the server - this.current.force_before_ms = null; - this.current.force_after_ms = null; - } - else { - this.tm.pan_and_zoom_seq = NETDATA.globalPanAndZoom.seq; - - after = Math.round(NETDATA.globalPanAndZoom.force_after_ms / 1000); - before = Math.round(NETDATA.globalPanAndZoom.force_before_ms / 1000); - this.view_after = after * 1000; - this.view_before = before * 1000; - - this.requested_padding = null; - points_multiplier = 1; - } + const getForeignElementById = (opt) => { + let id = NETDATA.dataAttribute(this.element, opt, null); + if (id === null) { + //this.log('option "' + opt + '" is undefined'); + return null; } - else { - this.tm.pan_and_zoom_seq = 0; - before = this.before; - after = this.after; - this.view_after = after * 1000; - this.view_before = before * 1000; - - this.requested_padding = null; - points_multiplier = 1; + let el = document.getElementById(id); + if (typeof el === 'undefined') { + this.log('cannot find an element with name "' + id.toString() + '"'); + return null; } - this.requested_after = after * 1000; - this.requested_before = before * 1000; - - var data_points; - if(NETDATA.options.force_data_points !== 0) { - data_points = NETDATA.options.force_data_points; - this.data_points = data_points; - } - else { - this.data_points = this.points || Math.round(this.chartWidth() / this.chartPixelsPerPoint()); - data_points = this.data_points * points_multiplier; - } + return el; + }; - // build the data URL - this.data_url = this.host + this.chart.data_url; - this.data_url += "&format=" + this.library.format(); - this.data_url += "&points=" + (data_points).toString(); - this.data_url += "&group=" + this.method; - this.data_url += ">ime=" + this.gtime; - this.data_url += "&options=" + this.chartURLOptions(); + this.foreignElementBefore = getForeignElementById('show-before-at'); + this.foreignElementAfter = getForeignElementById('show-after-at'); + this.foreignElementDuration = getForeignElementById('show-duration-at'); + this.foreignElementUpdateEvery = getForeignElementById('show-update-every-at'); + this.foreignElementSelection = getForeignElementById('show-selection-at'); + }; - if(after) - this.data_url += "&after=" + after.toString(); + const destroyDOM = () => { + if (!this.enabled) { + return; + } - if(before) - this.data_url += "&before=" + before.toString(); + if (this.debug) { + this.log('destroyDOM()'); + } - if(this.dimensions) - this.data_url += "&dimensions=" + this.dimensions; + // this.element.className = 'netdata-message icon'; + // this.element.innerHTML = '<i class="fas fa-sync"></i> netdata'; + this.element.innerHTML = ''; + this.element_message = null; + this.element_legend = null; + this.element_chart = null; + this.element_legend_childs.series = null; - if(NETDATA.options.debug.chart_data_url === true || this.debug === true) - this.log('chartURL(): ' + this.data_url + ' WxH:' + this.chartWidth() + 'x' + this.chartHeight() + ' points: ' + data_points.toString() + ' library: ' + this.library_name); - }; + this.chart_created = false; + this.dom_created = false; - this.redrawChart = function() { - if(this.data !== null) - this.updateChartWithData(this.data); - }; + this.tm.last_resized = 0; + this.tm.last_dom_created = 0; + }; - this.updateChartWithData = function(data) { - if(this.debug === true) - this.log('updateChartWithData() called.'); + let createDOM = () => { + if (!this.enabled) { + return; + } + lateInitialization(); - // this may force the chart to be re-created - resizeChart(); + destroyDOM(); - this.data = data; + if (this.debug) { + this.log('createDOM()'); + } - var started = Date.now(); - var view_update_every = data.view_update_every * 1000; + this.element_message = document.createElement('div'); + this.element_message.className = 'netdata-message icon hidden'; + this.element.appendChild(this.element_message); + this.dom_created = true; + this.chart_created = false; - if(this.data_update_every !== view_update_every) { - if(this.element_legend_childs.title_time) - this.element_legend_childs.title_time.title = this.legendResolutionTooltip(); - } + this.tm.last_dom_created = this.tm.last_resized = Date.now(); - // if the result is JSON, find the latest update-every - this.data_update_every = view_update_every; - this.data_after = data.after * 1000; - this.data_before = data.before * 1000; - this.netdata_first = data.first_entry * 1000; - this.netdata_last = data.last_entry * 1000; - this.data_points = data.points; + showLoading(); + }; - data.state = this; + const initDOM = () => { + this.element.className = this.library.container_class(that); - if(NETDATA.options.current.pan_and_zoom_data_padding === true && this.requested_padding !== null) { - if(this.view_after < this.data_after) { - // console.log('adjusting view_after from ' + this.view_after + ' to ' + this.data_after); - this.view_after = this.data_after; - } + if (typeof(this.width) === 'string') { + this.element.style.width = this.width; + } else if (typeof(this.width) === 'number') { + this.element.style.width = this.width.toString() + 'px'; + } - if(this.view_before > this.data_before) { - // console.log('adjusting view_before from ' + this.view_before + ' to ' + this.data_before); - this.view_before = this.data_before; - } - } - else { - this.view_after = this.data_after; - this.view_before = this.data_before; + if (typeof(this.library.aspect_ratio) === 'undefined') { + if (typeof(this.height) === 'string') { + this.element.style.height = this.height; + } else if (typeof(this.height) === 'number') { + this.element.style.height = this.height.toString() + 'px'; } + } - if(this.debug === true) { - this.log('UPDATE No ' + this.updates_counter + ' COMPLETED'); + if (NETDATA.chartDefaults.min_width !== null) { + this.element.style.min_width = NETDATA.chartDefaults.min_width; + } + }; - if(this.current.force_after_ms) - this.log('STATUS: forced : ' + (this.current.force_after_ms / 1000).toString() + ' - ' + (this.current.force_before_ms / 1000).toString()); - else - this.log('STATUS: forced : unset'); + const invisibleSearchableText = () => { + return '<span style="position:absolute; opacity: 0; width: 0px;">' + this.id + '</span>'; + }; - this.log('STATUS: requested : ' + (this.requested_after / 1000).toString() + ' - ' + (this.requested_before / 1000).toString()); - this.log('STATUS: downloaded: ' + (this.data_after / 1000).toString() + ' - ' + (this.data_before / 1000).toString()); - this.log('STATUS: rendered : ' + (this.view_after / 1000).toString() + ' - ' + (this.view_before / 1000).toString()); - this.log('STATUS: points : ' + (this.data_points).toString()); - } + /* init() private + * initialize state variables + * destroy all (possibly) created state elements + * create the basic DOM for a chart + */ + const init = (opt) => { + if (!this.enabled) { + return; + } - if(this.data_points === 0) { - noDataToShow(); - return; - } + runtimeInit(); + this.element.innerHTML = invisibleSearchableText(); - if(this.updates_since_last_creation >= this.library.max_updates_to_recreate()) { - if(this.debug === true) - this.log('max updates of ' + this.updates_since_last_creation.toString() + ' reached. Forcing re-generation.'); + this.tm.last_initialized = Date.now(); + this.setMode('auto'); - init('force'); - return; + if (opt !== 'fast') { + if (this.isVisible(true) || opt === 'force') { + createDOM(); } + } + }; - // check and update the legend - this.legendUpdateDOM(); + const maxMessageFontSize = () => { + let screenHeight = screen.height; + let el = this.element; - if(this.chart_created === true - && typeof this.library.update === 'function') { + // normally we want a font size, as tall as the element + let h = el.clientHeight; - if(this.debug === true) - this.log('updating chart...'); + // but give it some air, 20% let's say, or 5 pixels min + let lost = Math.max(h * 0.2, 5); + h -= lost; - if(callChartLibraryUpdateSafely(data) === false) - return; - } - else { - if(this.debug === true) - this.log('creating chart...'); + // center the text, vertically + let paddingTop = (lost - 5) / 2; - if(callChartLibraryCreateSafely(data) === false) - return; - } - if(this.isVisible() === true) { - hideMessage(); - this.legendShowLatestValues(); - } - else { - this.__redraw_on_unhide = true; + // but check the width too + // it should fit 10 characters in it + let w = el.clientWidth / 10; + if (h > w) { + paddingTop += (h - w) / 2; + h = w; + } - if(this.debug === true) - this.log("drawn while not visible"); - } + // and don't make it too huge + // 5% of the screen size is good + if (h > screenHeight / 20) { + paddingTop += (h - (screenHeight / 20)) / 2; + h = screenHeight / 20; + } - if(this.selected === true) - NETDATA.globalSelectionSync.stop(); + // set it + this.element_message.style.fontSize = h.toString() + 'px'; + this.element_message.style.paddingTop = paddingTop.toString() + 'px'; + }; - // update the performance counters - var now = Date.now(); - this.tm.last_updated = now; + const showMessageIcon = (icon) => { + this.element_message.innerHTML = icon; + maxMessageFontSize(); + $(this.element_message).removeClass('hidden'); + this.tmp.___messageHidden___ = undefined; + }; - // don't update last_autorefreshed if this chart is - // forced to be updated with global PanAndZoom - if(NETDATA.globalPanAndZoom.isActive()) - this.tm.last_autorefreshed = 0; - else { - if(NETDATA.options.current.parallel_refresher === true && NETDATA.options.current.concurrent_refreshes === true && typeof this.force_update_every !== 'number') - this.tm.last_autorefreshed = now - (now % this.data_update_every); - else - this.tm.last_autorefreshed = now; - } + const hideMessage = () => { + if (typeof this.tmp.___messageHidden___ === 'undefined') { + this.tmp.___messageHidden___ = true; + $(this.element_message).addClass('hidden'); + } + }; - this.refresh_dt_ms = now - started; - NETDATA.options.auto_refresher_fast_weight += this.refresh_dt_ms; + const showRendering = () => { + let icon; + if (this.chart !== null) { + if (this.chart.chart_type === 'line') { + icon = NETDATA.icons.lineChart; + } else { + icon = NETDATA.icons.areaChart; + } + } + else { + icon = NETDATA.icons.noChart; + } - if(this.refresh_dt_element !== null) - this.refresh_dt_element.innerText = this.refresh_dt_ms.toString(); + showMessageIcon(icon + ' netdata' + invisibleSearchableText()); + }; - if(this.foreign_element_before !== null) - this.foreign_element_before.innerText = NETDATA.dateTime.localeDateString(this.view_before) + ' ' + NETDATA.dateTime.localeTimeString(this.view_before); + const showLoading = () => { + if (!this.chart_created) { + showMessageIcon(NETDATA.icons.loading + ' netdata'); + return true; + } + return false; + }; - if(this.foreign_element_after !== null) - this.foreign_element_after.innerText = NETDATA.dateTime.localeDateString(this.view_after) + ' ' + NETDATA.dateTime.localeTimeString(this.view_after); + const isHidden = () => { + return (typeof this.tmp.___chartIsHidden___ !== 'undefined'); + }; - if(this.foreign_element_duration !== null) - this.foreign_element_duration.innerText = NETDATA.seconds4human(Math.floor((this.view_before - this.view_after) / 1000) + 1); + // hide the chart, when it is not visible - called from isVisible() + this.hideChart = function () { + // hide it, if it is not already hidden + if (isHidden()) { + return; + } - if(this.foreign_element_update_every !== null) - this.foreign_element_update_every.innerText = NETDATA.seconds4human(Math.floor(this.data_update_every / 1000)); - }; + if (this.chart_created) { + if (NETDATA.options.current.show_help) { + if (this.element_legend_childs.toolbox !== null) { + if (this.debug) { + this.log('hideChart(): hidding legend popovers'); + } - this.getSnapshotData = function(key) { - if(this.debug === true) - this.log('updating from snapshot: ' + key); + $(this.element_legend_childs.toolbox_left).popover('hide'); + $(this.element_legend_childs.toolbox_reset).popover('hide'); + $(this.element_legend_childs.toolbox_right).popover('hide'); + $(this.element_legend_childs.toolbox_zoomin).popover('hide'); + $(this.element_legend_childs.toolbox_zoomout).popover('hide'); + } - if(typeof netdataSnapshotData.data[key] === 'undefined') { - this.log('snapshot does not include data for key "' + key + '"'); - return null; - } + if (this.element_legend_childs.resize_handler !== null) { + $(this.element_legend_childs.resize_handler).popover('hide'); + } - if(typeof netdataSnapshotData.data[key] !== 'string') { - this.log('snapshot data for key "' + key + '" is not string'); - return null; + if (this.element_legend_childs.content !== null) { + $(this.element_legend_childs.content).popover('hide'); + } } - var uncompressed; - try { - uncompressed = netdataSnapshotData.uncompress(netdataSnapshotData.data[key]); + if (NETDATA.options.current.destroy_on_hide) { + if (this.debug) { + this.log('hideChart(): initializing chart'); + } - if(uncompressed === null) { - this.log('uncompressed snapshot data for key ' + key + ' is null'); - return null; + // we should destroy it + init('force'); + } else { + if (this.debug) { + this.log('hideChart(): hiding chart'); } - if(typeof uncompressed === 'undefined') { - this.log('uncompressed snapshot data for key ' + key + ' is undefined'); - return null; + showRendering(); + this.element_chart.style.display = 'none'; + this.element.style.willChange = 'auto'; + if (this.element_legend !== null) { + this.element_legend.style.display = 'none'; + } + if (this.element_legend_childs.toolbox !== null) { + this.element_legend_childs.toolbox.style.display = 'none'; + } + if (this.element_legend_childs.resize_handler !== null) { + this.element_legend_childs.resize_handler.style.display = 'none'; } - } - catch(e) { - this.log('decompression of snapshot data for key ' + key + ' failed'); - console.log(e); - uncompressed = null; - } - if(typeof uncompressed !== 'string') { - this.log('uncompressed snapshot data for key ' + key + ' is not string'); - return null; - } + this.tm.last_hidden = Date.now(); - var data; - try { - data = JSON.parse(uncompressed); - } - catch(e) { - this.log('parsing snapshot data for key ' + key + ' failed'); - console.log(e); - data = null; + // de-allocate data + // This works, but I not sure there are no corner cases somewhere + // so it is commented - if the user has memory issues he can + // set Destroy on Hide for all charts + // this.data = null; } + } - return data; - }; - - this.updateChart = function(callback) { - if (this.debug === true) - this.log('updateChart()'); + this.tmp.___chartIsHidden___ = true; + }; - if (this.fetching_data === true) { - if (this.debug === true) - this.log('updateChart(): I am already updating...'); + // unhide the chart, when it is visible - called from isVisible() + this.unhideChart = function () { + if (!isHidden()) { + return; + } - if (typeof callback === 'function') - return callback(false, 'already running'); + this.tmp.___chartIsHidden___ = undefined; + this.updates_since_last_unhide = 0; - return; + if (!this.chart_created) { + if (this.debug) { + this.log('unhideChart(): initializing chart'); } - // due to late initialization of charts and libraries - // we need to check this too - if (this.enabled === false) { - if (this.debug === true) - this.log('updateChart(): I am not enabled'); - - if (typeof callback === 'function') - return callback(false, 'not enabled'); - - return; + // we need to re-initialize it, to show our background + // logo in bootstrap tabs, until the chart loads + init('force'); + } else { + if (this.debug) { + this.log('unhideChart(): unhiding chart'); } - if (canBeRendered() === false) { - if (this.debug === true) - this.log('updateChart(): cannot be rendered'); - - if (typeof callback === 'function') - return callback(false, 'cannot be rendered'); - - return; + this.element.style.willChange = 'transform'; + this.tm.last_unhidden = Date.now(); + this.element_chart.style.display = ''; + if (this.element_legend !== null) { + this.element_legend.style.display = ''; } - - if (that.dom_created !== true) { - if (this.debug === true) - this.log('updateChart(): creating DOM'); - - createDOM(); + if (this.element_legend_childs.toolbox !== null) { + this.element_legend_childs.toolbox.style.display = ''; } - - if (this.chart === null) { - if (this.debug === true) - this.log('updateChart(): getting chart'); - - return this.getChart(function () { - return that.updateChart(callback); - }); + if (this.element_legend_childs.resize_handler !== null) { + this.element_legend_childs.resize_handler.style.display = ''; } + resizeChart(); + hideMessage(); + } - if(this.library.initialized === false) { - if(this.library.enabled === true) { - if(this.debug === true) - this.log('updateChart(): initializing chart library'); + if (this.__redraw_on_unhide) { + if (this.debug) { + this.log("redrawing chart on unhide"); + } - return this.library.initialize(function () { - return that.updateChart(callback); - }); - } - else { - error('chart library "' + this.library_name + '" is not available.'); + this.__redraw_on_unhide = undefined; + this.redrawChart(); + } + }; - if(typeof callback === 'function') - return callback(false, 'library not available'); + const canBeRendered = (uncached_visibility) => { + if (this.debug) { + this.log('canBeRendered() called'); + } - return; - } - } + if (!NETDATA.options.current.update_only_visible) { + return true; + } - this.clearSelection(); - this.chartURL(); + let ret = ( + ( + NETDATA.options.page_is_visible || + NETDATA.options.current.stop_updates_when_focus_is_lost === false || + this.updates_since_last_unhide === 0 + ) + && isHidden() === false && this.isVisible(uncached_visibility) + ); - NETDATA.statistics.refreshes_total++; - NETDATA.statistics.refreshes_active++; + if (this.debug) { + this.log('canBeRendered(): ' + ret); + } - if(NETDATA.statistics.refreshes_active > NETDATA.statistics.refreshes_active_max) - NETDATA.statistics.refreshes_active_max = NETDATA.statistics.refreshes_active; + return ret; + }; - var ok = false; - this.fetching_data = true; + // https://github.com/petkaantonov/bluebird/wiki/Optimization-killers + const callChartLibraryUpdateSafely = (data) => { + let status; - if(netdataSnapshotData !== null) { - var key = this.chartDataUniqueID(); - var data = this.getSnapshotData(key); - if (data !== null) { - ok = true; - data = NETDATA.xss.checkData('/api/v1/data', data, this.library.xssRegexIgnore); - this.updateChartWithData(data); - } - else { - ok = false; - error('cannot get data from snapshot for key: "' + key + '"'); - that.tm.last_autorefreshed = Date.now(); - } + // we should not do this here + // if we prevent rendering the chart then: + // 1. globalSelectionSync will be wrong + // 2. globalPanAndZoom will be wrong + //if (canBeRendered(true) === false) + // return false; - NETDATA.statistics.refreshes_active--; - this.fetching_data = false; + if (NETDATA.options.fake_chart_rendering) { + return true; + } - if(typeof callback === 'function') - callback(ok, 'snapshot'); + this.updates_counter++; + this.updates_since_last_unhide++; + this.updates_since_last_creation++; - return; + if (NETDATA.options.debug.chart_errors) { + status = this.library.update(that, data); + } else { + try { + status = this.library.update(that, data); + } catch (err) { + status = false; } + } - if(this.debug === true) - this.log('updating from ' + this.data_url); + if (!status) { + error('chart failed to be updated as ' + this.library_name); + return false; + } - this.xhr = $.ajax( { - url: this.data_url, - cache: false, - async: true, - headers: { - 'Cache-Control': 'no-cache, no-store', - 'Pragma': 'no-cache' - }, - xhrFields: { withCredentials: true } // required for the cookie - }) - .done(function(data) { - data = NETDATA.xss.checkData('/api/v1/data', data, that.library.xssRegexIgnore); + return true; + }; - that.xhr = undefined; - that.retries_on_data_failures = 0; - ok = true; + // https://github.com/petkaantonov/bluebird/wiki/Optimization-killers + const callChartLibraryCreateSafely = (data) => { + let status; - if(that.debug === true) - that.log('data received. updating chart.'); + // we should not do this here + // if we prevent rendering the chart then: + // 1. globalSelectionSync will be wrong + // 2. globalPanAndZoom will be wrong + //if (canBeRendered(true) === false) + // return false; - that.updateChartWithData(data); - }) - .fail(function(msg) { - that.xhr = undefined; + if (NETDATA.options.fake_chart_rendering) { + return true; + } - if(msg.statusText !== 'abort') { - that.retries_on_data_failures++; - if(that.retries_on_data_failures > NETDATA.options.current.retries_on_data_failures) { - // that.log('failed ' + that.retries_on_data_failures.toString() + ' times - giving up'); - that.retries_on_data_failures = 0; - error('data download failed for url: ' + that.data_url); - } - else { - that.tm.last_autorefreshed = Date.now(); - // that.log('failed ' + that.retries_on_data_failures.toString() + ' times, but I will retry'); - } - } - }) - .always(function() { - that.xhr = undefined; + this.updates_counter++; + this.updates_since_last_unhide++; + this.updates_since_last_creation++; - NETDATA.statistics.refreshes_active--; - that.fetching_data = false; + if (NETDATA.options.debug.chart_errors) { + status = this.library.create(that, data); + } else { + try { + status = this.library.create(that, data); + } catch (err) { + status = false; + } + } - if(typeof callback === 'function') - return callback(ok, 'download'); - }); - }; + if (!status) { + error('chart failed to be created as ' + this.library_name); + return false; + } - var __isVisible = function() { - var ret = true; + this.chart_created = true; + this.updates_since_last_creation = 0; + return true; + }; - if(NETDATA.options.current.update_only_visible !== false) { - // tolerance is the number of pixels a chart can be off-screen - // to consider it as visible and refresh it as if was visible - var tolerance = 0; + // ---------------------------------------------------------------------------------------------------------------- + // Chart Resize + + // resizeChart() - private + // to be called just before the chart library to make sure that + // a properly sized dom is available + const resizeChart = () => { + if (this.tm.last_resized < NETDATA.options.last_page_resize) { + if (!this.chart_created) { + return; + } - that.tm.last_visible_check = Date.now(); + if (this.needsRecreation()) { + if (this.debug) { + this.log('resizeChart(): initializing chart'); + } - var rect = that.element.getBoundingClientRect(); + init('force'); + } else if (typeof this.library.resize === 'function') { + if (this.debug) { + this.log('resizeChart(): resizing chart'); + } - var screenTop = window.scrollY; - var screenBottom = screenTop + window.innerHeight; + this.library.resize(that); - var chartTop = rect.top + screenTop; - var chartBottom = chartTop + rect.height; + if (this.element_legend_childs.perfect_scroller !== null) { + Ps.update(this.element_legend_childs.perfect_scroller); + } - ret = !(rect.width === 0 || rect.height === 0 || chartBottom + tolerance < screenTop || chartTop - tolerance > screenBottom); + maxMessageFontSize(); } - if(that.debug === true) - that.log('__isVisible(): ' + ret); - - return ret; - }; - - this.isVisible = function(nocache) { - // this.log('last_visible_check: ' + this.tm.last_visible_check + ', last_page_scroll: ' + NETDATA.options.last_page_scroll); + this.tm.last_resized = Date.now(); + } + }; - // caching - we do not evaluate the charts visibility - // if the page has not been scrolled since the last check - if((typeof nocache !== 'undefined' && nocache === true) - || typeof this.tmp.___isVisible___ === 'undefined' - || this.tm.last_visible_check <= NETDATA.options.last_page_scroll) { - this.tmp.___isVisible___ = __isVisible(); - if (this.tmp.___isVisible___ === true) this.unhideChart(); - else this.hideChart(); - } + // this is the actual chart resize algorithm + // it will: + // - resize the entire container + // - update the internal states + // - resize the chart as the div changes height + // - update the scrollbar of the legend + const resizeChartToHeight = (h) => { + // console.log(h); + this.element.style.height = h; - if(this.debug === true) - this.log('isVisible(' + nocache + '): ' + this.tmp.___isVisible___); + if (this.settings_id !== null) { + NETDATA.localStorageSet('chart_heights.' + this.settings_id, h); + } - return this.tmp.___isVisible___; - }; + let now = Date.now(); + NETDATA.options.last_page_scroll = now; + NETDATA.options.auto_refresher_stop_until = now + NETDATA.options.current.stop_updates_while_resizing; - this.isAutoRefreshable = function() { - return (this.current.autorefresh); - }; + // force a resize + this.tm.last_resized = 0; + resizeChart(); + }; - this.canBeAutoRefreshed = function() { - if(this.enabled === false) { - if(this.debug === true) - this.log('canBeAutoRefreshed() -> not enabled'); + this.resizeForPrint = function () { + if (typeof this.element_legend_childs !== 'undefined' && this.element_legend_childs.perfect_scroller !== null) { + let current = this.element.clientHeight; + let optimal = current + + this.element_legend_childs.perfect_scroller.scrollHeight + - this.element_legend_childs.perfect_scroller.clientHeight; - return false; + if (optimal > current) { + // this.log('resized'); + this.element.style.height = optimal + 'px'; + this.library.resize(this); } + } + }; - if(this.running === true) { - if(this.debug === true) - this.log('canBeAutoRefreshed() -> already running'); - - return false; - } + this.resizeHandler = function (e) { + e.preventDefault(); - if(this.library === null || this.library.enabled === false) { - error('charting library "' + this.library_name + '" is not available'); - if(this.debug === true) - this.log('canBeAutoRefreshed() -> chart library ' + this.library_name + ' is not available'); + if (typeof this.event_resize === 'undefined' + || this.event_resize.chart_original_w === 'undefined' + || this.event_resize.chart_original_h === 'undefined') { + this.event_resize = { + chart_original_w: this.element.clientWidth, + chart_original_h: this.element.clientHeight, + last: 0 + }; + } - return false; - } + if (e.type === 'touchstart') { + this.event_resize.mouse_start_x = e.touches.item(0).pageX; + this.event_resize.mouse_start_y = e.touches.item(0).pageY; + } else { + this.event_resize.mouse_start_x = e.clientX; + this.event_resize.mouse_start_y = e.clientY; + } - if(this.isVisible() === false) { - if(NETDATA.options.debug.visibility === true || this.debug === true) - this.log('canBeAutoRefreshed() -> not visible'); + this.event_resize.chart_start_w = this.element.clientWidth; + this.event_resize.chart_start_h = this.element.clientHeight; + this.event_resize.chart_last_w = this.element.clientWidth; + this.event_resize.chart_last_h = this.element.clientHeight; - return false; - } + let now = Date.now(); + if (now - this.event_resize.last <= NETDATA.options.current.double_click_speed && this.element_legend_childs.perfect_scroller !== null) { + // double click / double tap event - var now = Date.now(); + // console.dir(this.element_legend_childs.content); + // console.dir(this.element_legend_childs.perfect_scroller); - if(this.current.force_update_at !== 0 && this.current.force_update_at < now) { - if(this.debug === true) - this.log('canBeAutoRefreshed() -> timed force update - allowing this update'); + // the optimal height of the chart + // showing the entire legend + let optimal = this.event_resize.chart_last_h + + this.element_legend_childs.perfect_scroller.scrollHeight + - this.element_legend_childs.perfect_scroller.clientHeight; - this.current.force_update_at = 0; - return true; + // if we are not optimal, be optimal + if (this.event_resize.chart_last_h !== optimal) { + // this.log('resize to optimal, current = ' + this.event_resize.chart_last_h.toString() + 'px, original = ' + this.event_resize.chart_original_h.toString() + 'px, optimal = ' + optimal.toString() + 'px, internal = ' + this.height_original.toString()); + resizeChartToHeight(optimal.toString() + 'px'); } - if(this.isAutoRefreshable() === false) { - if(this.debug === true) - this.log('canBeAutoRefreshed() -> not auto-refreshable'); - - return false; + // else if the current height is not the original/saved height + // reset to the original/saved height + else if (this.event_resize.chart_last_h !== this.event_resize.chart_original_h) { + // this.log('resize to original, current = ' + this.event_resize.chart_last_h.toString() + 'px, original = ' + this.event_resize.chart_original_h.toString() + 'px, optimal = ' + optimal.toString() + 'px, internal = ' + this.height_original.toString()); + resizeChartToHeight(this.event_resize.chart_original_h.toString() + 'px'); } - // allow the first update, even if the page is not visible - if(NETDATA.options.page_is_visible === false && this.updates_counter && this.updates_since_last_unhide) { - if(NETDATA.options.debug.focus === true || this.debug === true) - this.log('canBeAutoRefreshed() -> not the first update, and page does not have focus'); - - return false; + // else if the current height is not the internal default height + // reset to the internal default height + else if ((this.event_resize.chart_last_h.toString() + 'px') !== this.height_original) { + // this.log('resize to internal default, current = ' + this.event_resize.chart_last_h.toString() + 'px, original = ' + this.event_resize.chart_original_h.toString() + 'px, optimal = ' + optimal.toString() + 'px, internal = ' + this.height_original.toString()); + resizeChartToHeight(this.height_original.toString()); } - if(this.needsRecreation() === true) { - if(this.debug === true) - this.log('canBeAutoRefreshed() -> needs re-creation.'); + // else if the current height is not the firstchild's clientheight + // resize to it + else if (typeof this.element_legend_childs.perfect_scroller.firstChild !== 'undefined') { + let parent_rect = this.element.getBoundingClientRect(); + let content_rect = this.element_legend_childs.perfect_scroller.firstElementChild.getBoundingClientRect(); + let wanted = content_rect.top - parent_rect.top + this.element_legend_childs.perfect_scroller.firstChild.clientHeight + 18; // 15 = toolbox + 3 space - return true; - } - - if(NETDATA.options.auto_refresher_stop_until >= now) { - if(this.debug === true) - this.log('canBeAutoRefreshed() -> stopped until is in future.'); + // console.log(parent_rect); + // console.log(content_rect); + // console.log(wanted); - return false; + // this.log('resize to firstChild, current = ' + this.event_resize.chart_last_h.toString() + 'px, original = ' + this.event_resize.chart_original_h.toString() + 'px, optimal = ' + optimal.toString() + 'px, internal = ' + this.height_original.toString() + 'px, firstChild = ' + wanted.toString() + 'px' ); + if (this.event_resize.chart_last_h !== wanted) { + resizeChartToHeight(wanted.toString() + 'px'); + } } + } else { + this.event_resize.last = now; - // options valid only for autoRefresh() - if(NETDATA.globalPanAndZoom.isActive()) { - if(NETDATA.globalPanAndZoom.shouldBeAutoRefreshed(this)) { - if(this.debug === true) - this.log('canBeAutoRefreshed(): global panning: I need an update.'); - - return true; - } - else { - if(this.debug === true) - this.log('canBeAutoRefreshed(): global panning: I am already up to date.'); + // process movement event + document.onmousemove = + document.ontouchmove = + this.element_legend_childs.resize_handler.onmousemove = + this.element_legend_childs.resize_handler.ontouchmove = + function (e) { + let y = null; + + switch (e.type) { + case 'mousemove': + y = e.clientY; + break; + case 'touchmove': + y = e.touches.item(e.touches - 1).pageY; + break; + } - return false; - } - } + if (y !== null) { + let newH = that.event_resize.chart_start_h + y - that.event_resize.mouse_start_y; - if(this.selected === true) { - if(this.debug === true) - this.log('canBeAutoRefreshed(): I have a selection in place.'); + if (newH >= 70 && newH !== that.event_resize.chart_last_h) { + resizeChartToHeight(newH.toString() + 'px'); + that.event_resize.chart_last_h = newH; + } + } + }; - return false; - } + // process end event + document.onmouseup = + document.ontouchend = + this.element_legend_childs.resize_handler.onmouseup = + this.element_legend_childs.resize_handler.ontouchend = + function (e) { + void(e); - if(this.paused === true) { - if(this.debug === true) - this.log('canBeAutoRefreshed(): I am paused.'); + // remove all the hooks + document.onmouseup = + document.onmousemove = + document.ontouchmove = + document.ontouchend = + that.element_legend_childs.resize_handler.onmousemove = + that.element_legend_childs.resize_handler.ontouchmove = + that.element_legend_childs.resize_handler.onmouseout = + that.element_legend_childs.resize_handler.onmouseup = + that.element_legend_childs.resize_handler.ontouchend = + null; - return false; - } + // allow auto-refreshes + NETDATA.options.auto_refresher_stop_until = 0; + }; + } + }; - var data_update_every = this.data_update_every; - if(typeof this.force_update_every === 'number') - data_update_every = this.force_update_every; + const noDataToShow = () => { + showMessageIcon(NETDATA.icons.noData + ' empty'); + this.legendUpdateDOM(); + this.tm.last_autorefreshed = Date.now(); + // this.data_update_every = 30 * 1000; + //this.element_chart.style.display = 'none'; + //if (this.element_legend !== null) this.element_legend.style.display = 'none'; + //this.tmp.___chartIsHidden___ = true; + }; - if(now - this.tm.last_autorefreshed >= data_update_every) { - if(this.debug === true) - this.log('canBeAutoRefreshed(): It is time to update me. Now: ' + now.toString() + ', last_autorefreshed: ' + this.tm.last_autorefreshed + ', data_update_every: ' + data_update_every + ', delta: ' + (now - this.tm.last_autorefreshed).toString()); + // ============================================================================================================ + // PUBLIC FUNCTIONS - return true; - } + this.error = function (msg) { + error(msg); + }; - return false; - }; + this.setMode = function (m) { + if (this.current !== null && this.current.name === m) { + return; + } - this.autoRefresh = function(callback) { - var state = that; + if (m === 'auto') { + this.current = this.auto; + } else if (m === 'pan') { + this.current = this.pan; + } else if (m === 'zoom') { + this.current = this.zoom; + } else { + this.current = this.auto; + } - if(state.canBeAutoRefreshed() === true && state.running === false) { + this.current.force_update_at = 0; + this.current.force_before_ms = null; + this.current.force_after_ms = null; - state.running = true; - state.updateChart(function() { - state.running = false; + this.tm.last_mode_switch = Date.now(); + }; - if(typeof callback === 'function') - return callback(); - }); - } - else { - if(typeof callback === 'function') - return callback(); - } - }; + // ---------------------------------------------------------------------------------------------------------------- + // global selection sync for slaves + + // can the chart participate to the global selection sync as a slave? + this.globalSelectionSyncIsEligible = function () { + return ( + this.enabled && + this.library !== null && + typeof this.library.setSelection === 'function' && + this.isVisible() && + this.chart_created + ); + }; - this.__defaultsFromDownloadedChart = function(chart) { - this.chart = chart; - this.chart_url = chart.url; - this.data_update_every = chart.update_every * 1000; - this.data_points = Math.round(this.chartWidth() / this.chartPixelsPerPoint()); - this.tm.last_info_downloaded = Date.now(); + this.setSelection = function (t) { + if (typeof this.library.setSelection === 'function') { + // this.selected = this.library.setSelection(this, t) === true; + this.selected = this.library.setSelection(this, t); + } else { + this.selected = true; + } - if(this.title === null) - this.title = chart.title; + if (this.selected && this.debug) { + this.log('selection set to ' + t.toString()); + } - if(this.units === null) { - this.units = chart.units; - this.units_current = this.units; - } - }; + if (this.foreignElementSelection !== null) { + this.foreignElementSelection.innerText = NETDATA.dateTime.localeDateString(t) + ' ' + NETDATA.dateTime.localeTimeString(t); + } - // fetch the chart description from the netdata server - this.getChart = function(callback) { - this.chart = NETDATA.chartRegistry.get(this.host, this.id); - if(this.chart) { - this.__defaultsFromDownloadedChart(this.chart); + return this.selected; + }; - if(typeof callback === 'function') - return callback(); + this.clearSelection = function () { + if (this.selected) { + if (typeof this.library.clearSelection === 'function') { + this.selected = (this.library.clearSelection(this) !== true); + } else { + this.selected = false; } - else if(netdataSnapshotData !== null) { - // console.log(this); - // console.log(NETDATA.chartRegistry); - NETDATA.error(404, 'host: ' + this.host + ', chart: ' + this.id); - error('chart not found in snapshot'); - if(typeof callback === 'function') - return callback(); + if (this.selected === false && this.debug) { + this.log('selection cleared'); } - else { - this.chart_url = "/api/v1/chart?chart=" + this.id; - - if(this.debug === true) - this.log('downloading ' + this.chart_url); - - $.ajax( { - url: this.host + this.chart_url, - cache: false, - async: true, - xhrFields: { withCredentials: true } // required for the cookie - }) - .done(function(chart) { - chart = NETDATA.xss.checkOptional('/api/v1/chart', chart); - chart.url = that.chart_url; - that.__defaultsFromDownloadedChart(chart); - NETDATA.chartRegistry.add(that.host, that.id, chart); - }) - .fail(function() { - NETDATA.error(404, that.chart_url); - error('chart not found on url "' + that.chart_url + '"'); - }) - .always(function() { - if(typeof callback === 'function') - return callback(); - }); + if (this.foreignElementSelection !== null) { + this.foreignElementSelection.innerText = ''; } - }; - // ============================================================================================================ - // INITIALIZATION + this.legendReset(); + } - initDOM(); - init('fast'); + return this.selected; }; - NETDATA.resetAllCharts = function(state) { - // first clear the global selection sync - // to make sure no chart is in selected state - NETDATA.globalSelectionSync.stop(); - - // there are 2 possibilities here - // a. state is the global Pan and Zoom master - // b. state is not the global Pan and Zoom master - var master = true; - if(NETDATA.globalPanAndZoom.isMaster(state) === false) - master = false; - - // clear the global Pan and Zoom - // this will also refresh the master - // and unblock any charts currently mirroring the master - NETDATA.globalPanAndZoom.clearMaster(); - - // if we were not the master, reset our status too - // this is required because most probably the mouse - // is over this chart, blocking it from auto-refreshing - if(master === false && (state.paused === true || state.selected === true)) - state.resetChart(); - }; + // ---------------------------------------------------------------------------------------------------------------- - // get or create a chart state, given a DOM element - NETDATA.chartState = function(element) { - var self = $(element); + // find if a timestamp (ms) is shown in the current chart + this.timeIsVisible = function (t) { + return (t >= this.data_after && t <= this.data_before); + }; - var state = self.data('netdata-state-object') || null; - if(state === null) { - state = new chartState(element); - self.data('netdata-state-object', state); + this.calculateRowForTime = function (t) { + if (!this.timeIsVisible(t)) { + return -1; } - return state; + return Math.floor((t - this.data_after) / this.data_update_every); }; // ---------------------------------------------------------------------------------------------------------------- - // Library functions - - // Load a script without jquery - // This is used to load jquery - after it is loaded, we use jquery - NETDATA._loadjQuery = function(callback) { - if(typeof jQuery === 'undefined') { - if(NETDATA.options.debug.main_loop === true) - console.log('loading ' + NETDATA.jQuery); - - var script = document.createElement('script'); - script.type = 'text/javascript'; - script.async = true; - script.src = NETDATA.jQuery; - - // script.onabort = onError; - script.onerror = function() { NETDATA.error(101, NETDATA.jQuery); }; - if(typeof callback === "function") { - script.onload = function () { - $ = jQuery; - return callback(); - }; + + this.pauseChart = function () { + if (!this.paused) { + if (this.debug) { + this.log('pauseChart()'); } - var s = document.getElementsByTagName('script')[0]; - s.parentNode.insertBefore(script, s); - } - else if(typeof callback === "function") { - $ = jQuery; - return callback(); + this.paused = true; } }; - NETDATA._loadCSS = function(filename) { - // don't use jQuery here - // styles are loaded before jQuery - // to eliminate showing an unstyled page to the user - - var fileref = document.createElement("link"); - fileref.setAttribute("rel", "stylesheet"); - fileref.setAttribute("type", "text/css"); - fileref.setAttribute("href", filename); - - if (typeof fileref !== 'undefined') - document.getElementsByTagName("head")[0].appendChild(fileref); - }; - - NETDATA.colorHex2Rgb = function(hex) { - // Expand shorthand form (e.g. "03F") to full form (e.g. "0033FF") - var shorthandRegex = /^#?([a-f\d])([a-f\d])([a-f\d])$/i; - hex = hex.replace(shorthandRegex, function(m, r, g, b) { - return r + r + g + g + b + b; - }); + this.unpauseChart = function () { + if (this.paused) { + if (this.debug) { + this.log('unpauseChart()'); + } - var result = /^#?([a-f\d]{2})([a-f\d]{2})([a-f\d]{2})$/i.exec(hex); - return result ? { - r: parseInt(result[1], 16), - g: parseInt(result[2], 16), - b: parseInt(result[3], 16) - } : null; + this.paused = false; + } }; - NETDATA.colorLuminance = function(hex, lum) { - // validate hex string - hex = String(hex).replace(/[^0-9a-f]/gi, ''); - if (hex.length < 6) - hex = hex[0]+hex[0]+hex[1]+hex[1]+hex[2]+hex[2]; - - lum = lum || 0; + this.resetChart = function (dontClearMaster, dontUpdate) { + if (this.debug) { + this.log('resetChart(' + dontClearMaster + ', ' + dontUpdate + ') called'); + } - // convert to decimal and change luminosity - var rgb = "#", c, i; - for (i = 0; i < 3; i++) { - c = parseInt(hex.substr(i*2,2), 16); - c = Math.round(Math.min(Math.max(0, c + (c * lum)), 255)).toString(16); - rgb += ("00"+c).substr(c.length); + if (typeof dontClearMaster === 'undefined') { + dontClearMaster = false; } - return rgb; - }; + if (typeof dontUpdate === 'undefined') { + dontUpdate = false; + } - NETDATA.guid = function() { - function s4() { - return Math.floor((1 + Math.random()) * 0x10000) - .toString(16) - .substring(1); + if (dontClearMaster !== true && NETDATA.globalPanAndZoom.isMaster(this)) { + if (this.debug) { + this.log('resetChart() diverting to clearMaster().'); } + // this will call us back with master === true + NETDATA.globalPanAndZoom.clearMaster(); + return; + } - return s4() + s4() + '-' + s4() + '-' + s4() + '-' + s4() + '-' + s4() + s4() + s4(); - }; + this.clearSelection(); - NETDATA.zeropad = function(x) { - if(x > -10 && x < 10) return '0' + x.toString(); - else return x.toString(); - }; + this.tm.pan_and_zoom_seq = 0; - // user function to signal us the DOM has been - // updated. - NETDATA.updatedDom = function() { - NETDATA.options.updated_dom = true; - }; + this.setMode('auto'); + this.current.force_update_at = 0; + this.current.force_before_ms = null; + this.current.force_after_ms = null; + this.tm.last_autorefreshed = 0; + this.paused = false; + this.selected = false; + this.enabled = true; + // this.debug = false; - NETDATA.ready = function(callback) { - NETDATA.options.pauseCallback = callback; - }; + // do not update the chart here + // or the chart will flip-flop when it is the master + // of a selection sync and another chart becomes + // the new master - NETDATA.pause = function(callback) { - if(typeof callback === 'function') { - if (NETDATA.options.pause === true) - return callback(); - else - NETDATA.options.pauseCallback = callback; + if (dontUpdate !== true && this.isVisible()) { + this.updateChart(); } }; - NETDATA.unpause = function() { - NETDATA.options.pauseCallback = null; - NETDATA.options.updated_dom = true; - NETDATA.options.pause = false; - }; + this.updateChartPanOrZoom = function (after, before, callback) { + let logme = 'updateChartPanOrZoom(' + after + ', ' + before + '): '; + let ret = true; - NETDATA.seconds4human = function (seconds, options) { - var default_options = { - now: 'now', - space: ' ', - negative_suffix: 'ago', - day: 'day', - days: 'days', - hour: 'hour', - hours: 'hours', - minute: 'min', - minutes: 'mins', - second: 'sec', - seconds: 'secs', - and: 'and' - }; + NETDATA.globalPanAndZoom.delay(); + NETDATA.globalSelectionSync.delay(); - if(typeof options !== 'object') - options = default_options; - else { - var x; - for(x in default_options) { - if(typeof options[x] !== 'string') - options[x] = default_options[x]; - } + if (this.debug) { + this.log(logme); } - if(typeof seconds === 'string') - seconds = parseInt(seconds, 10); - - if(seconds === 0) - return options.now; - - var suffix = ''; - if(seconds < 0) { - seconds = -seconds; - if(options.negative_suffix !== '') suffix = options.space + options.negative_suffix; + if (before < after) { + if (this.debug) { + this.log(logme + 'flipped parameters, rejecting it.'); + } + return false; } - var days = Math.floor(seconds / 86400); - seconds -= (days * 86400); + if (typeof this.fixed_min_duration === 'undefined') { + this.fixed_min_duration = Math.round((this.chartWidth() / 30) * this.chart.update_every * 1000); + } - var hours = Math.floor(seconds / 3600); - seconds -= (hours * 3600); + let min_duration = this.fixed_min_duration; + let current_duration = Math.round(this.view_before - this.view_after); - var minutes = Math.floor(seconds / 60); - seconds -= (minutes * 60); + // round the numbers + after = Math.round(after); + before = Math.round(before); - var strings = []; + // align them to update_every + // stretching them further away + after -= after % this.data_update_every; + before += this.data_update_every - (before % this.data_update_every); - if(days > 1) strings.push(days.toString() + options.space + options.days); - else if(days === 1) strings.push(days.toString() + options.space + options.day); + // the final wanted duration + let wanted_duration = before - after; - if(hours > 1) strings.push(hours.toString() + options.space + options.hours); - else if(hours === 1) strings.push(hours.toString() + options.space + options.hour); + // to allow panning, accept just a point below our minimum + if ((current_duration - this.data_update_every) < min_duration) { + min_duration = current_duration - this.data_update_every; + } - if(minutes > 1) strings.push(minutes.toString() + options.space + options.minutes); - else if(minutes === 1) strings.push(minutes.toString() + options.space + options.minute); + // we do it, but we adjust to minimum size and return false + // when the wanted size is below the current and the minimum + // and we zoom + if (wanted_duration < current_duration && wanted_duration < min_duration) { + if (this.debug) { + this.log(logme + 'too small: min_duration: ' + (min_duration / 1000).toString() + ', wanted: ' + (wanted_duration / 1000).toString()); + } - if(seconds > 1) strings.push(Math.floor(seconds).toString() + options.space + options.seconds); - else if(seconds === 1) strings.push(Math.floor(seconds).toString() + options.space + options.second); + min_duration = this.fixed_min_duration; - if(strings.length === 1) - return strings.pop() + suffix; + let dt = (min_duration - wanted_duration) / 2; + before += dt; + after -= dt; + wanted_duration = before - after; + ret = false; + } - var last = strings.pop(); - return strings.join(", ") + " " + options.and + " " + last + suffix; - }; + let tolerance = this.data_update_every * 2; + let movement = Math.abs(before - this.view_before); - // ---------------------------------------------------------------------------------------------------------------- - - // this is purely sequential charts refresher - // it is meant to be autonomous - NETDATA.chartRefresherNoParallel = function(index, callback) { - var targets = NETDATA.intersectionObserver.targets(); + if (Math.abs(current_duration - wanted_duration) <= tolerance && movement <= tolerance && ret) { + if (this.debug) { + this.log(logme + 'REJECTING UPDATE: current/min duration: ' + (current_duration / 1000).toString() + '/' + (this.fixed_min_duration / 1000).toString() + ', wanted duration: ' + (wanted_duration / 1000).toString() + ', duration diff: ' + (Math.round(Math.abs(current_duration - wanted_duration) / 1000)).toString() + ', movement: ' + (movement / 1000).toString() + ', tolerance: ' + (tolerance / 1000).toString() + ', returning: ' + false); + } + return false; + } - if(NETDATA.options.debug.main_loop === true) - console.log('NETDATA.chartRefresherNoParallel(' + index + ')'); + if (this.current.name === 'auto') { + this.log(logme + 'caller called me with mode: ' + this.current.name); + this.setMode('pan'); + } - if(NETDATA.options.updated_dom === true) { - // the dom has been updated - // get the dom parts again - NETDATA.parseDom(callback); - return; + if (this.debug) { + this.log(logme + 'ACCEPTING UPDATE: current/min duration: ' + (current_duration / 1000).toString() + '/' + (this.fixed_min_duration / 1000).toString() + ', wanted duration: ' + (wanted_duration / 1000).toString() + ', duration diff: ' + (Math.round(Math.abs(current_duration - wanted_duration) / 1000)).toString() + ', movement: ' + (movement / 1000).toString() + ', tolerance: ' + (tolerance / 1000).toString() + ', returning: ' + ret); } - if(index >= targets.length) { - if(NETDATA.options.debug.main_loop === true) - console.log('waiting to restart main loop...'); - NETDATA.options.auto_refresher_fast_weight = 0; + this.current.force_update_at = Date.now() + NETDATA.options.current.pan_and_zoom_delay; + this.current.force_after_ms = after; + this.current.force_before_ms = before; + NETDATA.globalPanAndZoom.setMaster(this, after, before); + + if (ret && typeof callback === 'function') { callback(); } - else { - var state = targets[index]; - if(NETDATA.options.auto_refresher_fast_weight < NETDATA.options.current.fast_render_timeframe) { - if(NETDATA.options.debug.main_loop === true) - console.log('fast rendering...'); + return ret; + }; - if(state.isVisible() === true) - NETDATA.timeout.set(function() { - state.autoRefresh(function () { - NETDATA.chartRefresherNoParallel(++index, callback); - }); - }, 0); - else - NETDATA.chartRefresherNoParallel(++index, callback); - } - else { - if(NETDATA.options.debug.main_loop === true) console.log('waiting for next refresh...'); - NETDATA.options.auto_refresher_fast_weight = 0; + this.updateChartPanOrZoomAsyncTimeOutId = undefined; + this.updateChartPanOrZoomAsync = function (after, before, callback) { + NETDATA.globalPanAndZoom.delay(); + NETDATA.globalSelectionSync.delay(); - NETDATA.timeout.set(function() { - state.autoRefresh(function() { - NETDATA.chartRefresherNoParallel(++index, callback); - }); - }, NETDATA.options.current.idle_between_charts); - } + if (!NETDATA.globalPanAndZoom.isMaster(this)) { + this.pauseChart(); + NETDATA.globalPanAndZoom.setMaster(this, after, before); + // NETDATA.globalSelectionSync.stop(); + NETDATA.globalSelectionSync.setMaster(this); } - }; - NETDATA.chartRefresherWaitTime = function() { - return NETDATA.options.current.idle_parallel_loops; - }; + if (this.updateChartPanOrZoomAsyncTimeOutId) { + NETDATA.timeout.clear(this.updateChartPanOrZoomAsyncTimeOutId); + } - // the default refresher - NETDATA.chartRefresherLastRun = 0; - NETDATA.chartRefresherRunsAfterParseDom = 0; - NETDATA.chartRefresherTimeoutId = undefined; + NETDATA.timeout.set(function () { + that.updateChartPanOrZoomAsyncTimeOutId = undefined; + that.updateChartPanOrZoom(after, before, callback); + }, 0); + }; - NETDATA.chartRefresherReschedule = function() { - if(NETDATA.options.current.async_on_scroll === true) { - if(NETDATA.chartRefresherTimeoutId) - NETDATA.timeout.clear(NETDATA.chartRefresherTimeoutId); - NETDATA.chartRefresherTimeoutId = NETDATA.timeout.set(NETDATA.chartRefresher, NETDATA.options.current.onscroll_worker_duration_threshold); - //console.log('chartRefresherReschedule()'); + let _unitsConversionLastUnits = undefined; + let _unitsConversionLastUnitsDesired = undefined; + let _unitsConversionLastMin = undefined; + let _unitsConversionLastMax = undefined; + let _unitsConversion = function (value) { + return value; + }; + this.unitsConversionSetup = function (min, max) { + if (this.units !== _unitsConversionLastUnits + || this.units_desired !== _unitsConversionLastUnitsDesired + || min !== _unitsConversionLastMin + || max !== _unitsConversionLastMax) { + + _unitsConversionLastUnits = this.units; + _unitsConversionLastUnitsDesired = this.units_desired; + _unitsConversionLastMin = min; + _unitsConversionLastMax = max; + + _unitsConversion = NETDATA.unitsConversion.get(this.uuid, min, max, this.units, this.units_desired, this.units_common, function (units) { + // console.log('switching units from ' + that.units.toString() + ' to ' + units.toString()); + that.units_current = units; + that.legendSetUnitsString(that.units_current); + }); } }; - NETDATA.chartRefresher = function() { - // console.log('chartRefresher() begin ' + (Date.now() - NETDATA.chartRefresherLastRun).toString() + ' ms since last run'); + let _legendFormatValueChartDecimalsLastMin = undefined; + let _legendFormatValueChartDecimalsLastMax = undefined; + let _legendFormatValueChartDecimals = -1; + let _intlNumberFormat = null; + this.legendFormatValueDecimalsFromMinMax = function (min, max) { + if (min === _legendFormatValueChartDecimalsLastMin && max === _legendFormatValueChartDecimalsLastMax) { + return; + } - if(NETDATA.options.page_is_visible === false - && NETDATA.options.current.stop_updates_when_focus_is_lost === true - && NETDATA.chartRefresherLastRun > NETDATA.options.last_page_resize - && NETDATA.chartRefresherLastRun > NETDATA.options.last_page_scroll - && NETDATA.chartRefresherRunsAfterParseDom > 10 - ) { - setTimeout( - NETDATA.chartRefresher, - NETDATA.options.current.idle_lost_focus - ); + this.unitsConversionSetup(min, max); + if (_unitsConversion !== null) { + min = _unitsConversion(min); + max = _unitsConversion(max); - // console.log('chartRefresher() page without focus, will run in ' + NETDATA.options.current.idle_lost_focus.toString() + ' ms, ' + NETDATA.chartRefresherRunsAfterParseDom.toString()); - return; + if (typeof min !== 'number' || typeof max !== 'number') { + return; + } } - NETDATA.chartRefresherRunsAfterParseDom++; - var now = Date.now(); - NETDATA.chartRefresherLastRun = now; + _legendFormatValueChartDecimalsLastMin = min; + _legendFormatValueChartDecimalsLastMax = max; - if( now < NETDATA.options.on_scroll_refresher_stop_until ) { - NETDATA.chartRefresherTimeoutId = NETDATA.timeout.set( - NETDATA.chartRefresher, - NETDATA.chartRefresherWaitTime() - ); + let old = _legendFormatValueChartDecimals; - // console.log('chartRefresher() end1 will run in ' + NETDATA.chartRefresherWaitTime().toString() + ' ms'); - return; + if (this.data !== null && this.data.min === this.data.max) + // it is a fixed number, let the visualizer decide based on the value + { + _legendFormatValueChartDecimals = -1; + } else if (this.value_decimal_detail !== -1) + // there is an override + { + _legendFormatValueChartDecimals = this.value_decimal_detail; + } else { + // ok, let's calculate the proper number of decimal points + let delta; + + if (min === max) { + delta = Math.abs(min); + } else { + delta = Math.abs(max - min); + } + + if (delta > 1000) { + _legendFormatValueChartDecimals = 0; + } else if (delta > 10) { + _legendFormatValueChartDecimals = 1; + } else if (delta > 1) { + _legendFormatValueChartDecimals = 2; + } else if (delta > 0.1) { + _legendFormatValueChartDecimals = 2; + } else if (delta > 0.01) { + _legendFormatValueChartDecimals = 4; + } else if (delta > 0.001) { + _legendFormatValueChartDecimals = 5; + } else if (delta > 0.0001) { + _legendFormatValueChartDecimals = 6; + } else { + _legendFormatValueChartDecimals = 7; + } + } + + if (_legendFormatValueChartDecimals !== old) { + if (_legendFormatValueChartDecimals < 0) { + _intlNumberFormat = null; + } else { + _intlNumberFormat = NETDATA.fastNumberFormat.get( + _legendFormatValueChartDecimals, + _legendFormatValueChartDecimals + ); + } } + }; - if( now < NETDATA.options.auto_refresher_stop_until ) { - NETDATA.chartRefresherTimeoutId = NETDATA.timeout.set( - NETDATA.chartRefresher, - NETDATA.chartRefresherWaitTime() - ); - - // console.log('chartRefresher() end2 will run in ' + NETDATA.chartRefresherWaitTime().toString() + ' ms'); - return; + this.legendFormatValue = function (value) { + if (typeof value !== 'number') { + return '-'; } - if(NETDATA.options.pause === true) { - // console.log('auto-refresher is paused'); - NETDATA.chartRefresherTimeoutId = NETDATA.timeout.set( - NETDATA.chartRefresher, - NETDATA.chartRefresherWaitTime() - ); + value = _unitsConversion(value); - // console.log('chartRefresher() end3 will run in ' + NETDATA.chartRefresherWaitTime().toString() + ' ms'); - return; + if (typeof value !== 'number') { + return value; } - if(typeof NETDATA.options.pauseCallback === 'function') { - // console.log('auto-refresher is calling pauseCallback'); - - NETDATA.options.pause = true; - NETDATA.options.pauseCallback(); - NETDATA.chartRefresher(); + if (_intlNumberFormat !== null) { + return _intlNumberFormat.format(value); + } - // console.log('chartRefresher() end4 (nested)'); - return; + let dmin, dmax; + if (this.value_decimal_detail !== -1) { + dmin = dmax = this.value_decimal_detail; + } else { + dmin = 0; + let abs = (value < 0) ? -value : value; + if (abs > 1000) { + dmax = 0; + } else if (abs > 10) { + dmax = 1; + } else if (abs > 1) { + dmax = 2; + } else if (abs > 0.1) { + dmax = 2; + } else if (abs > 0.01) { + dmax = 4; + } else if (abs > 0.001) { + dmax = 5; + } else if (abs > 0.0001) { + dmax = 6; + } else { + dmax = 7; + } } - if(NETDATA.options.current.parallel_refresher === false) { - // console.log('auto-refresher is calling chartRefresherNoParallel(0)'); - NETDATA.chartRefresherNoParallel(0, function() { - NETDATA.chartRefresherTimeoutId = NETDATA.timeout.set( - NETDATA.chartRefresher, - NETDATA.options.current.idle_between_loops - ); - }); - // console.log('chartRefresher() end5 (no parallel, nested)'); + return NETDATA.fastNumberFormat.get(dmin, dmax).format(value); + }; + + this.legendSetLabelValue = function (label, value) { + let series = this.element_legend_childs.series[label]; + if (typeof series === 'undefined') { return; } - - if(NETDATA.options.updated_dom === true) { - // the dom has been updated - // get the dom parts again - // console.log('auto-refresher is calling parseDom()'); - NETDATA.parseDom(NETDATA.chartRefresher); - // console.log('chartRefresher() end6 (parseDom)'); + if (series.value === null && series.user === null) { return; } - if(NETDATA.globalSelectionSync.active() === false) { - var parallel = []; - var targets = NETDATA.intersectionObserver.targets(); - var len = targets.length; - var state; - while(len--) { - state = targets[len]; - if(state.running === true || state.isVisible() === false) - continue; - - if(state.library.initialized === false) { - if(state.library.enabled === true) { - state.library.initialize(NETDATA.chartRefresher); - //console.log('chartRefresher() end6 (library init)'); - return; - } - else { - state.error('chart library "' + state.library_name + '" is not enabled.'); - } - } + /* + // this slows down firefox and edge significantly + // since it requires to use innerHTML(), instead of innerText() - if(NETDATA.scrollUp === true) - parallel.unshift(state); - else - parallel.push(state); - } + // if the value has not changed, skip DOM update + //if (series.last === value) return; - len = parallel.length; - while (len--) { - state = parallel[len]; - // console.log('auto-refresher executing in parallel for ' + parallel.length.toString() + ' charts'); - // this will execute the jobs in parallel + let s, r; + if (typeof value === 'number') { + let v = Math.abs(value); + s = r = this.legendFormatValue(value); - if (state.running === false) - NETDATA.timeout.set(state.autoRefresh, 0); + if (typeof series.last === 'number') { + if (v > series.last) s += '<i class="fas fa-angle-up" style="width: 8px; text-align: center; overflow: hidden; vertical-align: middle;"></i>'; + else if (v < series.last) s += '<i class="fas fa-angle-down" style="width: 8px; text-align: center; overflow: hidden; vertical-align: middle;"></i>'; + else s += '<i class="fas fa-angle-left" style="width: 8px; text-align: center; overflow: hidden; vertical-align: middle;"></i>'; } - //else { - // console.log('auto-refresher nothing to do'); - //} - } - - // run the next refresh iteration - NETDATA.chartRefresherTimeoutId = NETDATA.timeout.set( - NETDATA.chartRefresher, - NETDATA.chartRefresherWaitTime() - ); + else s += '<i class="fas fa-angle-right" style="width: 8px; text-align: center; overflow: hidden; vertical-align: middle;"></i>'; - //console.log('chartRefresher() completed in ' + (Date.now() - now).toString() + ' ms'); - }; + series.last = v; + } + else { + if (value === null) + s = r = ''; + else + s = r = value; - NETDATA.parseDom = function(callback) { - //console.log('parseDom()'); + series.last = value; + } + */ - NETDATA.options.last_page_scroll = Date.now(); - NETDATA.options.updated_dom = false; - NETDATA.chartRefresherRunsAfterParseDom = 0; + let s = this.legendFormatValue(value); - var targets = $('div[data-netdata]'); //.filter(':visible'); + // caching: do not update the update to show the same value again + if (s === series.last_shown_value) { + return; + } + series.last_shown_value = s; - if(NETDATA.options.debug.main_loop === true) - console.log('DOM updated - there are ' + targets.length + ' charts on page.'); + if (series.value !== null) { + series.value.innerText = s; + } + if (series.user !== null) { + series.user.innerText = s; + } + }; - NETDATA.intersectionObserver.globalReset(); - NETDATA.options.targets = []; - var len = targets.length; - while(len--) { - // the initialization will take care of sizing - // and the "loading..." message - var state = NETDATA.chartState(targets[len]); - NETDATA.options.targets.push(state); - NETDATA.intersectionObserver.observe(state); + this.legendSetDateString = function (date) { + if (this.element_legend_childs.title_date !== null && date !== this.tmp.__last_shown_legend_date) { + this.element_legend_childs.title_date.innerText = date; + this.tmp.__last_shown_legend_date = date; } + }; - if(NETDATA.globalChartUnderlay.isActive() === true) - NETDATA.globalChartUnderlay.setup(); - else - NETDATA.globalChartUnderlay.clear(); + this.legendSetTimeString = function (time) { + if (this.element_legend_childs.title_time !== null && time !== this.tmp.__last_shown_legend_time) { + this.element_legend_childs.title_time.innerText = time; + this.tmp.__last_shown_legend_time = time; + } + }; - if(typeof callback === 'function') - return callback(); + this.legendSetUnitsString = function (units) { + if (this.element_legend_childs.title_units !== null && units !== this.tmp.__last_shown_legend_units) { + this.element_legend_childs.title_units.innerText = units; + this.tmp.__last_shown_legend_units = units; + } }; - // this is the main function - where everything starts - NETDATA.started = false; - NETDATA.start = function() { - // this should be called only once + this.legendSetDateLast = { + ms: 0, + date: undefined, + time: undefined + }; - if(NETDATA.started === true) { - console.log('netdata is already started'); + this.legendSetDate = function (ms) { + if (typeof ms !== 'number') { + this.legendShowUndefined(); return; } - NETDATA.started = true; - NETDATA.options.page_is_visible = true; + if (this.legendSetDateLast.ms !== ms) { + let d = new Date(ms); + this.legendSetDateLast.ms = ms; + this.legendSetDateLast.date = NETDATA.dateTime.localeDateString(d); + this.legendSetDateLast.time = NETDATA.dateTime.localeTimeString(d); + } - $(window).blur(function() { - if(NETDATA.options.current.stop_updates_when_focus_is_lost === true) { - NETDATA.options.page_is_visible = false; - if(NETDATA.options.debug.focus === true) - console.log('Lost Focus!'); - } - }); + this.legendSetDateString(this.legendSetDateLast.date); + this.legendSetTimeString(this.legendSetDateLast.time); + this.legendSetUnitsString(this.units_current) + }; - $(window).focus(function() { - if(NETDATA.options.current.stop_updates_when_focus_is_lost === true) { - NETDATA.options.page_is_visible = true; - if(NETDATA.options.debug.focus === true) - console.log('Focus restored!'); - } - }); + this.legendShowUndefined = function () { + this.legendSetDateString(this.legendPluginModuleString(false)); + this.legendSetTimeString(this.chart.context.toString()); + // this.legendSetUnitsString(' '); + + if (this.data && this.element_legend_childs.series !== null) { + let labels = this.data.dimension_names; + let i = labels.length; + while (i--) { + let label = labels[i]; - if(typeof document.hasFocus === 'function' && !document.hasFocus()) { - if(NETDATA.options.current.stop_updates_when_focus_is_lost === true) { - NETDATA.options.page_is_visible = false; - if(NETDATA.options.debug.focus === true) - console.log('Document has no focus!'); + if (typeof label === 'undefined' || typeof this.element_legend_childs.series[label] === 'undefined') { + continue; + } + this.legendSetLabelValue(label, null); } } + }; - // bootstrap tab switching - $('a[data-toggle="tab"]').on('shown.bs.tab', NETDATA.onscroll); + this.legendShowLatestValues = function () { + if (this.chart === null) { + return; + } + if (this.selected) { + return; + } - // bootstrap modal switching - var $modal = $('.modal'); - $modal.on('hidden.bs.modal', NETDATA.onscroll); - $modal.on('shown.bs.modal', NETDATA.onscroll); + if (this.data === null || this.element_legend_childs.series === null) { + this.legendShowUndefined(); + return; + } - // bootstrap collapse switching - var $collapse = $('.collapse'); - $collapse.on('hidden.bs.collapse', NETDATA.onscroll); - $collapse.on('shown.bs.collapse', NETDATA.onscroll); + let show_undefined = true; + if (Math.abs(this.netdata_last - this.view_before) <= this.data_update_every) { + show_undefined = false; + } - NETDATA.parseDom(NETDATA.chartRefresher); + if (show_undefined) { + this.legendShowUndefined(); + return; + } - // Alarms initialization - setTimeout(NETDATA.alarms.init, 1000); + this.legendSetDate(this.view_before); - // Registry initialization - setTimeout(NETDATA.registry.init, netdataRegistryAfterMs); + let labels = this.data.dimension_names; + let i = labels.length; + while (i--) { + let label = labels[i]; - if(typeof netdataCallback === 'function') - netdataCallback(); - }; + if (typeof label === 'undefined') { + continue; + } + if (typeof this.element_legend_childs.series[label] === 'undefined') { + continue; + } - NETDATA.globalReset = function() { - NETDATA.intersectionObserver.globalReset(); - NETDATA.globalSelectionSync.globalReset(); - NETDATA.globalPanAndZoom.globalReset(); - NETDATA.chartRegistry.globalReset(); - NETDATA.commonMin.globalReset(); - NETDATA.commonMax.globalReset(); - NETDATA.commonColors.globalReset(); - NETDATA.unitsConversion.globalReset(); - NETDATA.options.targets = []; - NETDATA.parseDom(); - NETDATA.unpause(); + this.legendSetLabelValue(label, this.data.view_latest_values[i]); + } }; - // ---------------------------------------------------------------------------------------------------------------- - // peity - - NETDATA.peityInitialize = function(callback) { - if(typeof netdataNoPeitys === 'undefined' || !netdataNoPeitys) { - $.ajax({ - url: NETDATA.peity_js, - cache: true, - dataType: "script", - xhrFields: { withCredentials: true } // required for the cookie - }) - .done(function() { - NETDATA.registerChartLibrary('peity', NETDATA.peity_js); - }) - .fail(function() { - NETDATA.chartLibraries.peity.enabled = false; - NETDATA.error(100, NETDATA.peity_js); - }) - .always(function() { - if(typeof callback === "function") - return callback(); - }); - } - else { - NETDATA.chartLibraries.peity.enabled = false; - if(typeof callback === "function") - return callback(); - } + this.legendReset = function () { + this.legendShowLatestValues(); }; - NETDATA.peityChartUpdate = function(state, data) { - state.peity_instance.innerHTML = data.result; + // this should be called just ONCE per dimension per chart + this.__chartDimensionColor = function (label) { + let c = NETDATA.commonColors.get(this, label); - if(state.peity_options.stroke !== state.chartCustomColors()[0]) { - state.peity_options.stroke = state.chartCustomColors()[0]; - if(state.chart.chart_type === 'line') - state.peity_options.fill = NETDATA.themes.current.background; - else - state.peity_options.fill = NETDATA.colorLuminance(state.chartCustomColors()[0], NETDATA.chartDefaults.fill_luminance); - } + // it is important to maintain a list of colors + // for this chart only, since the chart library + // uses this to assign colors to dimensions in the same + // order the dimension are given to it + this.colors.push(c); - $(state.peity_instance).peity('line', state.peity_options); - return true; + return c; }; - NETDATA.peityChartCreate = function(state, data) { - state.peity_instance = document.createElement('div'); - state.element_chart.appendChild(state.peity_instance); - - state.peity_options = { - stroke: NETDATA.themes.current.foreground, - strokeWidth: NETDATA.dataAttribute(state.element, 'peity-strokewidth', 1), - width: state.chartWidth(), - height: state.chartHeight(), - fill: NETDATA.themes.current.foreground - }; - - NETDATA.peityChartUpdate(state, data); - return true; + this.chartPrepareColorPalette = function () { + NETDATA.commonColors.refill(this); }; - // ---------------------------------------------------------------------------------------------------------------- - // sparkline + // get the ordered list of chart colors + // this includes user defined colors + this.chartCustomColors = function () { + this.chartPrepareColorPalette(); - NETDATA.sparklineInitialize = function(callback) { - if(typeof netdataNoSparklines === 'undefined' || !netdataNoSparklines) { - $.ajax({ - url: NETDATA.sparkline_js, - cache: true, - dataType: "script", - xhrFields: { withCredentials: true } // required for the cookie - }) - .done(function() { - NETDATA.registerChartLibrary('sparkline', NETDATA.sparkline_js); - }) - .fail(function() { - NETDATA.chartLibraries.sparkline.enabled = false; - NETDATA.error(100, NETDATA.sparkline_js); - }) - .always(function() { - if(typeof callback === "function") - return callback(); - }); + let colors; + if (this.colors_custom.length) { + colors = this.colors_custom; + } else { + colors = this.colors; } - else { - NETDATA.chartLibraries.sparkline.enabled = false; - if(typeof callback === "function") - return callback(); - } - }; - NETDATA.sparklineChartUpdate = function(state, data) { - state.sparkline_options.width = state.chartWidth(); - state.sparkline_options.height = state.chartHeight(); + if (this.debug) { + this.log("chartCustomColors() returns:"); + this.log(colors); + } - $(state.element_chart).sparkline(data.result, state.sparkline_options); - return true; + return colors; }; - NETDATA.sparklineChartCreate = function(state, data) { - var type = NETDATA.dataAttribute(state.element, 'sparkline-type', 'line'); - var lineColor = NETDATA.dataAttribute(state.element, 'sparkline-linecolor', state.chartCustomColors()[0]); - var fillColor = NETDATA.dataAttribute(state.element, 'sparkline-fillcolor', ((state.chart.chart_type === 'line')?NETDATA.themes.current.background:NETDATA.colorLuminance(lineColor, NETDATA.chartDefaults.fill_luminance))); - var chartRangeMin = NETDATA.dataAttribute(state.element, 'sparkline-chartrangemin', undefined); - var chartRangeMax = NETDATA.dataAttribute(state.element, 'sparkline-chartrangemax', undefined); - var composite = NETDATA.dataAttribute(state.element, 'sparkline-composite', undefined); - var enableTagOptions = NETDATA.dataAttribute(state.element, 'sparkline-enabletagoptions', undefined); - var tagOptionPrefix = NETDATA.dataAttribute(state.element, 'sparkline-tagoptionprefix', undefined); - var tagValuesAttribute = NETDATA.dataAttribute(state.element, 'sparkline-tagvaluesattribute', undefined); - var disableHiddenCheck = NETDATA.dataAttribute(state.element, 'sparkline-disablehiddencheck', undefined); - var defaultPixelsPerValue = NETDATA.dataAttribute(state.element, 'sparkline-defaultpixelspervalue', undefined); - var spotColor = NETDATA.dataAttribute(state.element, 'sparkline-spotcolor', undefined); - var minSpotColor = NETDATA.dataAttribute(state.element, 'sparkline-minspotcolor', undefined); - var maxSpotColor = NETDATA.dataAttribute(state.element, 'sparkline-maxspotcolor', undefined); - var spotRadius = NETDATA.dataAttribute(state.element, 'sparkline-spotradius', undefined); - var valueSpots = NETDATA.dataAttribute(state.element, 'sparkline-valuespots', undefined); - var highlightSpotColor = NETDATA.dataAttribute(state.element, 'sparkline-highlightspotcolor', undefined); - var highlightLineColor = NETDATA.dataAttribute(state.element, 'sparkline-highlightlinecolor', undefined); - var lineWidth = NETDATA.dataAttribute(state.element, 'sparkline-linewidth', undefined); - var normalRangeMin = NETDATA.dataAttribute(state.element, 'sparkline-normalrangemin', undefined); - var normalRangeMax = NETDATA.dataAttribute(state.element, 'sparkline-normalrangemax', undefined); - var drawNormalOnTop = NETDATA.dataAttribute(state.element, 'sparkline-drawnormalontop', undefined); - var xvalues = NETDATA.dataAttribute(state.element, 'sparkline-xvalues', undefined); - var chartRangeClip = NETDATA.dataAttribute(state.element, 'sparkline-chartrangeclip', undefined); - var chartRangeMinX = NETDATA.dataAttribute(state.element, 'sparkline-chartrangeminx', undefined); - var chartRangeMaxX = NETDATA.dataAttribute(state.element, 'sparkline-chartrangemaxx', undefined); - var disableInteraction = NETDATA.dataAttributeBoolean(state.element, 'sparkline-disableinteraction', false); - var disableTooltips = NETDATA.dataAttributeBoolean(state.element, 'sparkline-disabletooltips', false); - var disableHighlight = NETDATA.dataAttributeBoolean(state.element, 'sparkline-disablehighlight', false); - var highlightLighten = NETDATA.dataAttribute(state.element, 'sparkline-highlightlighten', 1.4); - var highlightColor = NETDATA.dataAttribute(state.element, 'sparkline-highlightcolor', undefined); - var tooltipContainer = NETDATA.dataAttribute(state.element, 'sparkline-tooltipcontainer', undefined); - var tooltipClassname = NETDATA.dataAttribute(state.element, 'sparkline-tooltipclassname', undefined); - var tooltipFormat = NETDATA.dataAttribute(state.element, 'sparkline-tooltipformat', undefined); - var tooltipPrefix = NETDATA.dataAttribute(state.element, 'sparkline-tooltipprefix', undefined); - var tooltipSuffix = NETDATA.dataAttribute(state.element, 'sparkline-tooltipsuffix', ' ' + state.units_current); - var tooltipSkipNull = NETDATA.dataAttributeBoolean(state.element, 'sparkline-tooltipskipnull', true); - var tooltipValueLookups = NETDATA.dataAttribute(state.element, 'sparkline-tooltipvaluelookups', undefined); - var tooltipFormatFieldlist = NETDATA.dataAttribute(state.element, 'sparkline-tooltipformatfieldlist', undefined); - var tooltipFormatFieldlistKey = NETDATA.dataAttribute(state.element, 'sparkline-tooltipformatfieldlistkey', undefined); - var numberFormatter = NETDATA.dataAttribute(state.element, 'sparkline-numberformatter', function(n){ return n.toFixed(2); }); - var numberDigitGroupSep = NETDATA.dataAttribute(state.element, 'sparkline-numberdigitgroupsep', undefined); - var numberDecimalMark = NETDATA.dataAttribute(state.element, 'sparkline-numberdecimalmark', undefined); - var numberDigitGroupCount = NETDATA.dataAttribute(state.element, 'sparkline-numberdigitgroupcount', undefined); - var animatedZooms = NETDATA.dataAttributeBoolean(state.element, 'sparkline-animatedzooms', false); - - if(spotColor === 'disable') spotColor=''; - if(minSpotColor === 'disable') minSpotColor=''; - if(maxSpotColor === 'disable') maxSpotColor=''; - - // state.log('sparkline type ' + type + ', lineColor: ' + lineColor + ', fillColor: ' + fillColor); - - state.sparkline_options = { - type: type, - lineColor: lineColor, - fillColor: fillColor, - chartRangeMin: chartRangeMin, - chartRangeMax: chartRangeMax, - composite: composite, - enableTagOptions: enableTagOptions, - tagOptionPrefix: tagOptionPrefix, - tagValuesAttribute: tagValuesAttribute, - disableHiddenCheck: disableHiddenCheck, - defaultPixelsPerValue: defaultPixelsPerValue, - spotColor: spotColor, - minSpotColor: minSpotColor, - maxSpotColor: maxSpotColor, - spotRadius: spotRadius, - valueSpots: valueSpots, - highlightSpotColor: highlightSpotColor, - highlightLineColor: highlightLineColor, - lineWidth: lineWidth, - normalRangeMin: normalRangeMin, - normalRangeMax: normalRangeMax, - drawNormalOnTop: drawNormalOnTop, - xvalues: xvalues, - chartRangeClip: chartRangeClip, - chartRangeMinX: chartRangeMinX, - chartRangeMaxX: chartRangeMaxX, - disableInteraction: disableInteraction, - disableTooltips: disableTooltips, - disableHighlight: disableHighlight, - highlightLighten: highlightLighten, - highlightColor: highlightColor, - tooltipContainer: tooltipContainer, - tooltipClassname: tooltipClassname, - tooltipChartTitle: state.title, - tooltipFormat: tooltipFormat, - tooltipPrefix: tooltipPrefix, - tooltipSuffix: tooltipSuffix, - tooltipSkipNull: tooltipSkipNull, - tooltipValueLookups: tooltipValueLookups, - tooltipFormatFieldlist: tooltipFormatFieldlist, - tooltipFormatFieldlistKey: tooltipFormatFieldlistKey, - numberFormatter: numberFormatter, - numberDigitGroupSep: numberDigitGroupSep, - numberDecimalMark: numberDecimalMark, - numberDigitGroupCount: numberDigitGroupCount, - animatedZooms: animatedZooms, - width: state.chartWidth(), - height: state.chartHeight() - }; + // get the ordered list of chart ASSIGNED colors + // (this returns only the colors that have been + // assigned to dimensions, prepended with any + // custom colors defined) + this.chartColors = function () { + this.chartPrepareColorPalette(); - $(state.element_chart).sparkline(data.result, state.sparkline_options); + if (this.debug) { + this.log("chartColors() returns:"); + this.log(this.colors); + } - return true; + return this.colors; }; - // ---------------------------------------------------------------------------------------------------------------- - // dygraph + this.legendPluginModuleString = function (withContext) { + let str = ' '; + let context = ''; - NETDATA.dygraph = { - smooth: false - }; + if (typeof this.chart !== 'undefined') { + if (withContext && typeof this.chart.context === 'string') { + context = this.chart.context; + } - NETDATA.dygraphToolboxPanAndZoom = function(state, after, before) { - if(after < state.netdata_first) - after = state.netdata_first; + if (typeof this.chart.plugin === 'string' && this.chart.plugin !== '') { + str = this.chart.plugin; - if(before > state.netdata_last) - before = state.netdata_last; + if (str.endsWith(".plugin")) { + str = str.substring(0, str.length - 7); + } - state.setMode('zoom'); - NETDATA.globalSelectionSync.stop(); - NETDATA.globalSelectionSync.delay(); - state.tmp.dygraph_user_action = true; - state.tmp.dygraph_force_zoom = true; - // state.log('toolboxPanAndZoom'); - state.updateChartPanOrZoom(after, before); - NETDATA.globalPanAndZoom.setMaster(state, after, before); - }; + if (typeof this.chart.module === 'string' && this.chart.module !== '') { + str += ':' + this.chart.module; + } - NETDATA.dygraphSetSelection = function(state, t) { - if(typeof state.tmp.dygraph_instance !== 'undefined') { - var r = state.calculateRowForTime(t); - if(r !== -1) { - state.tmp.dygraph_instance.setSelection(r); - return true; + if (withContext && context !== '') { + str += ', ' + context; + } } - else { - state.tmp.dygraph_instance.clearSelection(); - state.legendShowUndefined(); + else if (withContext && context !== '') { + str = context; } } - return false; + return str; }; - NETDATA.dygraphClearSelection = function(state) { - if(typeof state.tmp.dygraph_instance !== 'undefined') { - state.tmp.dygraph_instance.clearSelection(); + this.legendResolutionTooltip = function () { + if (!this.chart) { + return ''; } - return true; - }; - NETDATA.dygraphSmoothInitialize = function(callback) { - $.ajax({ - url: NETDATA.dygraph_smooth_js, - cache: true, - dataType: "script", - xhrFields: { withCredentials: true } // required for the cookie - }) - .done(function() { - NETDATA.dygraph.smooth = true; - smoothPlotter.smoothing = 0.3; - }) - .fail(function() { - NETDATA.dygraph.smooth = false; - }) - .always(function() { - if(typeof callback === "function") - return callback(); - }); - }; + let collected = this.chart.update_every; + let viewed = (this.data) ? this.data.view_update_every : collected; - NETDATA.dygraphInitialize = function(callback) { - if(typeof netdataNoDygraphs === 'undefined' || !netdataNoDygraphs) { - $.ajax({ - url: NETDATA.dygraph_js, - cache: true, - dataType: "script", - xhrFields: { withCredentials: true } // required for the cookie - }) - .done(function() { - NETDATA.registerChartLibrary('dygraph', NETDATA.dygraph_js); - }) - .fail(function() { - NETDATA.chartLibraries.dygraph.enabled = false; - NETDATA.error(100, NETDATA.dygraph_js); - }) - .always(function() { - if(NETDATA.chartLibraries.dygraph.enabled === true && NETDATA.options.current.smooth_plot === true) - NETDATA.dygraphSmoothInitialize(callback); - else if(typeof callback === "function") - return callback(); - }); - } - else { - NETDATA.chartLibraries.dygraph.enabled = false; - if(typeof callback === "function") - return callback(); + if (collected === viewed) { + return "resolution " + NETDATA.seconds4human(collected); } + + return "resolution " + NETDATA.seconds4human(viewed) + ", collected every " + NETDATA.seconds4human(collected); }; - NETDATA.dygraphChartUpdate = function(state, data) { - var dygraph = state.tmp.dygraph_instance; + this.legendUpdateDOM = function () { + let needed = false, dim, keys, len; - if(typeof dygraph === 'undefined') - return NETDATA.dygraphChartCreate(state, data); + // check that the legend DOM is up to date for the downloaded dimensions + if (typeof this.element_legend_childs.series !== 'object' || this.element_legend_childs.series === null) { + // this.log('the legend does not have any series - requesting legend update'); + needed = true; + } else if (this.data === null) { + // this.log('the chart does not have any data - requesting legend update'); + needed = true; + } else if (typeof this.element_legend_childs.series.labels_key === 'undefined') { + needed = true; + } else { + let labels = this.data.dimension_names.toString(); + if (labels !== this.element_legend_childs.series.labels_key) { + needed = true; - // when the chart is not visible, and hidden - // if there is a window resize, dygraph detects - // its element size as 0x0. - // this will make it re-appear properly + if (this.debug) { + this.log('NEW LABELS: "' + labels + '" NOT EQUAL OLD LABELS: "' + this.element_legend_childs.series.labels_key + '"'); + } + } + } - if(state.tm.last_unhidden > state.tmp.dygraph_last_rendered) - dygraph.resize(); + if (!needed) { + // make sure colors available + this.chartPrepareColorPalette(); - var options = { - file: data.result.data, - colors: state.chartColors(), - labels: data.result.labels, - //labelsDivWidth: state.chartWidth() - 70, - includeZero: state.tmp.dygraph_include_zero, - visibility: state.dimensions_visibility.selected2BooleanArray(state.data.dimension_names) - }; + // do we have to update the current values? + // we do this, only when the visible chart is current + if (Math.abs(this.netdata_last - this.view_before) <= this.data_update_every) { + if (this.debug) { + this.log('chart is in latest position... updating values on legend...'); + } - if(state.tmp.dygraph_chart_type === 'stacked') { - if(options.includeZero === true && state.dimensions_visibility.countSelected() < options.visibility.length) - options.includeZero = 0; + //let labels = this.data.dimension_names; + //let i = labels.length; + //while (i--) + // this.legendSetLabelValue(labels[i], this.data.view_latest_values[i]); + } + return; } - if(!NETDATA.chartLibraries.dygraph.isSparkline(state)) { - options.ylabel = state.units_current; // (state.units_desired === 'auto')?"":state.units_current; + if (this.colors === null) { + // this is the first time we update the chart + // let's assign colors to all dimensions + if (this.library.track_colors()) { + this.colors = []; + keys = Object.keys(this.chart.dimensions); + len = keys.length; + for (let i = 0; i < len; i++) { + NETDATA.commonColors.get(this, this.chart.dimensions[keys[i]].name); + } + } } - if(state.tmp.dygraph_force_zoom === true) { - if(NETDATA.options.debug.dygraph === true || state.debug === true) - state.log('dygraphChartUpdate() forced zoom update'); - - options.dateWindow = (state.requested_padding !== null)?[ state.view_after, state.view_before ]:null; - //options.isZoomedIgnoreProgrammaticZoom = true; - state.tmp.dygraph_force_zoom = false; - } - else if(state.current.name !== 'auto') { - if(NETDATA.options.debug.dygraph === true || state.debug === true) - state.log('dygraphChartUpdate() loose update'); - } - else { - if(NETDATA.options.debug.dygraph === true || state.debug === true) - state.log('dygraphChartUpdate() strict update'); + // we will re-generate the colors for the chart + // based on the dimensions this result has data for + this.colors = []; - options.dateWindow = (state.requested_padding !== null)?[ state.view_after, state.view_before ]:null; - //options.isZoomedIgnoreProgrammaticZoom = true; + if (this.debug) { + this.log('updating Legend DOM'); } - options.valueRange = state.tmp.dygraph_options.valueRange; + // mark all dimensions as invalid + this.dimensions_visibility.invalidateAll(); - var oldMax = null, oldMin = null; - if (state.tmp.__commonMin !== null) { - state.data.min = state.tmp.dygraph_instance.axes_[0].extremeRange[0]; - oldMin = options.valueRange[0] = NETDATA.commonMin.get(state); - } - if (state.tmp.__commonMax !== null) { - state.data.max = state.tmp.dygraph_instance.axes_[0].extremeRange[1]; - oldMax = options.valueRange[1] = NETDATA.commonMax.get(state); - } + const genLabel = function (state, parent, dim, name, count) { + let color = state.__chartDimensionColor(name); - if(state.tmp.dygraph_smooth_eligible === true) { - if((NETDATA.options.current.smooth_plot === true && state.tmp.dygraph_options.plotter !== smoothPlotter) - || (NETDATA.options.current.smooth_plot === false && state.tmp.dygraph_options.plotter === smoothPlotter)) { - NETDATA.dygraphChartCreate(state, data); - return; + let user_element = null; + let user_id = NETDATA.dataAttribute(state.element, 'show-value-of-' + name.toLowerCase() + '-at', null); + if (user_id === null) { + user_id = NETDATA.dataAttribute(state.element, 'show-value-of-' + dim.toLowerCase() + '-at', null); + } + if (user_id !== null) { + user_element = document.getElementById(user_id) || null; + if (user_element === null) { + state.log('Cannot find element with id: ' + user_id); + } } - } - if(netdataSnapshotData !== null && NETDATA.globalPanAndZoom.isActive() === true && NETDATA.globalPanAndZoom.isMaster(state) === false) { - // pan and zoom on snapshots - options.dateWindow = [ NETDATA.globalPanAndZoom.force_after_ms, NETDATA.globalPanAndZoom.force_before_ms ]; - //options.isZoomedIgnoreProgrammaticZoom = true; - } + state.element_legend_childs.series[name] = { + name: document.createElement('span'), + value: document.createElement('span'), + user: user_element, + last: null, + last_shown_value: null + }; - if(NETDATA.chartLibraries.dygraph.isLogScale(state) === true) { - if(Array.isArray(options.valueRange) && options.valueRange[0] <= 0) - options.valueRange[0] = null; - } + let label = state.element_legend_childs.series[name]; - dygraph.updateOptions(options); + // create the dimension visibility tracking for this label + state.dimensions_visibility.dimensionAdd(name, label.name, label.value, color); - var redraw = false; - if(oldMin !== null && oldMin > state.tmp.dygraph_instance.axes_[0].extremeRange[0]) { - state.data.min = state.tmp.dygraph_instance.axes_[0].extremeRange[0]; - options.valueRange[0] = NETDATA.commonMin.get(state); - redraw = true; - } - if(oldMax !== null && oldMax < state.tmp.dygraph_instance.axes_[0].extremeRange[1]) { - state.data.max = state.tmp.dygraph_instance.axes_[0].extremeRange[1]; - options.valueRange[1] = NETDATA.commonMax.get(state); - redraw = true; - } + let rgb = NETDATA.colorHex2Rgb(color); + label.name.innerHTML = '<table class="netdata-legend-name-table-' + + state.chart.chart_type + + '" style="background-color: ' + + 'rgba(' + rgb.r + ',' + rgb.g + ',' + rgb.b + ',' + NETDATA.options.current['color_fill_opacity_' + state.chart.chart_type] + ') !important' + + '"><tr class="netdata-legend-name-tr"><td class="netdata-legend-name-td"></td></tr></table>'; - if(redraw === true) { - // state.log('forcing redraw to adapt to common- min/max'); - dygraph.updateOptions(options); - } + let text = document.createTextNode(' ' + name); + label.name.appendChild(text); - state.tmp.dygraph_last_rendered = Date.now(); - return true; - }; + if (count > 0) { + parent.appendChild(document.createElement('br')); + } + + parent.appendChild(label.name); + parent.appendChild(label.value); + }; + + let content = document.createElement('div'); + + if (this.element_chart === null) { + this.element_chart = document.createElement('div'); + this.element_chart.id = this.library_name + '-' + this.uuid + '-chart'; + this.element.appendChild(this.element_chart); + + if (this.hasLegend()) { + this.element_chart.className = 'netdata-chart-with-legend-right netdata-' + this.library_name + '-chart-with-legend-right'; + } else { + this.element_chart.className = ' netdata-chart netdata-' + this.library_name + '-chart'; + } + } + + if (this.hasLegend()) { + if (this.element_legend === null) { + this.element_legend = document.createElement('div'); + this.element_legend.className = 'netdata-chart-legend netdata-' + this.library_name + '-legend'; + this.element.appendChild(this.element_legend); + } else { + this.element_legend.innerHTML = ''; + } + + this.element_legend_childs = { + content: content, + resize_handler: null, + toolbox: null, + toolbox_left: null, + toolbox_right: null, + toolbox_reset: null, + toolbox_zoomin: null, + toolbox_zoomout: null, + toolbox_volume: null, + title_date: document.createElement('span'), + title_time: document.createElement('span'), + title_units: document.createElement('span'), + perfect_scroller: document.createElement('div'), + series: {} + }; - NETDATA.dygraphChartCreate = function(state, data) { - if(NETDATA.options.debug.dygraph === true || state.debug === true) - state.log('dygraphChartCreate()'); - - state.tmp.dygraph_chart_type = NETDATA.dataAttribute(state.element, 'dygraph-type', state.chart.chart_type); - if(state.tmp.dygraph_chart_type === 'stacked' && data.dimensions === 1) state.tmp.dygraph_chart_type = 'area'; - if(state.tmp.dygraph_chart_type === 'stacked' && NETDATA.chartLibraries.dygraph.isLogScale(state) === true) state.tmp.dygraph_chart_type = 'area'; - - var highlightCircleSize = (NETDATA.chartLibraries.dygraph.isSparkline(state) === true)?3:4; - - var smooth = (NETDATA.dygraph.smooth === true) - ?(NETDATA.dataAttributeBoolean(state.element, 'dygraph-smooth', (state.tmp.dygraph_chart_type === 'line' && NETDATA.chartLibraries.dygraph.isSparkline(state) === false))) - :false; - - state.tmp.dygraph_include_zero = NETDATA.dataAttribute(state.element, 'dygraph-includezero', (state.tmp.dygraph_chart_type === 'stacked')); - var drawAxis = NETDATA.dataAttributeBoolean(state.element, 'dygraph-drawaxis', true); - - state.tmp.dygraph_options = { - colors: NETDATA.dataAttribute(state.element, 'dygraph-colors', state.chartColors()), - - // leave a few pixels empty on the right of the chart - rightGap: NETDATA.dataAttribute(state.element, 'dygraph-rightgap', 5), - showRangeSelector: NETDATA.dataAttributeBoolean(state.element, 'dygraph-showrangeselector', false), - showRoller: NETDATA.dataAttributeBoolean(state.element, 'dygraph-showroller', false), - title: NETDATA.dataAttribute(state.element, 'dygraph-title', state.title), - titleHeight: NETDATA.dataAttribute(state.element, 'dygraph-titleheight', 19), - legend: NETDATA.dataAttribute(state.element, 'dygraph-legend', 'always'), // we need this to get selection events - labels: data.result.labels, - labelsDiv: NETDATA.dataAttribute(state.element, 'dygraph-labelsdiv', state.element_legend_childs.hidden), - //labelsDivStyles: NETDATA.dataAttribute(state.element, 'dygraph-labelsdivstyles', { 'fontSize':'1px' }), - //labelsDivWidth: NETDATA.dataAttribute(state.element, 'dygraph-labelsdivwidth', state.chartWidth() - 70), - labelsSeparateLines: NETDATA.dataAttributeBoolean(state.element, 'dygraph-labelsseparatelines', true), - labelsShowZeroValues: (NETDATA.chartLibraries.dygraph.isLogScale(state) === true)?false:NETDATA.dataAttributeBoolean(state.element, 'dygraph-labelsshowzerovalues', true), - labelsKMB: false, - labelsKMG2: false, - showLabelsOnHighlight: NETDATA.dataAttributeBoolean(state.element, 'dygraph-showlabelsonhighlight', true), - hideOverlayOnMouseOut: NETDATA.dataAttributeBoolean(state.element, 'dygraph-hideoverlayonmouseout', true), - includeZero: state.tmp.dygraph_include_zero, - xRangePad: NETDATA.dataAttribute(state.element, 'dygraph-xrangepad', 0), - yRangePad: NETDATA.dataAttribute(state.element, 'dygraph-yrangepad', 1), - valueRange: NETDATA.dataAttribute(state.element, 'dygraph-valuerange', [ null, null ]), - ylabel: state.units_current, // (state.units_desired === 'auto')?"":state.units_current, - yLabelWidth: NETDATA.dataAttribute(state.element, 'dygraph-ylabelwidth', 12), - - // the function to plot the chart - plotter: null, - - // The width of the lines connecting data points. - // This can be used to increase the contrast or some graphs. - strokeWidth: NETDATA.dataAttribute(state.element, 'dygraph-strokewidth', ((state.tmp.dygraph_chart_type === 'stacked')?0.1:((smooth === true)?1.5:0.7))), - strokePattern: NETDATA.dataAttribute(state.element, 'dygraph-strokepattern', undefined), - - // The size of the dot to draw on each point in pixels (see drawPoints). - // A dot is always drawn when a point is "isolated", - // i.e. there is a missing point on either side of it. - // This also controls the size of those dots. - drawPoints: NETDATA.dataAttributeBoolean(state.element, 'dygraph-drawpoints', false), - - // Draw points at the edges of gaps in the data. - // This improves visibility of small data segments or other data irregularities. - drawGapEdgePoints: NETDATA.dataAttributeBoolean(state.element, 'dygraph-drawgapedgepoints', true), - connectSeparatedPoints: (NETDATA.chartLibraries.dygraph.isLogScale(state) === true)?false:NETDATA.dataAttributeBoolean(state.element, 'dygraph-connectseparatedpoints', false), - pointSize: NETDATA.dataAttribute(state.element, 'dygraph-pointsize', 1), - - // enabling this makes the chart with little square lines - stepPlot: NETDATA.dataAttributeBoolean(state.element, 'dygraph-stepplot', false), - - // Draw a border around graph lines to make crossing lines more easily - // distinguishable. Useful for graphs with many lines. - strokeBorderColor: NETDATA.dataAttribute(state.element, 'dygraph-strokebordercolor', NETDATA.themes.current.background), - strokeBorderWidth: NETDATA.dataAttribute(state.element, 'dygraph-strokeborderwidth', (state.tmp.dygraph_chart_type === 'stacked')?0.0:0.0), - fillGraph: NETDATA.dataAttribute(state.element, 'dygraph-fillgraph', (state.tmp.dygraph_chart_type === 'area' || state.tmp.dygraph_chart_type === 'stacked')), - fillAlpha: NETDATA.dataAttribute(state.element, 'dygraph-fillalpha', - ((state.tmp.dygraph_chart_type === 'stacked') - ?NETDATA.options.current.color_fill_opacity_stacked - :NETDATA.options.current.color_fill_opacity_area) - ), - stackedGraph: NETDATA.dataAttribute(state.element, 'dygraph-stackedgraph', (state.tmp.dygraph_chart_type === 'stacked')), - stackedGraphNaNFill: NETDATA.dataAttribute(state.element, 'dygraph-stackedgraphnanfill', 'none'), - drawAxis: drawAxis, - axisLabelFontSize: NETDATA.dataAttribute(state.element, 'dygraph-axislabelfontsize', 10), - axisLineColor: NETDATA.dataAttribute(state.element, 'dygraph-axislinecolor', NETDATA.themes.current.axis), - axisLineWidth: NETDATA.dataAttribute(state.element, 'dygraph-axislinewidth', 1.0), - drawGrid: NETDATA.dataAttributeBoolean(state.element, 'dygraph-drawgrid', true), - gridLinePattern: NETDATA.dataAttribute(state.element, 'dygraph-gridlinepattern', null), - gridLineWidth: NETDATA.dataAttribute(state.element, 'dygraph-gridlinewidth', 1.0), - gridLineColor: NETDATA.dataAttribute(state.element, 'dygraph-gridlinecolor', NETDATA.themes.current.grid), - maxNumberWidth: NETDATA.dataAttribute(state.element, 'dygraph-maxnumberwidth', 8), - sigFigs: NETDATA.dataAttribute(state.element, 'dygraph-sigfigs', null), - digitsAfterDecimal: NETDATA.dataAttribute(state.element, 'dygraph-digitsafterdecimal', 2), - valueFormatter: NETDATA.dataAttribute(state.element, 'dygraph-valueformatter', undefined), - highlightCircleSize: NETDATA.dataAttribute(state.element, 'dygraph-highlightcirclesize', highlightCircleSize), - highlightSeriesOpts: NETDATA.dataAttribute(state.element, 'dygraph-highlightseriesopts', null), // TOO SLOW: { strokeWidth: 1.5 }, - highlightSeriesBackgroundAlpha: NETDATA.dataAttribute(state.element, 'dygraph-highlightseriesbackgroundalpha', null), // TOO SLOW: (state.tmp.dygraph_chart_type === 'stacked')?0.7:0.5, - pointClickCallback: NETDATA.dataAttribute(state.element, 'dygraph-pointclickcallback', undefined), - visibility: state.dimensions_visibility.selected2BooleanArray(state.data.dimension_names), - logscale: (NETDATA.chartLibraries.dygraph.isLogScale(state) === true)?'y':undefined, - - axes: { - x: { - pixelsPerLabel: NETDATA.dataAttribute(state.element, 'dygraph-xpixelsperlabel', 50), - ticker: Dygraph.dateTicker, - axisLabelWidth: NETDATA.dataAttribute(state.element, 'dygraph-xaxislabelwidth', 60), - drawAxis: NETDATA.dataAttributeBoolean(state.element, 'dygraph-drawxaxis', drawAxis), - axisLabelFormatter: function (d, gran) { - void(gran); - return NETDATA.dateTime.xAxisTimeString(d); + if (NETDATA.options.current.legend_toolbox && this.library.toolboxPanAndZoom !== null) { + this.element_legend_childs.toolbox = document.createElement('div'); + this.element_legend_childs.toolbox_left = document.createElement('div'); + this.element_legend_childs.toolbox_right = document.createElement('div'); + this.element_legend_childs.toolbox_reset = document.createElement('div'); + this.element_legend_childs.toolbox_zoomin = document.createElement('div'); + this.element_legend_childs.toolbox_zoomout = document.createElement('div'); + this.element_legend_childs.toolbox_volume = document.createElement('div'); + + const getPanAndZoomStep = function (event) { + if (event.ctrlKey) { + return NETDATA.options.current.pan_and_zoom_factor * NETDATA.options.current.pan_and_zoom_factor_multiplier_control; + } else if (event.shiftKey) { + return NETDATA.options.current.pan_and_zoom_factor * NETDATA.options.current.pan_and_zoom_factor_multiplier_shift; + } else if (event.altKey) { + return NETDATA.options.current.pan_and_zoom_factor * NETDATA.options.current.pan_and_zoom_factor_multiplier_alt; + } else { + return NETDATA.options.current.pan_and_zoom_factor; } - }, - y: { - logscale: (NETDATA.chartLibraries.dygraph.isLogScale(state) === true)?true:undefined, - pixelsPerLabel: NETDATA.dataAttribute(state.element, 'dygraph-ypixelsperlabel', 15), - axisLabelWidth: NETDATA.dataAttribute(state.element, 'dygraph-yaxislabelwidth', 50), - drawAxis: NETDATA.dataAttributeBoolean(state.element, 'dygraph-drawyaxis', drawAxis), - axisLabelFormatter: function (y) { - - // unfortunately, we have to call this every single time - state.legendFormatValueDecimalsFromMinMax( - this.axes_[0].extremeRange[0], - this.axes_[0].extremeRange[1] - ); - - var old_units = this.user_attrs_.ylabel; - var v = state.legendFormatValue(y); - var new_units = state.units_current; - - if(state.units_desired === 'auto' && typeof old_units !== 'undefined' && new_units !== old_units && !NETDATA.chartLibraries.dygraph.isSparkline(state)) { - // console.log(this); - // state.log('units discrepancy: old = ' + old_units + ', new = ' + new_units); - var len = this.plugins_.length; - while(len--) { - // console.log(this.plugins_[len]); - if(typeof this.plugins_[len].plugin.ylabel_div_ !== 'undefined' - && this.plugins_[len].plugin.ylabel_div_ !== null - && typeof this.plugins_[len].plugin.ylabel_div_.children !== 'undefined' - && this.plugins_[len].plugin.ylabel_div_.children !== null - && typeof this.plugins_[len].plugin.ylabel_div_.children[0].children !== 'undefined' - && this.plugins_[len].plugin.ylabel_div_.children[0].children !== null - ) { - this.plugins_[len].plugin.ylabel_div_.children[0].children[0].innerHTML = new_units; - this.user_attrs_.ylabel = new_units; - break; - } - } + }; - if(len < 0) - state.log('units discrepancy, but cannot find dygraphs div to change: old = ' + old_units + ', new = ' + new_units); - } + this.element_legend_childs.toolbox.className += ' netdata-legend-toolbox'; + this.element.appendChild(this.element_legend_childs.toolbox); + + this.element_legend_childs.toolbox_left.className += ' netdata-legend-toolbox-button'; + this.element_legend_childs.toolbox_left.innerHTML = NETDATA.icons.left; + this.element_legend_childs.toolbox.appendChild(this.element_legend_childs.toolbox_left); + this.element_legend_childs.toolbox_left.onclick = function (e) { + e.preventDefault(); - return v; + let step = (that.view_before - that.view_after) * getPanAndZoomStep(e); + let before = that.view_before - step; + let after = that.view_after - step; + if (after >= that.netdata_first) { + that.library.toolboxPanAndZoom(that, after, before); } + }; + if (NETDATA.options.current.show_help) { + $(this.element_legend_childs.toolbox_left).popover({ + container: "body", + animation: false, + html: true, + trigger: 'hover', + placement: 'bottom', + delay: { + show: NETDATA.options.current.show_help_delay_show_ms, + hide: NETDATA.options.current.show_help_delay_hide_ms + }, + title: 'Pan Left', + content: 'Pan the chart to the left. You can also <b>drag it</b> with your mouse or your finger (on touch devices).<br/><small>Help can be disabled from the settings.</small>' + }); } - }, - legendFormatter: function(data) { - if(state.tmp.dygraph_mouse_down === true) - return; - var elements = state.element_legend_childs; - - // if the hidden div is not there - // we are not managing the legend - if(elements.hidden === null) return; - - if (typeof data.x !== 'undefined') { - state.legendSetDate(data.x); - var i = data.series.length; - while(i--) { - var series = data.series[i]; - if(series.isVisible === true) - state.legendSetLabelValue(series.label, series.y); - else - state.legendSetLabelValue(series.label, null); - } + this.element_legend_childs.toolbox_reset.className += ' netdata-legend-toolbox-button'; + this.element_legend_childs.toolbox_reset.innerHTML = NETDATA.icons.reset; + this.element_legend_childs.toolbox.appendChild(this.element_legend_childs.toolbox_reset); + this.element_legend_childs.toolbox_reset.onclick = function (e) { + e.preventDefault(); + NETDATA.resetAllCharts(that); + }; + if (NETDATA.options.current.show_help) { + $(this.element_legend_childs.toolbox_reset).popover({ + container: "body", + animation: false, + html: true, + trigger: 'hover', + placement: 'bottom', + delay: { + show: NETDATA.options.current.show_help_delay_show_ms, + hide: NETDATA.options.current.show_help_delay_hide_ms + }, + title: 'Chart Reset', + content: 'Reset all the charts to their default auto-refreshing state. You can also <b>double click</b> the chart contents with your mouse or your finger (on touch devices).<br/><small>Help can be disabled from the settings.</small>' + }); } - return ''; - }, - drawCallback: function(dygraph, is_initial) { + this.element_legend_childs.toolbox_right.className += ' netdata-legend-toolbox-button'; + this.element_legend_childs.toolbox_right.innerHTML = NETDATA.icons.right; + this.element_legend_childs.toolbox.appendChild(this.element_legend_childs.toolbox_right); + this.element_legend_childs.toolbox_right.onclick = function (e) { + e.preventDefault(); + let step = (that.view_before - that.view_after) * getPanAndZoomStep(e); + let before = that.view_before + step; + let after = that.view_after + step; + if (before <= that.netdata_last) { + that.library.toolboxPanAndZoom(that, after, before); + } + }; + if (NETDATA.options.current.show_help) { + $(this.element_legend_childs.toolbox_right).popover({ + container: "body", + animation: false, + html: true, + trigger: 'hover', + placement: 'bottom', + delay: { + show: NETDATA.options.current.show_help_delay_show_ms, + hide: NETDATA.options.current.show_help_delay_hide_ms + }, + title: 'Pan Right', + content: 'Pan the chart to the right. You can also <b>drag it</b> with your mouse or your finger (on touch devices).<br/><small>Help, can be disabled from the settings.</small>' + }); + } - // the user has panned the chart and this is called to re-draw the chart - // 1. refresh this chart by adding data to it - // 2. notify all the other charts about the update they need + this.element_legend_childs.toolbox_zoomin.className += ' netdata-legend-toolbox-button'; + this.element_legend_childs.toolbox_zoomin.innerHTML = NETDATA.icons.zoomIn; + this.element_legend_childs.toolbox.appendChild(this.element_legend_childs.toolbox_zoomin); + this.element_legend_childs.toolbox_zoomin.onclick = function (e) { + e.preventDefault(); + let dt = ((that.view_before - that.view_after) * (getPanAndZoomStep(e) * 0.8) / 2); + let before = that.view_before - dt; + let after = that.view_after + dt; + that.library.toolboxPanAndZoom(that, after, before); + }; + if (NETDATA.options.current.show_help) { + $(this.element_legend_childs.toolbox_zoomin).popover({ + container: "body", + animation: false, + html: true, + trigger: 'hover', + placement: 'bottom', + delay: { + show: NETDATA.options.current.show_help_delay_show_ms, + hide: NETDATA.options.current.show_help_delay_hide_ms + }, + title: 'Chart Zoom In', + content: 'Zoom in the chart. You can also press SHIFT and select an area of the chart, or press SHIFT or ALT and use the mouse wheel or 2-finger touchpad scroll to zoom in or out.<br/><small>Help, can be disabled from the settings.</small>' + }); + } - // to prevent an infinite loop (feedback), we use - // state.tmp.dygraph_user_action - // - when true, this is initiated by a user - // - when false, this is feedback + this.element_legend_childs.toolbox_zoomout.className += ' netdata-legend-toolbox-button'; + this.element_legend_childs.toolbox_zoomout.innerHTML = NETDATA.icons.zoomOut; + this.element_legend_childs.toolbox.appendChild(this.element_legend_childs.toolbox_zoomout); + this.element_legend_childs.toolbox_zoomout.onclick = function (e) { + e.preventDefault(); + let dt = (((that.view_before - that.view_after) / (1.0 - (getPanAndZoomStep(e) * 0.8)) - (that.view_before - that.view_after)) / 2); + let before = that.view_before + dt; + let after = that.view_after - dt; - if(state.current.name !== 'auto' && state.tmp.dygraph_user_action === true) { - state.tmp.dygraph_user_action = false; + that.library.toolboxPanAndZoom(that, after, before); + }; + if (NETDATA.options.current.show_help) { + $(this.element_legend_childs.toolbox_zoomout).popover({ + container: "body", + animation: false, + html: true, + trigger: 'hover', + placement: 'bottom', + delay: { + show: NETDATA.options.current.show_help_delay_show_ms, + hide: NETDATA.options.current.show_help_delay_hide_ms + }, + title: 'Chart Zoom Out', + content: 'Zoom out the chart. You can also press SHIFT or ALT and use the mouse wheel, or 2-finger touchpad scroll to zoom in or out.<br/><small>Help, can be disabled from the settings.</small>' + }); + } - var x_range = dygraph.xAxisRange(); - var after = Math.round(x_range[0]); - var before = Math.round(x_range[1]); + //this.element_legend_childs.toolbox_volume.className += ' netdata-legend-toolbox-button'; + //this.element_legend_childs.toolbox_volume.innerHTML = '<i class="fas fa-sort-amount-down"></i>'; + //this.element_legend_childs.toolbox_volume.title = 'Visible Volume'; + //this.element_legend_childs.toolbox.appendChild(this.element_legend_childs.toolbox_volume); + //this.element_legend_childs.toolbox_volume.onclick = function(e) { + //e.preventDefault(); + //alert('clicked toolbox_volume on ' + that.id); + //} + } - if(NETDATA.options.debug.dygraph === true) - state.log('dygraphDrawCallback(dygraph, ' + is_initial + '): mode ' + state.current.name + ' ' + (after / 1000).toString() + ' - ' + (before / 1000).toString()); - //console.log(state); + if (NETDATA.options.current.resize_charts) { + this.element_legend_childs.resize_handler = document.createElement('div'); - if(before <= state.netdata_last && after >= state.netdata_first) - // update only when we are within the data limits - state.updateChartPanOrZoom(after, before); + this.element_legend_childs.resize_handler.className += " netdata-legend-resize-handler"; + this.element_legend_childs.resize_handler.innerHTML = NETDATA.icons.resize; + this.element.appendChild(this.element_legend_childs.resize_handler); + if (NETDATA.options.current.show_help) { + $(this.element_legend_childs.resize_handler).popover({ + container: "body", + animation: false, + html: true, + trigger: 'hover', + placement: 'bottom', + delay: { + show: NETDATA.options.current.show_help_delay_show_ms, + hide: NETDATA.options.current.show_help_delay_hide_ms + }, + title: 'Chart Resize', + content: 'Drag this point with your mouse or your finger (on touch devices), to resize the chart vertically. You can also <b>double click it</b> or <b>double tap it</b> to reset between 2 states: the default and the one that fits all the values.<br/><small>Help, can be disabled from the settings.</small>' + }); } - }, - zoomCallback: function(minDate, maxDate, yRanges) { - // the user has selected a range on the chart - // 1. refresh this chart by adding data to it - // 2. notify all the other charts about the update they need + // mousedown event + this.element_legend_childs.resize_handler.onmousedown = + function (e) { + that.resizeHandler(e); + }; - void(yRanges); + // touchstart event + this.element_legend_childs.resize_handler.addEventListener('touchstart', function (e) { + that.resizeHandler(e); + }, false); + } - if(NETDATA.options.debug.dygraph === true) - state.log('dygraphZoomCallback(): ' + state.current.name); + if (this.chart) { + this.element_legend_childs.title_date.title = this.legendPluginModuleString(true); + this.element_legend_childs.title_time.title = this.legendResolutionTooltip(); + } - NETDATA.globalSelectionSync.stop(); - NETDATA.globalSelectionSync.delay(); - state.setMode('zoom'); + this.element_legend_childs.title_date.className += " netdata-legend-title-date"; + this.element_legend.appendChild(this.element_legend_childs.title_date); + this.tmp.__last_shown_legend_date = undefined; - // refresh it to the greatest possible zoom level - state.tmp.dygraph_user_action = true; - state.tmp.dygraph_force_zoom = true; - state.updateChartPanOrZoom(minDate, maxDate); - }, - highlightCallback: function(event, x, points, row, seriesName) { - void(seriesName); + this.element_legend.appendChild(document.createElement('br')); - state.pauseChart(); + this.element_legend_childs.title_time.className += " netdata-legend-title-time"; + this.element_legend.appendChild(this.element_legend_childs.title_time); + this.tmp.__last_shown_legend_time = undefined; - // there is a bug in dygraph when the chart is zoomed enough - // the time it thinks is selected is wrong - // here we calculate the time t based on the row number selected - // which is ok - // var t = state.data_after + row * state.data_update_every; - // console.log('row = ' + row + ', x = ' + x + ', t = ' + t + ' ' + ((t === x)?'SAME':(Math.abs(x-t)<=state.data_update_every)?'SIMILAR':'DIFFERENT') + ', rows in db: ' + state.data_points + ' visible(x) = ' + state.timeIsVisible(x) + ' visible(t) = ' + state.timeIsVisible(t) + ' r(x) = ' + state.calculateRowForTime(x) + ' r(t) = ' + state.calculateRowForTime(t) + ' range: ' + state.data_after + ' - ' + state.data_before + ' real: ' + state.data.after + ' - ' + state.data.before + ' every: ' + state.data_update_every); + this.element_legend.appendChild(document.createElement('br')); - if(state.tmp.dygraph_mouse_down !== true) - NETDATA.globalSelectionSync.sync(state, x); + this.element_legend_childs.title_units.className += " netdata-legend-title-units"; + this.element_legend_childs.title_units.innerText = this.units_current; + this.element_legend.appendChild(this.element_legend_childs.title_units); + this.tmp.__last_shown_legend_units = undefined; - // fix legend zIndex using the internal structures of dygraph legend module - // this works, but it is a hack! - // state.tmp.dygraph_instance.plugins_[0].plugin.legend_div_.style.zIndex = 10000; - }, - unhighlightCallback: function(event) { - void(event); + this.element_legend.appendChild(document.createElement('br')); - if(state.tmp.dygraph_mouse_down === true) - return; + this.element_legend_childs.perfect_scroller.className = 'netdata-legend-series'; + this.element_legend.appendChild(this.element_legend_childs.perfect_scroller); - if(NETDATA.options.debug.dygraph === true || state.debug === true) - state.log('dygraphUnhighlightCallback()'); + content.className = 'netdata-legend-series-content'; + this.element_legend_childs.perfect_scroller.appendChild(content); - state.unpauseChart(); - NETDATA.globalSelectionSync.stop(); - }, - underlayCallback: function(canvas, area, g) { + this.element_legend_childs.content = content; - // the chart is about to be drawn - // this function renders global highlighted time-frame + if (NETDATA.options.current.show_help) { + $(content).popover({ + container: "body", + animation: false, + html: true, + trigger: 'hover', + placement: 'bottom', + title: 'Chart Legend', + delay: { + show: NETDATA.options.current.show_help_delay_show_ms, + hide: NETDATA.options.current.show_help_delay_hide_ms + }, + content: 'You can click or tap on the values or the labels to select dimensions. By pressing SHIFT or CONTROL, you can enable or disable multiple dimensions.<br/><small>Help, can be disabled from the settings.</small>' + }); + } + } else { + this.element_legend_childs = { + content: content, + resize_handler: null, + toolbox: null, + toolbox_left: null, + toolbox_right: null, + toolbox_reset: null, + toolbox_zoomin: null, + toolbox_zoomout: null, + toolbox_volume: null, + title_date: null, + title_time: null, + title_units: null, + perfect_scroller: null, + series: {} + }; + } - if(NETDATA.globalChartUnderlay.isActive()) { - var after = NETDATA.globalChartUnderlay.after; - var before = NETDATA.globalChartUnderlay.before; + if (this.data) { + this.element_legend_childs.series.labels_key = this.data.dimension_names.toString(); + if (this.debug) { + this.log('labels from data: "' + this.element_legend_childs.series.labels_key + '"'); + } - if(after < state.view_after) - after = state.view_after; + for (let i = 0, len = this.data.dimension_names.length; i < len; i++) { + genLabel(this, content, this.data.dimension_ids[i], this.data.dimension_names[i], i); + } + } else { + let tmp = []; + keys = Object.keys(this.chart.dimensions); + for (let i = 0, len = keys.length; i < len; i++) { + dim = keys[i]; + tmp.push(this.chart.dimensions[dim].name); + genLabel(this, content, dim, this.chart.dimensions[dim].name, i); + } + this.element_legend_childs.series.labels_key = tmp.toString(); + if (this.debug) { + this.log('labels from chart: "' + this.element_legend_childs.series.labels_key + '"'); + } + } - if(before > state.view_before) - before = state.view_before; + // create a hidden div to be used for hidding + // the original legend of the chart library + let el = document.createElement('div'); + if (this.element_legend !== null) { + this.element_legend.appendChild(el); + } + el.style.display = 'none'; - if(after < before) { - var bottom_left = g.toDomCoords(after, -20); - var top_right = g.toDomCoords(before, +20); + this.element_legend_childs.hidden = document.createElement('div'); + el.appendChild(this.element_legend_childs.hidden); - var left = bottom_left[0]; - var right = top_right[0]; + if (this.element_legend_childs.perfect_scroller !== null) { + Ps.initialize(this.element_legend_childs.perfect_scroller, { + wheelSpeed: 0.2, + wheelPropagation: true, + swipePropagation: true, + minScrollbarLength: null, + maxScrollbarLength: null, + useBothWheelAxes: false, + suppressScrollX: true, + suppressScrollY: false, + scrollXMarginOffset: 0, + scrollYMarginOffset: 0, + theme: 'default' + }); + Ps.update(this.element_legend_childs.perfect_scroller); + } - canvas.fillStyle = NETDATA.themes.current.highlight; - canvas.fillRect(left, area.y, right - left, area.h); - } - } - }, - interactionModel : { - mousedown: function(event, dygraph, context) { - if(NETDATA.options.debug.dygraph === true || state.debug === true) - state.log('interactionModel.mousedown()'); + this.legendShowLatestValues(); + }; - state.tmp.dygraph_user_action = true; + this.hasLegend = function () { + if (typeof this.tmp.___hasLegendCache___ !== 'undefined') { + return this.tmp.___hasLegendCache___; + } - if(NETDATA.options.debug.dygraph === true) - state.log('dygraphMouseDown()'); + let leg = false; + if (this.library && this.library.legend(this) === 'right-side') { + leg = true; + } - // Right-click should not initiate anything. - if(event.button && event.button === 2) return; + this.tmp.___hasLegendCache___ = leg; + return leg; + }; - NETDATA.globalSelectionSync.stop(); - NETDATA.globalSelectionSync.delay(); + this.legendWidth = function () { + return (this.hasLegend()) ? 140 : 0; + }; - state.tmp.dygraph_mouse_down = true; - context.initializeMouseDown(event, dygraph, context); + this.legendHeight = function () { + return $(this.element).height(); + }; - //console.log(event); - if(event.button && event.button === 1) { - if (event.shiftKey) { - //console.log('middle mouse button dragging (PAN)'); + this.chartWidth = function () { + return $(this.element).width() - this.legendWidth(); + }; - state.setMode('pan'); - // NETDATA.globalSelectionSync.delay(); - state.tmp.dygraph_highlight_after = null; - Dygraph.startPan(event, dygraph, context); - } - else if(event.altKey || event.ctrlKey || event.metaKey) { - //console.log('middle mouse button highlight'); + this.chartHeight = function () { + return $(this.element).height(); + }; - if (!(event.offsetX && event.offsetY)) { - event.offsetX = event.layerX - event.target.offsetLeft; - event.offsetY = event.layerY - event.target.offsetTop; - } - state.tmp.dygraph_highlight_after = dygraph.toDataXCoord(event.offsetX); - Dygraph.startZoom(event, dygraph, context); - } - else { - //console.log('middle mouse button selection for zoom (ZOOM)'); + this.chartPixelsPerPoint = function () { + // force an options provided detail + let px = this.pixels_per_point; - state.setMode('zoom'); - // NETDATA.globalSelectionSync.delay(); - state.tmp.dygraph_highlight_after = null; - Dygraph.startZoom(event, dygraph, context); - } - } - else { - if (event.shiftKey) { - //console.log('left mouse button selection for zoom (ZOOM)'); + if (this.library && px < this.library.pixels_per_point(this)) { + px = this.library.pixels_per_point(this); + } - state.setMode('zoom'); - // NETDATA.globalSelectionSync.delay(); - state.tmp.dygraph_highlight_after = null; - Dygraph.startZoom(event, dygraph, context); - } - else if(event.altKey || event.ctrlKey || event.metaKey) { - //console.log('left mouse button highlight'); + if (px < NETDATA.options.current.pixels_per_point) { + px = NETDATA.options.current.pixels_per_point; + } - if (!(event.offsetX && event.offsetY)) { - event.offsetX = event.layerX - event.target.offsetLeft; - event.offsetY = event.layerY - event.target.offsetTop; - } - state.tmp.dygraph_highlight_after = dygraph.toDataXCoord(event.offsetX); - Dygraph.startZoom(event, dygraph, context); - } - else { - //console.log('left mouse button dragging (PAN)'); + return px; + }; - state.setMode('pan'); - // NETDATA.globalSelectionSync.delay(); - state.tmp.dygraph_highlight_after = null; - Dygraph.startPan(event, dygraph, context); - } - } - }, - mousemove: function(event, dygraph, context) { - if(NETDATA.options.debug.dygraph === true || state.debug === true) - state.log('interactionModel.mousemove()'); + this.needsRecreation = function () { + let ret = ( + this.chart_created && + this.library && + this.library.autoresize() === false && + this.tm.last_resized < NETDATA.options.last_page_resize + ); - if(state.tmp.dygraph_highlight_after !== null) { - //console.log('highlight selection...'); + if (this.debug) { + this.log('needsRecreation(): ' + ret.toString() + ', chart_created = ' + this.chart_created.toString()); + } - NETDATA.globalSelectionSync.stop(); - NETDATA.globalSelectionSync.delay(); + return ret; + }; - state.tmp.dygraph_user_action = true; - Dygraph.moveZoom(event, dygraph, context); - event.preventDefault(); - } - else if(context.isPanning) { - //console.log('panning...'); + this.chartDataUniqueID = function () { + return this.id + ',' + this.library_name + ',' + this.dimensions + ',' + this.chartURLOptions(); + }; - NETDATA.globalSelectionSync.stop(); - NETDATA.globalSelectionSync.delay(); + this.chartURLOptions = function () { + let ret = ''; - state.tmp.dygraph_user_action = true; - //NETDATA.globalSelectionSync.stop(); - //NETDATA.globalSelectionSync.delay(); - state.setMode('pan'); - context.is2DPan = false; - Dygraph.movePan(event, dygraph, context); - } - else if(context.isZooming) { - //console.log('zooming...'); + if (this.override_options !== null) { + ret = this.override_options.toString(); + } else { + ret = this.library.options(this); + } - NETDATA.globalSelectionSync.stop(); - NETDATA.globalSelectionSync.delay(); + if (this.append_options !== null) { + ret += '%7C' + this.append_options.toString(); + } - state.tmp.dygraph_user_action = true; - //NETDATA.globalSelectionSync.stop(); - //NETDATA.globalSelectionSync.delay(); - state.setMode('zoom'); - Dygraph.moveZoom(event, dygraph, context); - } - }, - mouseup: function(event, dygraph, context) { - state.tmp.dygraph_mouse_down = false; + ret += '%7C' + 'jsonwrap'; - if(NETDATA.options.debug.dygraph === true || state.debug === true) - state.log('interactionModel.mouseup()'); + if (NETDATA.options.current.eliminate_zero_dimensions) { + ret += '%7C' + 'nonzero'; + } - if(state.tmp.dygraph_highlight_after !== null) { - //console.log('done highlight selection'); + return ret; + }; - NETDATA.globalSelectionSync.stop(); - NETDATA.globalSelectionSync.delay(); + this.chartURL = function () { + let after, before, points_multiplier = 1; + if (NETDATA.globalPanAndZoom.isActive()) { + if (this.current.force_before_ms !== null && this.current.force_after_ms !== null) { + this.tm.pan_and_zoom_seq = 0; - if (!(event.offsetX && event.offsetY)){ - event.offsetX = event.layerX - event.target.offsetLeft; - event.offsetY = event.layerY - event.target.offsetTop; - } + before = Math.round(this.current.force_before_ms / 1000); + after = Math.round(this.current.force_after_ms / 1000); + this.view_after = after * 1000; + this.view_before = before * 1000; - NETDATA.globalChartUnderlay.set(state - , state.tmp.dygraph_highlight_after - , dygraph.toDataXCoord(event.offsetX) - , state.view_after - , state.view_before - ); + if (NETDATA.options.current.pan_and_zoom_data_padding) { + this.requested_padding = Math.round((before - after) / 2); + after -= this.requested_padding; + before += this.requested_padding; + this.requested_padding *= 1000; + points_multiplier = 2; + } - state.tmp.dygraph_highlight_after = null; + this.current.force_before_ms = null; + this.current.force_after_ms = null; + } else { + this.tm.pan_and_zoom_seq = NETDATA.globalPanAndZoom.seq; - context.isZooming = false; - dygraph.clearZoomRect_(); - dygraph.drawGraph_(false); + after = Math.round(NETDATA.globalPanAndZoom.force_after_ms / 1000); + before = Math.round(NETDATA.globalPanAndZoom.force_before_ms / 1000); + this.view_after = after * 1000; + this.view_before = before * 1000; - // refresh all the charts immediately - NETDATA.options.auto_refresher_stop_until = 0; - } - else if (context.isPanning) { - //console.log('done panning'); + this.requested_padding = null; + points_multiplier = 1; + } + } else { + this.tm.pan_and_zoom_seq = 0; - NETDATA.globalSelectionSync.stop(); - NETDATA.globalSelectionSync.delay(); + before = this.before; + after = this.after; + this.view_after = after * 1000; + this.view_before = before * 1000; - state.tmp.dygraph_user_action = true; - Dygraph.endPan(event, dygraph, context); + this.requested_padding = null; + points_multiplier = 1; + } - // refresh all the charts immediately - NETDATA.options.auto_refresher_stop_until = 0; - } - else if (context.isZooming) { - //console.log('done zomming'); + this.requested_after = after * 1000; + this.requested_before = before * 1000; - NETDATA.globalSelectionSync.stop(); - NETDATA.globalSelectionSync.delay(); + let data_points; + if (NETDATA.options.force_data_points !== 0) { + data_points = NETDATA.options.force_data_points; + this.data_points = data_points; + } else { + this.data_points = this.points || Math.round(this.chartWidth() / this.chartPixelsPerPoint()); + data_points = this.data_points * points_multiplier; + } - state.tmp.dygraph_user_action = true; - Dygraph.endZoom(event, dygraph, context); + // build the data URL + this.data_url = this.host + this.chart.data_url; + this.data_url += "&format=" + this.library.format(); + this.data_url += "&points=" + (data_points).toString(); + this.data_url += "&group=" + this.method; + this.data_url += ">ime=" + this.gtime; + this.data_url += "&options=" + this.chartURLOptions(); - // refresh all the charts immediately - NETDATA.options.auto_refresher_stop_until = 0; - } - }, - click: function(event, dygraph, context) { - void(dygraph); - void(context); + if (after) { + this.data_url += "&after=" + after.toString(); + } - if(NETDATA.options.debug.dygraph === true || state.debug === true) - state.log('interactionModel.click()'); + if (before) { + this.data_url += "&before=" + before.toString(); + } - event.preventDefault(); - }, - dblclick: function(event, dygraph, context) { - void(event); - void(dygraph); - void(context); - - if(NETDATA.options.debug.dygraph === true || state.debug === true) - state.log('interactionModel.dblclick()'); - NETDATA.resetAllCharts(state); - }, - wheel: function(event, dygraph, context) { - void(context); - - if(NETDATA.options.debug.dygraph === true || state.debug === true) - state.log('interactionModel.wheel()'); - - // Take the offset of a mouse event on the dygraph canvas and - // convert it to a pair of percentages from the bottom left. - // (Not top left, bottom is where the lower value is.) - function offsetToPercentage(g, offsetX, offsetY) { - // This is calculating the pixel offset of the leftmost date. - var xOffset = g.toDomCoords(g.xAxisRange()[0], null)[0]; - var yar0 = g.yAxisRange(0); - - // This is calculating the pixel of the highest value. (Top pixel) - var yOffset = g.toDomCoords(null, yar0[1])[1]; - - // x y w and h are relative to the corner of the drawing area, - // so that the upper corner of the drawing area is (0, 0). - var x = offsetX - xOffset; - var y = offsetY - yOffset; - - // This is computing the rightmost pixel, effectively defining the - // width. - var w = g.toDomCoords(g.xAxisRange()[1], null)[0] - xOffset; - - // This is computing the lowest pixel, effectively defining the height. - var h = g.toDomCoords(null, yar0[0])[1] - yOffset; - - // Percentage from the left. - var xPct = w === 0 ? 0 : (x / w); - // Percentage from the top. - var yPct = h === 0 ? 0 : (y / h); - - // The (1-) part below changes it from "% distance down from the top" - // to "% distance up from the bottom". - return [xPct, (1-yPct)]; - } + if (this.dimensions) { + this.data_url += "&dimensions=" + this.dimensions; + } - // Adjusts [x, y] toward each other by zoomInPercentage% - // Split it so the left/bottom axis gets xBias/yBias of that change and - // tight/top gets (1-xBias)/(1-yBias) of that change. - // - // If a bias is missing it splits it down the middle. - function zoomRange(g, zoomInPercentage, xBias, yBias) { - xBias = xBias || 0.5; - yBias = yBias || 0.5; - - function adjustAxis(axis, zoomInPercentage, bias) { - var delta = axis[1] - axis[0]; - var increment = delta * zoomInPercentage; - var foo = [increment * bias, increment * (1-bias)]; - - return [ axis[0] + foo[0], axis[1] - foo[1] ]; - } + if (NETDATA.options.debug.chart_data_url || this.debug) { + this.log('chartURL(): ' + this.data_url + ' WxH:' + this.chartWidth() + 'x' + this.chartHeight() + ' points: ' + data_points.toString() + ' library: ' + this.library_name); + } + }; - var yAxes = g.yAxisRanges(); - var newYAxes = []; - for (var i = 0; i < yAxes.length; i++) { - newYAxes[i] = adjustAxis(yAxes[i], zoomInPercentage, yBias); - } + this.redrawChart = function () { + if (this.data !== null) { + this.updateChartWithData(this.data); + } + }; - return adjustAxis(g.xAxisRange(), zoomInPercentage, xBias); - } + this.updateChartWithData = function (data) { + if (this.debug) { + this.log('updateChartWithData() called.'); + } - if(event.altKey || event.shiftKey) { - state.tmp.dygraph_user_action = true; + // this may force the chart to be re-created + resizeChart(); - NETDATA.globalSelectionSync.stop(); - NETDATA.globalSelectionSync.delay(); + this.data = data; - // http://dygraphs.com/gallery/interaction-api.js - var normal_def; - if(typeof event.wheelDelta === 'number' && !isNaN(event.wheelDelta)) - // chrome - normal_def = event.wheelDelta / 40; - else - // firefox - normal_def = event.deltaY * -1.2; + let started = Date.now(); + let view_update_every = data.view_update_every * 1000; - var normal = (event.detail) ? event.detail * -1 : normal_def; - var percentage = normal / 50; + if (this.data_update_every !== view_update_every) { + if (this.element_legend_childs.title_time) { + this.element_legend_childs.title_time.title = this.legendResolutionTooltip(); + } + } - if (!(event.offsetX && event.offsetY)){ - event.offsetX = event.layerX - event.target.offsetLeft; - event.offsetY = event.layerY - event.target.offsetTop; - } + // if the result is JSON, find the latest update-every + this.data_update_every = view_update_every; + this.data_after = data.after * 1000; + this.data_before = data.before * 1000; + this.netdata_first = data.first_entry * 1000; + this.netdata_last = data.last_entry * 1000; + this.data_points = data.points; - var percentages = offsetToPercentage(dygraph, event.offsetX, event.offsetY); - var xPct = percentages[0]; - var yPct = percentages[1]; + data.state = this; - var new_x_range = zoomRange(dygraph, percentage, xPct, yPct); - var after = new_x_range[0]; - var before = new_x_range[1]; + if (NETDATA.options.current.pan_and_zoom_data_padding && this.requested_padding !== null) { + if (this.view_after < this.data_after) { + // console.log('adjusting view_after from ' + this.view_after + ' to ' + this.data_after); + this.view_after = this.data_after; + } - var first = state.netdata_first + state.data_update_every; - var last = state.netdata_last + state.data_update_every; + if (this.view_before > this.data_before) { + // console.log('adjusting view_before from ' + this.view_before + ' to ' + this.data_before); + this.view_before = this.data_before; + } + } else { + this.view_after = this.data_after; + this.view_before = this.data_before; + } - if(before > last) { - after -= (before - last); - before = last; - } - if(after < first) { - after = first; - } + if (this.debug) { + this.log('UPDATE No ' + this.updates_counter + ' COMPLETED'); - state.setMode('zoom'); - state.updateChartPanOrZoom(after, before, function() { - dygraph.updateOptions({ dateWindow: [ after, before ] }); - }); + if (this.current.force_after_ms) { + this.log('STATUS: forced : ' + (this.current.force_after_ms / 1000).toString() + ' - ' + (this.current.force_before_ms / 1000).toString()); + } else { + this.log('STATUS: forced : unset'); + } - event.preventDefault(); - } - }, - touchstart: function(event, dygraph, context) { - state.tmp.dygraph_mouse_down = true; + this.log('STATUS: requested : ' + (this.requested_after / 1000).toString() + ' - ' + (this.requested_before / 1000).toString()); + this.log('STATUS: downloaded: ' + (this.data_after / 1000).toString() + ' - ' + (this.data_before / 1000).toString()); + this.log('STATUS: rendered : ' + (this.view_after / 1000).toString() + ' - ' + (this.view_before / 1000).toString()); + this.log('STATUS: points : ' + (this.data_points).toString()); + } - if(NETDATA.options.debug.dygraph === true || state.debug === true) - state.log('interactionModel.touchstart()'); + if (this.data_points === 0) { + noDataToShow(); + return; + } - state.tmp.dygraph_user_action = true; - state.setMode('zoom'); - state.pauseChart(); + if (this.updates_since_last_creation >= this.library.max_updates_to_recreate()) { + if (this.debug) { + this.log('max updates of ' + this.updates_since_last_creation.toString() + ' reached. Forcing re-generation.'); + } - NETDATA.globalSelectionSync.stop(); - NETDATA.globalSelectionSync.delay(); + init('force'); + return; + } - Dygraph.defaultInteractionModel.touchstart(event, dygraph, context); + // check and update the legend + this.legendUpdateDOM(); - // we overwrite the touch directions at the end, to overwrite - // the internal default of dygraph - context.touchDirections = { x: true, y: false }; + if (this.chart_created && typeof this.library.update === 'function') { + if (this.debug) { + this.log('updating chart...'); + } - state.dygraph_last_touch_start = Date.now(); - state.dygraph_last_touch_move = 0; + if (!callChartLibraryUpdateSafely(data)) { + return; + } + } else { + if (this.debug) { + this.log('creating chart...'); + } - if(typeof event.touches[0].pageX === 'number') - state.dygraph_last_touch_page_x = event.touches[0].pageX; - else - state.dygraph_last_touch_page_x = 0; - }, - touchmove: function(event, dygraph, context) { - if(NETDATA.options.debug.dygraph === true || state.debug === true) - state.log('interactionModel.touchmove()'); + if (!callChartLibraryCreateSafely(data)) { + return; + } + } - NETDATA.globalSelectionSync.stop(); - NETDATA.globalSelectionSync.delay(); + if (this.isVisible()) { + hideMessage(); + this.legendShowLatestValues(); + } else { + this.__redraw_on_unhide = true; - state.tmp.dygraph_user_action = true; - Dygraph.defaultInteractionModel.touchmove(event, dygraph, context); + if (this.debug) { + this.log("drawn while not visible"); + } + } - state.dygraph_last_touch_move = Date.now(); - }, - touchend: function(event, dygraph, context) { - state.tmp.dygraph_mouse_down = false; + if (this.selected) { + NETDATA.globalSelectionSync.stop(); + } - if(NETDATA.options.debug.dygraph === true || state.debug === true) - state.log('interactionModel.touchend()'); + // update the performance counters + let now = Date.now(); + this.tm.last_updated = now; - NETDATA.globalSelectionSync.stop(); - NETDATA.globalSelectionSync.delay(); + // don't update last_autorefreshed if this chart is + // forced to be updated with global PanAndZoom + if (NETDATA.globalPanAndZoom.isActive()) { + this.tm.last_autorefreshed = 0; + } else { + if (NETDATA.options.current.parallel_refresher && NETDATA.options.current.concurrent_refreshes && typeof this.force_update_every !== 'number') { + this.tm.last_autorefreshed = now - (now % this.data_update_every); + } else { + this.tm.last_autorefreshed = now; + } + } - state.tmp.dygraph_user_action = true; - Dygraph.defaultInteractionModel.touchend(event, dygraph, context); + this.refresh_dt_ms = now - started; + NETDATA.options.auto_refresher_fast_weight += this.refresh_dt_ms; - // if it didn't move, it is a selection - if(state.dygraph_last_touch_move === 0 && state.dygraph_last_touch_page_x !== 0) { - NETDATA.globalSelectionSync.dont_sync_before = 0; - NETDATA.globalSelectionSync.setMaster(state); + if (this.refresh_dt_element !== null) { + this.refresh_dt_element.innerText = this.refresh_dt_ms.toString(); + } - // internal api of dygraph - var pct = (state.dygraph_last_touch_page_x - (dygraph.plotter_.area.x + state.element.getBoundingClientRect().left)) / dygraph.plotter_.area.w; - console.log('pct: ' + pct.toString()); + if (this.foreignElementBefore !== null) { + this.foreignElementBefore.innerText = NETDATA.dateTime.localeDateString(this.view_before) + ' ' + NETDATA.dateTime.localeTimeString(this.view_before); + } - var t = Math.round(state.view_after + (state.view_before - state.view_after) * pct); - if(NETDATA.dygraphSetSelection(state, t) === true) { - NETDATA.globalSelectionSync.sync(state, t); - } - } + if (this.foreignElementAfter !== null) { + this.foreignElementAfter.innerText = NETDATA.dateTime.localeDateString(this.view_after) + ' ' + NETDATA.dateTime.localeTimeString(this.view_after); + } - // if it was double tap within double click time, reset the charts - var now = Date.now(); - if(typeof state.dygraph_last_touch_end !== 'undefined') { - if(state.dygraph_last_touch_move === 0) { - var dt = now - state.dygraph_last_touch_end; - if(dt <= NETDATA.options.current.double_click_speed) - NETDATA.resetAllCharts(state); - } - } + if (this.foreignElementDuration !== null) { + this.foreignElementDuration.innerText = NETDATA.seconds4human(Math.floor((this.view_before - this.view_after) / 1000) + 1); + } - // remember the timestamp of the last touch end - state.dygraph_last_touch_end = now; + if (this.foreignElementUpdateEvery !== null) { + this.foreignElementUpdateEvery.innerText = NETDATA.seconds4human(Math.floor(this.data_update_every / 1000)); + } + }; - // refresh all the charts immediately - NETDATA.options.auto_refresher_stop_until = 0; - } - } - }; + this.getSnapshotData = function (key) { + if (this.debug) { + this.log('updating from snapshot: ' + key); + } - if(NETDATA.chartLibraries.dygraph.isLogScale(state) === true) { - if(Array.isArray(state.tmp.dygraph_options.valueRange) && state.tmp.dygraph_options.valueRange[0] <= 0) - state.tmp.dygraph_options.valueRange[0] = null; + if (typeof netdataSnapshotData.data[key] === 'undefined') { + this.log('snapshot does not include data for key "' + key + '"'); + return null; } - if(NETDATA.chartLibraries.dygraph.isSparkline(state) === true) { - state.tmp.dygraph_options.drawGrid = false; - state.tmp.dygraph_options.drawAxis = false; - state.tmp.dygraph_options.title = undefined; - state.tmp.dygraph_options.ylabel = undefined; - state.tmp.dygraph_options.yLabelWidth = 0; - //state.tmp.dygraph_options.labelsDivWidth = 120; - //state.tmp.dygraph_options.labelsDivStyles.width = '120px'; - state.tmp.dygraph_options.labelsSeparateLines = true; - state.tmp.dygraph_options.rightGap = 0; - state.tmp.dygraph_options.yRangePad = 1; - state.tmp.dygraph_options.axes.x.drawAxis = false; - state.tmp.dygraph_options.axes.y.drawAxis = false; + if (typeof netdataSnapshotData.data[key] !== 'string') { + this.log('snapshot data for key "' + key + '" is not string'); + return null; } - if(smooth === true) { - state.tmp.dygraph_smooth_eligible = true; + let uncompressed; + try { + uncompressed = netdataSnapshotData.uncompress(netdataSnapshotData.data[key]); + + if (uncompressed === null) { + this.log('uncompressed snapshot data for key ' + key + ' is null'); + return null; + } + + if (typeof uncompressed === 'undefined') { + this.log('uncompressed snapshot data for key ' + key + ' is undefined'); + return null; + } + } catch (e) { + this.log('decompression of snapshot data for key ' + key + ' failed'); + console.log(e); + uncompressed = null; + } - if(NETDATA.options.current.smooth_plot === true) - state.tmp.dygraph_options.plotter = smoothPlotter; + if (typeof uncompressed !== 'string') { + this.log('uncompressed snapshot data for key ' + key + ' is not string'); + return null; } - else state.tmp.dygraph_smooth_eligible = false; - if(netdataSnapshotData !== null && NETDATA.globalPanAndZoom.isActive() === true && NETDATA.globalPanAndZoom.isMaster(state) === false) { - // pan and zoom on snapshots - state.tmp.dygraph_options.dateWindow = [ NETDATA.globalPanAndZoom.force_after_ms, NETDATA.globalPanAndZoom.force_before_ms ]; - //state.tmp.dygraph_options.isZoomedIgnoreProgrammaticZoom = true; + let data; + try { + data = JSON.parse(uncompressed); + } catch (e) { + this.log('parsing snapshot data for key ' + key + ' failed'); + console.log(e); + data = null; } - state.tmp.dygraph_instance = new Dygraph(state.element_chart, - data.result.data, state.tmp.dygraph_options); + return data; + }; - state.tmp.dygraph_force_zoom = false; - state.tmp.dygraph_user_action = false; - state.tmp.dygraph_last_rendered = Date.now(); - state.tmp.dygraph_highlight_after = null; + this.updateChart = function (callback) { + if (this.debug) { + this.log('updateChart()'); + } - if(state.tmp.dygraph_options.valueRange[0] === null && state.tmp.dygraph_options.valueRange[1] === null) { - if (typeof state.tmp.dygraph_instance.axes_[0].extremeRange !== 'undefined') { - state.tmp.__commonMin = NETDATA.dataAttribute(state.element, 'common-min', null); - state.tmp.__commonMax = NETDATA.dataAttribute(state.element, 'common-max', null); + if (this.fetching_data) { + if (this.debug) { + this.log('updateChart(): I am already updating...'); } - else { - state.log('incompatible version of Dygraph detected'); - state.tmp.__commonMin = null; - state.tmp.__commonMax = null; + + if (typeof callback === 'function') { + return callback(false, 'already running'); } - } - else { - // if the user gave a valueRange, respect it - state.tmp.__commonMin = null; - state.tmp.__commonMax = null; + + return; } - return true; - }; + // due to late initialization of charts and libraries + // we need to check this too + if (!this.enabled) { + if (this.debug) { + this.log('updateChart(): I am not enabled'); + } - // ---------------------------------------------------------------------------------------------------------------- - // morris + if (typeof callback === 'function') { + return callback(false, 'not enabled'); + } - NETDATA.morrisInitialize = function(callback) { - if(typeof netdataNoMorris === 'undefined' || !netdataNoMorris) { + return; + } - // morris requires raphael - if(!NETDATA.chartLibraries.raphael.initialized) { - if(NETDATA.chartLibraries.raphael.enabled) { - NETDATA.raphaelInitialize(function() { - NETDATA.morrisInitialize(callback); - }); - } - else { - NETDATA.chartLibraries.morris.enabled = false; - if(typeof callback === "function") - return callback(); - } + if (!canBeRendered()) { + if (this.debug) { + this.log('updateChart(): cannot be rendered'); } - else { - NETDATA._loadCSS(NETDATA.morris_css); - $.ajax({ - url: NETDATA.morris_js, - cache: true, - dataType: "script", - xhrFields: { withCredentials: true } // required for the cookie - }) - .done(function() { - NETDATA.registerChartLibrary('morris', NETDATA.morris_js); - }) - .fail(function() { - NETDATA.chartLibraries.morris.enabled = false; - NETDATA.error(100, NETDATA.morris_js); - }) - .always(function() { - if(typeof callback === "function") - return callback(); - }); + if (typeof callback === 'function') { + return callback(false, 'cannot be rendered'); } + + return; } - else { - NETDATA.chartLibraries.morris.enabled = false; - if(typeof callback === "function") - return callback(); - } - }; - NETDATA.morrisChartUpdate = function(state, data) { - state.morris_instance.setData(data.result.data); - return true; - }; + if (that.dom_created !== true) { + if (this.debug) { + this.log('updateChart(): creating DOM'); + } - NETDATA.morrisChartCreate = function(state, data) { - - state.morris_options = { - element: state.element_chart.id, - data: data.result.data, - xkey: 'time', - ykeys: data.dimension_names, - labels: data.dimension_names, - lineWidth: 2, - pointSize: 3, - smooth: true, - hideHover: 'auto', - parseTime: true, - continuousLine: false, - behaveLikeLine: false - }; + createDOM(); + } - if(state.chart.chart_type === 'line') - state.morris_instance = new Morris.Line(state.morris_options); + if (this.chart === null) { + if (this.debug) { + this.log('updateChart(): getting chart'); + } - else if(state.chart.chart_type === 'area') { - state.morris_options.behaveLikeLine = true; - state.morris_instance = new Morris.Area(state.morris_options); + return this.getChart(function () { + return that.updateChart(callback); + }); } - else // stacked - state.morris_instance = new Morris.Area(state.morris_options); - return true; - }; + if (!this.library.initialized) { + if (this.library.enabled) { + if (this.debug) { + this.log('updateChart(): initializing chart library'); + } - // ---------------------------------------------------------------------------------------------------------------- - // raphael + return this.library.initialize(function () { + return that.updateChart(callback); + }); + } else { + error('chart library "' + this.library_name + '" is not available.'); - NETDATA.raphaelInitialize = function(callback) { - if(typeof netdataStopRaphael === 'undefined' || !netdataStopRaphael) { - $.ajax({ - url: NETDATA.raphael_js, - cache: true, - dataType: "script", - xhrFields: { withCredentials: true } // required for the cookie - }) - .done(function() { - NETDATA.registerChartLibrary('raphael', NETDATA.raphael_js); - }) - .fail(function() { - NETDATA.chartLibraries.raphael.enabled = false; - NETDATA.error(100, NETDATA.raphael_js); - }) - .always(function() { - if(typeof callback === "function") - return callback(); - }); - } - else { - NETDATA.chartLibraries.raphael.enabled = false; - if(typeof callback === "function") - return callback(); + if (typeof callback === 'function') { + return callback(false, 'library not available'); + } + + return; + } } - }; - NETDATA.raphaelChartUpdate = function(state, data) { - $(state.element_chart).raphael(data.result, { - width: state.chartWidth(), - height: state.chartHeight() - }); + this.clearSelection(); + this.chartURL(); - return false; - }; + NETDATA.statistics.refreshes_total++; + NETDATA.statistics.refreshes_active++; - NETDATA.raphaelChartCreate = function(state, data) { - $(state.element_chart).raphael(data.result, { - width: state.chartWidth(), - height: state.chartHeight() - }); + if (NETDATA.statistics.refreshes_active > NETDATA.statistics.refreshes_active_max) { + NETDATA.statistics.refreshes_active_max = NETDATA.statistics.refreshes_active; + } - return false; - }; + let ok = false; + this.fetching_data = true; - // ---------------------------------------------------------------------------------------------------------------- - // C3 + if (netdataSnapshotData !== null) { + let key = this.chartDataUniqueID(); + let data = this.getSnapshotData(key); + if (data !== null) { + ok = true; + data = NETDATA.xss.checkData('/api/v1/data', data, this.library.xssRegexIgnore); + this.updateChartWithData(data); + } else { + ok = false; + error('cannot get data from snapshot for key: "' + key + '"'); + that.tm.last_autorefreshed = Date.now(); + } - NETDATA.c3Initialize = function(callback) { - if(typeof netdataNoC3 === 'undefined' || !netdataNoC3) { + NETDATA.statistics.refreshes_active--; + this.fetching_data = false; - // C3 requires D3 - if(!NETDATA.chartLibraries.d3.initialized) { - if(NETDATA.chartLibraries.d3.enabled) { - NETDATA.d3Initialize(function() { - NETDATA.c3Initialize(callback); - }); - } - else { - NETDATA.chartLibraries.c3.enabled = false; - if(typeof callback === "function") - return callback(); - } + if (typeof callback === 'function') { + callback(ok, 'snapshot'); } - else { - NETDATA._loadCSS(NETDATA.c3_css); - $.ajax({ - url: NETDATA.c3_js, - cache: true, - dataType: "script", - xhrFields: { withCredentials: true } // required for the cookie - }) - .done(function() { - NETDATA.registerChartLibrary('c3', NETDATA.c3_js); - }) - .fail(function() { - NETDATA.chartLibraries.c3.enabled = false; - NETDATA.error(100, NETDATA.c3_js); - }) - .always(function() { - if(typeof callback === "function") - return callback(); - }); - } - } - else { - NETDATA.chartLibraries.c3.enabled = false; - if(typeof callback === "function") - return callback(); + return; } - }; - NETDATA.c3ChartUpdate = function(state, data) { - state.c3_instance.destroy(); - return NETDATA.c3ChartCreate(state, data); + if (this.debug) { + this.log('updating from ' + this.data_url); + } - //state.c3_instance.load({ - // rows: data.result, - // unload: true - //}); + this.xhr = $.ajax({ + url: this.data_url, + cache: false, + async: true, + headers: { + 'Cache-Control': 'no-cache, no-store', + 'Pragma': 'no-cache' + }, + xhrFields: {withCredentials: true} // required for the cookie + }) + .done(function (data) { + data = NETDATA.xss.checkData('/api/v1/data', data, that.library.xssRegexIgnore); - //return true; - }; + that.xhr = undefined; + that.retries_on_data_failures = 0; + ok = true; - NETDATA.c3ChartCreate = function(state, data) { + if (that.debug) { + that.log('data received. updating chart.'); + } - state.element_chart.id = 'c3-' + state.uuid; - // console.log('id = ' + state.element_chart.id); + that.updateChartWithData(data); + }) + .fail(function (msg) { + that.xhr = undefined; - state.c3_instance = c3.generate({ - bindto: '#' + state.element_chart.id, - size: { - width: state.chartWidth(), - height: state.chartHeight() - }, - color: { - pattern: state.chartColors() - }, - data: { - x: 'time', - rows: data.result, - type: (state.chart.chart_type === 'line')?'spline':'area-spline' - }, - axis: { - x: { - type: 'timeseries', - tick: { - format: function(x) { - return NETDATA.dateTime.xAxisTimeString(x); - } + if (msg.statusText !== 'abort') { + that.retries_on_data_failures++; + if (that.retries_on_data_failures > NETDATA.options.current.retries_on_data_failures) { + // that.log('failed ' + that.retries_on_data_failures.toString() + ' times - giving up'); + that.retries_on_data_failures = 0; + error('data download failed for url: ' + that.data_url); + } + else { + that.tm.last_autorefreshed = Date.now(); + // that.log('failed ' + that.retries_on_data_failures.toString() + ' times, but I will retry'); } } - }, - grid: { - x: { - show: true - }, - y: { - show: true - } - }, - point: { - show: false - }, - line: { - connectNull: false - }, - transition: { - duration: 0 - }, - interaction: { - enabled: true - } - }); + }) + .always(function () { + that.xhr = undefined; - // console.log(state.c3_instance); + NETDATA.statistics.refreshes_active--; + that.fetching_data = false; - return true; + if (typeof callback === 'function') { + return callback(ok, 'download'); + } + }); }; - // ---------------------------------------------------------------------------------------------------------------- - // d3pie + const __isVisible = function () { + let ret = true; - NETDATA.d3pieInitialize = function(callback) { - if(typeof netdataNoD3pie === 'undefined' || !netdataNoD3pie) { + if (NETDATA.options.current.update_only_visible !== false) { + // tolerance is the number of pixels a chart can be off-screen + // to consider it as visible and refresh it as if was visible + let tolerance = 0; - // d3pie requires D3 - if(!NETDATA.chartLibraries.d3.initialized) { - if(NETDATA.chartLibraries.d3.enabled) { - NETDATA.d3Initialize(function() { - NETDATA.d3pieInitialize(callback); - }); - } - else { - NETDATA.chartLibraries.d3pie.enabled = false; - if(typeof callback === "function") - return callback(); - } - } - else { - $.ajax({ - url: NETDATA.d3pie_js, - cache: true, - dataType: "script", - xhrFields: { withCredentials: true } // required for the cookie - }) - .done(function() { - NETDATA.registerChartLibrary('d3pie', NETDATA.d3pie_js); - }) - .fail(function() { - NETDATA.chartLibraries.d3pie.enabled = false; - NETDATA.error(100, NETDATA.d3pie_js); - }) - .always(function() { - if(typeof callback === "function") - return callback(); - }); - } + that.tm.last_visible_check = Date.now(); + + let rect = that.element.getBoundingClientRect(); + + let screenTop = window.scrollY; + let screenBottom = screenTop + window.innerHeight; + + let chartTop = rect.top + screenTop; + let chartBottom = chartTop + rect.height; + + ret = !(rect.width === 0 || rect.height === 0 || chartBottom + tolerance < screenTop || chartTop - tolerance > screenBottom); } - else { - NETDATA.chartLibraries.d3pie.enabled = false; - if(typeof callback === "function") - return callback(); + + if (that.debug) { + that.log('__isVisible(): ' + ret); } + + return ret; }; - NETDATA.d3pieSetContent = function(state, data, index) { - state.legendFormatValueDecimalsFromMinMax( - data.min, - data.max - ); + this.isVisible = function (nocache) { + // this.log('last_visible_check: ' + this.tm.last_visible_check + ', last_page_scroll: ' + NETDATA.options.last_page_scroll); - var content = []; - var colors = state.chartColors(); - var len = data.result.labels.length; - for(var i = 1; i < len ; i++) { - var label = data.result.labels[i]; - var value = data.result.data[index][label]; - var color = colors[i - 1]; - - if(value !== null && value > 0) { - content.push({ - label: label, - value: value, - color: color - }); + // caching - we do not evaluate the charts visibility + // if the page has not been scrolled since the last check + if ((typeof nocache !== 'undefined' && nocache) + || typeof this.tmp.___isVisible___ === 'undefined' + || this.tm.last_visible_check <= NETDATA.options.last_page_scroll) { + this.tmp.___isVisible___ = __isVisible(); + if (this.tmp.___isVisible___) { + this.unhideChart(); + } else { + this.hideChart(); } } - if(content.length === 0) - content.push({ - label: 'no data', - value: 100, - color: '#666666' - }); + if (this.debug) { + this.log('isVisible(' + nocache + '): ' + this.tmp.___isVisible___); + } - state.tmp.d3pie_last_slot = index; - return content; + return this.tmp.___isVisible___; }; - NETDATA.d3pieDateRange = function(state, data, index) { - var dt = Math.round((data.before - data.after + 1) / data.points); - var dt_str = NETDATA.seconds4human(dt); + this.isAutoRefreshable = function () { + return (this.current.autorefresh); + }; - var before = data.result.data[index].time; - var after = before - (dt * 1000); + this.canBeAutoRefreshed = function () { + if (!this.enabled) { + if (this.debug) { + this.log('canBeAutoRefreshed() -> not enabled'); + } - var d1 = NETDATA.dateTime.localeDateString(after); - var t1 = NETDATA.dateTime.localeTimeString(after); - var d2 = NETDATA.dateTime.localeDateString(before); - var t2 = NETDATA.dateTime.localeTimeString(before); + return false; + } - if(d1 === d2) - return d1 + ' ' + t1 + ' to ' + t2 + ', ' + dt_str; + if (this.running) { + if (this.debug) { + this.log('canBeAutoRefreshed() -> already running'); + } - return d1 + ' ' + t1 + ' to ' + d2 + ' ' + t2 + ', ' + dt_str; - }; + return false; + } - NETDATA.d3pieSetSelection = function(state, t) { - if(state.timeIsVisible(t) !== true) - return NETDATA.d3pieClearSelection(state, true); + if (this.library === null || this.library.enabled === false) { + error('charting library "' + this.library_name + '" is not available'); + if (this.debug) { + this.log('canBeAutoRefreshed() -> chart library ' + this.library_name + ' is not available'); + } - var slot = state.calculateRowForTime(t); - slot = state.data.result.data.length - slot - 1; + return false; + } - if(slot < 0 || slot >= state.data.result.length) - return NETDATA.d3pieClearSelection(state, true); + if (!this.isVisible()) { + if (NETDATA.options.debug.visibility || this.debug) { + this.log('canBeAutoRefreshed() -> not visible'); + } - if(state.tmp.d3pie_last_slot === slot) { - // we already show this slot, don't do anything - return true; + return false; } - if(state.tmp.d3pie_timer === undefined) { - state.tmp.d3pie_timer = NETDATA.timeout.set(function() { - state.tmp.d3pie_timer = undefined; - NETDATA.d3pieChange(state, NETDATA.d3pieSetContent(state, state.data, slot), NETDATA.d3pieDateRange(state, state.data, slot)); - }, 0); - } + let now = Date.now(); - return true; - }; + if (this.current.force_update_at !== 0 && this.current.force_update_at < now) { + if (this.debug) { + this.log('canBeAutoRefreshed() -> timed force update - allowing this update'); + } - NETDATA.d3pieClearSelection = function(state, force) { - if(typeof state.tmp.d3pie_timer !== 'undefined') { - NETDATA.timeout.clear(state.tmp.d3pie_timer); - state.tmp.d3pie_timer = undefined; + this.current.force_update_at = 0; + return true; } - if(state.isAutoRefreshable() === true && state.data !== null && force !== true) { - NETDATA.d3pieChartUpdate(state, state.data); + if (!this.isAutoRefreshable()) { + if (this.debug) { + this.log('canBeAutoRefreshed() -> not auto-refreshable'); + } + + return false; } - else { - if(state.tmp.d3pie_last_slot !== -1) { - state.tmp.d3pie_last_slot = -1; - NETDATA.d3pieChange(state, [{label: 'no data', value: 1, color: '#666666'}], 'no data available'); + + // allow the first update, even if the page is not visible + if (NETDATA.options.page_is_visible === false && this.updates_counter && this.updates_since_last_unhide) { + if (NETDATA.options.debug.focus || this.debug) { + this.log('canBeAutoRefreshed() -> not the first update, and page does not have focus'); } + + return false; } - return true; - }; + if (this.needsRecreation()) { + if (this.debug) { + this.log('canBeAutoRefreshed() -> needs re-creation.'); + } - NETDATA.d3pieChange = function(state, content, footer) { - if(state.d3pie_forced_subtitle === null) { - //state.d3pie_instance.updateProp("header.subtitle.text", state.units_current); - state.d3pie_instance.options.header.subtitle.text = state.units_current; + return true; } - if(state.d3pie_forced_footer === null) { - //state.d3pie_instance.updateProp("footer.text", footer); - state.d3pie_instance.options.footer.text = footer; + if (NETDATA.options.auto_refresher_stop_until >= now) { + if (this.debug) { + this.log('canBeAutoRefreshed() -> stopped until is in future.'); + } + + return false; } - //state.d3pie_instance.updateProp("data.content", content); - state.d3pie_instance.options.data.content = content; - state.d3pie_instance.destroy(); - state.d3pie_instance.recreate(); - return true; - }; + // options valid only for autoRefresh() + if (NETDATA.globalPanAndZoom.isActive()) { + if (NETDATA.globalPanAndZoom.shouldBeAutoRefreshed(this)) { + if (this.debug) { + this.log('canBeAutoRefreshed(): global panning: I need an update.'); + } - NETDATA.d3pieChartUpdate = function(state, data) { - return NETDATA.d3pieChange(state, NETDATA.d3pieSetContent(state, data, 0), NETDATA.d3pieDateRange(state, data, 0)); - }; + return true; + } + else { + if (this.debug) { + this.log('canBeAutoRefreshed(): global panning: I am already up to date.'); + } - NETDATA.d3pieChartCreate = function(state, data) { + return false; + } + } - state.element_chart.id = 'd3pie-' + state.uuid; - // console.log('id = ' + state.element_chart.id); + if (this.selected) { + if (this.debug) { + this.log('canBeAutoRefreshed(): I have a selection in place.'); + } - var content = NETDATA.d3pieSetContent(state, data, 0); + return false; + } - state.d3pie_forced_title = NETDATA.dataAttribute(state.element, 'd3pie-title', null); - state.d3pie_forced_subtitle = NETDATA.dataAttribute(state.element, 'd3pie-subtitle', null); - state.d3pie_forced_footer = NETDATA.dataAttribute(state.element, 'd3pie-footer', null); + if (this.paused) { + if (this.debug) { + this.log('canBeAutoRefreshed(): I am paused.'); + } - state.d3pie_options = { - header: { - title: { - text: (state.d3pie_forced_title !== null) ? state.d3pie_forced_title : state.title, - color: NETDATA.dataAttribute(state.element, 'd3pie-title-color', NETDATA.themes.current.d3pie.title), - fontSize: NETDATA.dataAttribute(state.element, 'd3pie-title-fontsize', 12), - fontWeight: NETDATA.dataAttribute(state.element, 'd3pie-title-fontweight', "bold"), - font: NETDATA.dataAttribute(state.element, 'd3pie-title-font', "arial") - }, - subtitle: { - text: (state.d3pie_forced_subtitle !== null) ? state.d3pie_forced_subtitle : state.units_current, - color: NETDATA.dataAttribute(state.element, 'd3pie-subtitle-color', NETDATA.themes.current.d3pie.subtitle), - fontSize: NETDATA.dataAttribute(state.element, 'd3pie-subtitle-fontsize', 10), - fontWeight: NETDATA.dataAttribute(state.element, 'd3pie-subtitle-fontweight', "normal"), - font: NETDATA.dataAttribute(state.element, 'd3pie-subtitle-font', "arial") - }, - titleSubtitlePadding: 1 - }, - footer: { - text: (state.d3pie_forced_footer !== null) ? state.d3pie_forced_footer : NETDATA.d3pieDateRange(state, data, 0), - color: NETDATA.dataAttribute(state.element, 'd3pie-footer-color', NETDATA.themes.current.d3pie.footer), - fontSize: NETDATA.dataAttribute(state.element, 'd3pie-footer-fontsize', 9), - fontWeight: NETDATA.dataAttribute(state.element, 'd3pie-footer-fontweight', "bold"), - font: NETDATA.dataAttribute(state.element, 'd3pie-footer-font', "arial"), - location: NETDATA.dataAttribute(state.element, 'd3pie-footer-location', "bottom-center") // bottom-left, bottom-center, bottom-right - }, - size: { - canvasHeight: state.chartHeight(), - canvasWidth: state.chartWidth(), - pieInnerRadius: NETDATA.dataAttribute(state.element, 'd3pie-pieinnerradius', "45%"), - pieOuterRadius: NETDATA.dataAttribute(state.element, 'd3pie-pieouterradius', "80%") - }, - data: { - // none, random, value-asc, value-desc, label-asc, label-desc - sortOrder: NETDATA.dataAttribute(state.element, 'd3pie-sortorder', "value-desc"), - smallSegmentGrouping: { - enabled: NETDATA.dataAttributeBoolean(state.element, "d3pie-smallsegmentgrouping-enabled", false), - value: NETDATA.dataAttribute(state.element, 'd3pie-smallsegmentgrouping-value', 1), - // percentage, value - valueType: NETDATA.dataAttribute(state.element, 'd3pie-smallsegmentgrouping-valuetype', "percentage"), - label: NETDATA.dataAttribute(state.element, 'd3pie-smallsegmentgrouping-label', "other"), - color: NETDATA.dataAttribute(state.element, 'd3pie-smallsegmentgrouping-color', NETDATA.themes.current.d3pie.other) - }, + return false; + } - // REQUIRED! This is where you enter your pie data; it needs to be an array of objects - // of this form: { label: "label", value: 1.5, color: "#000000" } - color is optional - content: content - }, - labels: { - outer: { - // label, value, percentage, label-value1, label-value2, label-percentage1, label-percentage2 - format: NETDATA.dataAttribute(state.element, 'd3pie-labels-outer-format', "label-value1"), - hideWhenLessThanPercentage: NETDATA.dataAttribute(state.element, 'd3pie-labels-outer-hidewhenlessthanpercentage', null), - pieDistance: NETDATA.dataAttribute(state.element, 'd3pie-labels-outer-piedistance', 15) - }, - inner: { - // label, value, percentage, label-value1, label-value2, label-percentage1, label-percentage2 - format: NETDATA.dataAttribute(state.element, 'd3pie-labels-inner-format', "percentage"), - hideWhenLessThanPercentage: NETDATA.dataAttribute(state.element, 'd3pie-labels-inner-hidewhenlessthanpercentage', 2) - }, - mainLabel: { - color: NETDATA.dataAttribute(state.element, 'd3pie-labels-mainLabel-color', NETDATA.themes.current.d3pie.mainlabel), // or 'segment' for dynamic color - font: NETDATA.dataAttribute(state.element, 'd3pie-labels-mainLabel-font', "arial"), - fontSize: NETDATA.dataAttribute(state.element, 'd3pie-labels-mainLabel-fontsize', 10), - fontWeight: NETDATA.dataAttribute(state.element, 'd3pie-labels-mainLabel-fontweight', "normal") - }, - percentage: { - color: NETDATA.dataAttribute(state.element, 'd3pie-labels-percentage-color', NETDATA.themes.current.d3pie.percentage), - font: NETDATA.dataAttribute(state.element, 'd3pie-labels-percentage-font', "arial"), - fontSize: NETDATA.dataAttribute(state.element, 'd3pie-labels-percentage-fontsize', 10), - fontWeight: NETDATA.dataAttribute(state.element, 'd3pie-labels-percentage-fontweight', "bold"), - decimalPlaces: 0 - }, - value: { - color: NETDATA.dataAttribute(state.element, 'd3pie-labels-value-color', NETDATA.themes.current.d3pie.value), - font: NETDATA.dataAttribute(state.element, 'd3pie-labels-value-font', "arial"), - fontSize: NETDATA.dataAttribute(state.element, 'd3pie-labels-value-fontsize', 10), - fontWeight: NETDATA.dataAttribute(state.element, 'd3pie-labels-value-fontweight', "bold") - }, - lines: { - enabled: NETDATA.dataAttributeBoolean(state.element, 'd3pie-labels-lines-enabled', true), - style: NETDATA.dataAttribute(state.element, 'd3pie-labels-lines-style', "curved"), - color: NETDATA.dataAttribute(state.element, 'd3pie-labels-lines-color', "segment") // "segment" or a hex color - }, - truncation: { - enabled: NETDATA.dataAttributeBoolean(state.element, 'd3pie-labels-truncation-enabled', false), - truncateLength: NETDATA.dataAttribute(state.element, 'd3pie-labels-truncation-truncatelength', 30) - }, - formatter: function(context) { - // console.log(context); - if(context.part === 'value') - return state.legendFormatValue(context.value); - if(context.part === 'percentage') - return context.label + '%'; + let data_update_every = this.data_update_every; + if (typeof this.force_update_every === 'number') { + data_update_every = this.force_update_every; + } - return context.label; - } - }, - effects: { - load: { - effect: "none", // none / default - speed: 0 // commented in the d3pie code to speed it up - }, - pullOutSegmentOnClick: { - effect: "bounce", // none / linear / bounce / elastic / back - speed: 400, - size: 5 - }, - highlightSegmentOnMouseover: true, - highlightLuminosity: -0.2 - }, - tooltips: { - enabled: false, - type: "placeholder", // caption|placeholder - string: "", - placeholderParser: null, // function - styles: { - fadeInSpeed: 250, - backgroundColor: NETDATA.themes.current.d3pie.tooltip_bg, - backgroundOpacity: 0.5, - color: NETDATA.themes.current.d3pie.tooltip_fg, - borderRadius: 2, - font: "arial", - fontSize: 12, - padding: 4 - } - }, - misc: { - colors: { - background: 'transparent', // transparent or color # - // segments: state.chartColors(), - segmentStroke: NETDATA.dataAttribute(state.element, 'd3pie-misc-colors-segmentstroke', NETDATA.themes.current.d3pie.segment_stroke) - }, - gradient: { - enabled: NETDATA.dataAttributeBoolean(state.element, 'd3pie-misc-gradient-enabled', false), - percentage: NETDATA.dataAttribute(state.element, 'd3pie-misc-colors-percentage', 95), - color: NETDATA.dataAttribute(state.element, 'd3pie-misc-gradient-color', NETDATA.themes.current.d3pie.gradient_color) - }, - canvasPadding: { - top: 5, - right: 5, - bottom: 5, - left: 5 - }, - pieCenterOffset: { - x: 0, - y: 0 - }, - cssPrefix: NETDATA.dataAttribute(state.element, 'd3pie-cssprefix', null) - }, - callbacks: { - onload: null, - onMouseoverSegment: null, - onMouseoutSegment: null, - onClickSegment: null + if (now - this.tm.last_autorefreshed >= data_update_every) { + if (this.debug) { + this.log('canBeAutoRefreshed(): It is time to update me. Now: ' + now.toString() + ', last_autorefreshed: ' + this.tm.last_autorefreshed + ', data_update_every: ' + data_update_every + ', delta: ' + (now - this.tm.last_autorefreshed).toString()); } - }; - state.d3pie_instance = new d3pie(state.element_chart, state.d3pie_options); - return true; + return true; + } + + return false; }; - // ---------------------------------------------------------------------------------------------------------------- - // D3 + this.autoRefresh = function (callback) { + let state = that; - NETDATA.d3Initialize = function(callback) { - if(typeof netdataStopD3 === 'undefined' || !netdataStopD3) { - $.ajax({ - url: NETDATA.d3_js, - cache: true, - dataType: "script", - xhrFields: { withCredentials: true } // required for the cookie - }) - .done(function() { - NETDATA.registerChartLibrary('d3', NETDATA.d3_js); - }) - .fail(function() { - NETDATA.chartLibraries.d3.enabled = false; - NETDATA.error(100, NETDATA.d3_js); - }) - .always(function() { - if(typeof callback === "function") + if (state.canBeAutoRefreshed() && state.running === false) { + state.running = true; + state.updateChart(function () { + state.running = false; + + if (typeof callback === 'function') { return callback(); + } }); - } - else { - NETDATA.chartLibraries.d3.enabled = false; - if(typeof callback === "function") + } else { + if (typeof callback === 'function') { return callback(); + } } }; - NETDATA.d3ChartUpdate = function(state, data) { - void(state); - void(data); + this.__defaultsFromDownloadedChart = function (chart) { + this.chart = chart; + this.chart_url = chart.url; + this.data_update_every = chart.update_every * 1000; + this.data_points = Math.round(this.chartWidth() / this.chartPixelsPerPoint()); + this.tm.last_info_downloaded = Date.now(); - return false; + if (this.title === null) { + this.title = chart.title; + } + + if (this.units === null) { + this.units = chart.units; + this.units_current = this.units; + } }; - NETDATA.d3ChartCreate = function(state, data) { - void(state); - void(data); + // fetch the chart description from the netdata server + this.getChart = function (callback) { + this.chart = NETDATA.chartRegistry.get(this.host, this.id); + if (this.chart) { + this.__defaultsFromDownloadedChart(this.chart); - return false; - }; + if (typeof callback === 'function') { + return callback(); + } + } else if (netdataSnapshotData !== null) { + // console.log(this); + // console.log(NETDATA.chartRegistry); + NETDATA.error(404, 'host: ' + this.host + ', chart: ' + this.id); + error('chart not found in snapshot'); - // ---------------------------------------------------------------------------------------------------------------- - // google charts + if (typeof callback === 'function') { + return callback(); + } + } else { + this.chart_url = "/api/v1/chart?chart=" + this.id; + + if (this.debug) { + this.log('downloading ' + this.chart_url); + } - NETDATA.googleInitialize = function(callback) { - if(typeof netdataNoGoogleCharts === 'undefined' || !netdataNoGoogleCharts) { $.ajax({ - url: NETDATA.google_js, - cache: true, - dataType: "script", - xhrFields: { withCredentials: true } // required for the cookie + url: this.host + this.chart_url, + cache: false, + async: true, + xhrFields: {withCredentials: true} // required for the cookie }) - .done(function() { - NETDATA.registerChartLibrary('google', NETDATA.google_js); - google.load('visualization', '1.1', { - 'packages': ['corechart', 'controls'], - 'callback': callback + .done(function (chart) { + chart = NETDATA.xss.checkOptional('/api/v1/chart', chart); + + chart.url = that.chart_url; + that.__defaultsFromDownloadedChart(chart); + NETDATA.chartRegistry.add(that.host, that.id, chart); + }) + .fail(function () { + NETDATA.error(404, that.chart_url); + error('chart not found on url "' + that.chart_url + '"'); + }) + .always(function () { + if (typeof callback === 'function') { + return callback(); + } }); - }) - .fail(function() { - NETDATA.chartLibraries.google.enabled = false; - NETDATA.error(100, NETDATA.google_js); - if(typeof callback === "function") - return callback(); - }); - } - else { - NETDATA.chartLibraries.google.enabled = false; - if(typeof callback === "function") - return callback(); } }; - NETDATA.googleChartUpdate = function(state, data) { - var datatable = new google.visualization.DataTable(data.result); - state.google_instance.draw(datatable, state.google_options); - return true; - }; + // ============================================================================================================ + // INITIALIZATION - NETDATA.googleChartCreate = function(state, data) { - var datatable = new google.visualization.DataTable(data.result); + initDOM(); + init('fast'); +}; - state.google_options = { - colors: state.chartColors(), +NETDATA.resetAllCharts = function (state) { + // first clear the global selection sync + // to make sure no chart is in selected state + NETDATA.globalSelectionSync.stop(); - // do not set width, height - the chart resizes itself - //width: state.chartWidth(), - //height: state.chartHeight(), - lineWidth: 1, - title: state.title, - fontSize: 11, - hAxis: { - // title: "Time of Day", - // format:'HH:mm:ss', - viewWindowMode: 'maximized', - slantedText: false, - format:'HH:mm:ss', - textStyle: { - fontSize: 9 - }, - gridlines: { - color: '#EEE' - } - }, - vAxis: { - title: state.units_current, - viewWindowMode: 'pretty', - minValue: -0.1, - maxValue: 0.1, - direction: 1, - textStyle: { - fontSize: 9 - }, - gridlines: { - color: '#EEE' - } - }, - chartArea: { - width: '65%', - height: '80%' - }, - focusTarget: 'category', - annotation: { - '1': { - style: 'line' - } - }, - pointsVisible: 0, - titlePosition: 'out', - titleTextStyle: { - fontSize: 11 - }, - tooltip: { - isHtml: false, - ignoreBounds: true, - textStyle: { - fontSize: 9 - } - }, - curveType: 'function', - areaOpacity: 0.3, - isStacked: false - }; + // there are 2 possibilities here + // a. state is the global Pan and Zoom master + // b. state is not the global Pan and Zoom master - switch(state.chart.chart_type) { - case "area": - state.google_options.vAxis.viewWindowMode = 'maximized'; - state.google_options.areaOpacity = NETDATA.options.current.color_fill_opacity_area; - state.google_instance = new google.visualization.AreaChart(state.element_chart); - break; + // let master = true; + // if (NETDATA.globalPanAndZoom.isMaster(state) === false) { + // master = false; + // } + const master = NETDATA.globalPanAndZoom.isMaster(state) - case "stacked": - state.google_options.isStacked = true; - state.google_options.areaOpacity = NETDATA.options.current.color_fill_opacity_stacked; - state.google_options.vAxis.viewWindowMode = 'maximized'; - state.google_options.vAxis.minValue = null; - state.google_options.vAxis.maxValue = null; - state.google_instance = new google.visualization.AreaChart(state.element_chart); - break; + // clear the global Pan and Zoom + // this will also refresh the master + // and unblock any charts currently mirroring the master + NETDATA.globalPanAndZoom.clearMaster(); - default: - case "line": - state.google_options.lineWidth = 2; - state.google_instance = new google.visualization.LineChart(state.element_chart); - break; - } + // if we were not the master, reset our status too + // this is required because most probably the mouse + // is over this chart, blocking it from auto-refreshing + if (master === false && (state.paused || state.selected)) { + state.resetChart(); + } +}; - state.google_instance.draw(datatable, state.google_options); - return true; - }; +// get or create a chart state, given a DOM element +NETDATA.chartState = function (element) { + let self = $(element); - // ---------------------------------------------------------------------------------------------------------------- + let state = self.data('netdata-state-object') || null; + if (state === null) { + state = new chartState(element); + self.data('netdata-state-object', state); + } + return state; +}; - NETDATA.easypiechartPercentFromValueMinMax = function(state, value, min, max) { - if(typeof value !== 'number') value = 0; - if(typeof min !== 'number') min = 0; - if(typeof max !== 'number') max = 0; +// ---------------------------------------------------------------------------------------------------------------- +// Library functions - if(min > max) { - var t = min; - min = max; - max = t; +// Load a script without jquery +// This is used to load jquery - after it is loaded, we use jquery +NETDATA._loadjQuery = function (callback) { + if (typeof jQuery === 'undefined') { + if (NETDATA.options.debug.main_loop) { + console.log('loading ' + NETDATA.jQuery); } - if(min > value) min = value; - if(max < value) max = value; + let script = document.createElement('script'); + script.type = 'text/javascript'; + script.async = true; + script.src = NETDATA.jQuery; - state.legendFormatValueDecimalsFromMinMax(min, max); + // script.onabort = onError; + script.onerror = function () { + NETDATA.error(101, NETDATA.jQuery); + }; + if (typeof callback === "function") { + script.onload = function () { + $ = jQuery; + return callback(); + }; + } - if(state.tmp.easyPieChartMin === null && min > 0) min = 0; - if(state.tmp.easyPieChartMax === null && max < 0) max = 0; + let s = document.getElementsByTagName('script')[0]; + s.parentNode.insertBefore(script, s); + } + else if (typeof callback === "function") { + $ = jQuery; + return callback(); + } +}; - var pcent; +NETDATA._loadCSS = function (filename) { + // don't use jQuery here + // styles are loaded before jQuery + // to eliminate showing an unstyled page to the user - if(min < 0 && max > 0) { - // it is both positive and negative - // zero at the top center of the chart - max = (-min > max)? -min : max; - pcent = Math.round(value * 100 / max); - } - else if(value >= 0 && min >= 0 && max >= 0) { - // clockwise - pcent = Math.round((value - min) * 100 / (max - min)); - if(pcent === 0) pcent = 0.1; - } - else { - // counter clockwise - pcent = Math.round((value - max) * 100 / (max - min)); - if(pcent === 0) pcent = -0.1; - } + let fileref = document.createElement("link"); + fileref.setAttribute("rel", "stylesheet"); + fileref.setAttribute("type", "text/css"); + fileref.setAttribute("href", filename); - return pcent; - }; + if (typeof fileref !== 'undefined') { + document.getElementsByTagName("head")[0].appendChild(fileref); + } +}; - // ---------------------------------------------------------------------------------------------------------------- - // easy-pie-chart +// user function to signal us the DOM has been +// updated. +NETDATA.updatedDom = function () { + NETDATA.options.updated_dom = true; +}; - NETDATA.easypiechartInitialize = function(callback) { - if(typeof netdataNoEasyPieChart === 'undefined' || !netdataNoEasyPieChart) { - $.ajax({ - url: NETDATA.easypiechart_js, - cache: true, - dataType: "script", - xhrFields: { withCredentials: true } // required for the cookie - }) - .done(function() { - NETDATA.registerChartLibrary('easypiechart', NETDATA.easypiechart_js); - }) - .fail(function() { - NETDATA.chartLibraries.easypiechart.enabled = false; - NETDATA.error(100, NETDATA.easypiechart_js); - }) - .always(function() { - if(typeof callback === "function") - return callback(); - }) - } - else { - NETDATA.chartLibraries.easypiechart.enabled = false; - if(typeof callback === "function") - return callback(); - } - }; +NETDATA.ready = function (callback) { + NETDATA.options.pauseCallback = callback; +}; - NETDATA.easypiechartClearSelection = function(state, force) { - if(typeof state.tmp.easyPieChartEvent !== 'undefined' && typeof state.tmp.easyPieChartEvent.timer !== 'undefined') { - NETDATA.timeout.clear(state.tmp.easyPieChartEvent.timer); - state.tmp.easyPieChartEvent.timer = undefined; +NETDATA.pause = function (callback) { + if (typeof callback === 'function') { + if (NETDATA.options.pause) { + return callback(); + } else { + NETDATA.options.pauseCallback = callback; } + } +}; - if(state.isAutoRefreshable() === true && state.data !== null && force !== true) { - NETDATA.easypiechartChartUpdate(state, state.data); - } - else { - state.tmp.easyPieChartLabel.innerText = state.legendFormatValue(null); - state.tmp.easyPieChart_instance.update(0); - } - state.tmp.easyPieChart_instance.enableAnimation(); +NETDATA.unpause = function () { + NETDATA.options.pauseCallback = null; + NETDATA.options.updated_dom = true; + NETDATA.options.pause = false; +}; - return true; - }; +// ---------------------------------------------------------------------------------------------------------------- - NETDATA.easypiechartSetSelection = function(state, t) { - if(state.timeIsVisible(t) !== true) - return NETDATA.easypiechartClearSelection(state, true); +// this is purely sequential charts refresher +// it is meant to be autonomous +NETDATA.chartRefresherNoParallel = function (index, callback) { + let targets = NETDATA.intersectionObserver.targets(); - var slot = state.calculateRowForTime(t); - if(slot < 0 || slot >= state.data.result.length) - return NETDATA.easypiechartClearSelection(state, true); + if (NETDATA.options.debug.main_loop) { + console.log('NETDATA.chartRefresherNoParallel(' + index + ')'); + } - if(typeof state.tmp.easyPieChartEvent === 'undefined') { - state.tmp.easyPieChartEvent = { - timer: undefined, - value: 0, - pcent: 0 - }; + if (NETDATA.options.updated_dom) { + // the dom has been updated + // get the dom parts again + NETDATA.parseDom(callback); + return; + } + if (index >= targets.length) { + if (NETDATA.options.debug.main_loop) { + console.log('waiting to restart main loop...'); } - var value = state.data.result[state.data.result.length - 1 - slot]; - var min = (state.tmp.easyPieChartMin === null)?NETDATA.commonMin.get(state):state.tmp.easyPieChartMin; - var max = (state.tmp.easyPieChartMax === null)?NETDATA.commonMax.get(state):state.tmp.easyPieChartMax; - var pcent = NETDATA.easypiechartPercentFromValueMinMax(state, value, min, max); + NETDATA.options.auto_refresher_fast_weight = 0; + callback(); + } else { + let state = targets[index]; - state.tmp.easyPieChartEvent.value = value; - state.tmp.easyPieChartEvent.pcent = pcent; - state.tmp.easyPieChartLabel.innerText = state.legendFormatValue(value); + if (NETDATA.options.auto_refresher_fast_weight < NETDATA.options.current.fast_render_timeframe) { + if (NETDATA.options.debug.main_loop) { + console.log('fast rendering...'); + } - if(state.tmp.easyPieChartEvent.timer === undefined) { - state.tmp.easyPieChart_instance.disableAnimation(); + if (state.isVisible()) { + NETDATA.timeout.set(function () { + state.autoRefresh(function () { + NETDATA.chartRefresherNoParallel(++index, callback); + }); + }, 0); + } else { + NETDATA.chartRefresherNoParallel(++index, callback); + } + } else { + if (NETDATA.options.debug.main_loop) { + console.log('waiting for next refresh...'); + } + NETDATA.options.auto_refresher_fast_weight = 0; - state.tmp.easyPieChartEvent.timer = NETDATA.timeout.set(function() { - state.tmp.easyPieChartEvent.timer = undefined; - state.tmp.easyPieChart_instance.update(state.tmp.easyPieChartEvent.pcent); - }, 0); + NETDATA.timeout.set(function () { + state.autoRefresh(function () { + NETDATA.chartRefresherNoParallel(++index, callback); + }); + }, NETDATA.options.current.idle_between_charts); } + } +}; - return true; - }; +NETDATA.chartRefresherWaitTime = function () { + return NETDATA.options.current.idle_parallel_loops; +}; - NETDATA.easypiechartChartUpdate = function(state, data) { - var value, min, max, pcent; +// the default refresher +NETDATA.chartRefresherLastRun = 0; +NETDATA.chartRefresherRunsAfterParseDom = 0; +NETDATA.chartRefresherTimeoutId = undefined; - if(NETDATA.globalPanAndZoom.isActive() === true || state.isAutoRefreshable() === false) { - value = null; - pcent = 0; +NETDATA.chartRefresherReschedule = function () { + if (NETDATA.options.current.async_on_scroll) { + if (NETDATA.chartRefresherTimeoutId) { + NETDATA.timeout.clear(NETDATA.chartRefresherTimeoutId); } - else { - value = data.result[0]; - min = (state.tmp.easyPieChartMin === null)?NETDATA.commonMin.get(state):state.tmp.easyPieChartMin; - max = (state.tmp.easyPieChartMax === null)?NETDATA.commonMax.get(state):state.tmp.easyPieChartMax; - pcent = NETDATA.easypiechartPercentFromValueMinMax(state, value, min, max); - } - - state.tmp.easyPieChartLabel.innerText = state.legendFormatValue(value); - state.tmp.easyPieChart_instance.update(pcent); - return true; - }; + NETDATA.chartRefresherTimeoutId = NETDATA.timeout.set(NETDATA.chartRefresher, NETDATA.options.current.onscroll_worker_duration_threshold); + //console.log('chartRefresherReschedule()'); + } +}; + +NETDATA.chartRefresher = function () { + // console.log('chartRefresher() begin ' + (Date.now() - NETDATA.chartRefresherLastRun).toString() + ' ms since last run'); + + if (NETDATA.options.page_is_visible === false + && NETDATA.options.current.stop_updates_when_focus_is_lost + && NETDATA.chartRefresherLastRun > NETDATA.options.last_page_resize + && NETDATA.chartRefresherLastRun > NETDATA.options.last_page_scroll + && NETDATA.chartRefresherRunsAfterParseDom > 10 + ) { + setTimeout( + NETDATA.chartRefresher, + NETDATA.options.current.idle_lost_focus + ); - NETDATA.easypiechartChartCreate = function(state, data) { - var chart = $(state.element_chart); - - var value = data.result[0]; - var min = NETDATA.dataAttribute(state.element, 'easypiechart-min-value', null); - var max = NETDATA.dataAttribute(state.element, 'easypiechart-max-value', null); - - if(min === null) { - min = NETDATA.commonMin.get(state); - state.tmp.easyPieChartMin = null; - } - else - state.tmp.easyPieChartMin = min; - - if(max === null) { - max = NETDATA.commonMax.get(state); - state.tmp.easyPieChartMax = null; - } - else - state.tmp.easyPieChartMax = max; - - var size = state.chartWidth(); - var stroke = Math.floor(size / 22); - if(stroke < 3) stroke = 2; - - var valuefontsize = Math.floor((size * 2 / 3) / 5); - var valuetop = Math.round((size - valuefontsize - (size / 40)) / 2); - state.tmp.easyPieChartLabel = document.createElement('span'); - state.tmp.easyPieChartLabel.className = 'easyPieChartLabel'; - state.tmp.easyPieChartLabel.innerText = state.legendFormatValue(value); - state.tmp.easyPieChartLabel.style.fontSize = valuefontsize + 'px'; - state.tmp.easyPieChartLabel.style.top = valuetop.toString() + 'px'; - state.element_chart.appendChild(state.tmp.easyPieChartLabel); - - var titlefontsize = Math.round(valuefontsize * 1.6 / 3); - var titletop = Math.round(valuetop - (titlefontsize * 2) - (size / 40)); - state.tmp.easyPieChartTitle = document.createElement('span'); - state.tmp.easyPieChartTitle.className = 'easyPieChartTitle'; - state.tmp.easyPieChartTitle.innerText = state.title; - state.tmp.easyPieChartTitle.style.fontSize = titlefontsize + 'px'; - state.tmp.easyPieChartTitle.style.lineHeight = titlefontsize + 'px'; - state.tmp.easyPieChartTitle.style.top = titletop.toString() + 'px'; - state.element_chart.appendChild(state.tmp.easyPieChartTitle); - - var unitfontsize = Math.round(titlefontsize * 0.9); - var unittop = Math.round(valuetop + (valuefontsize + unitfontsize) + (size / 40)); - state.tmp.easyPieChartUnits = document.createElement('span'); - state.tmp.easyPieChartUnits.className = 'easyPieChartUnits'; - state.tmp.easyPieChartUnits.innerText = state.units_current; - state.tmp.easyPieChartUnits.style.fontSize = unitfontsize + 'px'; - state.tmp.easyPieChartUnits.style.top = unittop.toString() + 'px'; - state.element_chart.appendChild(state.tmp.easyPieChartUnits); - - var barColor = NETDATA.dataAttribute(state.element, 'easypiechart-barcolor', undefined); - if(typeof barColor === 'undefined' || barColor === null) - barColor = state.chartCustomColors()[0]; - else { - // <div ... data-easypiechart-barcolor="(function(percent){return(percent < 50 ? '#5cb85c' : percent < 85 ? '#f0ad4e' : '#cb3935');})" ...></div> - var tmp = eval(barColor); - if(typeof tmp === 'function') - barColor = tmp; - } - - var pcent = NETDATA.easypiechartPercentFromValueMinMax(state, value, min, max); - chart.data('data-percent', pcent); - - chart.easyPieChart({ - barColor: barColor, - trackColor: NETDATA.dataAttribute(state.element, 'easypiechart-trackcolor', NETDATA.themes.current.easypiechart_track), - scaleColor: NETDATA.dataAttribute(state.element, 'easypiechart-scalecolor', NETDATA.themes.current.easypiechart_scale), - scaleLength: NETDATA.dataAttribute(state.element, 'easypiechart-scalelength', 5), - lineCap: NETDATA.dataAttribute(state.element, 'easypiechart-linecap', 'round'), - lineWidth: NETDATA.dataAttribute(state.element, 'easypiechart-linewidth', stroke), - trackWidth: NETDATA.dataAttribute(state.element, 'easypiechart-trackwidth', undefined), - size: NETDATA.dataAttribute(state.element, 'easypiechart-size', size), - rotate: NETDATA.dataAttribute(state.element, 'easypiechart-rotate', 0), - animate: NETDATA.dataAttribute(state.element, 'easypiechart-animate', {duration: 500, enabled: true}), - easing: NETDATA.dataAttribute(state.element, 'easypiechart-easing', undefined) - }); + // console.log('chartRefresher() page without focus, will run in ' + NETDATA.options.current.idle_lost_focus.toString() + ' ms, ' + NETDATA.chartRefresherRunsAfterParseDom.toString()); + return; + } + NETDATA.chartRefresherRunsAfterParseDom++; - // when we just re-create the chart - // do not animate the first update - var animate = true; - if(typeof state.tmp.easyPieChart_instance !== 'undefined') - animate = false; + let now = Date.now(); + NETDATA.chartRefresherLastRun = now; - state.tmp.easyPieChart_instance = chart.data('easyPieChart'); - if(animate === false) state.tmp.easyPieChart_instance.disableAnimation(); - state.tmp.easyPieChart_instance.update(pcent); - if(animate === false) state.tmp.easyPieChart_instance.enableAnimation(); + if (now < NETDATA.options.on_scroll_refresher_stop_until) { + NETDATA.chartRefresherTimeoutId = NETDATA.timeout.set( + NETDATA.chartRefresher, + NETDATA.chartRefresherWaitTime() + ); - state.legendSetUnitsString = function(units) { - if(typeof state.tmp.easyPieChartUnits !== 'undefined' && state.tmp.units !== units) { - state.tmp.easyPieChartUnits.innerText = units; - state.tmp.units = units; - } - }; - state.legendShowUndefined = function() { - if(typeof state.tmp.easyPieChart_instance !== 'undefined') - NETDATA.easypiechartClearSelection(state); - }; + // console.log('chartRefresher() end1 will run in ' + NETDATA.chartRefresherWaitTime().toString() + ' ms'); + return; + } - return true; - }; + if (now < NETDATA.options.auto_refresher_stop_until) { + NETDATA.chartRefresherTimeoutId = NETDATA.timeout.set( + NETDATA.chartRefresher, + NETDATA.chartRefresherWaitTime() + ); - // ---------------------------------------------------------------------------------------------------------------- - // gauge.js + // console.log('chartRefresher() end2 will run in ' + NETDATA.chartRefresherWaitTime().toString() + ' ms'); + return; + } - NETDATA.gaugeInitialize = function(callback) { - if(typeof netdataNoGauge === 'undefined' || !netdataNoGauge) { - $.ajax({ - url: NETDATA.gauge_js, - cache: true, - dataType: "script", - xhrFields: { withCredentials: true } // required for the cookie - }) - .done(function() { - NETDATA.registerChartLibrary('gauge', NETDATA.gauge_js); - }) - .fail(function() { - NETDATA.chartLibraries.gauge.enabled = false; - NETDATA.error(100, NETDATA.gauge_js); - }) - .always(function() { - if(typeof callback === "function") - return callback(); - }) - } - else { - NETDATA.chartLibraries.gauge.enabled = false; - if(typeof callback === "function") - return callback(); - } - }; + if (NETDATA.options.pause) { + // console.log('auto-refresher is paused'); + NETDATA.chartRefresherTimeoutId = NETDATA.timeout.set( + NETDATA.chartRefresher, + NETDATA.chartRefresherWaitTime() + ); - NETDATA.gaugeAnimation = function(state, status) { - var speed = 32; + // console.log('chartRefresher() end3 will run in ' + NETDATA.chartRefresherWaitTime().toString() + ' ms'); + return; + } - if(typeof status === 'boolean' && status === false) - speed = 1000000000; - else if(typeof status === 'number') - speed = status; + if (typeof NETDATA.options.pauseCallback === 'function') { + // console.log('auto-refresher is calling pauseCallback'); - // console.log('gauge speed ' + speed); - state.tmp.gauge_instance.animationSpeed = speed; - state.tmp.___gaugeOld__.speed = speed; - }; + NETDATA.options.pause = true; + NETDATA.options.pauseCallback(); + NETDATA.chartRefresher(); - NETDATA.gaugeSet = function(state, value, min, max) { - if(typeof value !== 'number') value = 0; - if(typeof min !== 'number') min = 0; - if(typeof max !== 'number') max = 0; - if(value > max) max = value; - if(value < min) min = value; - if(min > max) { - var t = min; - min = max; - max = t; - } - else if(min === max) - max = min + 1; - - state.legendFormatValueDecimalsFromMinMax(min, max); - - // gauge.js has an issue if the needle - // is smaller than min or larger than max - // when we set the new values - // the needle will go crazy - - // to prevent it, we always feed it - // with a percentage, so that the needle - // is always between min and max - var pcent = (value - min) * 100 / (max - min); - - // bug fix for gauge.js 1.3.1 - // if the value is the absolute min or max, the chart is broken - if(pcent < 0.001) pcent = 0.001; - if(pcent > 99.999) pcent = 99.999; - - state.tmp.gauge_instance.set(pcent); - // console.log('gauge set ' + pcent + ', value ' + value + ', min ' + min + ', max ' + max); - - state.tmp.___gaugeOld__.value = value; - state.tmp.___gaugeOld__.min = min; - state.tmp.___gaugeOld__.max = max; - }; + // console.log('chartRefresher() end4 (nested)'); + return; + } - NETDATA.gaugeSetLabels = function(state, value, min, max) { - if(state.tmp.___gaugeOld__.valueLabel !== value) { - state.tmp.___gaugeOld__.valueLabel = value; - state.tmp.gaugeChartLabel.innerText = state.legendFormatValue(value); - } - if(state.tmp.___gaugeOld__.minLabel !== min) { - state.tmp.___gaugeOld__.minLabel = min; - state.tmp.gaugeChartMin.innerText = state.legendFormatValue(min); - } - if(state.tmp.___gaugeOld__.maxLabel !== max) { - state.tmp.___gaugeOld__.maxLabel = max; - state.tmp.gaugeChartMax.innerText = state.legendFormatValue(max); - } - }; + if (!NETDATA.options.current.parallel_refresher) { + // console.log('auto-refresher is calling chartRefresherNoParallel(0)'); + NETDATA.chartRefresherNoParallel(0, function () { + NETDATA.chartRefresherTimeoutId = NETDATA.timeout.set( + NETDATA.chartRefresher, + NETDATA.options.current.idle_between_loops + ); + }); + // console.log('chartRefresher() end5 (no parallel, nested)'); + return; + } - NETDATA.gaugeClearSelection = function(state, force) { - if(typeof state.tmp.gaugeEvent !== 'undefined' && typeof state.tmp.gaugeEvent.timer !== 'undefined') { - NETDATA.timeout.clear(state.tmp.gaugeEvent.timer); - state.tmp.gaugeEvent.timer = undefined; - } + if (NETDATA.options.updated_dom) { + // the dom has been updated + // get the dom parts again + // console.log('auto-refresher is calling parseDom()'); + NETDATA.parseDom(NETDATA.chartRefresher); + // console.log('chartRefresher() end6 (parseDom)'); + return; + } - if(state.isAutoRefreshable() === true && state.data !== null && force !== true) { - NETDATA.gaugeChartUpdate(state, state.data); - } - else { - NETDATA.gaugeAnimation(state, false); - NETDATA.gaugeSetLabels(state, null, null, null); - NETDATA.gaugeSet(state, null, null, null); - } + if (!NETDATA.globalSelectionSync.active()) { + let parallel = []; + let targets = NETDATA.intersectionObserver.targets(); + let len = targets.length; + let state; + while (len--) { + state = targets[len]; + if (state.running || state.isVisible() === false) { + continue; + } - NETDATA.gaugeAnimation(state, true); - return true; - }; + if (!state.library.initialized) { + if (state.library.enabled) { + state.library.initialize(NETDATA.chartRefresher); + //console.log('chartRefresher() end6 (library init)'); + return; + } + else { + state.error('chart library "' + state.library_name + '" is not enabled.'); + } + } - NETDATA.gaugeSetSelection = function(state, t) { - if(state.timeIsVisible(t) !== true) - return NETDATA.gaugeClearSelection(state, true); + if (NETDATA.scrollUp) { + parallel.unshift(state); + } else { + parallel.push(state); + } + } - var slot = state.calculateRowForTime(t); - if(slot < 0 || slot >= state.data.result.length) - return NETDATA.gaugeClearSelection(state, true); + len = parallel.length; + while (len--) { + state = parallel[len]; + // console.log('auto-refresher executing in parallel for ' + parallel.length.toString() + ' charts'); + // this will execute the jobs in parallel - if(typeof state.tmp.gaugeEvent === 'undefined') { - state.tmp.gaugeEvent = { - timer: undefined, - value: 0, - min: 0, - max: 0 - }; + if (!state.running) { + NETDATA.timeout.set(state.autoRefresh, 0); + } } + //else { + // console.log('auto-refresher nothing to do'); + //} + } - var value = state.data.result[state.data.result.length - 1 - slot]; - var min = (state.tmp.gaugeMin === null)?NETDATA.commonMin.get(state):state.tmp.gaugeMin; - var max = (state.tmp.gaugeMax === null)?NETDATA.commonMax.get(state):state.tmp.gaugeMax; + // run the next refresh iteration + NETDATA.chartRefresherTimeoutId = NETDATA.timeout.set( + NETDATA.chartRefresher, + NETDATA.chartRefresherWaitTime() + ); - // make sure it is zero based - // but only if it has not been set by the user - if(state.tmp.gaugeMin === null && min > 0) min = 0; - if(state.tmp.gaugeMax === null && max < 0) max = 0; + //console.log('chartRefresher() completed in ' + (Date.now() - now).toString() + ' ms'); +}; - state.tmp.gaugeEvent.value = value; - state.tmp.gaugeEvent.min = min; - state.tmp.gaugeEvent.max = max; - NETDATA.gaugeSetLabels(state, value, min, max); +NETDATA.parseDom = function (callback) { + //console.log('parseDom()'); - if(state.tmp.gaugeEvent.timer === undefined) { - NETDATA.gaugeAnimation(state, false); + NETDATA.options.last_page_scroll = Date.now(); + NETDATA.options.updated_dom = false; + NETDATA.chartRefresherRunsAfterParseDom = 0; - state.tmp.gaugeEvent.timer = NETDATA.timeout.set(function() { - state.tmp.gaugeEvent.timer = undefined; - NETDATA.gaugeSet(state, state.tmp.gaugeEvent.value, state.tmp.gaugeEvent.min, state.tmp.gaugeEvent.max); - }, 0); - } + let targets = $('div[data-netdata]'); //.filter(':visible'); - return true; - }; + if (NETDATA.options.debug.main_loop) { + console.log('DOM updated - there are ' + targets.length + ' charts on page.'); + } - NETDATA.gaugeChartUpdate = function(state, data) { - var value, min, max; + NETDATA.intersectionObserver.globalReset(); + NETDATA.options.targets = []; + let len = targets.length; + while (len--) { + // the initialization will take care of sizing + // and the "loading..." message + let state = NETDATA.chartState(targets[len]); + NETDATA.options.targets.push(state); + NETDATA.intersectionObserver.observe(state); + } - if(NETDATA.globalPanAndZoom.isActive() === true || state.isAutoRefreshable() === false) { - NETDATA.gaugeSetLabels(state, null, null, null); - state.tmp.gauge_instance.set(0); - } - else { - value = data.result[0]; - min = (state.tmp.gaugeMin === null)?NETDATA.commonMin.get(state):state.tmp.gaugeMin; - max = (state.tmp.gaugeMax === null)?NETDATA.commonMax.get(state):state.tmp.gaugeMax; - if(value < min) min = value; - if(value > max) max = value; + if (NETDATA.globalChartUnderlay.isActive()) { + NETDATA.globalChartUnderlay.setup(); + } else { + NETDATA.globalChartUnderlay.clear(); + } - // make sure it is zero based - // but only if it has not been set by the user - if(state.tmp.gaugeMin === null && min > 0) min = 0; - if(state.tmp.gaugeMax === null && max < 0) max = 0; + if (typeof callback === 'function') { + return callback(); + } +}; - NETDATA.gaugeSet(state, value, min, max); - NETDATA.gaugeSetLabels(state, value, min, max); - } +// this is the main function - where everything starts +NETDATA.started = false; +NETDATA.start = function () { + // this should be called only once - return true; - }; + if (NETDATA.started) { + console.log('netdata is already started'); + return; + } - NETDATA.gaugeChartCreate = function(state, data) { - // var chart = $(state.element_chart); + NETDATA.started = true; + NETDATA.options.page_is_visible = true; - var value = data.result[0]; - var min = NETDATA.dataAttribute(state.element, 'gauge-min-value', null); - var max = NETDATA.dataAttribute(state.element, 'gauge-max-value', null); - // var adjust = NETDATA.dataAttribute(state.element, 'gauge-adjust', null); - var pointerColor = NETDATA.dataAttribute(state.element, 'gauge-pointer-color', NETDATA.themes.current.gauge_pointer); - var strokeColor = NETDATA.dataAttribute(state.element, 'gauge-stroke-color', NETDATA.themes.current.gauge_stroke); - var startColor = NETDATA.dataAttribute(state.element, 'gauge-start-color', state.chartCustomColors()[0]); - var stopColor = NETDATA.dataAttribute(state.element, 'gauge-stop-color', void 0); - var generateGradient = NETDATA.dataAttribute(state.element, 'gauge-generate-gradient', false); + $(window).blur(function () { + if (NETDATA.options.current.stop_updates_when_focus_is_lost) { + NETDATA.options.page_is_visible = false; + if (NETDATA.options.debug.focus) { + console.log('Lost Focus!'); + } + } + }); - if(min === null) { - min = NETDATA.commonMin.get(state); - state.tmp.gaugeMin = null; + $(window).focus(function () { + if (NETDATA.options.current.stop_updates_when_focus_is_lost) { + NETDATA.options.page_is_visible = true; + if (NETDATA.options.debug.focus) { + console.log('Focus restored!'); + } } - else - state.tmp.gaugeMin = min; + }); - if(max === null) { - max = NETDATA.commonMax.get(state); - state.tmp.gaugeMax = null; + if (typeof document.hasFocus === 'function' && !document.hasFocus()) { + if (NETDATA.options.current.stop_updates_when_focus_is_lost) { + NETDATA.options.page_is_visible = false; + if (NETDATA.options.debug.focus) { + console.log('Document has no focus!'); + } } - else - state.tmp.gaugeMax = max; + } - // make sure it is zero based - // but only if it has not been set by the user - if(state.tmp.gaugeMin === null && min > 0) min = 0; - if(state.tmp.gaugeMax === null && max < 0) max = 0; - - var width = state.chartWidth(), height = state.chartHeight(); //, ratio = 1.5; - // console.log('gauge width: ' + width.toString() + ', height: ' + height.toString()); - //switch(adjust) { - // case 'width': width = height * ratio; break; - // case 'height': - // default: height = width / ratio; break; - //} - //state.element.style.width = width.toString() + 'px'; - //state.element.style.height = height.toString() + 'px'; - - var lum_d = 0.05; - - var options = { - lines: 12, // The number of lines to draw - angle: 0.14, // The span of the gauge arc - lineWidth: 0.57, // The line thickness - radiusScale: 1.0, // Relative radius - pointer: { - length: 0.85, // 0.9 The radius of the inner circle - strokeWidth: 0.045, // The rotation offset - color: pointerColor // Fill color - }, - limitMax: true, // If false, the max value of the gauge will be updated if value surpass max - limitMin: true, // If true, the min value of the gauge will be fixed unless you set it manually - colorStart: startColor, // Colors - colorStop: stopColor, // just experiment with them - strokeColor: strokeColor, // to see which ones work best for you - generateGradient: (generateGradient === true), - gradientType: 0, - highDpiSupport: true // High resolution support - }; + // bootstrap tab switching + $('a[data-toggle="tab"]').on('shown.bs.tab', NETDATA.onscroll); - if (generateGradient.constructor === Array) { - // example options: - // data-gauge-generate-gradient="[0, 50, 100]" - // data-gauge-gradient-percent-color-0="#FFFFFF" - // data-gauge-gradient-percent-color-50="#999900" - // data-gauge-gradient-percent-color-100="#000000" - - options.percentColors = []; - var len = generateGradient.length; - while(len--) { - var pcent = generateGradient[len]; - var color = NETDATA.dataAttribute(state.element, 'gauge-gradient-percent-color-' + pcent.toString(), false); - if(color !== false) { - var a = []; - a[0] = pcent / 100; - a[1] = color; - options.percentColors.unshift(a); - } - } - if(options.percentColors.length === 0) - delete options.percentColors; - } - else if(generateGradient === false && NETDATA.themes.current.gauge_gradient === true) { - //noinspection PointlessArithmeticExpressionJS - options.percentColors = [ - [0.0, NETDATA.colorLuminance(startColor, (lum_d * 10) - (lum_d * 0))], - [0.1, NETDATA.colorLuminance(startColor, (lum_d * 10) - (lum_d * 1))], - [0.2, NETDATA.colorLuminance(startColor, (lum_d * 10) - (lum_d * 2))], - [0.3, NETDATA.colorLuminance(startColor, (lum_d * 10) - (lum_d * 3))], - [0.4, NETDATA.colorLuminance(startColor, (lum_d * 10) - (lum_d * 4))], - [0.5, NETDATA.colorLuminance(startColor, (lum_d * 10) - (lum_d * 5))], - [0.6, NETDATA.colorLuminance(startColor, (lum_d * 10) - (lum_d * 6))], - [0.7, NETDATA.colorLuminance(startColor, (lum_d * 10) - (lum_d * 7))], - [0.8, NETDATA.colorLuminance(startColor, (lum_d * 10) - (lum_d * 8))], - [0.9, NETDATA.colorLuminance(startColor, (lum_d * 10) - (lum_d * 9))], - [1.0, NETDATA.colorLuminance(startColor, 0.0)]]; - } - - state.tmp.gauge_canvas = document.createElement('canvas'); - state.tmp.gauge_canvas.id = 'gauge-' + state.uuid + '-canvas'; - state.tmp.gauge_canvas.className = 'gaugeChart'; - state.tmp.gauge_canvas.width = width; - state.tmp.gauge_canvas.height = height; - state.element_chart.appendChild(state.tmp.gauge_canvas); - - var valuefontsize = Math.floor(height / 5); - var valuetop = Math.round((height - valuefontsize) / 3.2); - state.tmp.gaugeChartLabel = document.createElement('span'); - state.tmp.gaugeChartLabel.className = 'gaugeChartLabel'; - state.tmp.gaugeChartLabel.style.fontSize = valuefontsize + 'px'; - state.tmp.gaugeChartLabel.style.top = valuetop.toString() + 'px'; - state.element_chart.appendChild(state.tmp.gaugeChartLabel); - - var titlefontsize = Math.round(valuefontsize / 2.1); - var titletop = 0; - state.tmp.gaugeChartTitle = document.createElement('span'); - state.tmp.gaugeChartTitle.className = 'gaugeChartTitle'; - state.tmp.gaugeChartTitle.innerText = state.title; - state.tmp.gaugeChartTitle.style.fontSize = titlefontsize + 'px'; - state.tmp.gaugeChartTitle.style.lineHeight = titlefontsize + 'px'; - state.tmp.gaugeChartTitle.style.top = titletop.toString() + 'px'; - state.element_chart.appendChild(state.tmp.gaugeChartTitle); - - var unitfontsize = Math.round(titlefontsize * 0.9); - state.tmp.gaugeChartUnits = document.createElement('span'); - state.tmp.gaugeChartUnits.className = 'gaugeChartUnits'; - state.tmp.gaugeChartUnits.innerText = state.units_current; - state.tmp.gaugeChartUnits.style.fontSize = unitfontsize + 'px'; - state.element_chart.appendChild(state.tmp.gaugeChartUnits); - - state.tmp.gaugeChartMin = document.createElement('span'); - state.tmp.gaugeChartMin.className = 'gaugeChartMin'; - state.tmp.gaugeChartMin.style.fontSize = Math.round(valuefontsize * 0.75).toString() + 'px'; - state.element_chart.appendChild(state.tmp.gaugeChartMin); - - state.tmp.gaugeChartMax = document.createElement('span'); - state.tmp.gaugeChartMax.className = 'gaugeChartMax'; - state.tmp.gaugeChartMax.style.fontSize = Math.round(valuefontsize * 0.75).toString() + 'px'; - state.element_chart.appendChild(state.tmp.gaugeChartMax); - - // when we just re-create the chart - // do not animate the first update - var animate = true; - if(typeof state.tmp.gauge_instance !== 'undefined') - animate = false; - - state.tmp.gauge_instance = new Gauge(state.tmp.gauge_canvas).setOptions(options); // create sexy gauge! - - state.tmp.___gaugeOld__ = { - value: value, - min: min, - max: max, - valueLabel: null, - minLabel: null, - maxLabel: null - }; + // bootstrap modal switching + let $modal = $('.modal'); + $modal.on('hidden.bs.modal', NETDATA.onscroll); + $modal.on('shown.bs.modal', NETDATA.onscroll); - // we will always feed a percentage - state.tmp.gauge_instance.minValue = 0; - state.tmp.gauge_instance.maxValue = 100; + // bootstrap collapse switching + let $collapse = $('.collapse'); + $collapse.on('hidden.bs.collapse', NETDATA.onscroll); + $collapse.on('shown.bs.collapse', NETDATA.onscroll); - NETDATA.gaugeAnimation(state, animate); - NETDATA.gaugeSet(state, value, min, max); - NETDATA.gaugeSetLabels(state, value, min, max); - NETDATA.gaugeAnimation(state, true); + NETDATA.parseDom(NETDATA.chartRefresher); - state.legendSetUnitsString = function(units) { - if(typeof state.tmp.gaugeChartUnits !== 'undefined' && state.tmp.units !== units) { - state.tmp.gaugeChartUnits.innerText = units; - state.tmp.___gaugeOld__.valueLabel = null; - state.tmp.___gaugeOld__.minLabel = null; - state.tmp.___gaugeOld__.maxLabel = null; - state.tmp.units = units; - } - }; - state.legendShowUndefined = function() { - if(typeof state.tmp.gauge_instance !== 'undefined') - NETDATA.gaugeClearSelection(state); - }; + // Alarms initialization + setTimeout(NETDATA.alarms.init, 1000); - return true; - }; + // Registry initialization + setTimeout(NETDATA.registry.init, netdataRegistryAfterMs); - // ---------------------------------------------------------------------------------------------------------------- - // Charts Libraries Registration - - NETDATA.chartLibraries = { - "dygraph": { - initialize: NETDATA.dygraphInitialize, - create: NETDATA.dygraphChartCreate, - update: NETDATA.dygraphChartUpdate, - resize: function(state) { - if(typeof state.tmp.dygraph_instance !== 'undefined' && typeof state.tmp.dygraph_instance.resize === 'function') - state.tmp.dygraph_instance.resize(); - }, - setSelection: NETDATA.dygraphSetSelection, - clearSelection: NETDATA.dygraphClearSelection, - toolboxPanAndZoom: NETDATA.dygraphToolboxPanAndZoom, - initialized: false, - enabled: true, - xssRegexIgnore: new RegExp('^/api/v1/data\.result.data$'), - format: function(state) { void(state); return 'json'; }, - options: function(state) { return 'ms' + '%7C' + 'flip' + (this.isLogScale(state)?('%7C' + 'abs'):'').toString(); }, - legend: function(state) { - return (this.isSparkline(state) === false && NETDATA.dataAttributeBoolean(state.element, 'legend', true) === true) ? 'right-side' : null; - }, - autoresize: function(state) { void(state); return true; }, - max_updates_to_recreate: function(state) { void(state); return 5000; }, - track_colors: function(state) { void(state); return true; }, - pixels_per_point: function(state) { - return (this.isSparkline(state) === false)?3:2; - }, - isSparkline: function(state) { - if(typeof state.tmp.dygraph_sparkline === 'undefined') { - state.tmp.dygraph_sparkline = (this.theme(state) === 'sparkline'); - } - return state.tmp.dygraph_sparkline; - }, - isLogScale: function(state) { - if(typeof state.tmp.dygraph_logscale === 'undefined') { - state.tmp.dygraph_logscale = (this.theme(state) === 'logscale'); - } - return state.tmp.dygraph_logscale; - }, - theme: function(state) { - if(typeof state.tmp.dygraph_theme === 'undefined') - state.tmp.dygraph_theme = NETDATA.dataAttribute(state.element, 'dygraph-theme', 'default'); - return state.tmp.dygraph_theme; - }, - container_class: function(state) { - if(this.legend(state) !== null) - return 'netdata-container-with-legend'; - return 'netdata-container'; + if (typeof netdataCallback === 'function') { + netdataCallback(); + } +}; + +NETDATA.globalReset = function () { + NETDATA.intersectionObserver.globalReset(); + NETDATA.globalSelectionSync.globalReset(); + NETDATA.globalPanAndZoom.globalReset(); + NETDATA.chartRegistry.globalReset(); + NETDATA.commonMin.globalReset(); + NETDATA.commonMax.globalReset(); + NETDATA.commonColors.globalReset(); + NETDATA.unitsConversion.globalReset(); + NETDATA.options.targets = []; + NETDATA.parseDom(); + NETDATA.unpause(); +}; + +// Registry of netdata hosts + +NETDATA.alarms = { + onclick: null, // the callback to handle the click - it will be called with the alarm log entry + chart_div_offset: -50, // give that space above the chart when scrolling to it + chart_div_id_prefix: 'chart_', // the chart DIV IDs have this prefix (they should be NETDATA.name2id(chart.id)) + chart_div_animation_duration: 0,// the duration of the animation while scrolling to a chart + + ms_penalty: 0, // the time penalty of the next alarm + ms_between_notifications: 500, // firefox moves the alarms off-screen (above, outside the top of the screen) + // if alarms are shown faster than: one per 500ms + + update_every: 10000, // the time in ms between alarm checks + + notifications: false, // when true, the browser supports notifications (may not be granted though) + last_notification_id: 0, // the id of the last alarm_log we have raised an alarm for + first_notification_id: 0, // the id of the first alarm_log entry for this session + // this is used to prevent CLEAR notifications for past events + // notifications_shown: [], + + server: null, // the server to connect to for fetching alarms + current: null, // the list of raised alarms - updated in the background + + // a callback function to call every time the list of raised alarms is refreshed + callback: (typeof netdataAlarmsActiveCallback === 'function') ? netdataAlarmsActiveCallback : null, + + // a callback function to call every time a notification is shown + // the return value is used to decide if the notification will be shown + notificationCallback: (typeof netdataAlarmsNotifCallback === 'function') ? netdataAlarmsNotifCallback : null, + + recipients: null, // the list (array) of recipients to show alarms for, or null + + recipientMatches: function (to_string, wanted_array) { + if (typeof wanted_array === 'undefined' || wanted_array === null || Array.isArray(wanted_array) === false) { + return true; + } + + let r = ' ' + to_string.toString() + ' '; + let len = wanted_array.length; + while (len--) { + if (r.indexOf(' ' + wanted_array[len] + ' ') >= 0) { + return true; } - }, - "sparkline": { - initialize: NETDATA.sparklineInitialize, - create: NETDATA.sparklineChartCreate, - update: NETDATA.sparklineChartUpdate, - resize: null, - setSelection: undefined, // function(state, t) { void(state); return true; }, - clearSelection: undefined, // function(state) { void(state); return true; }, - toolboxPanAndZoom: null, - initialized: false, - enabled: true, - xssRegexIgnore: new RegExp('^/api/v1/data\.result$'), - format: function(state) { void(state); return 'array'; }, - options: function(state) { void(state); return 'flip' + '%7C' + 'abs'; }, - legend: function(state) { void(state); return null; }, - autoresize: function(state) { void(state); return false; }, - max_updates_to_recreate: function(state) { void(state); return 5000; }, - track_colors: function(state) { void(state); return false; }, - pixels_per_point: function(state) { void(state); return 3; }, - container_class: function(state) { void(state); return 'netdata-container'; } - }, - "peity": { - initialize: NETDATA.peityInitialize, - create: NETDATA.peityChartCreate, - update: NETDATA.peityChartUpdate, - resize: null, - setSelection: undefined, // function(state, t) { void(state); return true; }, - clearSelection: undefined, // function(state) { void(state); return true; }, - toolboxPanAndZoom: null, - initialized: false, - enabled: true, - xssRegexIgnore: new RegExp('^/api/v1/data\.result$'), - format: function(state) { void(state); return 'ssvcomma'; }, - options: function(state) { void(state); return 'null2zero' + '%7C' + 'flip' + '%7C' + 'abs'; }, - legend: function(state) { void(state); return null; }, - autoresize: function(state) { void(state); return false; }, - max_updates_to_recreate: function(state) { void(state); return 5000; }, - track_colors: function(state) { void(state); return false; }, - pixels_per_point: function(state) { void(state); return 3; }, - container_class: function(state) { void(state); return 'netdata-container'; } - }, - "morris": { - initialize: NETDATA.morrisInitialize, - create: NETDATA.morrisChartCreate, - update: NETDATA.morrisChartUpdate, - resize: null, - setSelection: undefined, // function(state, t) { void(state); return true; }, - clearSelection: undefined, // function(state) { void(state); return true; }, - toolboxPanAndZoom: null, - initialized: false, - enabled: true, - xssRegexIgnore: new RegExp('^/api/v1/data\.result.data$'), - format: function(state) { void(state); return 'json'; }, - options: function(state) { void(state); return 'objectrows' + '%7C' + 'ms'; }, - legend: function(state) { void(state); return null; }, - autoresize: function(state) { void(state); return false; }, - max_updates_to_recreate: function(state) { void(state); return 50; }, - track_colors: function(state) { void(state); return false; }, - pixels_per_point: function(state) { void(state); return 15; }, - container_class: function(state) { void(state); return 'netdata-container'; } - }, - "google": { - initialize: NETDATA.googleInitialize, - create: NETDATA.googleChartCreate, - update: NETDATA.googleChartUpdate, - resize: null, - setSelection: undefined, //function(state, t) { void(state); return true; }, - clearSelection: undefined, //function(state) { void(state); return true; }, - toolboxPanAndZoom: null, - initialized: false, - enabled: true, - xssRegexIgnore: new RegExp('^/api/v1/data\.result.rows$'), - format: function(state) { void(state); return 'datatable'; }, - options: function(state) { void(state); return ''; }, - legend: function(state) { void(state); return null; }, - autoresize: function(state) { void(state); return false; }, - max_updates_to_recreate: function(state) { void(state); return 300; }, - track_colors: function(state) { void(state); return false; }, - pixels_per_point: function(state) { void(state); return 4; }, - container_class: function(state) { void(state); return 'netdata-container'; } - }, - "raphael": { - initialize: NETDATA.raphaelInitialize, - create: NETDATA.raphaelChartCreate, - update: NETDATA.raphaelChartUpdate, - resize: null, - setSelection: undefined, // function(state, t) { void(state); return true; }, - clearSelection: undefined, // function(state) { void(state); return true; }, - toolboxPanAndZoom: null, - initialized: false, - enabled: true, - xssRegexIgnore: new RegExp('^/api/v1/data\.result.data$'), - format: function(state) { void(state); return 'json'; }, - options: function(state) { void(state); return ''; }, - legend: function(state) { void(state); return null; }, - autoresize: function(state) { void(state); return false; }, - max_updates_to_recreate: function(state) { void(state); return 5000; }, - track_colors: function(state) { void(state); return false; }, - pixels_per_point: function(state) { void(state); return 3; }, - container_class: function(state) { void(state); return 'netdata-container'; } - }, - "c3": { - initialize: NETDATA.c3Initialize, - create: NETDATA.c3ChartCreate, - update: NETDATA.c3ChartUpdate, - resize: null, - setSelection: undefined, // function(state, t) { void(state); return true; }, - clearSelection: undefined, // function(state) { void(state); return true; }, - toolboxPanAndZoom: null, - initialized: false, - enabled: true, - xssRegexIgnore: new RegExp('^/api/v1/data\.result$'), - format: function(state) { void(state); return 'csvjsonarray'; }, - options: function(state) { void(state); return 'milliseconds'; }, - legend: function(state) { void(state); return null; }, - autoresize: function(state) { void(state); return false; }, - max_updates_to_recreate: function(state) { void(state); return 5000; }, - track_colors: function(state) { void(state); return false; }, - pixels_per_point: function(state) { void(state); return 15; }, - container_class: function(state) { void(state); return 'netdata-container'; } - }, - "d3pie": { - initialize: NETDATA.d3pieInitialize, - create: NETDATA.d3pieChartCreate, - update: NETDATA.d3pieChartUpdate, - resize: null, - setSelection: NETDATA.d3pieSetSelection, - clearSelection: NETDATA.d3pieClearSelection, - toolboxPanAndZoom: null, - initialized: false, - enabled: true, - xssRegexIgnore: new RegExp('^/api/v1/data\.result.data$'), - format: function(state) { void(state); return 'json'; }, - options: function(state) { void(state); return 'objectrows' + '%7C' + 'ms'; }, - legend: function(state) { void(state); return null; }, - autoresize: function(state) { void(state); return false; }, - max_updates_to_recreate: function(state) { void(state); return 5000; }, - track_colors: function(state) { void(state); return false; }, - pixels_per_point: function(state) { void(state); return 15; }, - container_class: function(state) { void(state); return 'netdata-container'; } - }, - "d3": { - initialize: NETDATA.d3Initialize, - create: NETDATA.d3ChartCreate, - update: NETDATA.d3ChartUpdate, - resize: null, - setSelection: undefined, // function(state, t) { void(state); return true; }, - clearSelection: undefined, // function(state) { void(state); return true; }, - toolboxPanAndZoom: null, - initialized: false, - enabled: true, - xssRegexIgnore: new RegExp('^/api/v1/data\.result.data$'), - format: function(state) { void(state); return 'json'; }, - options: function(state) { void(state); return ''; }, - legend: function(state) { void(state); return null; }, - autoresize: function(state) { void(state); return false; }, - max_updates_to_recreate: function(state) { void(state); return 5000; }, - track_colors: function(state) { void(state); return false; }, - pixels_per_point: function(state) { void(state); return 3; }, - container_class: function(state) { void(state); return 'netdata-container'; } - }, - "easypiechart": { - initialize: NETDATA.easypiechartInitialize, - create: NETDATA.easypiechartChartCreate, - update: NETDATA.easypiechartChartUpdate, - resize: null, - setSelection: NETDATA.easypiechartSetSelection, - clearSelection: NETDATA.easypiechartClearSelection, - toolboxPanAndZoom: null, - initialized: false, - enabled: true, - xssRegexIgnore: new RegExp('^/api/v1/data\.result$'), - format: function(state) { void(state); return 'array'; }, - options: function(state) { void(state); return 'absolute'; }, - legend: function(state) { void(state); return null; }, - autoresize: function(state) { void(state); return false; }, - max_updates_to_recreate: function(state) { void(state); return 5000; }, - track_colors: function(state) { void(state); return true; }, - pixels_per_point: function(state) { void(state); return 3; }, - aspect_ratio: 100, - container_class: function(state) { void(state); return 'netdata-container-easypiechart'; } - }, - "gauge": { - initialize: NETDATA.gaugeInitialize, - create: NETDATA.gaugeChartCreate, - update: NETDATA.gaugeChartUpdate, - resize: null, - setSelection: NETDATA.gaugeSetSelection, - clearSelection: NETDATA.gaugeClearSelection, - toolboxPanAndZoom: null, - initialized: false, - enabled: true, - xssRegexIgnore: new RegExp('^/api/v1/data\.result$'), - format: function(state) { void(state); return 'array'; }, - options: function(state) { void(state); return 'absolute'; }, - legend: function(state) { void(state); return null; }, - autoresize: function(state) { void(state); return false; }, - max_updates_to_recreate: function(state) { void(state); return 5000; }, - track_colors: function(state) { void(state); return true; }, - pixels_per_point: function(state) { void(state); return 3; }, - aspect_ratio: 60, - container_class: function(state) { void(state); return 'netdata-container-gauge'; } } - }; - NETDATA.registerChartLibrary = function(library, url) { - if(NETDATA.options.debug.libraries === true) - console.log("registering chart library: " + library); + return false; + }, - NETDATA.chartLibraries[library].url = url; - NETDATA.chartLibraries[library].initialized = true; - NETDATA.chartLibraries[library].enabled = true; - }; + activeForRecipients: function () { + let active = {}; + let data = NETDATA.alarms.current; - // ---------------------------------------------------------------------------------------------------------------- - // Load required JS libraries and CSS + if (typeof data === 'undefined' || data === null) { + return active; + } - NETDATA.requiredJs = [ - { - url: NETDATA.serverStatic + 'lib/bootstrap-3.3.7.min.js', - async: false, - isAlreadyLoaded: function() { - // check if bootstrap is loaded - if(typeof $().emulateTransitionEnd === 'function') - return true; - else { - return (typeof netdataNoBootstrap !== 'undefined' && netdataNoBootstrap === true); - } - } - }, - { - url: NETDATA.serverStatic + 'lib/fontawesome-all-5.0.1.min.js', - async: true, - isAlreadyLoaded: function() { - return (typeof netdataNoFontAwesome !== 'undefined' && netdataNoFontAwesome === true); + for (let x in data.alarms) { + if (!data.alarms.hasOwnProperty(x)) { + continue; } - }, - { - url: NETDATA.serverStatic + 'lib/perfect-scrollbar-0.6.15.min.js', - isAlreadyLoaded: function() { return false; } - } - ]; - NETDATA.requiredCSS = [ - { - url: NETDATA.themes.current.bootstrap_css, - isAlreadyLoaded: function() { - return (typeof netdataNoBootstrap !== 'undefined' && netdataNoBootstrap === true); + let alarm = data.alarms[x]; + if ((alarm.status === 'WARNING' || alarm.status === 'CRITICAL') && NETDATA.alarms.recipientMatches(alarm.recipient, NETDATA.alarms.recipients)) { + active[x] = alarm; } - }, - { - url: NETDATA.themes.current.dashboard_css, - isAlreadyLoaded: function() { return false; } } - ]; - NETDATA.loadedRequiredJs = 0; - NETDATA.loadRequiredJs = function(index, callback) { - if(index >= NETDATA.requiredJs.length) { - if(typeof callback === 'function') - return callback(); - return; - } + return active; + }, - if(NETDATA.requiredJs[index].isAlreadyLoaded()) { - NETDATA.loadedRequiredJs++; - NETDATA.loadRequiredJs(++index, callback); + notify: function (entry) { + // console.log('alarm ' + entry.unique_id); + + if (entry.updated) { + // console.log('alarm ' + entry.unique_id + ' has been updated by another alarm'); return; } - if(NETDATA.options.debug.main_loop === true) - console.log('loading ' + NETDATA.requiredJs[index].url); + let value_string = entry.value_string; - var async = true; - if(typeof NETDATA.requiredJs[index].async !== 'undefined' && NETDATA.requiredJs[index].async === false) - async = false; + if (NETDATA.alarms.current !== null) { + // get the current value_string + let t = NETDATA.alarms.current.alarms[entry.chart + '.' + entry.name]; + if (typeof t !== 'undefined' && entry.status === t.status && typeof t.value_string !== 'undefined') { + value_string = t.value_string; + } + } - $.ajax({ - url: NETDATA.requiredJs[index].url, - cache: true, - dataType: "script", - xhrFields: { withCredentials: true } // required for the cookie - }) - .done(function() { - if(NETDATA.options.debug.main_loop === true) - console.log('loaded ' + NETDATA.requiredJs[index].url); - }) - .fail(function() { - alert('Cannot load required JS library: ' + NETDATA.requiredJs[index].url); - }) - .always(function() { - NETDATA.loadedRequiredJs++; + let name = entry.name.replace(/_/g, ' '); + let status = entry.status.toLowerCase(); + let title = name + ' = ' + value_string.toString(); + let tag = entry.alarm_id; + let icon = 'images/banner-icon-144x144.png'; + let interaction = false; + let data = entry; + let show = true; - if(async === false) - NETDATA.loadRequiredJs(++index, callback); - }); + // console.log('alarm ' + entry.unique_id + ' ' + entry.chart + '.' + entry.name + ' is ' + entry.status); - if(async === true) - NETDATA.loadRequiredJs(++index, callback); - }; + switch (entry.status) { + case 'REMOVED': + show = false; + break; - NETDATA.loadRequiredCSS = function(index) { - if(index >= NETDATA.requiredCSS.length) - return; + case 'UNDEFINED': + return; - if(NETDATA.requiredCSS[index].isAlreadyLoaded()) { - NETDATA.loadRequiredCSS(++index); - return; - } + case 'UNINITIALIZED': + return; - if(NETDATA.options.debug.main_loop === true) - console.log('loading ' + NETDATA.requiredCSS[index].url); + case 'CLEAR': + if (entry.unique_id < NETDATA.alarms.first_notification_id) { + // console.log('alarm ' + entry.unique_id + ' is not current'); + return; + } + if (entry.old_status === 'UNINITIALIZED' || entry.old_status === 'UNDEFINED') { + // console.log('alarm' + entry.unique_id + ' switch to CLEAR from ' + entry.old_status); + return; + } + if (entry.no_clear_notification) { + // console.log('alarm' + entry.unique_id + ' is CLEAR but has no_clear_notification flag'); + return; + } + title = name + ' back to normal (' + value_string.toString() + ')'; + icon = 'images/check-mark-2-128-green.png'; + interaction = false; + break; - NETDATA._loadCSS(NETDATA.requiredCSS[index].url); - NETDATA.loadRequiredCSS(++index); - }; + case 'WARNING': + if (entry.old_status === 'CRITICAL') { + status = 'demoted to ' + entry.status.toLowerCase(); + } + icon = 'images/alert-128-orange.png'; + interaction = false; + break; - // ---------------------------------------------------------------------------------------------------------------- - // Registry of netdata hosts + case 'CRITICAL': + if (entry.old_status === 'WARNING') { + status = 'escalated to ' + entry.status.toLowerCase(); + } - NETDATA.alarms = { - onclick: null, // the callback to handle the click - it will be called with the alarm log entry - chart_div_offset: -50, // give that space above the chart when scrolling to it - chart_div_id_prefix: 'chart_', // the chart DIV IDs have this prefix (they should be NETDATA.name2id(chart.id)) - chart_div_animation_duration: 0,// the duration of the animation while scrolling to a chart + icon = 'images/alert-128-red.png'; + interaction = true; + break; - ms_penalty: 0, // the time penalty of the next alarm - ms_between_notifications: 500, // firefox moves the alarms off-screen (above, outside the top of the screen) - // if alarms are shown faster than: one per 500ms + default: + console.log('invalid alarm status ' + entry.status); + return; + } - update_every: 10000, // the time in ms between alarm checks + // filter recipients + if (show) { + show = NETDATA.alarms.recipientMatches(entry.recipient, NETDATA.alarms.recipients); + } - notifications: false, // when true, the browser supports notifications (may not be granted though) - last_notification_id: 0, // the id of the last alarm_log we have raised an alarm for - first_notification_id: 0, // the id of the first alarm_log entry for this session - // this is used to prevent CLEAR notifications for past events - // notifications_shown: [], + /* + // cleanup old notifications with the same alarm_id as this one + // it does not seem to work on any web browser - so notifications cannot be removed - server: null, // the server to connect to for fetching alarms - current: null, // the list of raised alarms - updated in the background + let len = NETDATA.alarms.notifications_shown.length; + while (len--) { + let n = NETDATA.alarms.notifications_shown[len]; + if (n.data.alarm_id === entry.alarm_id) { + console.log('removing old alarm ' + n.data.unique_id); - // a callback function to call every time the list of raised alarms is refreshed - callback: (typeof netdataAlarmsActiveCallback === 'function')?netdataAlarmsActiveCallback:null, + // close the notification + n.close.bind(n); - // a callback function to call every time a notification is shown - // the return value is used to decide if the notification will be shown - notificationCallback: (typeof netdataAlarmsNotifCallback === 'function')?netdataAlarmsNotifCallback:null, + // remove it from the array + NETDATA.alarms.notifications_shown.splice(len, 1); + len = NETDATA.alarms.notifications_shown.length; + } + } + */ - recipients: null, // the list (array) of recipients to show alarms for, or null + if (show) { + if (typeof NETDATA.alarms.notificationCallback === 'function') { + show = NETDATA.alarms.notificationCallback(entry); + } - recipientMatches: function(to_string, wanted_array) { - if(typeof wanted_array === 'undefined' || wanted_array === null || Array.isArray(wanted_array) === false) - return true; + if (show) { + setTimeout(function () { + // show this notification + // console.log('new notification: ' + title); + let n = new Notification(title, { + body: entry.hostname + ' - ' + entry.chart + ' (' + entry.family + ') - ' + status + ': ' + entry.info, + tag: tag, + requireInteraction: interaction, + icon: NETDATA.serverStatic + icon, + data: data + }); - var r = ' ' + to_string.toString() + ' '; - var len = wanted_array.length; - while(len--) { - if(r.indexOf(' ' + wanted_array[len] + ' ') >= 0) - return true; - } + n.onclick = function (event) { + event.preventDefault(); + NETDATA.alarms.onclick(event.target.data); + }; - return false; - }, + // console.log(n); + // NETDATA.alarms.notifications_shown.push(n); + // console.log(entry); + }, NETDATA.alarms.ms_penalty); - activeForRecipients: function() { - var active = {}; - var data = NETDATA.alarms.current; + NETDATA.alarms.ms_penalty += NETDATA.alarms.ms_between_notifications; + } + } + }, - if(typeof data === 'undefined' || data === null) - return active; + scrollToChart: function (chart_id) { + if (typeof chart_id === 'string') { + let offset = $('#' + NETDATA.alarms.chart_div_id_prefix + NETDATA.name2id(chart_id)).offset(); + if (typeof offset !== 'undefined') { + $('html, body').animate({scrollTop: offset.top + NETDATA.alarms.chart_div_offset}, NETDATA.alarms.chart_div_animation_duration); + return true; + } + } + return false; + }, - for(var x in data.alarms) { - if(!data.alarms.hasOwnProperty(x)) continue; + scrollToAlarm: function (alarm) { + if (typeof alarm === 'object') { + let ret = NETDATA.alarms.scrollToChart(alarm.chart); - var alarm = data.alarms[x]; - if((alarm.status === 'WARNING' || alarm.status === 'CRITICAL') && NETDATA.alarms.recipientMatches(alarm.recipient, NETDATA.alarms.recipients)) - active[x] = alarm; + if (ret && NETDATA.options.page_is_visible === false) { + window.focus(); } + // alert('netdata dashboard will now scroll to chart: ' + alarm.chart + '\n\nThis alarm opened to bring the browser window in front of the screen. Click on the dashboard to prevent it from appearing again.'); + } - return active; - }, + }, - notify: function(entry) { - // console.log('alarm ' + entry.unique_id); + notifyAll: function () { + // console.log('FETCHING ALARM LOG'); + NETDATA.alarms.get_log(NETDATA.alarms.last_notification_id, function (data) { + // console.log('ALARM LOG FETCHED'); - if(entry.updated === true) { - // console.log('alarm ' + entry.unique_id + ' has been updated by another alarm'); + if (data === null || typeof data !== 'object') { + console.log('invalid alarms log response'); return; } - var value_string = entry.value_string; - - if(NETDATA.alarms.current !== null) { - // get the current value_string - var t = NETDATA.alarms.current.alarms[entry.chart + '.' + entry.name]; - if(typeof t !== 'undefined' && entry.status === t.status && typeof t.value_string !== 'undefined') - value_string = t.value_string; + if (data.length === 0) { + console.log('received empty alarm log'); + return; } - var name = entry.name.replace(/_/g, ' '); - var status = entry.status.toLowerCase(); - var title = name + ' = ' + value_string.toString(); - var tag = entry.alarm_id; - var icon = 'images/seo-performance-128.png'; - var interaction = false; - var data = entry; - var show = true; + // console.log('received alarm log of ' + data.length + ' entries, from ' + data[data.length - 1].unique_id.toString() + ' to ' + data[0].unique_id.toString()); - // console.log('alarm ' + entry.unique_id + ' ' + entry.chart + '.' + entry.name + ' is ' + entry.status); + data.sort(function (a, b) { + if (a.unique_id > b.unique_id) { + return -1; + } + if (a.unique_id < b.unique_id) { + return 1; + } + return 0; + }); - switch(entry.status) { - case 'REMOVED': - show = false; - break; + NETDATA.alarms.ms_penalty = 0; - case 'UNDEFINED': - return; + let len = data.length; + while (len--) { + if (data[len].unique_id > NETDATA.alarms.last_notification_id) { + NETDATA.alarms.notify(data[len]); + } + //else + // console.log('ignoring alarm (older) with id ' + data[len].unique_id.toString()); + } - case 'UNINITIALIZED': - return; + NETDATA.alarms.last_notification_id = data[0].unique_id; - case 'CLEAR': - if(entry.unique_id < NETDATA.alarms.first_notification_id) { - // console.log('alarm ' + entry.unique_id + ' is not current'); - return; - } - if(entry.old_status === 'UNINITIALIZED' || entry.old_status === 'UNDEFINED') { - // console.log('alarm' + entry.unique_id + ' switch to CLEAR from ' + entry.old_status); - return; - } - if(entry.no_clear_notification === true) { - // console.log('alarm' + entry.unique_id + ' is CLEAR but has no_clear_notification flag'); - return; - } - title = name + ' back to normal (' + value_string.toString() + ')'; - icon = 'images/check-mark-2-128-green.png'; - interaction = false; - break; - - case 'WARNING': - if(entry.old_status === 'CRITICAL') - status = 'demoted to ' + entry.status.toLowerCase(); - - icon = 'images/alert-128-orange.png'; - interaction = false; - break; - - case 'CRITICAL': - if(entry.old_status === 'WARNING') - status = 'escalated to ' + entry.status.toLowerCase(); - - icon = 'images/alert-128-red.png'; - interaction = true; - break; - - default: - console.log('invalid alarm status ' + entry.status); - return; + if (typeof netdataAlarmsRemember === 'undefined' || netdataAlarmsRemember) { + NETDATA.localStorageSet('last_notification_id', NETDATA.alarms.last_notification_id, null); } + // console.log('last notification id = ' + NETDATA.alarms.last_notification_id); + }) + }, - // filter recipients - if(show === true) - show = NETDATA.alarms.recipientMatches(entry.recipient, NETDATA.alarms.recipients); + check_notifications: function () { + // returns true if we should fire 1+ notifications - /* - // cleanup old notifications with the same alarm_id as this one - // it does not seem to work on any web browser - so notifications cannot be removed + if (NETDATA.alarms.notifications !== true) { + // console.log('web notifications are not available'); + return false; + } - var len = NETDATA.alarms.notifications_shown.length; - while(len--) { - var n = NETDATA.alarms.notifications_shown[len]; - if(n.data.alarm_id === entry.alarm_id) { - console.log('removing old alarm ' + n.data.unique_id); + if (Notification.permission !== 'granted') { + // console.log('web notifications are not granted'); + return false; + } - // close the notification - n.close.bind(n); + if (typeof NETDATA.alarms.current !== 'undefined' && typeof NETDATA.alarms.current.alarms === 'object') { + // console.log('can do alarms: old id = ' + NETDATA.alarms.last_notification_id + ' new id = ' + NETDATA.alarms.current.latest_alarm_log_unique_id); - // remove it from the array - NETDATA.alarms.notifications_shown.splice(len, 1); - len = NETDATA.alarms.notifications_shown.length; - } + if (NETDATA.alarms.current.latest_alarm_log_unique_id > NETDATA.alarms.last_notification_id) { + // console.log('new alarms detected'); + return true; } - */ - - if(show === true) { - if(typeof NETDATA.alarms.notificationCallback === 'function') - show = NETDATA.alarms.notificationCallback(entry); - - if(show === true) { - setTimeout(function() { - // show this notification - // console.log('new notification: ' + title); - var n = new Notification(title, { - body: entry.hostname + ' - ' + entry.chart + ' (' + entry.family + ') - ' + status + ': ' + entry.info, - tag: tag, - requireInteraction: interaction, - icon: NETDATA.serverStatic + icon, - data: data - }); + //else console.log('no new alarms'); + } + // else console.log('cannot process alarms'); - n.onclick = function(event) { - event.preventDefault(); - NETDATA.alarms.onclick(event.target.data); - }; + return false; + }, - // console.log(n); - // NETDATA.alarms.notifications_shown.push(n); - // console.log(entry); - }, NETDATA.alarms.ms_penalty); + get: function (what, callback) { + $.ajax({ + url: NETDATA.alarms.server + '/api/v1/alarms?' + what.toString(), + async: true, + cache: false, + headers: { + 'Cache-Control': 'no-cache, no-store', + 'Pragma': 'no-cache' + }, + xhrFields: {withCredentials: true} // required for the cookie + }) + .done(function (data) { + data = NETDATA.xss.checkOptional('/api/v1/alarms', data /*, '.*\.(calc|calc_parsed|warn|warn_parsed|crit|crit_parsed)$' */); - NETDATA.alarms.ms_penalty += NETDATA.alarms.ms_between_notifications; + if (NETDATA.alarms.first_notification_id === 0 && typeof data.latest_alarm_log_unique_id === 'number') { + NETDATA.alarms.first_notification_id = data.latest_alarm_log_unique_id; } - } - }, - scrollToChart: function(chart_id) { - if(typeof chart_id === 'string') { - var offset = $('#' + NETDATA.alarms.chart_div_id_prefix + NETDATA.name2id(chart_id)).offset(); - if(typeof offset !== 'undefined') { - $('html, body').animate({ scrollTop: offset.top + NETDATA.alarms.chart_div_offset }, NETDATA.alarms.chart_div_animation_duration); - return true; + if (typeof callback === 'function') { + return callback(data); } - } - return false; - }, + }) + .fail(function () { + NETDATA.error(415, NETDATA.alarms.server); - scrollToAlarm: function(alarm) { - if(typeof alarm === 'object') { - var ret = NETDATA.alarms.scrollToChart(alarm.chart); + if (typeof callback === 'function') { + return callback(null); + } + }); + }, - if(ret === true && NETDATA.options.page_is_visible === false) - window.focus(); - // alert('netdata dashboard will now scroll to chart: ' + alarm.chart + '\n\nThis alarm opened to bring the browser window in front of the screen. Click on the dashboard to prevent it from appearing again.'); - } + update_forever: function () { + if (netdataShowAlarms !== true || netdataSnapshotData !== null) { + return; + } - }, + NETDATA.alarms.get('active', function (data) { + if (data !== null) { + NETDATA.alarms.current = data; - notifyAll: function() { - // console.log('FETCHING ALARM LOG'); - NETDATA.alarms.get_log(NETDATA.alarms.last_notification_id, function(data) { - // console.log('ALARM LOG FETCHED'); + if (NETDATA.alarms.check_notifications()) { + NETDATA.alarms.notifyAll(); + } - if(data === null || typeof data !== 'object') { - console.log('invalid alarms log response'); - return; + if (typeof NETDATA.alarms.callback === 'function') { + NETDATA.alarms.callback(data); } - if(data.length === 0) { - console.log('received empty alarm log'); + // Health monitoring is disabled on this netdata + if (data.status === false) { return; } + } - // console.log('received alarm log of ' + data.length + ' entries, from ' + data[data.length - 1].unique_id.toString() + ' to ' + data[0].unique_id.toString()); + setTimeout(NETDATA.alarms.update_forever, NETDATA.alarms.update_every); + }); + }, - data.sort(function(a, b) { - if(a.unique_id > b.unique_id) return -1; - if(a.unique_id < b.unique_id) return 1; - return 0; - }); + get_log: function (last_id, callback) { + // console.log('fetching all log after ' + last_id.toString()); + $.ajax({ + url: NETDATA.alarms.server + '/api/v1/alarm_log?after=' + last_id.toString(), + async: true, + cache: false, + headers: { + 'Cache-Control': 'no-cache, no-store', + 'Pragma': 'no-cache' + }, + xhrFields: {withCredentials: true} // required for the cookie + }) + .done(function (data) { + data = NETDATA.xss.checkOptional('/api/v1/alarm_log', data); - NETDATA.alarms.ms_penalty = 0; + if (typeof callback === 'function') { + return callback(data); + } + }) + .fail(function () { + NETDATA.error(416, NETDATA.alarms.server); - var len = data.length; - while(len--) { - if(data[len].unique_id > NETDATA.alarms.last_notification_id) { - NETDATA.alarms.notify(data[len]); - } - //else - // console.log('ignoring alarm (older) with id ' + data[len].unique_id.toString()); + if (typeof callback === 'function') { + return callback(null); } + }); + }, - NETDATA.alarms.last_notification_id = data[0].unique_id; + init: function () { + NETDATA.alarms.server = NETDATA.fixHost(NETDATA.serverDefault); - if(typeof netdataAlarmsRemember === 'undefined' || netdataAlarmsRemember === true) - NETDATA.localStorageSet('last_notification_id', NETDATA.alarms.last_notification_id, null); - // console.log('last notification id = ' + NETDATA.alarms.last_notification_id); - }) - }, + if (typeof netdataAlarmsRemember === 'undefined' || netdataAlarmsRemember) { + NETDATA.alarms.last_notification_id = + NETDATA.localStorageGet('last_notification_id', NETDATA.alarms.last_notification_id, null); + } - check_notifications: function() { - // returns true if we should fire 1+ notifications + if (NETDATA.alarms.onclick === null) { + NETDATA.alarms.onclick = NETDATA.alarms.scrollToAlarm; + } - if(NETDATA.alarms.notifications !== true) { - // console.log('web notifications are not available'); - return false; - } + if (typeof netdataAlarmsRecipients !== 'undefined' && Array.isArray(netdataAlarmsRecipients)) { + NETDATA.alarms.recipients = netdataAlarmsRecipients; + } - if(Notification.permission !== 'granted') { - // console.log('web notifications are not granted'); - return false; - } + if (netdataShowAlarms) { + NETDATA.alarms.update_forever(); - if(typeof NETDATA.alarms.current !== 'undefined' && typeof NETDATA.alarms.current.alarms === 'object') { - // console.log('can do alarms: old id = ' + NETDATA.alarms.last_notification_id + ' new id = ' + NETDATA.alarms.current.latest_alarm_log_unique_id); + if ('Notification' in window) { + // console.log('notifications available'); + NETDATA.alarms.notifications = true; - if(NETDATA.alarms.current.latest_alarm_log_unique_id > NETDATA.alarms.last_notification_id) { - // console.log('new alarms detected'); - return true; + if (Notification.permission === 'default') { + Notification.requestPermission(); } - //else console.log('no new alarms'); } - // else console.log('cannot process alarms'); + } + } +}; + +// Registry of netdata hosts + +NETDATA.registry = { + server: null, // the netdata registry server + person_guid: null, // the unique ID of this browser / user + machine_guid: null, // the unique ID the netdata server that served dashboard.js + hostname: 'unknown', // the hostname of the netdata server that served dashboard.js + machines: null, // the user's other URLs + machines_array: null, // the user's other URLs in an array + person_urls: null, + + parsePersonUrls: function (person_urls) { + // console.log(person_urls); + NETDATA.registry.person_urls = person_urls; + + if (person_urls) { + NETDATA.registry.machines = {}; + NETDATA.registry.machines_array = []; + + let apu = person_urls; + let i = apu.length; + while (i--) { + if (typeof NETDATA.registry.machines[apu[i][0]] === 'undefined') { + // console.log('adding: ' + apu[i][4] + ', ' + ((now - apu[i][2]) / 1000).toString()); + + let obj = { + guid: apu[i][0], + url: apu[i][1], + last_t: apu[i][2], + accesses: apu[i][3], + name: apu[i][4], + alternate_urls: [] + }; + obj.alternate_urls.push(apu[i][1]); + + NETDATA.registry.machines[apu[i][0]] = obj; + NETDATA.registry.machines_array.push(obj); + } else { + // console.log('appending: ' + apu[i][4] + ', ' + ((now - apu[i][2]) / 1000).toString()); + + let pu = NETDATA.registry.machines[apu[i][0]]; + if (pu.last_t < apu[i][2]) { + pu.url = apu[i][1]; + pu.last_t = apu[i][2]; + pu.name = apu[i][4]; + } + pu.accesses += apu[i][3]; + pu.alternate_urls.push(apu[i][1]); + } + } + } - return false; - }, + if (typeof netdataRegistryCallback === 'function') { + netdataRegistryCallback(NETDATA.registry.machines_array); + } + }, - get: function(what, callback) { - $.ajax({ - url: NETDATA.alarms.server + '/api/v1/alarms?' + what.toString(), - async: true, - cache: false, - headers: { - 'Cache-Control': 'no-cache, no-store', - 'Pragma': 'no-cache' - }, - xhrFields: { withCredentials: true } // required for the cookie - }) - .done(function(data) { - data = NETDATA.xss.checkOptional('/api/v1/alarms', data /*, '.*\.(calc|calc_parsed|warn|warn_parsed|crit|crit_parsed)$' */); + init: function () { + if (netdataRegistry !== true) { + return; + } - if(NETDATA.alarms.first_notification_id === 0 && typeof data.latest_alarm_log_unique_id === 'number') - NETDATA.alarms.first_notification_id = data.latest_alarm_log_unique_id; + NETDATA.registry.hello(NETDATA.serverDefault, function (data) { + if (data) { + NETDATA.registry.server = data.registry; + NETDATA.registry.machine_guid = data.machine_guid; + NETDATA.registry.hostname = data.hostname; - if(typeof callback === 'function') - return callback(data); - }) - .fail(function() { - NETDATA.error(415, NETDATA.alarms.server); + NETDATA.registry.access(2, function (person_urls) { + NETDATA.registry.parsePersonUrls(person_urls); - if(typeof callback === 'function') - return callback(null); }); - }, - - update_forever: function() { - if(netdataShowAlarms !== true || netdataSnapshotData !== null) - return; - - NETDATA.alarms.get('active', function(data) { - if(data !== null) { - NETDATA.alarms.current = data; + } + }); + }, - if(NETDATA.alarms.check_notifications() === true) { - NETDATA.alarms.notifyAll(); - } + hello: function (host, callback) { + host = NETDATA.fixHost(host); - if (typeof NETDATA.alarms.callback === 'function') { - NETDATA.alarms.callback(data); - } + // send HELLO to a netdata server: + // 1. verifies the server is reachable + // 2. responds with the registry URL, the machine GUID of this netdata server and its hostname + $.ajax({ + url: host + '/api/v1/registry?action=hello', + async: true, + cache: false, + headers: { + 'Cache-Control': 'no-cache, no-store', + 'Pragma': 'no-cache' + }, + xhrFields: {withCredentials: true} // required for the cookie + }) + .done(function (data) { + data = NETDATA.xss.checkOptional('/api/v1/registry?action=hello', data); - // Health monitoring is disabled on this netdata - if(data.status === false) return; + if (typeof data.status !== 'string' || data.status !== 'ok') { + NETDATA.error(408, host + ' response: ' + JSON.stringify(data)); + data = null; } - setTimeout(NETDATA.alarms.update_forever, NETDATA.alarms.update_every); - }); - }, - - get_log: function(last_id, callback) { - // console.log('fetching all log after ' + last_id.toString()); - $.ajax({ - url: NETDATA.alarms.server + '/api/v1/alarm_log?after=' + last_id.toString(), - async: true, - cache: false, - headers: { - 'Cache-Control': 'no-cache, no-store', - 'Pragma': 'no-cache' - }, - xhrFields: { withCredentials: true } // required for the cookie + if (typeof callback === 'function') { + return callback(data); + } }) - .done(function(data) { - data = NETDATA.xss.checkOptional('/api/v1/alarm_log', data); - - if(typeof callback === 'function') - return callback(data); - }) - .fail(function() { - NETDATA.error(416, NETDATA.alarms.server); - - if(typeof callback === 'function') - return callback(null); - }); - }, - - init: function() { - NETDATA.alarms.server = NETDATA.fixHost(NETDATA.serverDefault); - - if(typeof netdataAlarmsRemember === 'undefined' || netdataAlarmsRemember === true) { - NETDATA.alarms.last_notification_id = - NETDATA.localStorageGet('last_notification_id', NETDATA.alarms.last_notification_id, null); - } - - if(NETDATA.alarms.onclick === null) - NETDATA.alarms.onclick = NETDATA.alarms.scrollToAlarm; + .fail(function () { + NETDATA.error(407, host); - if(typeof netdataAlarmsRecipients !== 'undefined' && Array.isArray(netdataAlarmsRecipients)) - NETDATA.alarms.recipients = netdataAlarmsRecipients; + if (typeof callback === 'function') { + return callback(null); + } + }); + }, + + access: function (max_redirects, callback) { + // send ACCESS to a netdata registry: + // 1. it lets it know we are accessing a netdata server (its machine GUID and its URL) + // 2. it responds with a list of netdata servers we know + // the registry identifies us using a cookie it sets the first time we access it + // the registry may respond with a redirect URL to send us to another registry + $.ajax({ + url: NETDATA.registry.server + '/api/v1/registry?action=access&machine=' + NETDATA.registry.machine_guid + '&name=' + encodeURIComponent(NETDATA.registry.hostname) + '&url=' + encodeURIComponent(NETDATA.serverDefault), // + '&visible_url=' + encodeURIComponent(document.location), + async: true, + cache: false, + headers: { + 'Cache-Control': 'no-cache, no-store', + 'Pragma': 'no-cache' + }, + xhrFields: {withCredentials: true} // required for the cookie + }) + .done(function (data) { + data = NETDATA.xss.checkAlways('/api/v1/registry?action=access', data); - if(netdataShowAlarms === true) { - NETDATA.alarms.update_forever(); - - if('Notification' in window) { - // console.log('notifications available'); - NETDATA.alarms.notifications = true; + let redirect = null; + if (typeof data.registry === 'string') { + redirect = data.registry; + } - if(Notification.permission === 'default') - Notification.requestPermission(); + if (typeof data.status !== 'string' || data.status !== 'ok') { + NETDATA.error(409, NETDATA.registry.server + ' responded with: ' + JSON.stringify(data)); + data = null; } - } - } - }; - // ---------------------------------------------------------------------------------------------------------------- - // Registry of netdata hosts - - NETDATA.registry = { - server: null, // the netdata registry server - person_guid: null, // the unique ID of this browser / user - machine_guid: null, // the unique ID the netdata server that served dashboard.js - hostname: 'unknown', // the hostname of the netdata server that served dashboard.js - machines: null, // the user's other URLs - machines_array: null, // the user's other URLs in an array - person_urls: null, - - parsePersonUrls: function(person_urls) { - // console.log(person_urls); - NETDATA.registry.person_urls = person_urls; - - if(person_urls) { - NETDATA.registry.machines = {}; - NETDATA.registry.machines_array = []; - - var apu = person_urls; - var i = apu.length; - while(i--) { - if(typeof NETDATA.registry.machines[apu[i][0]] === 'undefined') { - // console.log('adding: ' + apu[i][4] + ', ' + ((now - apu[i][2]) / 1000).toString()); - - var obj = { - guid: apu[i][0], - url: apu[i][1], - last_t: apu[i][2], - accesses: apu[i][3], - name: apu[i][4], - alternate_urls: [] - }; - obj.alternate_urls.push(apu[i][1]); - - NETDATA.registry.machines[apu[i][0]] = obj; - NETDATA.registry.machines_array.push(obj); + if (data === null) { + if (redirect !== null && max_redirects > 0) { + NETDATA.registry.server = redirect; + NETDATA.registry.access(max_redirects - 1, callback); } else { - // console.log('appending: ' + apu[i][4] + ', ' + ((now - apu[i][2]) / 1000).toString()); - - var pu = NETDATA.registry.machines[apu[i][0]]; - if(pu.last_t < apu[i][2]) { - pu.url = apu[i][1]; - pu.last_t = apu[i][2]; - pu.name = apu[i][4]; + if (typeof callback === 'function') { + return callback(null); } - pu.accesses += apu[i][3]; - pu.alternate_urls.push(apu[i][1]); } } - } + else { + if (typeof data.person_guid === 'string') { + NETDATA.registry.person_guid = data.person_guid; + } - if(typeof netdataRegistryCallback === 'function') - netdataRegistryCallback(NETDATA.registry.machines_array); - }, + if (typeof callback === 'function') { + return callback(data.urls); + } + } + }) + .fail(function () { + NETDATA.error(410, NETDATA.registry.server); - init: function() { - if(netdataRegistry !== true) return; + if (typeof callback === 'function') { + return callback(null); + } + }); + }, + + delete: function (delete_url, callback) { + // send DELETE to a netdata registry: + $.ajax({ + url: NETDATA.registry.server + '/api/v1/registry?action=delete&machine=' + NETDATA.registry.machine_guid + '&name=' + encodeURIComponent(NETDATA.registry.hostname) + '&url=' + encodeURIComponent(NETDATA.serverDefault) + '&delete_url=' + encodeURIComponent(delete_url), + async: true, + cache: false, + headers: { + 'Cache-Control': 'no-cache, no-store', + 'Pragma': 'no-cache' + }, + xhrFields: {withCredentials: true} // required for the cookie + }) + .done(function (data) { + data = NETDATA.xss.checkAlways('/api/v1/registry?action=delete', data); - NETDATA.registry.hello(NETDATA.serverDefault, function(data) { - if(data) { - NETDATA.registry.server = data.registry; - NETDATA.registry.machine_guid = data.machine_guid; - NETDATA.registry.hostname = data.hostname; + if (typeof data.status !== 'string' || data.status !== 'ok') { + NETDATA.error(411, NETDATA.registry.server + ' responded with: ' + JSON.stringify(data)); + data = null; + } - NETDATA.registry.access(2, function (person_urls) { - NETDATA.registry.parsePersonUrls(person_urls); + if (typeof callback === 'function') { + return callback(data); + } + }) + .fail(function () { + NETDATA.error(412, NETDATA.registry.server); - }); + if (typeof callback === 'function') { + return callback(null); } }); - }, - - hello: function(host, callback) { - host = NETDATA.fixHost(host); + }, - // send HELLO to a netdata server: - // 1. verifies the server is reachable - // 2. responds with the registry URL, the machine GUID of this netdata server and its hostname - $.ajax({ - url: host + '/api/v1/registry?action=hello', - async: true, - cache: false, - headers: { - 'Cache-Control': 'no-cache, no-store', - 'Pragma': 'no-cache' - }, - xhrFields: { withCredentials: true } // required for the cookie - }) - .done(function(data) { - data = NETDATA.xss.checkOptional('/api/v1/registry?action=hello', data); + search: function (machine_guid, callback) { + // SEARCH for the URLs of a machine: + $.ajax({ + url: NETDATA.registry.server + '/api/v1/registry?action=search&machine=' + NETDATA.registry.machine_guid + '&name=' + encodeURIComponent(NETDATA.registry.hostname) + '&url=' + encodeURIComponent(NETDATA.serverDefault) + '&for=' + machine_guid, + async: true, + cache: false, + headers: { + 'Cache-Control': 'no-cache, no-store', + 'Pragma': 'no-cache' + }, + xhrFields: {withCredentials: true} // required for the cookie + }) + .done(function (data) { + data = NETDATA.xss.checkAlways('/api/v1/registry?action=search', data); - if(typeof data.status !== 'string' || data.status !== 'ok') { - NETDATA.error(408, host + ' response: ' + JSON.stringify(data)); - data = null; - } + if (typeof data.status !== 'string' || data.status !== 'ok') { + NETDATA.error(417, NETDATA.registry.server + ' responded with: ' + JSON.stringify(data)); + data = null; + } - if(typeof callback === 'function') - return callback(data); - }) - .fail(function() { - NETDATA.error(407, host); + if (typeof callback === 'function') { + return callback(data); + } + }) + .fail(function () { + NETDATA.error(418, NETDATA.registry.server); - if(typeof callback === 'function') - return callback(null); - }); - }, + if (typeof callback === 'function') { + return callback(null); + } + }); + }, - access: function(max_redirects, callback) { - // send ACCESS to a netdata registry: - // 1. it lets it know we are accessing a netdata server (its machine GUID and its URL) - // 2. it responds with a list of netdata servers we know - // the registry identifies us using a cookie it sets the first time we access it - // the registry may respond with a redirect URL to send us to another registry - $.ajax({ - url: NETDATA.registry.server + '/api/v1/registry?action=access&machine=' + NETDATA.registry.machine_guid + '&name=' + encodeURIComponent(NETDATA.registry.hostname) + '&url=' + encodeURIComponent(NETDATA.serverDefault), // + '&visible_url=' + encodeURIComponent(document.location), - async: true, - cache: false, - headers: { - 'Cache-Control': 'no-cache, no-store', - 'Pragma': 'no-cache' - }, - xhrFields: { withCredentials: true } // required for the cookie - }) - .done(function(data) { - data = NETDATA.xss.checkAlways('/api/v1/registry?action=access', data); + switch: function (new_person_guid, callback) { + // impersonate + $.ajax({ + url: NETDATA.registry.server + '/api/v1/registry?action=switch&machine=' + NETDATA.registry.machine_guid + '&name=' + encodeURIComponent(NETDATA.registry.hostname) + '&url=' + encodeURIComponent(NETDATA.serverDefault) + '&to=' + new_person_guid, + async: true, + cache: false, + headers: { + 'Cache-Control': 'no-cache, no-store', + 'Pragma': 'no-cache' + }, + xhrFields: {withCredentials: true} // required for the cookie + }) + .done(function (data) { + data = NETDATA.xss.checkAlways('/api/v1/registry?action=switch', data); - var redirect = null; - if(typeof data.registry === 'string') - redirect = data.registry; + if (typeof data.status !== 'string' || data.status !== 'ok') { + NETDATA.error(413, NETDATA.registry.server + ' responded with: ' + JSON.stringify(data)); + data = null; + } - if(typeof data.status !== 'string' || data.status !== 'ok') { - NETDATA.error(409, NETDATA.registry.server + ' responded with: ' + JSON.stringify(data)); - data = null; - } + if (typeof callback === 'function') { + return callback(data); + } + }) + .fail(function () { + NETDATA.error(414, NETDATA.registry.server); - if(data === null) { - if(redirect !== null && max_redirects > 0) { - NETDATA.registry.server = redirect; - NETDATA.registry.access(max_redirects - 1, callback); - } - else { - if(typeof callback === 'function') - return callback(null); - } - } - else { - if(typeof data.person_guid === 'string') - NETDATA.registry.person_guid = data.person_guid; + if (typeof callback === 'function') { + return callback(null); + } + }); + } +}; - if(typeof callback === 'function') - return callback(data.urls); - } - }) - .fail(function() { - NETDATA.error(410, NETDATA.registry.server); +// Load required JS libraries and CSS - if(typeof callback === 'function') - return callback(null); - }); - }, +NETDATA.requiredJs = [ + { + url: NETDATA.serverStatic + 'lib/bootstrap-3.3.7.min.js', + async: false, + isAlreadyLoaded: function () { + // check if bootstrap is loaded + if (typeof $().emulateTransitionEnd === 'function') { + return true; + } else { + return typeof netdataNoBootstrap !== 'undefined' && netdataNoBootstrap; + } + } + }, + { + url: NETDATA.serverStatic + 'lib/fontawesome-all-5.0.1.min.js', + async: true, + isAlreadyLoaded: function () { + return typeof netdataNoFontAwesome !== 'undefined' && netdataNoFontAwesome; + } + }, + { + url: NETDATA.serverStatic + 'lib/perfect-scrollbar-0.6.15.min.js', + isAlreadyLoaded: function () { + return false; + } + } +]; + +NETDATA.requiredCSS = [ + { + url: NETDATA.themes.current.bootstrap_css, + isAlreadyLoaded: function () { + return typeof netdataNoBootstrap !== 'undefined' && netdataNoBootstrap; + } + }, + { + url: NETDATA.themes.current.dashboard_css, + isAlreadyLoaded: function () { + return false; + } + } +]; - delete: function(delete_url, callback) { - // send DELETE to a netdata registry: - $.ajax({ - url: NETDATA.registry.server + '/api/v1/registry?action=delete&machine=' + NETDATA.registry.machine_guid + '&name=' + encodeURIComponent(NETDATA.registry.hostname) + '&url=' + encodeURIComponent(NETDATA.serverDefault) + '&delete_url=' + encodeURIComponent(delete_url), - async: true, - cache: false, - headers: { - 'Cache-Control': 'no-cache, no-store', - 'Pragma': 'no-cache' - }, - xhrFields: { withCredentials: true } // required for the cookie - }) - .done(function(data) { - data = NETDATA.xss.checkAlways('/api/v1/registry?action=delete', data); +NETDATA.loadedRequiredJs = 0; +NETDATA.loadRequiredJs = function (index, callback) { + if (index >= NETDATA.requiredJs.length) { + if (typeof callback === 'function') { + return callback(); + } + return; + } - if(typeof data.status !== 'string' || data.status !== 'ok') { - NETDATA.error(411, NETDATA.registry.server + ' responded with: ' + JSON.stringify(data)); - data = null; - } + if (NETDATA.requiredJs[index].isAlreadyLoaded()) { + NETDATA.loadedRequiredJs++; + NETDATA.loadRequiredJs(++index, callback); + return; + } - if(typeof callback === 'function') - return callback(data); - }) - .fail(function() { - NETDATA.error(412, NETDATA.registry.server); + if (NETDATA.options.debug.main_loop) { + console.log('loading ' + NETDATA.requiredJs[index].url); + } - if(typeof callback === 'function') - return callback(null); - }); - }, + let async = true; + if (typeof NETDATA.requiredJs[index].async !== 'undefined' && NETDATA.requiredJs[index].async === false) { + async = false; + } - search: function(machine_guid, callback) { - // SEARCH for the URLs of a machine: - $.ajax({ - url: NETDATA.registry.server + '/api/v1/registry?action=search&machine=' + NETDATA.registry.machine_guid + '&name=' + encodeURIComponent(NETDATA.registry.hostname) + '&url=' + encodeURIComponent(NETDATA.serverDefault) + '&for=' + machine_guid, - async: true, - cache: false, - headers: { - 'Cache-Control': 'no-cache, no-store', - 'Pragma': 'no-cache' - }, - xhrFields: { withCredentials: true } // required for the cookie - }) - .done(function(data) { - data = NETDATA.xss.checkAlways('/api/v1/registry?action=search', data); + $.ajax({ + url: NETDATA.requiredJs[index].url, + cache: true, + dataType: "script", + xhrFields: {withCredentials: true} // required for the cookie + }) + .done(function () { + if (NETDATA.options.debug.main_loop) { + console.log('loaded ' + NETDATA.requiredJs[index].url); + } + }) + .fail(function () { + alert('Cannot load required JS library: ' + NETDATA.requiredJs[index].url); + }) + .always(function () { + NETDATA.loadedRequiredJs++; - if(typeof data.status !== 'string' || data.status !== 'ok') { - NETDATA.error(417, NETDATA.registry.server + ' responded with: ' + JSON.stringify(data)); - data = null; - } + // if (async === false) + if (!async) { + NETDATA.loadRequiredJs(++index, callback); + } + }); - if(typeof callback === 'function') - return callback(data); - }) - .fail(function() { - NETDATA.error(418, NETDATA.registry.server); + // if (async === true) + if (async) { + NETDATA.loadRequiredJs(++index, callback); + } +}; - if(typeof callback === 'function') - return callback(null); - }); - }, +NETDATA.loadRequiredCSS = function (index) { + if (index >= NETDATA.requiredCSS.length) { + return; + } - switch: function(new_person_guid, callback) { - // impersonate - $.ajax({ - url: NETDATA.registry.server + '/api/v1/registry?action=switch&machine=' + NETDATA.registry.machine_guid + '&name=' + encodeURIComponent(NETDATA.registry.hostname) + '&url=' + encodeURIComponent(NETDATA.serverDefault) + '&to=' + new_person_guid, - async: true, - cache: false, - headers: { - 'Cache-Control': 'no-cache, no-store', - 'Pragma': 'no-cache' - }, - xhrFields: { withCredentials: true } // required for the cookie - }) - .done(function(data) { - data = NETDATA.xss.checkAlways('/api/v1/registry?action=switch', data); + if (NETDATA.requiredCSS[index].isAlreadyLoaded()) { + NETDATA.loadRequiredCSS(++index); + return; + } - if(typeof data.status !== 'string' || data.status !== 'ok') { - NETDATA.error(413, NETDATA.registry.server + ' responded with: ' + JSON.stringify(data)); - data = null; - } + if (NETDATA.options.debug.main_loop) { + console.log('loading ' + NETDATA.requiredCSS[index].url); + } - if(typeof callback === 'function') - return callback(data); - }) - .fail(function() { - NETDATA.error(414, NETDATA.registry.server); + NETDATA._loadCSS(NETDATA.requiredCSS[index].url); + NETDATA.loadRequiredCSS(++index); +}; - if(typeof callback === 'function') - return callback(null); - }); - } - }; +// Boot it! - // ---------------------------------------------------------------------------------------------------------------- - // Boot it! +if (typeof netdataPrepCallback === 'function') { + netdataPrepCallback(); +} - if(typeof netdataPrepCallback === 'function') - netdataPrepCallback(); +NETDATA.errorReset(); +NETDATA.loadRequiredCSS(0); - NETDATA.errorReset(); - NETDATA.loadRequiredCSS(0); +NETDATA._loadjQuery(function () { + NETDATA.loadRequiredJs(0, function () { + if (typeof $().emulateTransitionEnd !== 'function') { + // bootstrap is not available + NETDATA.options.current.show_help = false; + } - NETDATA._loadjQuery(function() { - NETDATA.loadRequiredJs(0, function() { - if(typeof $().emulateTransitionEnd !== 'function') { - // bootstrap is not available - NETDATA.options.current.show_help = false; + if (typeof netdataDontStart === 'undefined' || !netdataDontStart) { + if (NETDATA.options.debug.main_loop) { + console.log('starting chart refresh thread'); } - if(typeof netdataDontStart === 'undefined' || !netdataDontStart) { - if(NETDATA.options.debug.main_loop === true) - console.log('starting chart refresh thread'); - - NETDATA.start(); - } - }); + NETDATA.start(); + } }); +}); })(window, document, (typeof jQuery === 'function')?jQuery:undefined); diff --git a/web/gui/dashboard_info.js b/web/gui/dashboard_info.js index 139ac9340..2f542d436 100644 --- a/web/gui/dashboard_info.js +++ b/web/gui/dashboard_info.js @@ -2,10 +2,10 @@ var netdataDashboard = window.netdataDashboard || {}; -// ---------------------------------------------------------------------------- -// menus +// Informational content for the various sections of the GUI (menus, sections, charts, etc.) -// information about the main menus +// ---------------------------------------------------------------------------- +// Menus netdataDashboard.menu = { 'system': { @@ -31,7 +31,7 @@ netdataDashboard.menu = { title: 'Quality of Service', icon: '<i class="fas fa-globe"></i>', info: 'Netdata collects and visualizes <code>tc</code> class utilization using its ' + - '<a href="https://github.com/netdata/netdata/blob/master/plugins.d/tc-qos-helper.sh" target="_blank">tc-helper plugin</a>. ' + + '<a href="https://github.com/netdata/netdata/blob/master/collectors/tc.plugin/tc-qos-helper.sh.in" target="_blank">tc-helper plugin</a>. ' + 'If you also use <a href="http://firehol.org/#fireqos" target="_blank">FireQOS</a> for setting up QoS, ' + 'netdata automatically collects interface and class names. If your QoS configuration includes overheads ' + 'calculation, the values shown here will include these overheads (the total bandwidth for the same ' + @@ -163,7 +163,7 @@ netdataDashboard.menu = { 'apps': { title: 'Applications', icon: '<i class="fas fa-heartbeat"></i>', - info: 'Per application statistics are collected using netdata\'s <code>apps.plugin</code>. This plugin walks through all processes and aggregates statistics for applications of interest, defined in <code>/etc/netdata/apps_groups.conf</code> (the default is <a href="https://github.com/netdata/netdata/blob/master/conf.d/apps_groups.conf" target="_blank">here</a>). The plugin internally builds a process tree (much like <code>ps fax</code> does), and groups processes together (evaluating both child and parent processes) so that the result is always a chart with a predefined set of dimensions (of course, only application groups found running are reported). The reported values are compatible with <code>top</code>, although the netdata plugin counts also the resources of exited children (unlike <code>top</code> which shows only the resources of the currently running processes). So for processes like shell scripts, the reported values include the resources used by the commands these scripts run within each timeframe.', + info: 'Per application statistics are collected using netdata\'s <code>apps.plugin</code>. This plugin walks through all processes and aggregates statistics for applications of interest, defined in <code>/etc/netdata/apps_groups.conf</code>, which can be edited by running <code>$ /etc/netdata/edit-config apps_groups.conf</code> (the default is <a href="https://github.com/netdata/netdata/blob/master/collectors/apps.plugin/apps_groups.conf" target="_blank">here</a>). The plugin internally builds a process tree (much like <code>ps fax</code> does), and groups processes together (evaluating both child and parent processes) so that the result is always a chart with a predefined set of dimensions (of course, only application groups found running are reported). The reported values are compatible with <code>top</code>, although the netdata plugin counts also the resources of exited children (unlike <code>top</code> which shows only the resources of the currently running processes). So for processes like shell scripts, the reported values include the resources used by the commands these scripts run within each timeframe.', height: 1.5 }, @@ -892,7 +892,7 @@ netdataDashboard.context = { }, 'apps.vmem': { - info: 'Virtual memory allocated by applications. Please check <a href="https://github.com/netdata/netdata/wiki/netdata-virtual-memory-size" target="_blank">this article</a> for more information.' + info: 'Virtual memory allocated by applications. Please check <a href="https://github.com/netdata/netdata/tree/master/daemon#virtual-memory" target="_blank">this article</a> for more information.' }, 'apps.preads': { @@ -915,7 +915,7 @@ netdataDashboard.context = { }, 'users.vmem': { - info: 'Virtual memory allocated per user. Please check <a href="https://github.com/netdata/netdata/wiki/netdata-virtual-memory-size" target="_blank">this article</a> for more information.' + info: 'Virtual memory allocated per user. Please check <a href="https://github.com/netdata/netdata/tree/master/daemon#virtual-memory" target="_blank">this article</a> for more information.' }, 'users.preads': { @@ -938,7 +938,7 @@ netdataDashboard.context = { }, 'groups.vmem': { - info: 'Virtual memory allocated per user group. Please check <a href="https://github.com/netdata/netdata/wiki/netdata-virtual-memory-size" target="_blank">this article</a> for more information.' + info: 'Virtual memory allocated per user group. Please check <a href="https://github.com/netdata/netdata/tree/master/daemon#virtual-memory" target="_blank">this article</a> for more information.' }, 'groups.preads': { @@ -2021,7 +2021,7 @@ netdataDashboard.context = { }, 'btrfs.disk': { - info: 'Physical disk usage of BTRFS. The disk space reported here is the raw physical disk space assigned to the BTRFS volume (i.e. <b>before any RAID levels</b>). BTRFS uses a two-stage allocator, first allocating large regions of disk space for one type of block (data, metadata, or system), and then using a regular block allocator inside those regions. <code>unallocated</code> is the physical disk space that is not allocated yet and is available to become data, metdata or system on demand. When <code>unallocated</code> is zero, all available disk space has been allocated to a specific function. Healthy volumes should ideally have at least five percent of their total space <code>unallocated</code>. You can keep your volume healthy by running the <code>btrfs balance</code> command on it regularly (check <code>man btrfs-balance</code> for more info). Note that some of the spac elisted as <code>unallocated</code> may not actually be usable if the volume uses devices of different sizes.', + info: 'Physical disk usage of BTRFS. The disk space reported here is the raw physical disk space assigned to the BTRFS volume (i.e. <b>before any RAID levels</b>). BTRFS uses a two-stage allocator, first allocating large regions of disk space for one type of block (data, metadata, or system), and then using a regular block allocator inside those regions. <code>unallocated</code> is the physical disk space that is not allocated yet and is available to become data, metdata or system on demand. When <code>unallocated</code> is zero, all available disk space has been allocated to a specific function. Healthy volumes should ideally have at least five percent of their total space <code>unallocated</code>. You can keep your volume healthy by running the <code>btrfs balance</code> command on it regularly (check <code>man btrfs-balance</code> for more info). Note that some of the space listed as <code>unallocated</code> may not actually be usable if the volume uses devices of different sizes.', colors: [NETDATA.colors[12]] }, diff --git a/web/gui/favicon.ico b/web/gui/favicon.ico Binary files differindex 821f7c402..857c582d1 100644 --- a/web/gui/favicon.ico +++ b/web/gui/favicon.ico diff --git a/web/gui/images/android-icon-144x144.png b/web/gui/images/android-icon-144x144.png Binary files differnew file mode 100644 index 000000000..c3013cc96 --- /dev/null +++ b/web/gui/images/android-icon-144x144.png diff --git a/web/gui/images/android-icon-192x192.png b/web/gui/images/android-icon-192x192.png Binary files differnew file mode 100644 index 000000000..77d18d9cc --- /dev/null +++ b/web/gui/images/android-icon-192x192.png diff --git a/web/gui/images/android-icon-36x36.png b/web/gui/images/android-icon-36x36.png Binary files differnew file mode 100644 index 000000000..74576f6ba --- /dev/null +++ b/web/gui/images/android-icon-36x36.png diff --git a/web/gui/images/android-icon-48x48.png b/web/gui/images/android-icon-48x48.png Binary files differnew file mode 100644 index 000000000..5666fa102 --- /dev/null +++ b/web/gui/images/android-icon-48x48.png diff --git a/web/gui/images/android-icon-72x72.png b/web/gui/images/android-icon-72x72.png Binary files differnew file mode 100644 index 000000000..7f7043f14 --- /dev/null +++ b/web/gui/images/android-icon-72x72.png diff --git a/web/gui/images/android-icon-96x96.png b/web/gui/images/android-icon-96x96.png Binary files differnew file mode 100644 index 000000000..1bbf594de --- /dev/null +++ b/web/gui/images/android-icon-96x96.png diff --git a/web/gui/images/apple-icon-114x114.png b/web/gui/images/apple-icon-114x114.png Binary files differnew file mode 100644 index 000000000..7d093e856 --- /dev/null +++ b/web/gui/images/apple-icon-114x114.png diff --git a/web/gui/images/apple-icon-120x120.png b/web/gui/images/apple-icon-120x120.png Binary files differnew file mode 100644 index 000000000..d4c38e7b1 --- /dev/null +++ b/web/gui/images/apple-icon-120x120.png diff --git a/web/gui/images/apple-icon-144x144.png b/web/gui/images/apple-icon-144x144.png Binary files differnew file mode 100644 index 000000000..c3013cc96 --- /dev/null +++ b/web/gui/images/apple-icon-144x144.png diff --git a/web/gui/images/apple-icon-152x152.png b/web/gui/images/apple-icon-152x152.png Binary files differnew file mode 100644 index 000000000..c92f38172 --- /dev/null +++ b/web/gui/images/apple-icon-152x152.png diff --git a/web/gui/images/apple-icon-180x180.png b/web/gui/images/apple-icon-180x180.png Binary files differnew file mode 100644 index 000000000..1a58fdbb2 --- /dev/null +++ b/web/gui/images/apple-icon-180x180.png diff --git a/web/gui/images/apple-icon-57x57.png b/web/gui/images/apple-icon-57x57.png Binary files differnew file mode 100644 index 000000000..36c273ced --- /dev/null +++ b/web/gui/images/apple-icon-57x57.png diff --git a/web/gui/images/apple-icon-60x60.png b/web/gui/images/apple-icon-60x60.png Binary files differnew file mode 100644 index 000000000..c3c48c8bd --- /dev/null +++ b/web/gui/images/apple-icon-60x60.png diff --git a/web/gui/images/apple-icon-72x72.png b/web/gui/images/apple-icon-72x72.png Binary files differnew file mode 100644 index 000000000..7f7043f14 --- /dev/null +++ b/web/gui/images/apple-icon-72x72.png diff --git a/web/gui/images/apple-icon-76x76.png b/web/gui/images/apple-icon-76x76.png Binary files differnew file mode 100644 index 000000000..b5e73cd4e --- /dev/null +++ b/web/gui/images/apple-icon-76x76.png diff --git a/web/gui/images/apple-icon-precomposed.png b/web/gui/images/apple-icon-precomposed.png Binary files differnew file mode 100644 index 000000000..f69945bf9 --- /dev/null +++ b/web/gui/images/apple-icon-precomposed.png diff --git a/web/gui/images/apple-icon.png b/web/gui/images/apple-icon.png Binary files differnew file mode 100644 index 000000000..f69945bf9 --- /dev/null +++ b/web/gui/images/apple-icon.png diff --git a/web/gui/images/banner-icon-144x144.png b/web/gui/images/banner-icon-144x144.png Binary files differnew file mode 100644 index 000000000..c3013cc96 --- /dev/null +++ b/web/gui/images/banner-icon-144x144.png diff --git a/web/gui/images/favicon-16x16.png b/web/gui/images/favicon-16x16.png Binary files differnew file mode 100644 index 000000000..43eb188fe --- /dev/null +++ b/web/gui/images/favicon-16x16.png diff --git a/web/gui/images/favicon-32x32.png b/web/gui/images/favicon-32x32.png Binary files differnew file mode 100644 index 000000000..e657e9212 --- /dev/null +++ b/web/gui/images/favicon-32x32.png diff --git a/web/gui/images/favicon-96x96.png b/web/gui/images/favicon-96x96.png Binary files differnew file mode 100644 index 000000000..1bbf594de --- /dev/null +++ b/web/gui/images/favicon-96x96.png diff --git a/web/gui/images/favicon.ico b/web/gui/images/favicon.ico Binary files differnew file mode 100644 index 000000000..7ed957252 --- /dev/null +++ b/web/gui/images/favicon.ico diff --git a/web/gui/images/ms-icon-144x144.png b/web/gui/images/ms-icon-144x144.png Binary files differnew file mode 100644 index 000000000..c3013cc96 --- /dev/null +++ b/web/gui/images/ms-icon-144x144.png diff --git a/web/gui/images/ms-icon-150x150.png b/web/gui/images/ms-icon-150x150.png Binary files differnew file mode 100644 index 000000000..f0cf41287 --- /dev/null +++ b/web/gui/images/ms-icon-150x150.png diff --git a/web/gui/images/ms-icon-310x310.png b/web/gui/images/ms-icon-310x310.png Binary files differnew file mode 100644 index 000000000..4f5f7e621 --- /dev/null +++ b/web/gui/images/ms-icon-310x310.png diff --git a/web/gui/images/ms-icon-70x70.png b/web/gui/images/ms-icon-70x70.png Binary files differnew file mode 100644 index 000000000..70012c61f --- /dev/null +++ b/web/gui/images/ms-icon-70x70.png diff --git a/web/gui/images/seo-performance-114.png b/web/gui/images/seo-performance-114.png Binary files differdeleted file mode 100644 index 3f3862b3b..000000000 --- a/web/gui/images/seo-performance-114.png +++ /dev/null diff --git a/web/gui/images/seo-performance-128.png b/web/gui/images/seo-performance-128.png Binary files differdeleted file mode 100644 index 2a212a475..000000000 --- a/web/gui/images/seo-performance-128.png +++ /dev/null diff --git a/web/gui/images/seo-performance-16.png b/web/gui/images/seo-performance-16.png Binary files differdeleted file mode 100644 index 6d7f075ec..000000000 --- a/web/gui/images/seo-performance-16.png +++ /dev/null diff --git a/web/gui/images/seo-performance-24.png b/web/gui/images/seo-performance-24.png Binary files differdeleted file mode 100644 index 32d077ef1..000000000 --- a/web/gui/images/seo-performance-24.png +++ /dev/null diff --git a/web/gui/images/seo-performance-256.png b/web/gui/images/seo-performance-256.png Binary files differdeleted file mode 100644 index 07abfa01c..000000000 --- a/web/gui/images/seo-performance-256.png +++ /dev/null diff --git a/web/gui/images/seo-performance-32.png b/web/gui/images/seo-performance-32.png Binary files differdeleted file mode 100644 index a39543cfb..000000000 --- a/web/gui/images/seo-performance-32.png +++ /dev/null diff --git a/web/gui/images/seo-performance-48.png b/web/gui/images/seo-performance-48.png Binary files differdeleted file mode 100644 index 6dab89e92..000000000 --- a/web/gui/images/seo-performance-48.png +++ /dev/null diff --git a/web/gui/images/seo-performance-512.png b/web/gui/images/seo-performance-512.png Binary files differdeleted file mode 100644 index 1f8c16410..000000000 --- a/web/gui/images/seo-performance-512.png +++ /dev/null diff --git a/web/gui/images/seo-performance-64.png b/web/gui/images/seo-performance-64.png Binary files differdeleted file mode 100644 index e79f3b35b..000000000 --- a/web/gui/images/seo-performance-64.png +++ /dev/null diff --git a/web/gui/images/seo-performance-72.png b/web/gui/images/seo-performance-72.png Binary files differdeleted file mode 100644 index a4c9efb30..000000000 --- a/web/gui/images/seo-performance-72.png +++ /dev/null diff --git a/web/gui/images/seo-performance-multi-size.icns b/web/gui/images/seo-performance-multi-size.icns Binary files differdeleted file mode 100644 index 2e1a884fb..000000000 --- a/web/gui/images/seo-performance-multi-size.icns +++ /dev/null diff --git a/web/gui/images/seo-performance-multi-size.ico b/web/gui/images/seo-performance-multi-size.ico Binary files differdeleted file mode 100644 index 821f7c402..000000000 --- a/web/gui/images/seo-performance-multi-size.ico +++ /dev/null diff --git a/web/gui/index.html b/web/gui/index.html index 0a01b1df9..c6d460bf5 100644 --- a/web/gui/index.html +++ b/web/gui/index.html @@ -13,24 +13,27 @@ <meta name="apple-mobile-web-app-status-bar-style" content="black-translucent"> <meta name="author" content="costa@tsaousis.gr"> - <!-- <link rel="shortcut icon" href="images/seo-performance-multi-size.ico"> --> - - <!-- <link rel="apple-touch-icon" href="images/seo-performance-72.png"> --> - <!-- <link rel="apple-touch-icon" sizes="72x72" href="images/seo-performance-72.png"> --> - <!-- <link rel="apple-touch-icon" sizes="114x114" href="images/seo-performance-114.png"> --> - - <!-- <link rel="icon" type="image/png" sizes="512x512" href="images/seo-performance-512.png"> --> - <!-- <link rel="icon" type="image/png" sizes="256x256" href="images/seo-performance-256.png"> --> - <!-- <link rel="icon" type="image/png" sizes="128x128" href="images/seo-performance-128.png"> --> - <!-- <link rel="icon" type="image/png" sizes="64x64" href="images/seo-performance-64.png"> --> - <!-- <link rel="icon" type="image/png" sizes="48x48" href="images/seo-performance-48.png"> --> - <!-- <link rel="icon" type="image/png" sizes="24x24" href="images/seo-performance-24.png"> --> - <!-- <link rel="icon" type="image/png" sizes="16x16" href="images/seo-performance-16.png"> --> - <!-- <link rel="icon" type="image/png" sizes="32x32" href="images/seo-performance-32.png"> --> - - <link rel="icon" type="image/png" sizes="32x32" href="data:image/png;base64,iVBORw0KGgoAAAANSUhEUgAAACAAAAAgCAYAAABzenr0AAACNklEQVRYhcXXv2tUQRAH8M+FEIJISBHCIWIhIQSUILERi4AiiqCggiIiomAjlhaC4j+ghYWISgqNohZaCBZBC8Ei8QdEUCutFBsxCBqDYkgci/cunkfuJffjJQPD8mZm5/vd2WV2HzlJ0Bs8CvrywsgCHwy+BpGOg0sJfjj4nYKX9FdwKG9gwZlgtgK8pLOpPxfw1mCoCnClDgWtzQTvCEYWCV7SkWAlFBoEb8dlDKBF8t2bMWUSH/AHr3CiEfz5CPUusPJLkRCdk5ZqyeqUrQv4R7E5TwK7M3zTeIKduRAIitiWEfIY69GdCwGcRFuG/xqONRkzkaA7+J5x+MaDtWmHvJ4HgeEM8Nn0bridfv9HoOFyBAdwJCPkqqTzHWwUaz7wgeBHxupfBKuCj2W25mxBsCGYyAB/FxTT27HcPlyep64tCLbjKbqqhLzBlgKfF8pVE4FgRXABI+ioEnYfOyzcFWsCbg+OV+xlpU4ER4O+4HVwL51b3xYEXcGu4Ao+YQhr5gmdxHmsQyfG0b/YxbWmLfRWmnxa0s06VbTMCpnBS9zFzQKTwR5cXCzwHIE02Sl8wSZsRI/kgLVJqjSd+t9LVjiG1diPszhdK3A5gR48k5zYMTwscC59sfT799CYKvA8EttbSeXgTr3gJQKl91kR+yTlvyG5uUbLYh9gb+ovltkb6qYtNSRo3kOygsBSzGlKsubf43USWLYK5CLLXoFWyU/CtzLbVDpW2n+m40yN9ukqdvAX9ac/EIgOapcAAAAASUVORK5CYII="> - - <link rel="mask-icon" href="images/netdata.svg" color="red" /> + <link rel="stylesheet" type="text/css" href="main.css?v=2"> + + <link rel="icon" href="data:image/png;base64,iVBORw0KGgoAAAANSUhEUgAAACAAAAAgCAYAAABzenr0AAAACXBIWXMAAA7EAAAOxAGVKw4bAAACyklEQVRYhcWXz0sUYRjHP8+wLItImEhnEfEgEVJk+56CbCECQWezOkTQTTp6kejgKUSoEAoK/wAhaaeDBkLoIahZIWIJo0U8hHQJJBYJERGfDrOju7PjuO5u6/c0PM/7zvfzvvP+eEaoVu6wBZIA3cW82wtvY7cD1xEWSTpb1bxWjm2RtbtQxoF7iLSA7gO/UL4A74G3mBIzNz0Peg1hFmUK46zXBuDaCYQJlDFE4ke/QreAZyhPMc42rt2PyEoxt4cyDUxgnO3qAVy7C8gg0hdFHwBZA0ZIOt9w7e+I9B6mdBVhmGTlbFQCuPYFhA8g56o3P3D6CwyiDCIyFshtgqRIZnKlUStg3lW7OYC0AvPATkiuA9U3uOlEOEDWTgCZ2s3LIMbCU9ID3A8HUCZO9s2jGCRxdFIflDUF/EX3I3q1N0iq+8BZf+v6MzDeFHMAEQvoJpuOAwiu3Qr89g6ZJkm5CnoHeBwDbjTV3CPoRRhF+WQBA801B+AJiAUMWMDFptuLtBef+iygs+kAh+q0gDOnCNBmETyOmywLKJyifyEG/ATqPP+LUt0FZoAlIA6MgNyKqDo2YkAO6G+QeQrjfCyJzuHaoyCvjuiVs4q0jdBMwNyTcV6j+jm0h7BkAYuohpZLJ1TUQJYrIqo7KAtW8VaabQBA1GVWmROZwzgFfwtOoRpealevdGg0a8eAoUB0D9VJ8M8A46yDTNdlL9wmaz8MMX9RrIQOpfoS4+S9br7cdAvoCiLn6wLxFtwyQhxlKMQ8j3CJpFeml+9QN90N6iLSURfEkXD8AQwms+aHyo9hk1kHSaG6+Z/MU6XmlQAeRA7EoLraQPM83si/BlPhF5E3E1dQfY5S++5Q/9dMLwdH7uv4n1PX7gEeAXejy+0y4x2QOWASk8lHNT0e4AAk3QZ6E6+E68MrZNqK2QKwgXevLCEskHSqumX/AUXU5QBtOC5FAAAAAElFTkSuQmCC"> + + <!-- <link rel="apple-touch-icon" sizes="57x57" href="images/apple-icon-57x57.png"> + <link rel="apple-touch-icon" sizes="60x60" href="images/apple-icon-60x60.png"> + <link rel="apple-touch-icon" sizes="72x72" href="images/apple-icon-72x72.png"> + <link rel="apple-touch-icon" sizes="76x76" href="images/apple-icon-76x76.png"> + <link rel="apple-touch-icon" sizes="114x114" href="images/apple-icon-114x114.png"> + <link rel="apple-touch-icon" sizes="120x120" href="images/apple-icon-120x120.png"> + <link rel="apple-touch-icon" sizes="144x144" href="images/apple-icon-144x144.png"> + <link rel="apple-touch-icon" sizes="152x152" href="images/apple-icon-152x152.png"> + <link rel="apple-touch-icon" sizes="180x180" href="images/apple-icon-180x180.png"> + <link rel="icon" type="image/png" sizes="192x192" href="images/android-icon-192x192.png"> + <link rel="icon" type="image/png" sizes="32x32" href="images/favicon-32x32.png"> + <link rel="icon" type="image/png" sizes="96x96" href="images/favicon-96x96.png"> + <link rel="icon" type="image/png" sizes="16x16" href="images/favicon-16x16.png"> + <link rel="manifest" href="manifest.json"> + <meta name="msapplication-TileColor" content="#ffffff"> + <meta name="msapplication-TileImage" content="images/ms-icon-144x144.png"> + <meta name="theme-color" content="#ffffff"> --> <meta property="og:locale" content="en_US" /> <meta property="og:url" content="https://my-netdata.io" /> @@ -48,4494 +51,7 @@ <meta name="twitter:description" content="Unparalleled insights, in real-time, of everything happening on your Linux systems and applications, with stunning, interactive web dashboards and powerful performance and health alarms." /> <meta name="twitter:image" content="https://cloud.githubusercontent.com/assets/2662304/14092712/93b039ea-f551-11e5-822c-beadbf2b2a2e.gif" /> - <style> - - /* force the vertical window scrollbar */ - html { - overflow-y: scroll; - } - - /* prevent body from hiding under the navbar */ - body { - padding-top: 50px; - } - - .loadOverlay { - position: absolute; - top: 0px; - left: 0px; - width: 100%; - height:100%; - z-index: 2000; - font-size: 10vh; - font-family: sans-serif; - padding: 40vh 0 40vh 0; - font-weight: bold; - text-align: center; - } - - .navbar-highlight { - display: none; - position: fixed; - margin-top: 5px; - height: 26px; - width: 100%; - text-align: center; - overflow: hidden; - z-index: 30; - pointer-events: none !important; - } - - .navbar-highlight-content { - position: relative; - display: inline-block; - margin: 0 auto; - height: 26px; - min-width: 500px; - background-color:rgba(0, 0, 0, 0.7); - padding-top: 2px; - padding-bottom: 2px; - padding-left: 15px; - padding-right: 15px; - border-radius:10px; - color: lightgrey; - pointer-events: auto !important; - } - - .navbar-highlight-bar { - cursor: pointer; - } - .navbar-highlight-button-right { - cursor: pointer; - padding-left: 10px; - } - - .modal-wide .modal-dialog { - width: 80%; - } - - /* fix # anchors scrolling under the navbar - https://github.com/twbs/bootstrap/issues/1768#issuecomment-46519033 - */ - h1 { - position: relative; - z-index: -1; - } - h2 { - position: relative; - z-index: -2; - } - h1:before, h2:before { - display: block; - content: " "; - margin-top: -70px; - height: 70px; - visibility: hidden; - } - - .p { - display: block; - margin-top: 15px; - } - - .option-row, - .option-control { - vertical-align: top; - padding: 10px; - padding-top: 30px; - padding-left: 30px; - } - - .option-info { - padding: 10px; - } - - .dashboard-submenu-info { - display: block; - margin-top: 10px; - } - - .dashboard-context-info { - display: block; - margin-top: 10px; - } - - #masthead h1 { - /*font-size: 30px;*/ - line-height: 1; - padding-top: 30px; - } - - #masthead .well { - margin-top:4%; - } - - /* fix the navbar shifting when a modal is open */ - /* https://github.com/twbs/bootstrap/issues/14040#issuecomment-159891033 */ - body.modal-open{ - width: 100% !important; - padding-right: 0 !important; -/* overflow-y: scroll !important; */ -/* position: fixed !important;*/ - overflow: visible; - } - - /* make accordion use the whole header bar for expand/collapse */ - .panel-title a { - display: block; - padding: 10px 15px; - margin: -10px -15px; - } - - /* - * Side navigation - * - * Scrollspy and affixed enhanced navigation to highlight sections and secondary - * sections of docs content. - */ - - .affix { - position: static; - top: 70px !important; - /*width: 220px;*/ - } - - .affix-top { - /*width: 220px;*/ - } - - .dashboard-sidebar { - max-height: calc(100% - 70px) !important; - overflow-y: auto; - /*width: 220px !important;*/ - } - - /* By default it's not affixed in mobile views, so undo that */ - .dashboard-sidebar.affix { - position: static; - } - - @media (min-width: 768px) { - .dashboard-sidebar { - padding-left: 20px; - } - } - - /* First level of nav */ - .dashboard-sidenav { - margin-top: 20px; - margin-bottom: 20px; - } - - /* All levels of nav */ - .dashboard-sidebar .nav > li > a { - display: block; - padding: 4px 20px; - font-size: 13px; - font-weight: 500; - color: #767676; - } - .dashboard-sidebar .nav > li > a > .svg-inline--fa { - width: 20px; - text-align: center; - } - .dashboard-sidebar .nav > li > a:hover, - .dashboard-sidebar .nav > li > a:focus { - padding-left: 19px; - color: #563d7c; - text-decoration: none; - background-color: transparent; - border-left: 1px solid #563d7c; - } - .dashboard-sidebar .nav > .active > a, - .dashboard-sidebar .nav > .active:hover > a, - .dashboard-sidebar .nav > .active:focus > a { - padding-left: 18px; - font-weight: bold; - color: #563d7c; - background-color: transparent; - border-left: 2px solid #563d7c; - } - - /* Nav: second level (shown on .active) */ - .dashboard-sidebar .nav .nav { - display: none; /* Hide by default, but at >768px, show it */ - padding-bottom: 10px; - } - .dashboard-sidebar .nav .nav > li > a { - padding-top: 1px; - padding-bottom: 1px; - padding-left: 30px; - font-size: 12px; - font-weight: normal; - } - .dashboard-sidebar .nav .nav > li > a:hover, - .dashboard-sidebar .nav .nav > li > a:focus { - padding-left: 29px; - } - .dashboard-sidebar .nav .nav > .active > a, - .dashboard-sidebar .nav .nav > .active:hover > a, - .dashboard-sidebar .nav .nav > .active:focus > a { - padding-left: 28px; - font-weight: 500; - } - - .dropdown-menu { - min-width: 200px; - } - .dropdown-menu.columns-2 { - margin: 0; - padding: 0; - width: 400px; - } - .dropdown-menu li a { - padding: 5px 15px; - font-weight: 300; - } - .dropdown-menu.multi-column { - overflow-x: hidden; - } - .multi-column-dropdown { - list-style: none; - padding: 0; - } - .multi-column-dropdown li a { - display: block; - clear: both; - line-height: 1.428571429; - white-space: normal; - } - .multi-column-dropdown li a:hover { - text-decoration: none; - color: #f5f5f5; - background-color: #262626; - } - .scrollable-menu { - height: auto; - max-height: 80vh; - overflow-x: hidden; - } - .scrollable-menu-50 { - height: auto; - max-height: 50vh; - overflow-x: hidden; - } - - /* Back to top (hidden on mobile) */ - .back-to-top, - .dashboard-theme-toggle { - display: none; - padding: 4px 10px; - margin-top: 10px; - margin-left: 10px; - font-size: 12px; - font-weight: 500; - color: #999; - } - .back-to-top:hover, - .dashboard-theme-toggle:hover { - color: #563d7c; - text-decoration: none; - } - .dashboard-theme-toggle { - margin-top: 0; - } - - .container { - width: calc(100% - 20px) !important; - } - - .charts-body { - display: inline-block; - width: 100%; - } - - .sidebar-body { - position: absolute; - display: none; - } - - .dashboard-section-container { - display: block; - width: 100%; - page-break-before: auto; - page-break-after: auto; - page-break-inside: auto; - } - - .dashboard-print-row { - display: block; - width: 100%; - page-break-before: auto; - page-break-after: auto; - page-break-inside: avoid; - } - - .netdata-chartblock-container { - display: inline-block; - } - - /* https://github.com/seiyria/bootstrap-slider/issues/746 */ - .tooltip { - -webkit-user-select: none; - -moz-user-select: none; - -ms-user-select: none; - user-select: none; - } - - @media print { - body { - overflow: visible !important; - -webkit-print-color-adjust: exact; - page-break-inside: auto; - page-break-before: auto; - page-break-after: auto; - } - - .dashboard-section { - page-break-inside: auto; - page-break-before: auto; - page-break-after: auto; - } - - .dashboard-subsection { - page-break-before: avoid; - page-break-after: auto; - page-break-inside: auto; - } - - .charts-body { - padding-left: 0%; - padding-right: 0%; - display: block; - page-break-inside: auto; - page-break-before: auto; - page-break-after: auto; - } - - .back-to-top, - .dashboard-theme-toggle { - display: block; - } - } - - @media (min-width: 768px) { - .charts-body { - padding-left: 0%; - padding-right: 0%; - } - - .back-to-top, - .dashboard-theme-toggle { - display: block; - } - } - - /* Show and affix the side nav when space allows it */ - @media (min-width: 992px) { - .container { - padding-left: 0% !important; - } - - .charts-body { - width: calc(100% - 213px) !important; - padding-left: 1% !important; - padding-right: 0% !important; - } - - .sidebar-body { - display: inline-block !important; - width: 213px !important; - } - - .dashboard-sidebar .nav > .active > ul { - display: block; - } - - /* Widen the fixed sidebar */ - .dashboard-sidebar.affix, - .dashboard-sidebar.affix-top, - .dashboard-sidebar.affix-bottom { - width: 213px !important; - } - .dashboard-sidebar.affix { - position: fixed; /* Undo the static from mobile first approach */ - top: 20px; - } - .dashboard-sidebar.affix-bottom { - position: absolute; /* Undo the static from mobile first approach */ - } - .dashboard-sidebar.affix-bottom .dashboard-sidenav, - .dashboard-sidebar.affix .dashboard-sidenav { - margin-top: 0; - margin-bottom: 0; - } - } - - @media (min-width: 1200px) { - .container { - padding-left: 2% !important; - } - - .charts-body { - width: calc(100% - 233px) !important; - padding-left: 1% !important; - padding-right: 1% !important; - } - - .sidebar-body { - display: inline-block !important; - width: 233px !important; - } - - /* Widen the fixed sidebar again */ - .dashboard-sidebar.affix, - .dashboard-sidebar.affix-top, - .dashboard-sidebar.affix-bottom { - width: 233px !important; - } - } - - @media (min-width: 1360px) { - .container { - padding-left: 3% !important; - } - - .charts-body { - width: calc(100% - 263px) !important; - padding-left: 1% !important; - padding-right: 2% !important; - } - - .sidebar-body { - display: inline-block !important; - width: 263px !important; - } - - /* Widen the fixed sidebar again */ - .dashboard-sidebar.affix, - .dashboard-sidebar.affix-top, - .dashboard-sidebar.affix-bottom { - width: 263px !important; - } - } - - .action-button { - position: relative; - display: inline-block; - color: gray; - cursor: pointer; - margin: 0 auto; - width: 30px; - height: 30px; - font-size: 25px; - } - - .ripple { - position: relative; - /*overflow: hidden;*/ - transform: translate3d(0, 0, 0) - } - - .ripple:after { - content: ""; - display: block; - position: absolute; - width: 100%; - height: 100%; - top: 0; - left: 0; - pointer-events: none; - background-image: radial-gradient(circle, #000 10%, transparent 10.01%); - background-repeat: no-repeat; - background-position: 50%; - transform: scale(18, 18); /* the size of the ripple */ - opacity: 0; - transition: transform .5s, opacity 1s - } - - .ripple:active:after { - transform: scale(0, 0); - opacity: .2; - transition: 0s - } - </style> - - <!-- check which theme to use --> - <script type="text/javascript"> - // netdata snapshot data - var netdataSnapshotData = null; - - // enable alarms checking and notifications - var netdataShowAlarms = true; - - // enable registry updates - var netdataRegistry = true; - - // forward definition only - not used here - var netdataServer = undefined; - var netdataServerStatic = undefined; - var netdataCheckXSS = undefined; - - // control the welcome modal and analytics - var this_is_demo = null; - - function escapeUserInputHTML(s) { - return s.toString() - .replace(/&/g, '&') - .replace(/</g, '<') - .replace(/>/g, '>') - .replace(/"/g, '"') - .replace(/#/g, '#') - .replace(/'/g, ''') - .replace(/\(/g,'(') - .replace(/\)/g,')') - .replace(/\//g,'/'); - } - - function verifyURL(s) { - if(typeof(s) === 'string' && (s.startsWith('http://') || s.startsWith('https://'))) - return s - .replace(/'/g, '%22') - .replace(/"/g, '%27') - .replace(/\)/g, '%28') - .replace(/\(/g, '%29'); - - console.log('invalid URL detected:'); - console.log(s); - return 'javascript:alert("invalid url");'; - } - - // -------------------------------------------------------------------- - // urlOptions - - var urlOptions = { - hash: '#', - theme: null, - help: null, - mode: 'live', // 'live', 'print' - update_always: false, - pan_and_zoom: false, - server: null, - after: 0, - before: 0, - highlight: false, - highlight_after: 0, - highlight_before: 0, - nowelcome: false, - show_alarms: false, - chart: null, - family: null, - alarm: null, - alarm_unique_id: 0, - alarm_id: 0, - alarm_event_id: 0, - - hasProperty: function(property) { - // console.log('checking property ' + property + ' of type ' + typeof(this[property])); - return typeof this[property] !== 'undefined'; - }, - - genHash: function(forReload) { - var hash = urlOptions.hash; - - if(urlOptions.pan_and_zoom === true) { - hash += ';after=' + urlOptions.after.toString() + - ';before=' + urlOptions.before.toString(); - } - - if(urlOptions.highlight === true) { - hash += ';highlight_after=' + urlOptions.highlight_after.toString() + - ';highlight_before=' + urlOptions.highlight_before.toString(); - } - - if(urlOptions.theme !== null) - hash += ';theme=' + urlOptions.theme.toString(); - - if(urlOptions.help !== null) - hash += ';help=' + urlOptions.help.toString(); - - if(urlOptions.update_always === true) - hash += ';update_always=true'; - - if(forReload === true && urlOptions.server !== null) - hash += ';server=' + urlOptions.server.toString(); - - if(urlOptions.mode !== 'live') - hash += ';mode=' + urlOptions.mode; - - return hash; - }, - - parseHash: function() { - var variables = document.location.hash.split(';'); - var len = variables.length; - while(len--) { - if(len !== 0) { - var p = variables[len].split('='); - if(urlOptions.hasProperty(p[0]) && typeof p[1] !== 'undefined') - urlOptions[p[0]] = decodeURIComponent(p[1]); - } - else { - if(variables[len].length > 0) - urlOptions.hash = variables[len]; - } - } - - var booleans = [ 'nowelcome', 'show_alarms', 'update_always' ]; - len = booleans.length; - while(len--) { - if(urlOptions[booleans[len]] === 'true' || urlOptions[booleans[len]] === true || urlOptions[booleans[len]] === '1' || urlOptions[booleans[len]] === 1) - urlOptions[booleans[len]] = true; - else - urlOptions[booleans[len]] = false; - } - - var numeric = [ 'after', 'before', 'highlight_after', 'highlight_before' ]; - len = numeric.length; - while(len--) { - if(typeof urlOptions[numeric[len]] === 'string') { - try { - urlOptions[numeric[len]] = parseInt(urlOptions[numeric[len]]); - } - catch(e) { - console.log('failed to parse URL hash parameter ' + numeric[len]); - urlOptions[numeric[len]] = 0; - } - } - } - - if(urlOptions.server !== null && urlOptions.server !== '') { - netdataServerStatic = document.location.origin.toString() + document.location.pathname.toString(); - netdataServer = urlOptions.server; - netdataCheckXSS = true; - } - else - urlOptions.server = null; - - if(urlOptions.before > 0 && urlOptions.after > 0) { - urlOptions.pan_and_zoom = true; - urlOptions.nowelcome = true; - } - else - urlOptions.pan_and_zoom = false; - - if(urlOptions.highlight_before > 0 && urlOptions.highlight_after > 0) { - urlOptions.highlight = true; - } - else - urlOptions.highlight = false; - - switch(urlOptions.mode) { - case 'print': - urlOptions.theme = 'white'; - urlOptions.welcome = false; - urlOptions.help = false; - urlOptions.show_alarms = false; - - if(urlOptions.pan_and_zoom === false) { - urlOptions.pan_and_zoom = true; - urlOptions.before = Date.now(); - urlOptions.after = urlOptions.before - 600000; - } - - netdataShowAlarms = false; - netdataRegistry = false; - this_is_demo = false; - break; - - case 'live': - default: - urlOptions.mode = 'live'; - break; - } - - // console.log(urlOptions); - }, - - hashUpdate: function() { - history.replaceState(null, '', urlOptions.genHash(true)); - }, - - netdataPanAndZoomCallback: function(status, after, before) { - //console.log(1); - //console.log(new Error().stack); - - if(netdataSnapshotData === null) { - urlOptions.pan_and_zoom = status; - urlOptions.after = after; - urlOptions.before = before; - urlOptions.hashUpdate(); - } - }, - - netdataHighlightCallback: function(status, after, before) { - //console.log(2); - //console.log(new Error().stack); - - if(status === true && (after === null || before === null || after <= 0 || before <= 0 || after >= before)) { - status = false; - after = 0; - before = 0; - } - - if(netdataSnapshotData === null) - urlOptions.highlight = status; - else - urlOptions.highlight = false; - - urlOptions.highlight_after = Math.round(after); - urlOptions.highlight_before = Math.round(before); - urlOptions.hashUpdate(); - - var show_eye = NETDATA.globalChartUnderlay.hasViewport(); - - if(status === true && after > 0 && before > 0 && after < before) { - var d1 = NETDATA.dateTime.localeDateString(after); - var d2 = NETDATA.dateTime.localeDateString(before); - if(d1 === d2) d2 = ''; - document.getElementById('navbar-highlight-content').innerHTML = - ((show_eye === true)?'<span class="navbar-highlight-bar highlight-tooltip" onclick="urlOptions.showHighlight();" title="restore the highlighted view" data-toggle="tooltip" data-placement="bottom">':'<span>').toString() - + 'highlighted time-frame' - + ' <b>' + d1 + ' <code>' + NETDATA.dateTime.localeTimeString(after) + '</code></b> to ' - + ' <b>' + d2 + ' <code>' + NETDATA.dateTime.localeTimeString(before) + '</code></b>, ' - + 'duration <b>' + NETDATA.seconds4human(Math.round((before - after) / 1000)) + '</b>' - + '</span>' - + '<span class="navbar-highlight-button-right highlight-tooltip" onclick="urlOptions.clearHighlight();" title="clear the highlighted time-frame" data-toggle="tooltip" data-placement="bottom"><i class="fas fa-times"></i></span>'; - - $('.navbar-highlight').show(); - - $('.highlight-tooltip').tooltip({ - html: true, - delay: {show: 500, hide: 0}, - container: 'body' - }); - } - else - $('.navbar-highlight').hide(); - }, - - clearHighlight: function() { - NETDATA.globalChartUnderlay.clear(); - - if(NETDATA.globalPanAndZoom.isActive() === true) - NETDATA.globalPanAndZoom.clearMaster(); - }, - - showHighlight: function() { - NETDATA.globalChartUnderlay.focus(); - } - }; - - urlOptions.parseHash(); - - // -------------------------------------------------------------------- - // check options that should be processed before loading netdata.js - - var localStorageTested = -1; - function localStorageTest() { - if(localStorageTested !== -1) - return localStorageTested; - - if(typeof Storage !== "undefined" && typeof localStorage === 'object') { - var test = 'test'; - try { - localStorage.setItem(test, test); - localStorage.removeItem(test); - localStorageTested = true; - } - catch (e) { - console.log(e); - localStorageTested = false; - } - } - else - localStorageTested = false; - - return localStorageTested; - } - - function loadLocalStorage(name) { - var ret = null; - - try { - if(localStorageTest() === true) - ret = localStorage.getItem(name); - else - console.log('localStorage is not available'); - } - catch(error) { - console.log(error); - return null; - } - - if(typeof ret === 'undefined' || ret === null) - return null; - - // console.log('loaded: ' + name.toString() + ' = ' + ret.toString()); - - return ret; - } - - function saveLocalStorage(name, value) { - // console.log('saving: ' + name.toString() + ' = ' + value.toString()); - try { - if(localStorageTest() === true) { - localStorage.setItem(name, value.toString()); - return true; - } - } - catch(error) { - console.log(error); - } - - return false; - } - - function getTheme(def) { - if(urlOptions.mode === 'print') - return 'white'; - - var ret = loadLocalStorage('netdataTheme'); - if(typeof ret === 'undefined' || ret === null || ret === 'undefined') - return def; - else - return ret; - } - - function setTheme(theme) { - if(urlOptions.mode === 'print') return false; - - if(theme === netdataTheme) return false; - return saveLocalStorage('netdataTheme', theme); - } - - var netdataTheme = getTheme('slate'); - var netdataShowHelp = true; - - if(urlOptions.theme !== null) { - setTheme(urlOptions.theme); - netdataTheme = urlOptions.theme; - } - else - urlOptions.theme = netdataTheme; - - if(urlOptions.help !== null) { - saveLocalStorage('options.show_help', urlOptions.help); - netdataShowHelp = urlOptions.help; - } - else { - urlOptions.help = loadLocalStorage('options.show_help'); - } - - // -------------------------------------------------------------------- - // natural sorting - // http://www.davekoelle.com/files/alphanum.js - LGPL - - function naturalSortChunkify(t) { - var tz = []; - var x = 0, y = -1, n = 0, i, j; - - while (i = (j = t.charAt(x++)).charCodeAt(0)) { - var m = (i >= 48 && i <= 57); - if (m !== n) { - tz[++y] = ""; - n = m; - } - tz[y] += j; - } - - return tz; - } - - function naturalSortCompare(a, b) { - var aa = naturalSortChunkify(a.toLowerCase()); - var bb = naturalSortChunkify(b.toLowerCase()); - - for (var x = 0; aa[x] && bb[x]; x++) { - if (aa[x] !== bb[x]) { - var c = Number(aa[x]), d = Number(bb[x]); - if (c.toString() === aa[x] && d.toString() === bb[x]) - return c - d; - else - return (aa[x] > bb[x]) ? 1 : -1; - } - } - - return aa.length - bb.length; - } - - // -------------------------------------------------------------------- - // saving files to client - - function saveTextToClient(data, filename) { - var blob = new Blob( [ data ], { - type: 'application/octet-stream' - }); - - var url = URL.createObjectURL( blob ); - var link = document.createElement( 'a' ); - link.setAttribute( 'href', url ); - link.setAttribute( 'download', filename ); - - var el = document.getElementById('hiddenDownloadLinks'); - el.innerHTML = ''; - el.appendChild(link); - - setTimeout(function(){ - el.removeChild(link); - URL.revokeObjectURL(url); - }, 60); - - link.click(); - } - - function saveObjectToClient(data, filename) { - saveTextToClient(JSON.stringify(data), filename); - } - - // -------------------------------------------------------------------- - // registry call back to render my-netdata menu - - var netdataRegistryCallback = function(machines_array) { - var el = ''; - var a1 = ''; - var found = 0, hosted = 0; - var len, i, url, hostname, icon; - - if(options.hosts.length > 1) { - // there are mirrored hosts here - - el += '<li><a href="#" onClick="return false;" style="color: #666;" target="_blank">databases available on this host</a></li>'; - a1 += '<li><a href="#" onClick="return false;"><i class="fas fa-info-circle" style="color: #666;"></i></a></li>'; - - var base = document.location.origin.toString() + document.location.pathname.toString(); - if(base.endsWith("/host/" + options.hostname + "/")) - base = base.substring(0, base.length - ("/host/" + options.hostname + "/").toString().length); - - if(base.endsWith("/")) - base = base.substring(0, base.length - 1); - - var master = options.hosts[0].hostname; - var sorted = options.hosts.sort(function(a, b) { - if(a.hostname === master) return -1; - return naturalSortCompare(a.hostname, b.hostname); - }); - - i = 0; - len = sorted.length; - while(len--) { - hostname = sorted[i].hostname; - if(hostname === master) { - url = base + "/"; - icon = "home"; - } - else { - url = base + "/host/" + hostname + "/"; - icon = "window-restore"; - } - - el += '<li id="registry_server_hosted_' + len.toString() + '"><a class="registry_link" href="' + url + '#" onClick="return gotoHostedModalHandler(\'' + url + '\');">' + hostname + '</a></li>'; - a1 += '<li id="registry_action_hosted_' + len.toString() + '"><a class="registry_link" href="' + url + '#" onClick="return gotoHostedModalHandler(\'' + url + '\');"><i class="fas fa-' + icon + '" style="color: #999;"></i></a></li>'; - hosted++; - i++; - } - - el += '<li role="separator" class="divider"></li>'; - a1 += '<li role="separator" class="divider"></li>'; - } - - if(machines_array === null) { - var ret = loadLocalStorage("registryCallback"); - if(typeof ret !== 'undefined' && ret !== null) { - machines_array = JSON.parse(ret); - console.log("failed to contact the registry - loaded registry data from browser local storage"); - } - } - - if(machines_array) { - saveLocalStorage("registryCallback", JSON.stringify(machines_array)); - - var machines = machines_array.sort(function (a, b) { - return naturalSortCompare(a.name, b.name); - }); - - i = 0; - len = machines.length; - while(len--) { - var u = machines[i++]; - found++; - el += '<li id="registry_server_' + u.guid + '"><a class="registry_link" href="' + u.url + '#" onClick="return gotoServerModalHandler(\'' + u.guid + '\');">' + u.name + '</a></li>'; - a1 += '<li id="registry_action_' + u.guid + '"><a href="#" onclick="deleteRegistryModalHandler(\'' + u.guid + '\',\'' + u.name + '\',\'' + u.url + '\'); return false;"><i class="fas fa-trash" style="color: #999;"></i></a></li>'; - } - } - - if(!found) { - if(machines) - el += '<li><a href="https://github.com/netdata/netdata/wiki/mynetdata-menu-item" style="color: #666;" target="_blank">your netdata server list is empty...</a></li>'; - else - el += '<li><a href="https://github.com/netdata/netdata/wiki/mynetdata-menu-item" style="color: #666;" target="_blank">failed to contact the registry...</a></li>'; - - a1 += '<li><a href="#" onClick="return false;"> </a></li>'; - - el += '<li role="separator" class="divider"></li>' + - '<li><a href="//london.netdata.rocks/default.html">UK - London (DigitalOcean.com)</a></li>' + - '<li><a href="//newyork.netdata.rocks/default.html">US - New York (DigitalOcean.com)</a></li>' + - '<li><a href="//sanfrancisco.netdata.rocks/default.html">US - San Francisco (DigitalOcean.com)</a></li>' + - '<li><a href="//atlanta.netdata.rocks/default.html">US - Atlanta (CDN77.com)</a></li>' + - '<li><a href="//frankfurt.netdata.rocks/default.html">Germany - Frankfurt (DigitalOcean.com)</a></li>' + - '<li><a href="//toronto.netdata.rocks/default.html">Canada - Toronto (DigitalOcean.com)</a></li>' + - '<li><a href="//singapore.netdata.rocks/default.html">Japan - Singapore (DigitalOcean.com)</a></li>' + - '<li><a href="//bangalore.netdata.rocks/default.html">India - Bangalore (DigitalOcean.com)</a></li>'; - a1 += '<li role="separator" class="divider"></li>' + - '<li><a href="#"> </a></li>' + - '<li><a href="#"> </a></li>'+ - '<li><a href="#"> </a></li>'+ - '<li><a href="#"> </a></li>'+ - '<li><a href="#"> </a></li>'+ - '<li><a href="#"> </a></li>'+ - '<li><a href="#"> </a></li>'+ - '<li><a href="#"> </a></li>'; - } - - el += '<li role="separator" class="divider"></li>'; - a1 += '<li role="separator" class="divider"></li>'; - - el += '<li><a href="https://github.com/netdata/netdata/wiki/mynetdata-menu-item" style="color: #999;" target="_blank">What is this?</a></li>'; - a1 += '<li><a href="#" style="color: #999;" onclick="switchRegistryModalHandler(); return false;"><i class="fas fa-cog" style="color: #999;"></i></a></li>'; - - document.getElementById('mynetdata_servers').innerHTML = el; - document.getElementById('mynetdata_servers2').innerHTML = el; - document.getElementById('mynetdata_actions1').innerHTML = a1; - - gotoServerInit(); - }; - - function isdemo() { - if(this_is_demo !== null) return this_is_demo; - this_is_demo = false; - - try { - if(typeof document.location.hostname === 'string') { - if(document.location.hostname.endsWith('.my-netdata.io') || - document.location.hostname.endsWith('.mynetdata.io') || - document.location.hostname.endsWith('.netdata.rocks') || - document.location.hostname.endsWith('.netdata.ai') || - document.location.hostname.endsWith('.netdata.live') || - document.location.hostname.endsWith('.firehol.org') || - document.location.hostname.endsWith('.netdata.online') || - document.location.hostname.endsWith('.netdata.cloud')) - this_is_demo = true; - } - } - catch(error) {} - return this_is_demo; - } - - function netdataURL(url, forReload) { - if(typeof url === 'undefined') - // url = document.location.toString(); - url = ''; - - if(url.indexOf('#') !== -1) - url = url.substring(0, url.indexOf('#')); - - var hash = urlOptions.genHash(forReload); - - // console.log('netdataURL: ' + url + hash); - - return url + hash; - } - - function netdataReload(url) { - document.location = verifyURL(netdataURL(url, true)); - - // since we play with hash - // this is needed to reload the page - location.reload(); - } - - function gotoHostedModalHandler(url) { - document.location = verifyURL(url + urlOptions.genHash()); - return false; - } - - var gotoServerValidateRemaining = 0; - var gotoServerMiddleClick = false; - var gotoServerStop = false; - function gotoServerValidateUrl(id, guid, url) { - var penalty = 0; - var error = 'failed'; - - if(document.location.toString().startsWith('http://') && url.toString().startsWith('https://')) - // we penalize https only if the current url is http - // to allow the user walk through all its servers. - penalty = 500; - - else if(document.location.toString().startsWith('https://') && url.toString().startsWith('http://')) - error = 'can\'t check'; - - var finalURL = netdataURL(url); - - setTimeout(function() { - document.getElementById('gotoServerList').innerHTML += '<tr><td style="padding-left: 20px;"><a href="' + verifyURL(finalURL) + '" target="_blank">' + escapeUserInputHTML(url) + '</a></td><td style="padding-left: 30px;"><code id="' + guid + '-' + id + '-status">checking...</code></td></tr>'; - - NETDATA.registry.hello(url, function(data) { - if(typeof data !== 'undefined' && data !== null && typeof data.machine_guid === 'string' && data.machine_guid === guid) { - // console.log('OK ' + id + ' URL: ' + url); - document.getElementById(guid + '-' + id + '-status').innerHTML = "OK"; - - if(!gotoServerStop) { - gotoServerStop = true; - - if(gotoServerMiddleClick) { - window.open(verifyURL(finalURL), '_blank'); - gotoServerMiddleClick = false; - document.getElementById('gotoServerResponse').innerHTML = '<b>Opening new window to ' + NETDATA.registry.machines[guid].name + '<br/><a href="' + verifyURL(finalURL) + '">' + escapeUserInputHTML(url) + '</a></b><br/>(check your pop-up blocker if it fails)'; - } - else { - document.getElementById('gotoServerResponse').innerHTML += 'found it! It is at:<br/><small>' + escapeUserInputHTML(url) + '</small>'; - document.location = verifyURL(finalURL); - } - } - } - else { - if(typeof data !== 'undefined' && data !== null && typeof data.machine_guid === 'string' && data.machine_guid !== guid) - error = 'wrong machine'; - - document.getElementById(guid + '-' + id + '-status').innerHTML = error; - gotoServerValidateRemaining--; - if(gotoServerValidateRemaining <= 0) { - gotoServerMiddleClick = false; - document.getElementById('gotoServerResponse').innerHTML = '<b>Sorry! I cannot find any operational URL for this server</b>'; - } - } - }); - }, (id * 50) + penalty); - } - - function gotoServerModalHandler(guid) { - // console.log('goto server: ' + guid); - - gotoServerStop = false; - var checked = {}; - var len = NETDATA.registry.machines[guid].alternate_urls.length; - var count = 0; - - document.getElementById('gotoServerResponse').innerHTML = ''; - document.getElementById('gotoServerList').innerHTML = ''; - document.getElementById('gotoServerName').innerHTML = NETDATA.registry.machines[guid].name; - $('#gotoServerModal').modal('show'); - - gotoServerValidateRemaining = len; - while(len--) { - var url = NETDATA.registry.machines[guid].alternate_urls[len]; - checked[url] = true; - gotoServerValidateUrl(count++, guid, url); - } - - setTimeout(function() { - if(gotoServerStop === false) { - document.getElementById('gotoServerResponse').innerHTML = '<b>Added all the known URLs for this machine.</b>'; - NETDATA.registry.search(guid, function(data) { - // console.log(data); - len = data.urls.length; - while(len--) { - var url = data.urls[len][1]; - // console.log(url); - if(typeof checked[url] === 'undefined') { - gotoServerValidateRemaining++; - checked[url] = true; - gotoServerValidateUrl(count++, guid, url); - } - } - }); - } - }, 2000); - return false; - } - - function gotoServerInit() { - $(".registry_link").on('click', function(e) { - if(e.which === 2) { - e.preventDefault(); - gotoServerMiddleClick = true; - } - else { - gotoServerMiddleClick = false; - } - - return true; - }); - } - - function switchRegistryModalHandler() { - document.getElementById('switchRegistryPersonGUID').value = NETDATA.registry.person_guid; - document.getElementById('switchRegistryURL').innerHTML = NETDATA.registry.server; - document.getElementById('switchRegistryResponse').innerHTML = ''; - $('#switchRegistryModal').modal('show'); - } - - function notifyForSwitchRegistry() { - var n = document.getElementById('switchRegistryPersonGUID').value; - - if(n !== '' && n.length === 36) { - NETDATA.registry.switch(n, function(result) { - if(result !== null) { - $('#switchRegistryModal').modal('hide'); - NETDATA.registry.init(); - } - else { - document.getElementById('switchRegistryResponse').innerHTML = "<b>Sorry! The registry rejected your request.</b>"; - } - }); - } - else - document.getElementById('switchRegistryResponse').innerHTML = "<b>The ID you have entered is not a GUID.</b>"; - } - - var deleteRegistryUrl = null; - function deleteRegistryModalHandler(guid, name, url) { - void(guid); - - deleteRegistryUrl = url; - document.getElementById('deleteRegistryServerName').innerHTML = name; - document.getElementById('deleteRegistryServerName2').innerHTML = name; - document.getElementById('deleteRegistryServerURL').innerHTML = url; - document.getElementById('deleteRegistryResponse').innerHTML = ''; - $('#deleteRegistryModal').modal('show'); - } - - function notifyForDeleteRegistry() { - if(deleteRegistryUrl) { - NETDATA.registry.delete(deleteRegistryUrl, function(result) { - if(result !== null) { - deleteRegistryUrl = null; - $('#deleteRegistryModal').modal('hide'); - NETDATA.registry.init(); - } - else { - document.getElementById('deleteRegistryResponse').innerHTML = "<b>Sorry! this command was rejected by the registry server.</b>"; - } - }); - } - } - - var options = { - menus: {}, - submenu_names: {}, - data: null, - hostname: 'netdata_server', // will be overwritten by the netdata server - version: 'unknown', - hosts: [], - - duration: 0, // the default duration of the charts - update_every: 1, - - chartsPerRow: 0, - // chartsMinWidth: 1450, - chartsHeight: 180, - }; - - function chartsPerRow(total) { - void(total); - - if(options.chartsPerRow === 0) { - return 1; - //var width = Math.floor(total / options.chartsMinWidth); - //if(width === 0) width = 1; - //return width; - } - else return options.chartsPerRow; - } - - function prioritySort(a, b) { - if(a.priority < b.priority) return -1; - if(a.priority > b.priority) return 1; - return naturalSortCompare(a.name, b.name); - } - - function sortObjectByPriority(object) { - var idx = {}; - var sorted = []; - - for(var i in object) { - if(!object.hasOwnProperty(i)) continue; - - if(typeof idx[i] === 'undefined') { - idx[i] = object[i]; - sorted.push(i); - } - } - - sorted.sort(function(a, b) { - if(idx[a].priority < idx[b].priority) return -1; - if(idx[a].priority > idx[b].priority) return 1; - return naturalSortCompare(a, b); - }); - - return sorted; - } - - - // ---------------------------------------------------------------------------- - // scroll to a section, without changing the browser history - - function scrollToId(hash) { - if(hash && hash !== '' && document.getElementById(hash) !== null) { - var offset = $('#' + hash).offset(); - if(typeof offset !== 'undefined') { - //console.log('scrolling to ' + hash + ' at ' + offset.top.toString()); - $('html, body').animate({scrollTop: offset.top - 30}, 0); - } - } - - // we must return false to prevent the default action - return false; - } - - // ---------------------------------------------------------------------------- - - // user editable information - var customDashboard = { - menu: {}, - submenu: {}, - context: {} - }; - - // netdata standard information - var netdataDashboard = { - sparklines_registry: {}, - os: 'unknown', - - menu: {}, - submenu: {}, - context: {}, - - // generate a sparkline - // used in the documentation - sparkline: function (prefix, chart, dimension, units, suffix) { - if(options.data === null || typeof options.data.charts === 'undefined') - return ''; - - if(typeof options.data.charts[chart] === 'undefined') - return ''; - - if(typeof options.data.charts[chart].dimensions === 'undefined') - return ''; - - if(typeof options.data.charts[chart].dimensions[dimension] === 'undefined') - return ''; - - var key = chart + '.' + dimension; - - if(typeof units === 'undefined') - units = ''; - - if(typeof this.sparklines_registry[key] === 'undefined') - this.sparklines_registry[key] = { count: 1 }; - else - this.sparklines_registry[key].count++; - - key = key + '.' + this.sparklines_registry[key].count; - - return prefix + '<div class="netdata-container" data-netdata="' + chart + '" data-after="-120" data-width="25%" data-height="15px" data-chart-library="dygraph" data-dygraph-theme="sparkline" data-dimensions="' + dimension + '" data-show-value-of-' + dimension + '-at="' + key + '"></div> (<span id="' + key + '" style="display: inline-block; min-width: 50px; text-align: right;">X</span>' + units + ')' + suffix; - }, - - gaugeChart: function(title, width, dimensions, colors) { - if(typeof colors === 'undefined') - colors = ''; - - if(typeof dimensions === 'undefined') - dimensions = ''; - - return '<div class="netdata-container" data-netdata="CHART_UNIQUE_ID"' - + ' data-dimensions="' + dimensions + '"' - + ' data-chart-library="gauge"' - + ' data-gauge-adjust="width"' - + ' data-title="' + title + '"' - + ' data-width="' + width + '"' - + ' data-before="0"' - + ' data-after="-CHART_DURATION"' - + ' data-points="CHART_DURATION"' - + ' data-colors="' + colors + '"' - + ' role="application"></div>'; - }, - - anyAttribute: function(obj, attr, key, def) { - if(typeof(obj[key]) !== 'undefined') { - var x = obj[key][attr]; - - if(typeof(x) === 'undefined') - return def; - - if(typeof(x) === 'function') { - return x(netdataDashboard.os); - } - - return x; - } - - return def; - }, - - menuTitle: function(chart) { - if(typeof chart.menu_pattern !== 'undefined') { - return (this.anyAttribute(this.menu, 'title', chart.menu_pattern, chart.menu_pattern).toString() - + ' ' + chart.type.slice(-(chart.type.length - chart.menu_pattern.length - 1)).toString()).replace(/_/g, ' '); - } - - return (this.anyAttribute(this.menu, 'title', chart.menu, chart.menu)).toString().replace(/_/g, ' '); - }, - - menuIcon: function(chart) { - if(typeof chart.menu_pattern !== 'undefined') - return this.anyAttribute(this.menu, 'icon', chart.menu_pattern, '<i class="fas fa-puzzle-piece"></i>').toString(); - - return this.anyAttribute(this.menu, 'icon', chart.menu, '<i class="fas fa-puzzle-piece"></i>'); - }, - - menuInfo: function(chart) { - if(typeof chart.menu_pattern !== 'undefined') - return this.anyAttribute(this.menu, 'info', chart.menu_pattern, null); - - return this.anyAttribute(this.menu, 'info', chart.menu, null); - }, - - menuHeight: function(chart) { - if(typeof chart.menu_pattern !== 'undefined') - return this.anyAttribute(this.menu, 'height', chart.menu_pattern, 1.0); - - return this.anyAttribute(this.menu, 'height', chart.menu, 1.0); - }, - - submenuTitle: function(menu, submenu) { - var key = menu + '.' + submenu; - // console.log(key); - var title = this.anyAttribute(this.submenu, 'title', key, submenu).toString().replace(/_/g, ' '); - if(title.length > 28) { - var a = title.substring(0, 13); - var b = title.substring(title.length - 12, title.length); - return a + '...' + b; - } - return title; - }, - - submenuInfo: function(menu, submenu) { - var key = menu + '.' + submenu; - return this.anyAttribute(this.submenu, 'info', key, null); - }, - - submenuHeight: function(menu, submenu, relative) { - var key = menu + '.' + submenu; - return this.anyAttribute(this.submenu, 'height', key, 1.0) * relative; - }, - - contextInfo: function(id) { - var x = this.anyAttribute(this.context, 'info', id, null); - - if(x !== null) - return '<div class="shorten dashboard-context-info netdata-chart-alignment" role="document">' + x + '</div>'; - else - return ''; - }, - - contextValueRange: function(id) { - if(typeof this.context[id] !== 'undefined' && typeof this.context[id].valueRange !== 'undefined') - return this.context[id].valueRange; - else - return '[null, null]'; - }, - - contextHeight: function(id, def) { - if(typeof this.context[id] !== 'undefined' && typeof this.context[id].height !== 'undefined') - return def * this.context[id].height; - else - return def; - }, - - contextDecimalDigits: function(id, def) { - if(typeof this.context[id] !== 'undefined' && typeof this.context[id].decimalDigits !== 'undefined') - return this.context[id].decimalDigits; - else - return def; - } - }; - - // ---------------------------------------------------------------------------- - - // enrich the data structure returned by netdata - // to reflect our menu system and content - // TODO: this is a shame - we should fix charts naming (issue #807) - function enrichChartData(chart) { - var parts = chart.type.split('_'); - var tmp = parts[0]; - - switch(tmp) { - case 'ap': - case 'net': - case 'disk': - case 'statsd': - chart.menu = tmp; - break; - - case 'apache': - chart.menu = chart.type; - if(parts.length > 2 && parts[1] === 'cache') - chart.menu_pattern = tmp + '_' + parts[1]; - else if(parts.length > 1) - chart.menu_pattern = tmp; - break; - - case 'bind': - chart.menu = chart.type; - if(parts.length > 2 && parts[1] === 'rndc') - chart.menu_pattern = tmp + '_' + parts[1]; - else if(parts.length > 1) - chart.menu_pattern = tmp; - break; - - case 'cgroup': - chart.menu = chart.type; - if(chart.id.match(/.*[\._\/-:]qemu[\._\/-:]*/) || chart.id.match(/.*[\._\/-:]kvm[\._\/-:]*/)) - chart.menu_pattern = 'cgqemu'; - else - chart.menu_pattern = 'cgroup'; - break; - - case 'go': - chart.menu = chart.type; - if(parts.length > 2 && parts[1] === 'expvar') - chart.menu_pattern = tmp + '_' + parts[1]; - else if(parts.length > 1) - chart.menu_pattern = tmp; - break; - - case 'isc': - chart.menu = chart.type; - if(parts.length > 2 && parts[1] === 'dhcpd') - chart.menu_pattern = tmp + '_' + parts[1]; - else if(parts.length > 1) - chart.menu_pattern = tmp; - break; - - case 'ovpn': - chart.menu = chart.type; - if(parts.length > 3 && parts[1] === 'status' && parts[2] === 'log') - chart.menu_pattern = tmp + '_' + parts[1]; - else if(parts.length > 1) - chart.menu_pattern = tmp; - break; - - case 'smartd': - case 'web': - chart.menu = chart.type; - if(parts.length > 2 && parts[1] === 'log') - chart.menu_pattern = tmp + '_' + parts[1]; - else if(parts.length > 1) - chart.menu_pattern = tmp; - break; - - case 'tc': - chart.menu = tmp; - - // find a name for this device from fireqos info - // we strip '_(in|out)' or '(in|out)_' - if(chart.context === 'tc.qos' && (typeof options.submenu_names[chart.family] === 'undefined' || options.submenu_names[chart.family] === chart.family)) { - var n = chart.name.split('.')[1]; - if(n.endsWith('_in')) - options.submenu_names[chart.family] = n.slice(0, n.lastIndexOf('_in')); - else if(n.endsWith('_out')) - options.submenu_names[chart.family] = n.slice(0, n.lastIndexOf('_out')); - else if(n.startsWith('in_')) - options.submenu_names[chart.family] = n.slice(3, n.length); - else if(n.startsWith('out_')) - options.submenu_names[chart.family] = n.slice(4, n.length); - else - options.submenu_names[chart.family] = n; - } - - // increase the priority of IFB devices - // to have inbound appear before outbound - if(chart.id.match(/.*-ifb$/)) - chart.priority--; - - break; - - default: - chart.menu = chart.type; - if(parts.length > 1) - chart.menu_pattern = tmp; - break; - } - - chart.submenu = chart.family; - } - - // ---------------------------------------------------------------------------- - - function headMain(os, charts, duration) { - void(os); - - if(urlOptions.mode === 'print') - return ''; - - var head = ''; - - if(typeof charts['system.swap'] !== 'undefined') - head += '<div class="netdata-container" style="margin-right: 10px;" data-netdata="system.swap"' - + ' data-dimensions="used"' - + ' data-append-options="percentage"' - + ' data-chart-library="easypiechart"' - + ' data-title="Used Swap"' - + ' data-units="%"' - + ' data-easypiechart-max-value="100"' - + ' data-width="9%"' - + ' data-before="0"' - + ' data-after="-' + duration.toString() + '"' - + ' data-points="' + duration.toString() + '"' - + ' data-colors="#DD4400"' - + ' role="application"></div>'; - - if(typeof charts['system.io'] !== 'undefined') { - head += '<div class="netdata-container" style="margin-right: 10px;" data-netdata="system.io"' - + ' data-dimensions="in"' - + ' data-chart-library="easypiechart"' - + ' data-title="Disk Read"' - + ' data-width="11%"' - + ' data-before="0"' - + ' data-after="-' + duration.toString() + '"' - + ' data-points="' + duration.toString() + '"' - + ' data-common-units="system.io.mainhead"' - + ' role="application"></div>'; - - head += '<div class="netdata-container" style="margin-right: 10px;" data-netdata="system.io"' - + ' data-dimensions="out"' - + ' data-chart-library="easypiechart"' - + ' data-title="Disk Write"' - + ' data-width="11%"' - + ' data-before="0"' - + ' data-after="-' + duration.toString() + '"' - + ' data-points="' + duration.toString() + '"' - + ' data-common-units="system.io.mainhead"' - + ' role="application"></div>'; - } - else if(typeof charts['system.pgpgio'] !== 'undefined') { - head += '<div class="netdata-container" style="margin-right: 10px;" data-netdata="system.pgpgio"' - + ' data-dimensions="in"' - + ' data-chart-library="easypiechart"' - + ' data-title="Disk Read"' - + ' data-width="11%"' - + ' data-before="0"' - + ' data-after="-' + duration.toString() + '"' - + ' data-points="' + duration.toString() + '"' - + ' data-common-units="system.pgpgio.mainhead"' - + ' role="application"></div>'; - - head += '<div class="netdata-container" style="margin-right: 10px;" data-netdata="system.pgpgio"' - + ' data-dimensions="out"' - + ' data-chart-library="easypiechart"' - + ' data-title="Disk Write"' - + ' data-width="11%"' - + ' data-before="0"' - + ' data-after="-' + duration.toString() + '"' - + ' data-points="' + duration.toString() + '"' - + ' data-common-units="system.pgpgio.mainhead"' - + ' role="application"></div>'; - } - - if(typeof charts['system.cpu'] !== 'undefined') - head += '<div class="netdata-container" style="margin-right: 10px;" data-netdata="system.cpu"' - + ' data-chart-library="gauge"' - + ' data-title="CPU"' - + ' data-units="%"' - + ' data-gauge-max-value="100"' - + ' data-width="20%"' - + ' data-after="-' + duration.toString() + '"' - + ' data-points="' + duration.toString() + '"' - + ' data-colors="' + NETDATA.colors[12] + '"' - + ' role="application"></div>'; - - if(typeof charts['system.net'] !== 'undefined') { - head += '<div class="netdata-container" style="margin-right: 10px;" data-netdata="system.net"' - + ' data-dimensions="received"' - + ' data-chart-library="easypiechart"' - + ' data-title="Net Inbound"' - + ' data-width="11%"' - + ' data-before="0"' - + ' data-after="-' + duration.toString() + '"' - + ' data-points="' + duration.toString() + '"' - + ' data-common-units="system.net.mainhead"' - + ' role="application"></div>'; - - head += '<div class="netdata-container" style="margin-right: 10px;" data-netdata="system.net"' - + ' data-dimensions="sent"' - + ' data-chart-library="easypiechart"' - + ' data-title="Net Outbound"' - + ' data-width="11%"' - + ' data-before="0"' - + ' data-after="-' + duration.toString() + '"' - + ' data-points="' + duration.toString() + '"' - + ' data-common-units="system.net.mainhead"' - + ' role="application"></div>'; - } - else if(typeof charts['system.ip'] !== 'undefined') { - head += '<div class="netdata-container" style="margin-right: 10px;" data-netdata="system.ip"' - + ' data-dimensions="received"' - + ' data-chart-library="easypiechart"' - + ' data-title="IP Inbound"' - + ' data-width="11%"' - + ' data-before="0"' - + ' data-after="-' + duration.toString() + '"' - + ' data-points="' + duration.toString() + '"' - + ' data-common-units="system.ip.mainhead"' - + ' role="application"></div>'; - - head += '<div class="netdata-container" style="margin-right: 10px;" data-netdata="system.ip"' - + ' data-dimensions="sent"' - + ' data-chart-library="easypiechart"' - + ' data-title="IP Outbound"' - + ' data-width="11%"' - + ' data-before="0"' - + ' data-after="-' + duration.toString() + '"' - + ' data-points="' + duration.toString() + '"' - + ' data-common-units="system.ip.mainhead"' - + ' role="application"></div>'; - } - else if(typeof charts['system.ipv4'] !== 'undefined') { - head += '<div class="netdata-container" style="margin-right: 10px;" data-netdata="system.ipv4"' - + ' data-dimensions="received"' - + ' data-chart-library="easypiechart"' - + ' data-title="IPv4 Inbound"' - + ' data-width="11%"' - + ' data-before="0"' - + ' data-after="-' + duration.toString() + '"' - + ' data-points="' + duration.toString() + '"' - + ' data-common-units="system.ipv4.mainhead"' - + ' role="application"></div>'; - - head += '<div class="netdata-container" style="margin-right: 10px;" data-netdata="system.ipv4"' - + ' data-dimensions="sent"' - + ' data-chart-library="easypiechart"' - + ' data-title="IPv4 Outbound"' - + ' data-width="11%"' - + ' data-before="0"' - + ' data-after="-' + duration.toString() + '"' - + ' data-points="' + duration.toString() + '"' - + ' data-common-units="system.ipv4.mainhead"' - + ' role="application"></div>'; - } - else if(typeof charts['system.ipv6'] !== 'undefined') { - head += '<div class="netdata-container" style="margin-right: 10px;" data-netdata="system.ipv6"' - + ' data-dimensions="received"' - + ' data-chart-library="easypiechart"' - + ' data-title="IPv6 Inbound"' - + ' data-units="kbps"' - + ' data-width="11%"' - + ' data-before="0"' - + ' data-after="-' + duration.toString() + '"' - + ' data-points="' + duration.toString() + '"' - + ' data-common-units="system.ipv6.mainhead"' - + ' role="application"></div>'; - - head += '<div class="netdata-container" style="margin-right: 10px;" data-netdata="system.ipv6"' - + ' data-dimensions="sent"' - + ' data-chart-library="easypiechart"' - + ' data-title="IPv6 Outbound"' - + ' data-units="kbps"' - + ' data-width="11%"' - + ' data-before="0"' - + ' data-after="-' + duration.toString() + '"' - + ' data-points="' + duration.toString() + '"' - + ' data-common-units="system.ipv6.mainhead"' - + ' role="application"></div>'; - } - - if(typeof charts['system.ram'] !== 'undefined') - head += '<div class="netdata-container" style="margin-right: 10px;" data-netdata="system.ram"' - + ' data-dimensions="used|buffers|active|wired"' // active and wired are FreeBSD stats - + ' data-append-options="percentage"' - + ' data-chart-library="easypiechart"' - + ' data-title="Used RAM"' - + ' data-units="%"' - + ' data-easypiechart-max-value="100"' - + ' data-width="9%"' - + ' data-after="-' + duration.toString() + '"' - + ' data-points="' + duration.toString() + '"' - + ' data-colors="' + NETDATA.colors[7] + '"' - + ' role="application"></div>'; - - return head; - } - - function generateHeadCharts(type, chart, duration) { - if(urlOptions.mode === 'print') - return ''; - - var head = ''; - var hcharts = netdataDashboard.anyAttribute(netdataDashboard.context, type, chart.context, []); - if(hcharts.length > 0) { - var hi = 0, hlen = hcharts.length; - while(hi < hlen) { - if(typeof hcharts[hi] === 'function') - head += hcharts[hi](netdataDashboard.os, chart.id).replace(/CHART_DURATION/g, duration.toString()).replace(/CHART_UNIQUE_ID/g, chart.id); - else - head += hcharts[hi].replace(/CHART_DURATION/g, duration.toString()).replace(/CHART_UNIQUE_ID/g, chart.id); - hi++; - } - } - return head; - } - - function renderPage(menus, data) { - var div = document.getElementById('charts_div'); - var pcent_width = Math.floor(100 / chartsPerRow($(div).width())); - - // find the proper duration for per-second updates - var duration = Math.round(($(div).width() * pcent_width / 100 * data.update_every / 3) / 60) * 60; - options.duration = duration; - options.update_every = data.update_every; - - var html = ''; - var sidebar = '<ul class="nav dashboard-sidenav" data-spy="affix" id="sidebar_ul">'; - var mainhead = headMain(netdataDashboard.os, data.charts, duration); - - // sort the menus - var main = sortObjectByPriority(menus); - var i = 0, len = main.length; - while(i < len) { - var menu = main[i++]; - - // generate an entry at the main menu - - var menuid = NETDATA.name2id('menu_' + menu); - sidebar += '<li class=""><a href="#' + menuid + '" onClick="return scrollToId(\'' + menuid + '\');">' + menus[menu].icon + ' ' + menus[menu].title + '</a><ul class="nav">'; - html += '<div role="section" class="dashboard-section"><div role="sectionhead"><h1 id="' + menuid + '" role="heading">' + menus[menu].icon + ' ' + menus[menu].title + '</h1></div><div role="section" class="dashboard-subsection">'; - - if(menus[menu].info !== null) - html += menus[menu].info; - - // console.log(' >> ' + menu + ' (' + menus[menu].priority + '): ' + menus[menu].title); - - var shtml = ''; - var mhead = '<div class="netdata-chart-row">' + mainhead; - mainhead = ''; - - // sort the submenus of this menu - var sub = sortObjectByPriority(menus[menu].submenus); - var si = 0, slen = sub.length; - while(si < slen) { - var submenu = sub[si++]; - - // generate an entry at the submenu - var submenuid = NETDATA.name2id('menu_' + menu + '_submenu_' + submenu); - sidebar += '<li class><a href="#' + submenuid + '" onClick="return scrollToId(\'' + submenuid + '\');">' + menus[menu].submenus[submenu].title + '</a></li>'; - shtml += '<div role="section" class="dashboard-section-container" id="' + submenuid + '"><h2 id="' + submenuid + '" class="netdata-chart-alignment" role="heading">' + menus[menu].submenus[submenu].title + '</h2>'; - - if(menus[menu].submenus[submenu].info !== null) - shtml += '<div class="dashboard-submenu-info netdata-chart-alignment" role="document">' + menus[menu].submenus[submenu].info + '</div>'; - - var head = '<div class="netdata-chart-row">'; - var chtml = ''; - - // console.log(' \------- ' + submenu + ' (' + menus[menu].submenus[submenu].priority + '): ' + menus[menu].submenus[submenu].title); - - // sort the charts in this submenu of this menu - menus[menu].submenus[submenu].charts.sort(prioritySort); - var ci = 0, clen = menus[menu].submenus[submenu].charts.length; - while(ci < clen) { - var chart = menus[menu].submenus[submenu].charts[ci++]; - - // generate the submenu heading charts - mhead += generateHeadCharts('mainheads', chart, duration); - head += generateHeadCharts('heads', chart, duration); - - function chartCommonMin(family, context, units) { - var x = netdataDashboard.anyAttribute(netdataDashboard.context, 'commonMin', context, undefined); - if(typeof x !== 'undefined') - return ' data-common-min="' + family + '/' + context + '/' + units + '"'; - else - return ''; - } - - function chartCommonMax(family, context, units) { - var x = netdataDashboard.anyAttribute(netdataDashboard.context, 'commonMax', context, undefined); - if(typeof x !== 'undefined') - return ' data-common-max="' + family + '/' + context + '/' + units + '"'; - else - return ''; - } - - // generate the chart - if(urlOptions.mode === 'print') - chtml += '<div role="row" class="dashboard-print-row">'; - - chtml += '<div class="netdata-chartblock-container" style="width: ' + pcent_width.toString() + '%;">' + netdataDashboard.contextInfo(chart.context) + '<div class="netdata-container" id="chart_' + NETDATA.name2id(chart.id) + '" data-netdata="' + chart.id + '"' - + ' data-width="100%"' - + ' data-height="' + netdataDashboard.contextHeight(chart.context, options.chartsHeight).toString() + 'px"' - + ' data-dygraph-valuerange="' + netdataDashboard.contextValueRange(chart.context) + '"' - + ' data-before="0"' - + ' data-after="-' + duration.toString() + '"' - + ' data-id="' + NETDATA.name2id(options.hostname + '/' + chart.id) + '"' - + ' data-colors="' + netdataDashboard.anyAttribute(netdataDashboard.context, 'colors', chart.context, '') + '"' - + ' data-decimal-digits="' + netdataDashboard.contextDecimalDigits(chart.context, -1) + '"' - + chartCommonMin(chart.family, chart.context, chart.units) - + chartCommonMax(chart.family, chart.context, chart.units) - + ' role="application"></div></div>'; - - if(urlOptions.mode === 'print') - chtml += '</div>'; - - // console.log(' \------- ' + chart.id + ' (' + chart.priority + '): ' + chart.context + ' height: ' + menus[menu].submenus[submenu].height); - } - - head += '</div>'; - shtml += head + chtml + '</div>'; - } - - mhead += '</div>'; - sidebar += '</ul></li>'; - html += mhead + shtml + '</div></div><hr role="separator"/>'; - } - - sidebar += '<li class="" style="padding-top:15px;"><a href="https://github.com/netdata/netdata/wiki/Add-more-charts-to-netdata" target="_blank"><i class="fas fa-plus"></i> add more charts</a></li>'; - sidebar += '<li class=""><a href="https://github.com/netdata/netdata/wiki/Add-more-alarms-to-netdata" target="_blank"><i class="fas fa-plus"></i> add more alarms</a></li>'; - sidebar += '<li class="" style="margin:20px;color:#666;"><small>netdata on <b>' + data.hostname.toString() + '</b>, collects every ' + ((data.update_every === 1)?'second':data.update_every.toString() + ' seconds') + ' <b>' + data.dimensions_count.toLocaleString() + '</b> metrics, presented as <b>' + data.charts_count.toLocaleString() + '</b> charts and monitored by <b>' + data.alarms_count.toLocaleString() + '</b> alarms, using ' + Math.round(data.rrd_memory_bytes / 1024 / 1024).toLocaleString() + ' MB of memory for ' + NETDATA.seconds4human(data.update_every * data.history, { space: ' ' }) + ' of real-time history.<br/> <br/><b>netdata</b><br/>v' + data.version.toString() +'</small></li>'; - sidebar += '</ul>'; - div.innerHTML = html; - document.getElementById('sidebar').innerHTML = sidebar; - - if(urlOptions.highlight === true) - NETDATA.globalChartUnderlay.init(null - , urlOptions.highlight_after - , urlOptions.highlight_before - , (urlOptions.after > 0) ? urlOptions.after : null - , (urlOptions.before > 0) ? urlOptions.before : null - ); - else - NETDATA.globalChartUnderlay.clear(); - - if(urlOptions.mode === 'print') - printPage(); - else - finalizePage(); - } - - function renderChartsAndMenu(data) { - options.menus = {}; - options.submenu_names = {}; - - var menus = options.menus; - var charts = data.charts; - var m, menu_key; - - for(var c in charts) { - if(!charts.hasOwnProperty(c)) continue; - - var chart = charts[c]; - enrichChartData(chart); - m = chart.menu; - - // create the menu - if(typeof menus[m] === 'undefined') { - menus[m] = { - menu_pattern: chart.menu_pattern, - priority: chart.priority, - submenus: {}, - title: netdataDashboard.menuTitle(chart), - icon: netdataDashboard.menuIcon(chart), - info: netdataDashboard.menuInfo(chart), - height: netdataDashboard.menuHeight(chart) * options.chartsHeight - }; - } - else { - if(typeof(menus[m].menu_pattern) === 'undefined') - menus[m].menu_pattern = chart.menu_pattern; - - if(chart.priority < menus[m].priority) - menus[m].priority = chart.priority; - } - - menu_key = (typeof(menus[m].menu_pattern) !== 'undefined')?menus[m].menu_pattern:m; - - // create the submenu - if(typeof menus[m].submenus[chart.submenu] === 'undefined') { - menus[m].submenus[chart.submenu] = { - priority: chart.priority, - charts: [], - title: null, - info: netdataDashboard.submenuInfo(menu_key, chart.submenu), - height: netdataDashboard.submenuHeight(menu_key, chart.submenu, menus[m].height) - }; - } - else { - if (chart.priority < menus[m].submenus[chart.submenu].priority) - menus[m].submenus[chart.submenu].priority = chart.priority; - } - - // index the chart in the menu/submenu - menus[m].submenus[chart.submenu].charts.push(chart); - } - - // propagate the descriptive subname given to QoS - // to all the other submenus with the same name - for(m in menus) { - if(!menus.hasOwnProperty(m)) continue; - - for(var s in menus[m].submenus) { - if(!menus[m].submenus.hasOwnProperty(s)) continue; - - // set the family using a name - if(typeof options.submenu_names[s] !== 'undefined') { - menus[m].submenus[s].title = s + ' (' + options.submenu_names[s] + ')'; - } - else { - menu_key = (typeof(menus[m].menu_pattern) !== 'undefined')?menus[m].menu_pattern:m; - menus[m].submenus[s].title = netdataDashboard.submenuTitle(menu_key, s); - } - } - } - - renderPage(menus, data); - } - - // ---------------------------------------------------------------------------- - - function loadJs(url, callback) { - $.ajax({ - url: url, - cache: true, - dataType: "script", - xhrFields: { withCredentials: true } // required for the cookie - }) - .fail(function() { - alert('Cannot load required JS library: ' + url); - }) - .always(function() { - if(typeof callback === 'function') - callback(); - }) - } - - var clipboardLoaded = false; - function loadClipboard(callback) { - if(clipboardLoaded === false) { - clipboardLoaded = true; - loadJs('lib/clipboard-polyfill-be05dad.js', callback); - } - else callback(); - } - - var bootstrapTableLoaded = false; - function loadBootstrapTable(callback) { - if(bootstrapTableLoaded === false) { - bootstrapTableLoaded = true; - loadJs('lib/bootstrap-table-1.11.0.min.js', function() { - loadJs('lib/bootstrap-table-export-1.11.0.min.js', function() { - loadJs('lib/tableExport-1.6.0.min.js', callback); - }) - }); - } - else callback(); - } - - var bootstrapSliderLoaded = false; - function loadBootstrapSlider(callback) { - if(bootstrapSliderLoaded === false) { - bootstrapSliderLoaded = true; - loadJs('lib/bootstrap-slider-10.0.0.min.js', function() { - NETDATA._loadCSS('css/bootstrap-slider-10.0.0.min.css'); - callback(); - }); - } - else callback(); - } - - var lzStringLoaded = false; - function loadLzString(callback) { - if(lzStringLoaded === false) { - lzStringLoaded = true; - loadJs('lib/lz-string-1.4.4.min.js', callback); - } - else callback(); - } - - var pakoLoaded = false; - function loadPako(callback) { - if(pakoLoaded === false) { - pakoLoaded = true; - loadJs('lib/pako-1.0.6.min.js', callback); - } - else callback(); - } - - // ---------------------------------------------------------------------------- - - function clipboardCopy(text) { - clipboard.writeText(text); - } - function clipboardCopyBadgeEmbed(url) { - clipboard.writeText('<embed src="' + url + '" type="image/svg+xml" height="20"/>'); - } - - - // ---------------------------------------------------------------------------- - - function alarmsUpdateModal() { - var active = '<h3>Raised Alarms</h3><table class="table">'; - var all = '<h3>All Running Alarms</h3><div class="panel-group" id="alarms_all_accordion" role="tablist" aria-multiselectable="true">'; - var footer = '<hr/><a href="https://github.com/netdata/netdata/wiki/Generating-Badges" target="_blank">netdata badges</a> refresh automatically. Their color indicates the state of the alarm: <span style="color: #e05d44"><b> red </b></span> is critical, <span style="color:#fe7d37"><b> orange </b></span> is warning, <span style="color: #4c1"><b> bright green </b></span> is ok, <span style="color: #9f9f9f"><b> light grey </b></span> is undefined (i.e. no data or no status), <span style="color: #000"><b> black </b></span> is not initialized. You can copy and paste their URLs to embed them in any web page.<br/>netdata can send notifications for these alarms. Check <a href="https://github.com/netdata/netdata/blob/master/conf.d/health_alarm_notify.conf">this configuration file</a> for more information.'; - - loadClipboard(function() {}); - - NETDATA.alarms.get('all', function(data) { - options.alarm_families = []; - - alarmsCallback(data); - - if(data === null) { - document.getElementById('alarms_active').innerHTML = - document.getElementById('alarms_all').innerHTML = - document.getElementById('alarms_log').innerHTML = - 'failed to load alarm data!'; - return; - } - - function alarmid4human(id) { - if(id === 0) - return '-'; - - return id.toString(); - } - - function timestamp4human(timestamp, space) { - if(timestamp === 0) - return '-'; - - if(typeof space === 'undefined') - space = ' '; - - var t = new Date(timestamp * 1000); - var now = new Date(); - - if(t.toDateString() === now.toDateString()) - return t.toLocaleTimeString(); - - return t.toLocaleDateString() + space + t.toLocaleTimeString(); - } - - function alarm_lookup_explain(alarm, chart) { - var dimensions = ' of all values '; - - if(chart.dimensions.length > 1) - dimensions = ' of the sum of all dimensions '; - - if(typeof alarm.lookup_dimensions !== 'undefined') { - var d = alarm.lookup_dimensions.replace(/|/g, ','); - var x = d.split(','); - if(x.length > 1) - dimensions = 'of the sum of dimensions <code>' + alarm.lookup_dimensions + '</code> '; - else - dimensions = 'of all values of dimension <code>' + alarm.lookup_dimensions + '</code> '; - } - - return '<code>' + alarm.lookup_method + '</code> ' - + dimensions + ', of chart <code>' + alarm.chart + '</code>' - + ', starting <code>' + NETDATA.seconds4human(alarm.lookup_after + alarm.lookup_before, { space: ' ' }) + '</code> and up to <code>' + NETDATA.seconds4human(alarm.lookup_before, { space: ' ' }) + '</code>' - + ((alarm.lookup_options)?(', with options <code>' + alarm.lookup_options.replace(/ /g, ', ') + '</code>'):'') - + '.'; - } - - function alarm_to_html(alarm, full) { - var chart = options.data.charts[alarm.chart]; - if(typeof(chart) === 'undefined') { - chart = options.data.charts_by_name[alarm.chart]; - if (typeof(chart) === 'undefined') { - // this means the charts loaded are incomplete - // probably netdata was restarted and more alarms - // are now available. - console.log('Cannot find chart ' + alarm.chart + ', you probably need to refresh the page.'); - return ''; - } - } - - var has_alarm = (typeof alarm.warn !== 'undefined' || typeof alarm.crit !== 'undefined'); - var badge_url = NETDATA.alarms.server + '/api/v1/badge.svg?chart=' + alarm.chart + '&alarm=' + alarm.name + '&refresh=auto'; - - var action_buttons = '<br/> <br/>role: <b>' + alarm.recipient + '</b><br/> <br/>' - + '<div class="action-button ripple" title="click to scroll the dashboard to the chart of this alarm" data-toggle="tooltip" data-placement="bottom" onClick="scrollToChartAfterHidingModal(\'' + alarm.chart + '\'); $(\'#alarmsModal\').modal(\'hide\'); return false;"><i class="fab fa-periscope"></i></div>' - + '<div class="action-button ripple" title="click to copy to the clipboard the URL of this badge" data-toggle="tooltip" data-placement="bottom" onClick="clipboardCopy(\'' + badge_url + '\'); return false;"><i class="far fa-copy"></i></div>' - + '<div class="action-button ripple" title="click to copy to the clipboard an auto-refreshing <code>embed</code> html element for this badge" data-toggle="tooltip" data-placement="bottom" onClick="clipboardCopyBadgeEmbed(\'' + badge_url + '\'); return false;"><i class="fas fa-copy"></i></div>'; - - var html = '<tr><td class="text-center" style="vertical-align:middle" width="40%"><b>' + alarm.chart + '</b><br/> <br/><embed src="' + badge_url + '" type="image/svg+xml" height="20"/><br/> <br/><span style="font-size: 18px">' + alarm.info + '</span>' + action_buttons + '</td>' - + '<td><table class="table">' - + ((typeof alarm.warn !== 'undefined')?('<tr><td width="10%" style="text-align:right">warning when</td><td><span style="font-family: monospace; color:#fe7d37; font-weight: bold;">' + alarm.warn + '</span></td></tr>'):'') - + ((typeof alarm.crit !== 'undefined')?('<tr><td width="10%" style="text-align:right">critical when</td><td><span style="font-family: monospace; color: #e05d44; font-weight: bold;">' + alarm.crit + '</span></td></tr>'):''); - - if(full === true) { - var units = chart.units; - if(units === '%') units = '%'; - - html += ((typeof alarm.lookup_after !== 'undefined')?('<tr><td width="10%" style="text-align:right">db lookup</td><td>' + alarm_lookup_explain(alarm, chart) + '</td></tr>'):'') - + ((typeof alarm.calc !== 'undefined')?('<tr><td width="10%" style="text-align:right">calculation</td><td><span style="font-family: monospace;">' + alarm.calc + '</span></td></tr>'):'') - + ((chart.green !== null)?('<tr><td width="10%" style="text-align:right">green threshold</td><td><code>' + chart.green + ' ' + units + '</code></td></tr>'):'') - + ((chart.red !== null)?('<tr><td width="10%" style="text-align:right">red threshold</td><td><code>' + chart.red + ' ' + units + '</code></td></tr>'):''); - } - - var delay = ''; - if((alarm.delay_up_duration > 0 || alarm.delay_down_duration > 0) && alarm.delay_multiplier !== 0 && alarm.delay_max_duration > 0) { - if(alarm.delay_up_duration === alarm.delay_down_duration) { - delay += '<small><br/>hysteresis ' + NETDATA.seconds4human(alarm.delay_up_duration, { space: ' ', negative_suffix: '' }); - } - else { - delay = '<small><br/>hysteresis '; - if(alarm.delay_up_duration > 0) { - delay += 'on escalation <code>' + NETDATA.seconds4human(alarm.delay_up_duration, { space: ' ', negative_suffix: '' }) + '</code>, '; - } - if(alarm.delay_down_duration > 0) { - delay += 'on recovery <code>' + NETDATA.seconds4human(alarm.delay_down_duration, { space: ' ', negative_suffix: '' }) + '</code>, '; - } - } - if(alarm.delay_multiplier !== 1.0) { - delay += 'multiplied by <code>' + alarm.delay_multiplier.toString() + '</code>'; - delay += ', up to <code>' + NETDATA.seconds4human(alarm.delay_max_duration, { space: ' ', negative_suffix: '' }) + '</code>'; - } - delay += '</small>'; - } - - html += '<tr><td width="10%" style="text-align:right">check every</td><td>' + NETDATA.seconds4human(alarm.update_every, { space: ' ', negative_suffix: '' }) + '</td></tr>' - + ((has_alarm === true)?('<tr><td width="10%" style="text-align:right">execute</td><td><span style="font-family: monospace;">' + alarm.exec + '</span>' + delay + '</td></tr>'):'') - + '<tr><td width="10%" style="text-align:right">source</td><td><span style="font-family: monospace;">' + alarm.source + '</span></td></tr>' - + '</table></td></tr>'; - - return html; - } - - function alarm_family_show(id) { - var html = '<table class="table">'; - var family = options.alarm_families[id]; - var len = family.arr.length; - while(len--) { - var alarm = family.arr[len]; - html += alarm_to_html(alarm, true); - } - html += '</table>'; - - $('#alarm_all_' + id.toString()).html(html); - enableTooltipsAndPopovers(); - } - - // find the proper family of each alarm - var x, family, alarm; - var count_active = 0; - var count_all = 0; - var families = {}; - var families_sort = []; - for(x in data.alarms) { - if(!data.alarms.hasOwnProperty(x)) continue; - - alarm = data.alarms[x]; - family = alarm.family; - - // find the chart - var chart = options.data.charts[alarm.chart]; - if(typeof chart === 'undefined') - chart = options.data.charts_by_name[alarm.chart]; - - // not found - this should never happen! - if(typeof chart === 'undefined') { - console.log('WARNING: alarm ' + x + ' is linked to chart ' + alarm.chart + ', which is not found in the list of chart got from the server.'); - chart = { priority: 9999999 }; - } - else if(typeof chart.menu !== 'undefined' && typeof chart.submenu !== 'undefined') - // the family based on the chart - family = chart.menu + ' - ' + chart.submenu; - - if(typeof families[family] === 'undefined') { - families[family] = { - name: family, - arr: [], - priority: chart.priority - }; - - families_sort.push(families[family]); - } - - if(chart.priority < families[family].priority) - families[family].priority = chart.priority; - - families[family].arr.unshift(alarm); - } - - // sort the families, like the dashboard menu does - var families_sorted = families_sort.sort(function (a, b) { - if (a.priority < b.priority) return -1; - if (a.priority > b.priority) return 1; - return naturalSortCompare(a.name, b.name); - }); - - var i = 0; - var fc = 0; - var len = families_sorted.length; - while(len--) { - family = families_sorted[i++].name; - var active_family_added = false; - var expanded = 'true'; - var collapsed = ''; - var cin = 'in'; - - if(fc !== 0) { - all += "</table></div></div></div>"; - expanded = 'false'; - collapsed = 'class="collapsed"'; - cin = ''; - } - - all += '<div class="panel panel-default"><div class="panel-heading" role="tab" id="alarm_all_heading_' + fc.toString() + '"><h4 class="panel-title"><a ' + collapsed + ' role="button" data-toggle="collapse" data-parent="#alarms_all_accordion" href="#alarm_all_' + fc.toString() + '" aria-expanded="' + expanded + '" aria-controls="alarm_all_' + fc.toString() + '">' + family.toString() + '</a></h4></div><div id="alarm_all_' + fc.toString() + '" class="panel-collapse collapse ' + cin + '" role="tabpanel" aria-labelledby="alarm_all_heading_' + fc.toString() + '" data-alarm-id="' + fc.toString() + '"><div class="panel-body" id="alarm_all_body_' + fc.toString() + '">'; - - options.alarm_families[fc] = families[family]; - - fc++; - - var arr = families[family].arr; - var c = arr.length; - while(c--) { - alarm = arr[c]; - if(alarm.status === 'WARNING' || alarm.status === 'CRITICAL') { - if(!active_family_added) { - active_family_added = true; - active += '<tr><th class="text-center" colspan="2"><h4>' + family + '</h4></th></tr>'; - } - count_active++; - active += alarm_to_html(alarm, true); - } - - count_all++; - } - } - active += "</table>"; - if(families_sorted.length > 0) all += "</div></div></div>"; - all += "</div>"; - - if(!count_active) - active += '<div style="width:100%; height: 100px; text-align: center;"><span style="font-size: 50px;"><i class="fas fa-thumbs-up"></i></span><br/>Everything is normal. No raised alarms.</div>'; - else - active += footer; - - if(!count_all) - all += "<h4>No alarms are running in this system.</h4>"; - else - all += footer; - - document.getElementById('alarms_active').innerHTML = active; - document.getElementById('alarms_all').innerHTML = all; - enableTooltipsAndPopovers(); - - if(families_sorted.length > 0) alarm_family_show(0); - - // register bootstrap events - var $accordion = $('#alarms_all_accordion'); - $accordion.on('show.bs.collapse', function (d) { - var target = $(d.target); - var id = $(target).data('alarm-id'); - alarm_family_show(id); - }); - $accordion.on('hidden.bs.collapse', function (d) { - var target = $(d.target); - var id = $(target).data('alarm-id'); - $('#alarm_all_' + id.toString()).html(''); - }); - - document.getElementById('alarms_log').innerHTML = '<h3>Alarm Log</h3><table id="alarms_log_table"></table>'; - - loadBootstrapTable(function () { - $('#alarms_log_table').bootstrapTable({ - url: NETDATA.alarms.server + '/api/v1/alarm_log?all', - cache: false, - pagination: true, - pageSize: 10, - showPaginationSwitch: false, - search: true, - searchTimeOut: 300, - searchAlign: 'left', - showColumns: true, - showExport: true, - exportDataType: 'basic', - exportOptions: { - fileName: 'netdata_alarm_log' - }, - rowStyle: function(row, index) { - void(index); - - switch(row.status) { - case 'CRITICAL' : return { classes: 'danger' }; break; - case 'WARNING' : return { classes: 'warning' }; break; - case 'UNDEFINED': return { classes: 'info' }; break; - case 'CLEAR' : return { classes: 'success' }; break; - } - return {}; - }, - showFooter: false, - showHeader: true, - showRefresh: true, - showToggle: false, - sortable: true, - silentSort: false, - columns: [ - { - field: 'when', - title: 'Event Date', - valign: 'middle', - titleTooltip: 'The date and time the even took place', - formatter: function(value, row, index) { void(row); void(index); return timestamp4human(value, ' '); }, - align: 'center', - switchable: false, - sortable: true - }, - { - field: 'hostname', - title: 'Host', - valign: 'middle', - titleTooltip: 'The host that generated this event', - align: 'center', - visible: false, - sortable: true - }, - { - field: 'unique_id', - title: 'Unique ID', - titleTooltip: 'The host unique ID for this event', - formatter: function(value, row, index) { void(row); void(index); return alarmid4human(value); }, - align: 'center', - valign: 'middle', - visible: false, - sortable: true - }, - { - field: 'alarm_id', - title: 'Alarm ID', - titleTooltip: 'The ID of the alarm that generated this event', - formatter: function(value, row, index) { void(row); void(index); return alarmid4human(value); }, - align: 'center', - valign: 'middle', - visible: false, - sortable: true - }, - { - field: 'alarm_event_id', - title: 'Alarm Event ID', - titleTooltip: 'The incremental ID of this event for the given alarm', - formatter: function(value, row, index) { void(row); void(index); return alarmid4human(value); }, - align: 'center', - valign: 'middle', - visible: false, - sortable: true - }, - { - field: 'chart', - title: 'Chart', - titleTooltip: 'The chart the alarm is attached to', - align: 'center', - valign: 'middle', - switchable: false, - sortable: true - }, - { - field: 'family', - title: 'Family', - titleTooltip: 'The family of the chart the alarm is attached to', - align: 'center', - valign: 'middle', - visible: false, - sortable: true - }, - { - field: 'name', - title: 'Alarm', - titleTooltip: 'The alarm name that generated this event', - formatter: function(value, row, index) { - void(row); - void(index); - return value.toString().replace(/_/g, ' '); - }, - align: 'center', - valign: 'middle', - switchable: false, - sortable: true - }, - { - field: 'value_string', - title: 'Friendly Value', - titleTooltip: 'The value of the alarm, that triggered this event', - align: 'right', - valign: 'middle', - sortable: true - }, - { - field: 'old_value_string', - title: 'Friendly Old Value', - titleTooltip: 'The value of the alarm, just before this event', - align: 'right', - valign: 'middle', - visible: false, - sortable: true - }, - { - field: 'old_value', - title: 'Old Value', - titleTooltip: 'The value of the alarm, just before this event', - formatter: function(value, row, index) { - void(row); - void(index); - return ((value !== null)?Math.round(value * 100) / 100:'NaN').toString(); - }, - align: 'center', - valign: 'middle', - visible: false, - sortable: true - }, - { - field: 'value', - title: 'Value', - titleTooltip: 'The value of the alarm, that triggered this event', - formatter: function(value, row, index) { - void(row); - void(index); - return ((value !== null)?Math.round(value * 100) / 100:'NaN').toString(); - }, - align: 'right', - valign: 'middle', - visible: false, - sortable: true - }, - { - field: 'units', - title: 'Units', - titleTooltip: 'The units of the value of the alarm', - align: 'left', - valign: 'middle', - visible: false, - sortable: true - }, - { - field: 'old_status', - title: 'Old Status', - titleTooltip: 'The status of the alarm, just before this event', - align: 'center', - valign: 'middle', - visible: false, - sortable: true - }, - { - field: 'status', - title: 'Status', - titleTooltip: 'The status of the alarm, that was set due to this event', - align: 'center', - valign: 'middle', - switchable: false, - sortable: true - }, - { - field: 'duration', - title: 'Last Duration', - titleTooltip: 'The duration the alarm was at its previous state, just before this event', - formatter: function(value, row, index) { - void(row); - void(index); - return NETDATA.seconds4human(value, { negative_suffix: '', space: ' ', now: 'no time' }); - }, - align: 'center', - valign: 'middle', - visible: false, - sortable: true - }, - { - field: 'non_clear_duration', - title: 'Raised Duration', - titleTooltip: 'The duration the alarm was raised, just before this event', - formatter: function(value, row, index) { - void(row); - void(index); - return NETDATA.seconds4human(value, { negative_suffix: '', space: ' ', now: 'no time' }); - }, - align: 'center', - valign: 'middle', - visible: false, - sortable: true - }, - { - field: 'recipient', - title: 'Recipient', - titleTooltip: 'The recipient of this event', - align: 'center', - valign: 'middle', - visible: false, - sortable: true - }, - { - field: 'processed', - title: 'Processed Status', - titleTooltip: 'True when this event is processed', - formatter: function(value, row, index) { - void(row); - void(index); - - if(value === true) - return 'DONE'; - else - return 'PENDING'; - }, - align: 'center', - valign: 'middle', - visible: false, - sortable: true - }, - { - field: 'updated', - title: 'Updated Status', - titleTooltip: 'True when this event has been updated by another event', - formatter: function(value, row, index) { - void(row); - void(index); - - if(value === true) - return 'UPDATED'; - else - return 'CURRENT'; - }, - align: 'center', - valign: 'middle', - visible: false, - sortable: true - }, - { - field: 'updated_by_id', - title: 'Updated By ID', - titleTooltip: 'The unique ID of the event that obsoleted this one', - formatter: function(value, row, index) { void(row); void(index); return alarmid4human(value); }, - align: 'center', - valign: 'middle', - visible: false, - sortable: true - }, - { - field: 'updates_id', - title: 'Updates ID', - titleTooltip: 'The unique ID of the event obsoleted because of this event', - formatter: function(value, row, index) { void(row); void(index); return alarmid4human(value); }, - align: 'center', - valign: 'middle', - visible: false, - sortable: true - }, - { - field: 'exec', - title: 'Script', - titleTooltip: 'The script to handle the event notification', - align: 'center', - valign: 'middle', - visible: false, - sortable: true - }, - { - field: 'exec_run', - title: 'Script Run At', - titleTooltip: 'The date and time the script has been ran', - formatter: function(value, row, index) { void(row); void(index); return timestamp4human(value, ' '); }, - align: 'center', - valign: 'middle', - visible: false, - sortable: true - }, - { - field: 'exec_code', - title: 'Script Return Value', - titleTooltip: 'The return code of the script', - formatter: function(value, row, index) { - void(row); - void(index); - - if(value === 0) - return 'OK (returned 0)'; - else - return 'FAILED (with code ' + value.toString() + ')'; - }, - align: 'center', - valign: 'middle', - visible: false, - sortable: true - }, - { - field: 'delay', - title: 'Script Delay', - titleTooltip: 'The hysteresis of the notification', - formatter: function(value, row, index) { - void(row); - void(index); - - return NETDATA.seconds4human(value, { negative_suffix: '', space: ' ', now: 'no time' }); - }, - align: 'center', - valign: 'middle', - visible: false, - sortable: true - }, - { - field: 'delay_up_to_timestamp', - title: 'Script Delay Run At', - titleTooltip: 'The date and time the script should be run, after hysteresis', - formatter: function(value, row, index) { void(row); void(index); return timestamp4human(value, ' '); }, - align: 'center', - valign: 'middle', - visible: false, - sortable: true - }, - { - field: 'info', - title: 'Description', - titleTooltip: 'A short description of the alarm', - align: 'center', - valign: 'middle', - visible: false, - sortable: true - }, - { - field: 'source', - title: 'Alarm Source', - titleTooltip: 'The source of configuration of the alarm', - align: 'center', - valign: 'middle', - visible: false, - sortable: true - } - ] - }); - // console.log($('#alarms_log_table').bootstrapTable('getOptions')); - }); - }); - } - - function alarmsCallback(data) { - var count = 0, x; - for(x in data.alarms) { - if(!data.alarms.hasOwnProperty(x)) continue; - - var alarm = data.alarms[x]; - if(alarm.status === 'WARNING' || alarm.status === 'CRITICAL') - count++; - } - - if(count > 0) - document.getElementById('alarms_count_badge').innerHTML = count.toString(); - else - document.getElementById('alarms_count_badge').innerHTML = ''; - } - - function initializeDynamicDashboardWithData(data) { - if(data !== null) { - options.hostname = data.hostname; - options.data = data; - options.version = data.version; - netdataDashboard.os = data.os; - - if(typeof data.hosts !=='undefined') - options.hosts = data.hosts; - - // update the dashboard hostname - document.getElementById('hostname').innerHTML = options.hostname + ((netdataSnapshotData !== null)?' (snap)':'').toString(); - document.getElementById('hostname').href = NETDATA.serverDefault; - document.getElementById('netdataVersion').innerHTML = options.version; - - if(netdataSnapshotData !== null) { - $('#alarmsButton').hide(); - $('#updateButton').hide(); - // $('#loadButton').hide(); - $('#saveButton').hide(); - $('#printButton').hide(); - } - - // update the dashboard title - document.title = options.hostname + ' netdata dashboard'; - - // close the splash screen - $("#loadOverlay").css("display","none"); - - // create a chart_by_name index - data.charts_by_name = {}; - var charts = data.charts; - var x; - for(x in charts) { - if(!charts.hasOwnProperty(x)) continue; - - var chart = charts[x]; - data.charts_by_name[chart.name] = chart; - } - - // render all charts - renderChartsAndMenu(data); - } - } - - // an object to keep initilization configuration - // needed due to the async nature of the XSS modal - var initializeConfig = { - url: null, - custom_info: true, - }; - - function loadCustomDashboardInfo(url, callback) { - loadJs(url, function () { - $.extend(true, netdataDashboard, customDashboard); - callback(); - }); - } - - function initializeChartsAndCustomInfo() { - NETDATA.alarms.callback = alarmsCallback; - - // download all the charts the server knows - NETDATA.chartRegistry.downloadAll(initializeConfig.url, function(data) { - if(data !== null) { - if (initializeConfig.custom_info === true && typeof data.custom_info !== 'undefined' && data.custom_info !== "" && netdataSnapshotData === null) { - //console.log('loading custom dashboard decorations from server ' + initializeConfig.url); - loadCustomDashboardInfo(NETDATA.serverDefault + data.custom_info, function () { - initializeDynamicDashboardWithData(data); - }); - } - else { - //console.log('not loading custom dashboard decorations from server ' + initializeConfig.url); - initializeDynamicDashboardWithData(data); - } - } - }); - } - - function xssModalDisableXss() { - //console.log('disabling xss checks'); - NETDATA.xss.enabled = false; - NETDATA.xss.enabled_for_data = false; - initializeConfig.custom_info = true; - initializeChartsAndCustomInfo(); - return false; - } - - function xssModalKeepXss() { - //console.log('keeping xss checks'); - NETDATA.xss.enabled = true; - NETDATA.xss.enabled_for_data = true; - initializeConfig.custom_info = false; - initializeChartsAndCustomInfo(); - return false; - } - - function initializeDynamicDashboard(netdata_url) { - if(typeof netdata_url === 'undefined' || netdata_url === null) - netdata_url = NETDATA.serverDefault; - - initializeConfig.url = netdata_url; - - // initialize clickable alarms - NETDATA.alarms.chart_div_offset = -50; - NETDATA.alarms.chart_div_id_prefix = 'chart_'; - NETDATA.alarms.chart_div_animation_duration = 0; - - NETDATA.pause(function() { - if(typeof netdataCheckXSS !== 'undefined' && netdataCheckXSS === true) { - //$("#loadOverlay").css("display","none"); - document.getElementById('netdataXssModalServer').innerText = initializeConfig.url; - $('#xssModal').modal('show'); - } - else { - initializeChartsAndCustomInfo(); - } - }); - } - - // ---------------------------------------------------------------------------- - - function versionLog(msg) { - document.getElementById('versionCheckLog').innerHTML = msg; - } - - function getNetdataCommitIdFromVersion() { - var s = options.version.split('-'); - - if(s.length !== 3) return null; - if(s[2][0] === 'g') { - var v = s[2].split('_')[0].substring(1, 8); - if(v.length === 7) { - versionLog('Installed git commit id of netdata is ' + v); - document.getElementById('netdataCommitId').innerHTML = v; - return v; - } - } - return null; - } - - function getNetdataCommitId(force, callback) { - versionLog('Downloading installed git commit id from netdata...'); - - $.ajax({ - url: 'version.txt', - async: true, - cache: false, - xhrFields: { withCredentials: true } // required for the cookie - }) - .done(function(data) { - data = data.replace(/(\r\n|\n|\r| |\t)/gm,""); - - var c = getNetdataCommitIdFromVersion(); - if(c !== null && data.length === 40 && data.substring(0, 7) !== c) { - versionLog('Installed files commit id and internal netdata git commit id do not match'); - data = c; - } - - if(data.length >= 7) { - versionLog('Installed git commit id of netdata is ' + data); - document.getElementById('netdataCommitId').innerHTML = data.substring(0, 7); - callback(data); - } - }) - .fail(function() { - versionLog('Failed to download installed git commit id from netdata!'); - - if(force === true) { - var c = getNetdataCommitIdFromVersion(); - if(c === null) versionLog('Cannot find the git commit id of netdata.'); - callback(c); - } - else - callback(null); - }); - } - - function getGithubLatestCommit(callback) { - versionLog('Downloading latest git commit id info from github...'); - - $.ajax({ - url: 'https://api.github.com/repos/netdata/netdata/commits', - async: true, - cache: false - }) - .done(function(data) { - versionLog('Latest git commit id from github is ' + data[0].sha); - callback(data[0].sha); - }) - .fail(function() { - versionLog('Failed to download installed git commit id from github!'); - callback(null); - }); - } - - function checkForUpdate(force, callback) { - getNetdataCommitId(force, function(sha1) { - if(sha1 === null) callback(null, null); - - getGithubLatestCommit(function(sha2) { - callback(sha1, sha2); - }); - }); - - return null; - } - - function notifyForUpdate(force) { - versionLog('<p>checking for updates...</p>'); - - var now = Date.now(); - - if(typeof force === 'undefined' || force !== true) { - var last = loadLocalStorage('last_update_check'); - - if(typeof last === 'string') - last = parseInt(last); - else - last = 0; - - if(now - last < 3600000 * 8) { - // no need to check it - too soon - return; - } - } - - checkForUpdate(force, function(sha1, sha2) { - var save = false; - - if(sha1 === null) { - save = false; - versionLog('<p><big>Failed to get your netdata git commit id!</big></p><p>You can always get the latest netdata from <a href="https://github.com/netdata/netdata" target="_blank">its github page</a>.</p>'); - } - else if(sha2 === null) { - save = false; - versionLog('<p><big>Failed to get the latest git commit id from github.</big></p><p>You can always get the latest netdata from <a href="https://github.com/netdata/netdata" target="_blank">its github page</a>.</p>'); - } - else if(sha1 === sha2) { - save = true; - versionLog('<p><big>You already have the latest netdata!</big></p><p>No update yet?<br/>Probably, we need some motivation to keep going on!</p><p>If you haven\'t already, <a href="https://github.com/netdata/netdata" target="_blank">give netdata a <b><i class="fas fa-star"></i></b> at its github page</a>.</p>'); - } - else { - save = true; - var compare = 'https://github.com/netdata/netdata/compare/' + sha1.toString() + '...' + sha2.toString(); - - versionLog('<p><big><strong>New version of netdata available!</strong></big></p><p>Latest commit: <b><code>' + sha2.substring(0, 7).toString() + '</code></b></p><p><a href="' + compare + '" target="_blank">Click here for the changes log</a> since your installed version, and<br/><a href="https://github.com/netdata/netdata/wiki/Updating-Netdata" target="_blank">click here for directions on updating</a> your netdata installation.</p><p>We suggest to review the changes log for new features you may be interested, or important bug fixes you may need.<br/>Keeping your netdata updated, is generally a good idea.</p>'); - - document.getElementById('update_badge').innerHTML = '!'; - } - - if(save) - saveLocalStorage('last_update_check', now.toString()); - }); - } - - // ---------------------------------------------------------------------------- - // printing dashboards - - function showPageFooter() { - document.getElementById('footer').style.display = 'block'; - } - - - function printPreflight() { - var url = document.location.origin.toString() + document.location.pathname.toString() + document.location.search.toString() + urlOptions.genHash() + ';mode=print'; - var width = 990; - var height = screen.height * 90 / 100; - //console.log(url); - //console.log(document.location); - window.open(url, '', 'width=' + width.toString() + ',height=' + height.toString() + ',menubar=no,toolbar=no,personalbar=no,location=no,resizable=no,scrollbars=yes,status=no,chrome=yes,centerscreen=yes,attention=yes,dialog=yes'); - $('#printPreflightModal').modal('hide'); - } - - function printPage() { - var print_is_rendering = true; - - $('#printModal').on('hide.bs.modal', function(e) { - if(print_is_rendering === true) { - e.preventDefault(); - return false; - } - - return true; - }); - - $('#printModal').on('show.bs.modal', function() { - var print_options = { - stop_updates_when_focus_is_lost: false, - update_only_visible: false, - sync_selection: false, - eliminate_zero_dimensions: false, - pan_and_zoom_data_padding: false, - show_help: false, - legend_toolbox: false, - resize_charts: false, - pixels_per_point: 1 - }; - - var x; - for(x in print_options) { - if (print_options.hasOwnProperty(x)) - NETDATA.options.current[x] = print_options[x]; - } - - NETDATA.parseDom(); - showPageFooter(); - - NETDATA.globalSelectionSync.stop(); - NETDATA.globalPanAndZoom.setMaster(NETDATA.options.targets[0], urlOptions.after, urlOptions.before); - // NETDATA.onresize(); - - var el = document.getElementById('printModalProgressBar'); - var eltxt = document.getElementById('printModalProgressBarText'); - - function update_chart(idx) { - var state = NETDATA.options.targets[--idx]; - - var pcent = (NETDATA.options.targets.length - idx) * 100 / NETDATA.options.targets.length; - $(el).css('width', pcent+'%').attr('aria-valuenow', pcent); - eltxt.innerText = Math.round(pcent).toString() + '%, ' + state.id; - - setTimeout(function() { - state.updateChart(function () { - NETDATA.options.targets[idx].resizeForPrint(); - - if (idx > 0) { - update_chart(idx); - } - else { - print_is_rendering = false; - $('#printModal').modal('hide'); - window.print(); - window.close(); - } - }) - }, 0); - } - - print_is_rendering = true; - update_chart(NETDATA.options.targets.length); - }); - - $('#printModal').modal('show'); - } - - // -------------------------------------------------------------------- - - function jsonStringifyFn(obj) { - return JSON.stringify(obj, function (key, value) { - return (typeof value === 'function' ) ? value.toString() : value; - }); - } - - function jsonParseFn(str) { - return JSON.parse(str, function (key, value) { - if (typeof value != 'string') return value; - return ( value.substring(0, 8) == 'function') ? eval('(' + value + ')') : value; - }); - } - - // -------------------------------------------------------------------- - - var snapshotOptions = { - bytes_per_chart: 2048, - compressionDefault: 'pako.deflate.base64', - - compressions: { - 'none': { - bytes_per_point_memory: 5.2, - bytes_per_point_disk: 5.6, - - compress: function (s) { - return s; - }, - - compressed_length: function (s) { - return s.length; - }, - - uncompress: function (s) { - return s; - } - }, - - 'pako.deflate.base64': { - bytes_per_point_memory: 1.8, - bytes_per_point_disk: 1.9, - - compress: function (s) { - return btoa(pako.deflate(s, { to: 'string' })); - }, - - compressed_length: function (s) { - return s.length; - }, - - uncompress: function (s) { - return pako.inflate(atob(s), {to: 'string'}); - } - }, - - 'pako.deflate': { - bytes_per_point_memory: 1.4, - bytes_per_point_disk: 3.2, - - compress: function (s) { - return pako.deflate(s, { to: 'string' }); - }, - - compressed_length: function (s) { - return s.length; - }, - - uncompress: function (s) { - return pako.inflate(s, {to: 'string'}); - } - }, - - 'lzstring.utf16': { - bytes_per_point_memory: 1.7, - bytes_per_point_disk: 2.6, - - compress: function (s) { - return LZString.compressToUTF16(s); - }, - - compressed_length: function (s) { - return s.length * 2; - }, - - uncompress: function (s) { - return LZString.decompressFromUTF16(s); - } - }, - - 'lzstring.base64': { - bytes_per_point_memory: 2.1, - bytes_per_point_disk: 2.3, - - compress: function (s) { - return LZString.compressToBase64(s); - }, - - compressed_length: function (s) { - return s.length; - }, - - uncompress: function (s) { - return LZString.decompressFromBase64(s); - } - }, - - 'lzstring.uri': { - bytes_per_point_memory: 2.1, - bytes_per_point_disk: 2.3, - - compress: function (s) { - return LZString.compressToEncodedURIComponent(s); - }, - - compressed_length: function (s) { - return s.length; - }, - - uncompress: function (s) { - return LZString.decompressFromEncodedURIComponent(s); - } - } - } - }; - - // -------------------------------------------------------------------- - // loading snapshots - - function loadSnapshotModalLog(priority, msg) { - document.getElementById('loadSnapshotStatus').className = "alert alert-" + priority; - document.getElementById('loadSnapshotStatus').innerHTML = msg; - } - - var tmpSnapshotData = null; - function loadSnapshot() { - $('#loadSnapshotImport').addClass('disabled'); - - if(tmpSnapshotData === null) { - loadSnapshotPreflightEmpty(); - loadSnapshotModalLog('danger', 'no data have been loaded'); - return; - } - - loadPako(function() { - loadLzString(function () { - loadSnapshotModalLog('info', 'Please wait, activating snapshot...'); - $('#loadSnapshotModal').modal('hide'); - - netdataShowAlarms = false; - netdataRegistry = false; - netdataServer = tmpSnapshotData.server; - NETDATA.serverDefault = netdataServer; - - document.getElementById('charts_div').innerHTML = ''; - document.getElementById('sidebar').innerHTML = ''; - NETDATA.globalReset(); - - if (typeof tmpSnapshotData.hash !== 'undefined') - urlOptions.hash = tmpSnapshotData.hash; - else - urlOptions.hash = '#'; - - if (typeof tmpSnapshotData.info !== 'undefined') { - var info = jsonParseFn(tmpSnapshotData.info); - if (typeof info.menu !== 'undefined') - netdataDashboard.menu = info.menu; - - if (typeof info.submenu !== 'undefined') - netdataDashboard.submenu = info.submenu; - - if (typeof info.context !== 'undefined') - netdataDashboard.context = info.context; - } - - if (typeof tmpSnapshotData.compression !== 'string') - tmpSnapshotData.compression = 'none'; - - if (typeof snapshotOptions.compressions[tmpSnapshotData.compression] === 'undefined') { - alert('unknown compression method: ' + tmpSnapshotData.compression); - tmpSnapshotData.compression = 'none'; - } - - tmpSnapshotData.uncompress = snapshotOptions.compressions[tmpSnapshotData.compression].uncompress; - netdataSnapshotData = tmpSnapshotData; - - urlOptions.after = tmpSnapshotData.after_ms; - urlOptions.before = tmpSnapshotData.before_ms; - - if( typeof tmpSnapshotData.highlight_after_ms !== 'undefined' - && tmpSnapshotData.highlight_after_ms !== null - && tmpSnapshotData.highlight_after_ms > 0 - && typeof tmpSnapshotData.highlight_before_ms !== 'undefined' - && tmpSnapshotData.highlight_before_ms !== null - && tmpSnapshotData.highlight_before_ms > 0 - ) { - urlOptions.highlight_after = tmpSnapshotData.highlight_after_ms; - urlOptions.highlight_before = tmpSnapshotData.highlight_before_ms; - urlOptions.highlight = true; - } - else { - urlOptions.highlight_after = 0; - urlOptions.highlight_before = 0; - urlOptions.highlight = false; - } - - netdataCheckXSS = false; // disable the modal - this does not affect XSS checks, since dashboard.js is already loaded - NETDATA.xss.enabled = true; // we should not do any remote requests, but if we do, check them - NETDATA.xss.enabled_for_data = true; // check also snapshot data - that have been excluded from the initial check, due to compression - loadSnapshotPreflightEmpty(); - initializeDynamicDashboard(); - }); - }); - }; - - - function loadSnapshotPreflightFile(file) { - var filename = NETDATA.xss.string(file.name); - var fr = new FileReader(); - fr.onload = function(e) { - document.getElementById('loadSnapshotFilename').innerHTML = filename; - var result = null; - try { - result = NETDATA.xss.checkAlways('snapshot', JSON.parse(e.target.result), /^(snapshot\.info|snapshot\.data)$/); - - //console.log(result); - var date_after = new Date(result.after_ms); - var date_before = new Date(result.before_ms); - - if (typeof result.charts_ok === 'undefined') - result.charts_ok = 'unknown'; - - if (typeof result.charts_failed === 'undefined') - result.charts_failed = 0; - - if (typeof result.compression === 'undefined') - result.compression = 'none'; - - if (typeof result.data_size === 'undefined') - result.data_size = 0; - - document.getElementById('loadSnapshotFilename').innerHTML = '<code>' + filename + '</code>'; - document.getElementById('loadSnapshotHostname').innerHTML = '<b>' + result.hostname + '</b>, netdata version: <b>' + result.netdata_version.toString() + '</b>'; - document.getElementById('loadSnapshotURL').innerHTML = result.url; - document.getElementById('loadSnapshotCharts').innerHTML = result.charts.charts_count.toString() + ' charts, ' + result.charts.dimensions_count.toString() + ' dimensions, ' + result.data_points.toString() + ' points per dimension, ' + Math.round(result.duration_ms / result.data_points).toString() + ' ms per point'; - document.getElementById('loadSnapshotInfo').innerHTML = 'version: <b>' + result.snapshot_version.toString() + '</b>, includes <b>' + result.charts_ok.toString() + '</b> unique chart data queries ' + ((result.charts_failed > 0) ? ('<b>' + result.charts_failed.toString() + '</b> failed') : '').toString() + ', compressed with <code>' + result.compression.toString() + '</code>, data size ' + (Math.round(result.data_size * 100 / 1024 / 1024) / 100).toString() + ' MB'; - document.getElementById('loadSnapshotTimeRange').innerHTML = '<b>' + NETDATA.dateTime.localeDateString(date_after) + ' ' + NETDATA.dateTime.localeTimeString(date_after) + '</b> to <b>' + NETDATA.dateTime.localeDateString(date_before) + ' ' + NETDATA.dateTime.localeTimeString(date_before) + '</b>'; - document.getElementById('loadSnapshotComments').innerHTML = ((result.comments) ? result.comments : '').toString(); - loadSnapshotModalLog('success', 'File loaded, click <b>Import</b> to render it!'); - $('#loadSnapshotImport').removeClass('disabled'); - - tmpSnapshotData = result; - } - catch (e) { - console.log(e); - document.getElementById('loadSnapshotStatus').className = "alert alert-danger"; - document.getElementById('loadSnapshotStatus').innerHTML = "Failed to parse this file!"; - $('#loadSnapshotImport').addClass('disabled'); - } - } - - //console.log(file); - fr.readAsText(file); - }; - - function loadSnapshotPreflightEmpty() { - document.getElementById('loadSnapshotFilename').innerHTML = ''; - document.getElementById('loadSnapshotHostname').innerHTML = ''; - document.getElementById('loadSnapshotURL').innerHTML = ''; - document.getElementById('loadSnapshotCharts').innerHTML = ''; - document.getElementById('loadSnapshotInfo').innerHTML = ''; - document.getElementById('loadSnapshotTimeRange').innerHTML = ''; - document.getElementById('loadSnapshotComments').innerHTML = ''; - loadSnapshotModalLog('success', 'Browse for a snapshot file (or drag it and drop it here), then click <b>Import</b> to render it.'); - $('#loadSnapshotImport').addClass('disabled'); - }; - - var loadSnapshotDragAndDropInitialized = false; - function loadSnapshotDragAndDropSetup() { - if(loadSnapshotDragAndDropInitialized === false) { - loadSnapshotDragAndDropInitialized = true; - $('#loadSnapshotDragAndDrop') - .on('drag dragstart dragend dragover dragenter dragleave drop', function (e) { - e.preventDefault(); - e.stopPropagation(); - }) - .on('drop', function (e) { - if(e.originalEvent.dataTransfer.files.length) { - loadSnapshotPreflightFile(e.originalEvent.dataTransfer.files.item(0)); - } - else { - loadSnapshotPreflightEmpty(); - loadSnapshotModalLog('danger', 'No file selected'); - } - }); - } - }; - - function loadSnapshotPreflight() { - var files = document.getElementById('loadSnapshotSelectFiles').files; - if (files.length <= 0) { - loadSnapshotPreflightEmpty(); - loadSnapshotModalLog('danger', 'No file selected'); - return; - } - - loadSnapshotModalLog('info', 'Loading file...'); - - loadSnapshotPreflightFile(files.item(0)); - } - - // -------------------------------------------------------------------- - // saving snapshots - - var saveSnapshotStop = false; - function saveSnapshotCancel() { - saveSnapshotStop = true; - } - - var saveSnapshotModalInitialized = false; - function saveSnapshotModalSetup() { - if(saveSnapshotModalInitialized === false) { - saveSnapshotModalInitialized = true; - $('#saveSnapshotModal') - .on('hide.bs.modal', saveSnapshotCancel) - .on('show.bs.modal', saveSnapshotModalInit) - .on('shown.bs.modal', function() { - $('#saveSnapshotResolutionSlider').find(".slider-handle:first").attr("tabindex", 1); - document.getElementById('saveSnapshotComments').focus(); - }); - } - }; - - function saveSnapshotModalLog(priority, msg) { - document.getElementById('saveSnapshotStatus').className = "alert alert-" + priority; - document.getElementById('saveSnapshotStatus').innerHTML = msg; - } - - function saveSnapshotModalShowExpectedSize() { - var points = Math.round(saveSnapshotViewDuration / saveSnapshotSelectedSecondsPerPoint); - var priority = 'info'; - var msg = 'A moderate snapshot.'; - - var sizemb = Math.round( - (options.data.charts_count * snapshotOptions.bytes_per_chart - + options.data.dimensions_count * points * snapshotOptions.compressions[saveSnapshotCompression].bytes_per_point_disk) - * 10 / 1024 / 1024) / 10; - - var memmb = Math.round( - (options.data.charts_count * snapshotOptions.bytes_per_chart - + options.data.dimensions_count * points * snapshotOptions.compressions[saveSnapshotCompression].bytes_per_point_memory) - * 10 / 1024 / 1024) / 10; - - if(sizemb < 10) { - priority = 'success'; - msg = 'A nice small snapshot!'; - } - if(sizemb > 50) { - priority = 'warning'; - msg = 'Will stress your browser...'; - } - if(sizemb > 100) { - priority = 'danger'; - msg = 'Hm... good luck...'; - } - - saveSnapshotModalLog(priority, 'The snapshot will have ' + points.toString() + ' points per dimension. Expected size on disk ' + sizemb + ' MB, at browser memory ' + memmb + ' MB.<br/>' + msg); - } - - var saveSnapshotCompression = snapshotOptions.compressionDefault; - function saveSnapshotSetCompression(name) { - saveSnapshotCompression = name; - document.getElementById('saveSnapshotCompressionName').innerHTML = saveSnapshotCompression; - saveSnapshotModalShowExpectedSize(); - } - - var saveSnapshotSlider = null; - var saveSnapshotSelectedSecondsPerPoint = 1; - var saveSnapshotViewDuration = 1; - function saveSnapshotModalInit() { - $('#saveSnapshotModalProgressSection').hide(); - $('#saveSnapshotResolutionRadio').show(); - saveSnapshotModalLog('info', 'Select resolution and click <b>Save</b>'); - $('#saveSnapshotExport').removeClass('disabled'); - - loadBootstrapSlider(function() { - saveSnapshotViewDuration = options.duration; - var start_ms = Math.round(Date.now() - saveSnapshotViewDuration * 1000); - - if(NETDATA.globalPanAndZoom.isActive() === true) { - saveSnapshotViewDuration = Math.round((NETDATA.globalPanAndZoom.force_before_ms - NETDATA.globalPanAndZoom.force_after_ms) / 1000); - start_ms = NETDATA.globalPanAndZoom.force_after_ms; - } - - var start_date = new Date(start_ms); - var yyyymmddhhssmm = start_date.getFullYear() + NETDATA.zeropad(start_date.getMonth() + 1) + NETDATA.zeropad(start_date.getDate()) + '-' + NETDATA.zeropad(start_date.getHours()) + NETDATA.zeropad(start_date.getMinutes()) + NETDATA.zeropad(start_date.getSeconds()); - - document.getElementById('saveSnapshotFilename').value = 'netdata-' + options.hostname.toString() + '-' + yyyymmddhhssmm.toString() + '-' + saveSnapshotViewDuration.toString() + '.snapshot'; - saveSnapshotSetCompression(saveSnapshotCompression); - - var min = options.update_every; - var max = Math.round(saveSnapshotViewDuration / 100); - - if(NETDATA.globalPanAndZoom.isActive() === false) - max = Math.round(saveSnapshotViewDuration / 50); - - var view = Math.round(saveSnapshotViewDuration / Math.round($(document.getElementById('charts_div')).width() / 2)); - - // console.log('view duration: ' + saveSnapshotViewDuration + ', min: ' + min + ', max: ' + max + ', view: ' + view); - - if(max < 10) max = 10; - if(max < min) max = min; - if(view < min) view = min; - if(view > max) view = max; - - if(saveSnapshotSlider !== null) - saveSnapshotSlider.destroy(); - - saveSnapshotSlider = new Slider('#saveSnapshotResolutionSlider', { - ticks: [ min, view, max ], - min: min, - max: max, - step: options.update_every, - value: view, - scale: (max > 100)?'logarithmic':'linear', - tooltip: 'always', - formatter: function(value) { - if(value < 1) - value = 1; - - if(value < options.data.update_every) - value = options.data.update_every; - - saveSnapshotSelectedSecondsPerPoint = value; - saveSnapshotModalShowExpectedSize(); - - var seconds = ' seconds '; - if(value === 1) - seconds = ' second '; - - return value + seconds + 'per point' + ((value === options.data.update_every)?', server default':'').toString(); - } - }); - }); - } - - function saveSnapshot() { - loadPako(function () { - loadLzString(function () { - saveSnapshotStop = false; - $('#saveSnapshotModalProgressSection').show(); - $('#saveSnapshotResolutionRadio').hide(); - $('#saveSnapshotExport').addClass('disabled'); - - var filename = document.getElementById('saveSnapshotFilename').value; - // console.log(filename); - saveSnapshotModalLog('info', 'Generating snapshot as <code>' + filename.toString() + '</code>'); - - var save_options = { - stop_updates_when_focus_is_lost: false, - update_only_visible: false, - sync_selection: false, - eliminate_zero_dimensions: true, - pan_and_zoom_data_padding: false, - show_help: false, - legend_toolbox: false, - resize_charts: false, - pixels_per_point: 1 - }; - var backedup_options = {}; - - var x; - for (x in save_options) { - if (save_options.hasOwnProperty(x)) { - backedup_options[x] = NETDATA.options.current[x]; - NETDATA.options.current[x] = save_options[x]; - } - } - - var el = document.getElementById('saveSnapshotModalProgressBar'); - var eltxt = document.getElementById('saveSnapshotModalProgressBarText'); - - options.data.charts_by_name = null; - - var saveData = { - hostname: options.hostname, - server: NETDATA.serverDefault, - netdata_version: options.data.version, - snapshot_version: 1, - after_ms: Date.now() - options.duration * 1000, - before_ms: Date.now(), - highlight_after_ms: urlOptions.highlight_after, - highlight_before_ms: urlOptions.highlight_before, - duration_ms: options.duration * 1000, - update_every_ms: options.update_every * 1000, - data_points: 0, - url: ((urlOptions.server !== null) ? urlOptions.server : document.location.origin.toString() + document.location.pathname.toString() + document.location.search.toString()).toString(), - comments: document.getElementById('saveSnapshotComments').value.toString(), - hash: urlOptions.hash, - charts: options.data, - info: jsonStringifyFn({ - menu: netdataDashboard.menu, - submenu: netdataDashboard.submenu, - context: netdataDashboard.context - }), - charts_ok: 0, - charts_failed: 0, - compression: saveSnapshotCompression, - data_size: 0, - data: {} - }; - - if(typeof snapshotOptions.compressions[saveData.compression] === 'undefined') { - alert('unknown compression method: ' + saveData.compression); - saveData.compression = 'none'; - } - - var compress = snapshotOptions.compressions[saveData.compression].compress; - var compressed_length = snapshotOptions.compressions[saveData.compression].compressed_length; - - function pack_api1_v1_chart_data(state) { - if (state.library_name === null || state.data === null) - return; - - var data = state.data; - state.data = null; - data.state = null; - var str = JSON.stringify(data); - - if (typeof str === 'string') { - var cstr = compress(str); - saveData.data[state.chartDataUniqueID()] = cstr; - return compressed_length(cstr); - } - else - return 0; - } - - var clearPanAndZoom = false; - if (NETDATA.globalPanAndZoom.isActive() === false) { - NETDATA.globalPanAndZoom.setMaster(NETDATA.options.targets[0], saveData.after_ms, saveData.before_ms); - clearPanAndZoom = true; - } - - saveData.after_ms = NETDATA.globalPanAndZoom.force_after_ms; - saveData.before_ms = NETDATA.globalPanAndZoom.force_before_ms; - saveData.duration_ms = saveData.before_ms - saveData.after_ms; - saveData.data_points = Math.round((saveData.before_ms - saveData.after_ms) / (saveSnapshotSelectedSecondsPerPoint * 1000)); - saveSnapshotModalLog('info', 'Generating snapshot with ' + saveData.data_points.toString() + ' data points per dimension...'); - - var charts_count = 0; - var charts_ok = 0; - var charts_failed = 0; - - function saveSnapshotRestore() { - $('#saveSnapshotModal').modal('hide'); - - // restore the options - var x; - for (x in backedup_options) { - if (backedup_options.hasOwnProperty(x)) - NETDATA.options.current[x] = backedup_options[x]; - } - - $(el).css('width', '0%').attr('aria-valuenow', 0); - eltxt.innerText = '0%'; - - if (clearPanAndZoom) - NETDATA.globalPanAndZoom.clearMaster(); - - NETDATA.options.force_data_points = 0; - NETDATA.options.fake_chart_rendering = false; - NETDATA.onscroll_updater_enabled = true; - NETDATA.onresize(); - NETDATA.unpause(); - - $('#saveSnapshotExport').removeClass('disabled'); - } - - NETDATA.globalSelectionSync.stop(); - NETDATA.options.force_data_points = saveData.data_points; - NETDATA.options.fake_chart_rendering = true; - NETDATA.onscroll_updater_enabled = false; - NETDATA.abort_all_refreshes(); - - var size = 0; - var info = ' Resolution: <b>' + saveSnapshotSelectedSecondsPerPoint.toString() + ((saveSnapshotSelectedSecondsPerPoint === 1)?' second ':' seconds ').toString() + 'per point</b>.'; - - function update_chart(idx) { - if (saveSnapshotStop === true) { - saveSnapshotModalLog('info', 'Cancelled!'); - saveSnapshotRestore(); - return; - } - - var state = NETDATA.options.targets[--idx]; - - var pcent = (NETDATA.options.targets.length - idx) * 100 / NETDATA.options.targets.length; - $(el).css('width', pcent + '%').attr('aria-valuenow', pcent); - eltxt.innerText = Math.round(pcent).toString() + '%, ' + state.id; - - setTimeout(function () { - charts_count++; - state.isVisible(true); - state.current.force_after_ms = saveData.after_ms; - state.current.force_before_ms = saveData.before_ms; - - state.updateChart(function (status, reason) { - state.current.force_after_ms = null; - state.current.force_before_ms = null; - - if (status === true) { - charts_ok++; - // state.log('ok'); - size += pack_api1_v1_chart_data(state); - } - else { - charts_failed++; - state.log('failed to be updated: ' + reason); - } - - saveSnapshotModalLog((charts_failed) ? 'danger' : 'info', 'Generated snapshot data size <b>' + (Math.round(size * 100 / 1024 / 1024) / 100).toString() + ' MB</b>. ' + ((charts_failed) ? (charts_failed.toString() + ' charts have failed to be downloaded') : '').toString() + info); - - if (idx > 0) { - update_chart(idx); - } - else { - saveData.charts_ok = charts_ok; - saveData.charts_failed = charts_failed; - saveData.data_size = size; - // console.log(saveData.compression + ': ' + (size / (options.data.dimensions_count * Math.round(saveSnapshotViewDuration / saveSnapshotSelectedSecondsPerPoint))).toString()); - - // save it - // console.log(saveData); - saveObjectToClient(saveData, filename); - - if (charts_failed > 0) - alert(charts_failed.toString() + ' failed to be downloaded'); - - saveSnapshotRestore(); - saveData = null; - } - }) - }, 0); - } - - update_chart(NETDATA.options.targets.length); - }); - }); - } - - // -------------------------------------------------------------------- - // activate netdata on the page - - function dashboardSettingsSetup() { - var update_options_modal = function() { - // console.log('update_options_modal'); - - var sync_option = function(option) { - var self = $('#' + option); - - if(self.prop('checked') !== NETDATA.getOption(option)) { - // console.log('switching ' + option.toString()); - self.bootstrapToggle(NETDATA.getOption(option)?'on':'off'); - } - }; - - var theme_sync_option = function(option) { - var self = $('#' + option); - - self.bootstrapToggle(netdataTheme === 'slate'?'on':'off'); - }; - var units_sync_option = function(option) { - var self = $('#' + option); - - if(self.prop('checked') !== (NETDATA.getOption('units') === 'auto')) { - self.bootstrapToggle(NETDATA.getOption('units') === 'auto' ? 'on' : 'off'); - } - - if(self.prop('checked') === true) { - $('#settingsLocaleTempRow').show(); - $('#settingsLocaleTimeRow').show(); - } - else { - $('#settingsLocaleTempRow').hide(); - $('#settingsLocaleTimeRow').hide(); - } - }; - var temp_sync_option = function(option) { - var self = $('#' + option); - - if(self.prop('checked') !== (NETDATA.getOption('temperature') === 'celsius')) { - self.bootstrapToggle(NETDATA.getOption('temperature') === 'celsius' ? 'on' : 'off'); - } - }; - var timezone_sync_option = function(option) { - var self = $('#' + option); - - document.getElementById('browser_timezone').innerText = NETDATA.options.browser_timezone; - document.getElementById('server_timezone').innerText = NETDATA.options.server_timezone; - document.getElementById('current_timezone').innerText = (NETDATA.options.current.timezone === 'default')?'unset, using browser default':NETDATA.options.current.timezone; - - if(self.prop('checked') === NETDATA.dateTime.using_timezone) { - self.bootstrapToggle(NETDATA.dateTime.using_timezone ? 'off' : 'on'); - } - }; - - sync_option('eliminate_zero_dimensions'); - sync_option('destroy_on_hide'); - sync_option('async_on_scroll'); - sync_option('parallel_refresher'); - sync_option('concurrent_refreshes'); - sync_option('sync_selection'); - sync_option('sync_pan_and_zoom'); - sync_option('stop_updates_when_focus_is_lost'); - sync_option('smooth_plot'); - sync_option('pan_and_zoom_data_padding'); - sync_option('show_help'); - sync_option('seconds_as_time'); - theme_sync_option('netdata_theme_control'); - units_sync_option('units_conversion'); - temp_sync_option('units_temp'); - timezone_sync_option('local_timezone'); - - if(NETDATA.getOption('parallel_refresher') === false) { - $('#concurrent_refreshes_row').hide(); - } - else { - $('#concurrent_refreshes_row').show(); - } - }; - NETDATA.setOption('setOptionCallback', update_options_modal); - - // handle options changes - $('#eliminate_zero_dimensions').change(function() { NETDATA.setOption('eliminate_zero_dimensions', $(this).prop('checked')); }); - $('#destroy_on_hide').change(function() { NETDATA.setOption('destroy_on_hide', $(this).prop('checked')); }); - $('#async_on_scroll').change(function() { NETDATA.setOption('async_on_scroll', $(this).prop('checked')); }); - $('#parallel_refresher').change(function() { NETDATA.setOption('parallel_refresher', $(this).prop('checked')); }); - $('#concurrent_refreshes').change(function() { NETDATA.setOption('concurrent_refreshes', $(this).prop('checked')); }); - $('#sync_selection').change(function() { NETDATA.setOption('sync_selection', $(this).prop('checked')); }); - $('#sync_pan_and_zoom').change(function() { NETDATA.setOption('sync_pan_and_zoom', $(this).prop('checked')); }); - $('#stop_updates_when_focus_is_lost').change(function() { - urlOptions.update_always = !$(this).prop('checked'); - urlOptions.hashUpdate(); - - NETDATA.setOption('stop_updates_when_focus_is_lost', !urlOptions.update_always); - }); - $('#smooth_plot').change(function() { NETDATA.setOption('smooth_plot', $(this).prop('checked')); }); - $('#pan_and_zoom_data_padding').change(function() { NETDATA.setOption('pan_and_zoom_data_padding', $(this).prop('checked')); }); - $('#seconds_as_time').change(function() { NETDATA.setOption('seconds_as_time', $(this).prop('checked')); }); - $('#local_timezone').change(function() { - if($(this).prop('checked')) - selected_server_timezone('default', true); - else - selected_server_timezone('default', false); - }); - - - $('#units_conversion').change(function() { - NETDATA.setOption('units', $(this).prop('checked')?'auto':'original'); - }); - $('#units_temp').change(function() { - NETDATA.setOption('temperature', $(this).prop('checked')?'celsius':'fahrenheit'); - }); - - $('#show_help').change(function() { - urlOptions.help = $(this).prop('checked'); - urlOptions.hashUpdate(); - - NETDATA.setOption('show_help', urlOptions.help); - netdataReload(); - }); - - // this has to be the last - // it reloads the page - $('#netdata_theme_control').change(function() { - urlOptions.theme = $(this).prop('checked')?'slate':'white'; - urlOptions.hashUpdate(); - - if(setTheme(urlOptions.theme)) - netdataReload(); - }); - } - - function scrollDashboardTo() { - if(netdataSnapshotData !== null && typeof netdataSnapshotData.hash !== 'undefined') { - //console.log(netdataSnapshotData.hash); - scrollToId(netdataSnapshotData.hash.replace('#','')); - } - else { - // check if we have to jump to a specific section - scrollToId(urlOptions.hash.replace('#', '')); - - if (urlOptions.chart !== null) { - NETDATA.alarms.scrollToChart(urlOptions.chart); - //urlOptions.hash = '#' + NETDATA.name2id('menu_' + charts[c].menu + '_submenu_' + charts[c].submenu); - //urlOptions.hash = '#chart_' + NETDATA.name2id(urlOptions.chart); - //console.log('hash = ' + urlOptions.hash); - } - } - } - - var modalHiddenCallback = null; - function scrollToChartAfterHidingModal(chart) { - modalHiddenCallback = function() { - NETDATA.alarms.scrollToChart(chart); - }; - } - - // ---------------------------------------------------------------------------- - - function enableTooltipsAndPopovers() { - $('[data-toggle="tooltip"]').tooltip({ - animated: 'fade', - trigger: 'hover', - html: true, - delay: {show: 500, hide: 0}, - container: 'body' - }); - $('[data-toggle="popover"]').popover(); - } - - // ---------------------------------------------------------------------------- - - var runOnceOnDashboardLastRun = 0; - function runOnceOnDashboardWithjQuery() { - if(runOnceOnDashboardLastRun !== 0) { - scrollDashboardTo(); - - // restore the scrollspy at the proper position - $(document.body).scrollspy('refresh'); - $(document.body).scrollspy('process'); - - return; - } - - runOnceOnDashboardLastRun = Date.now(); - - // ------------------------------------------------------------------------ - // bootstrap modals - - // prevent bootstrap modals from scrolling the page - // maintains the current scroll position - // https://stackoverflow.com/a/34754029/4525767 - - var scrollPos = 0; - var modal_depth = 0; // how many modals are currently open - var modal_shown = false; // set to true, if a modal is shown - var netdata_paused_on_modal = false; // set to true, if the modal paused netdata - var scrollspyOffset = $(window).height() / 3; // will be updated below - the offset of scrollspy to select an item - - $('.modal') - .on('show.bs.modal', function () { - if(modal_depth === 0) { - scrollPos = window.scrollY; - - $('body').css({ - overflow: 'hidden', - position: 'fixed', - top: -scrollPos - }); - - modal_shown = true; - - if (NETDATA.options.pauseCallback === null) { - NETDATA.pause(function () {}); - netdata_paused_on_modal = true; - } - else - netdata_paused_on_modal = false; - } - - modal_depth++; - //console.log(urlOptions.after); - - }) - .on('hide.bs.modal', function () { - - modal_depth--; - - if(modal_depth <= 0) { - modal_depth = 0; - - $('body') - .css({ - overflow: '', - position: '', - top: '' - }); - - // scroll to the position we had open before the modal - $('html, body') - .animate({scrollTop: scrollPos}, 0); - - // unpause netdata, if we paused it - if (netdata_paused_on_modal === true) { - NETDATA.unpause(); - netdata_paused_on_modal = false; - } - - // restore the scrollspy at the proper position - $(document.body).scrollspy('process'); - } - //console.log(urlOptions.after); - }) - .on('hidden.bs.modal', function () { - if(modal_depth === 0) - modal_shown = false; - - if(typeof modalHiddenCallback === 'function') - modalHiddenCallback(); - - modalHiddenCallback = null; - //console.log(urlOptions.after); - }); - - // ------------------------------------------------------------------------ - // sidebar / affix - - $('#sidebar') - .affix({ - offset: { - top: (isdemo())?150:0, - bottom: 0 - } - }) - .on('affixed.bs.affix', function() { - // fix scrolling of very long affix lists - // http://stackoverflow.com/questions/21691585/bootstrap-3-1-0-affix-too-long - - $(this).removeAttr('style'); - }) - .on( 'affix-top.bs.affix', function() { - // fix bootstrap affix click bug - // https://stackoverflow.com/a/37847981/4525767 - - if(modal_shown) return false; - }) - .on('activate.bs.scrollspy', function (e) { - // change the URL based on the current position of the screen - - if(modal_shown === false) { - var el = $(e.target); - var hash = el.find('a').attr('href'); - if (typeof hash === 'string' && hash.substring(0, 1) === '#' && urlOptions.hash.startsWith(hash + '_submenu_') === false) { - urlOptions.hash = hash; - urlOptions.hashUpdate(); - } - } - }); - - Ps.initialize(document.getElementById('sidebar'), { - wheelSpeed: 0.5, - wheelPropagation: true, - swipePropagation: true, - minScrollbarLength: null, - maxScrollbarLength: null, - useBothWheelAxes: false, - suppressScrollX: true, - suppressScrollY: false, - scrollXMarginOffset: 0, - scrollYMarginOffset: 0, - theme: 'default' - }); - - - // ------------------------------------------------------------------------ - // scrollspy - - if(scrollspyOffset > 250) scrollspyOffset = 250; - if(scrollspyOffset < 75) scrollspyOffset = 75; - document.body.setAttribute('data-offset', scrollspyOffset); - - // scroll the dashboard, before activating the scrollspy, so that our - // hash will not be updated before we got the chance to scroll to it - scrollDashboardTo(); - - $(document.body).scrollspy({ - target: '#sidebar', - offset: scrollspyOffset // controls the diff of the <hX> element to the top, to select it - }); - - - // ------------------------------------------------------------------------ - // my-netdata menu - - Ps.initialize(document.getElementById('myNetdataDropdownUL'), { - wheelSpeed: 1, - wheelPropagation: false, - swipePropagation: false, - minScrollbarLength: null, - maxScrollbarLength: null, - useBothWheelAxes: false, - suppressScrollX: true, - suppressScrollY: false, - scrollXMarginOffset: 0, - scrollYMarginOffset: 0, - theme: 'default' - }); - - $('#myNetdataDropdownParent') - .on('show.bs.dropdown', function () { - var hash = urlOptions.genHash(); - $('.registry_link').each(function(idx) { - this.setAttribute('href', this.getAttribute("href").replace(/#.*$/, hash)); - }); - - NETDATA.pause(function() {}); - }) - .on('shown.bs.dropdown', function () { - Ps.update(document.getElementById('myNetdataDropdownUL')); - }) - .on('hidden.bs.dropdown', function () { - NETDATA.unpause(); - }); - - - $('#deleteRegistryModal') - .on('hidden.bs.modal', function() { - deleteRegistryGuid = null; - }); - - - // ------------------------------------------------------------------------ - // update modal - - $('#updateModal') - .on('show.bs.modal', function() { - versionLog('checking, please wait...'); - }) - .on('shown.bs.modal', function() { - notifyForUpdate(true); - }); - - - // ------------------------------------------------------------------------ - // alarms modal - - $('#alarmsModal') - .on('shown.bs.modal', function() { - alarmsUpdateModal(); - }) - .on('hidden.bs.modal', function() { - document.getElementById('alarms_active').innerHTML = - document.getElementById('alarms_all').innerHTML = - document.getElementById('alarms_log').innerHTML = - 'loading...'; - }); - - - // ------------------------------------------------------------------------ - - dashboardSettingsSetup(); - loadSnapshotDragAndDropSetup(); - saveSnapshotModalSetup(); - showPageFooter(); - - - // ------------------------------------------------------------------------ - // https://github.com/viralpatel/jquery.shorten/blob/master/src/jquery.shorten.js - - $.fn.shorten = function(settings) { - "use strict"; - - var config = { - showChars: 750, - minHideChars: 10, - ellipsesText: "...", - moreText: '<i class="fas fa-expand"></i> show more information', - lessText: '<i class="fas fa-compress"></i> show less information', - onLess: function() { NETDATA.onscroll(); }, - onMore: function() { NETDATA.onscroll(); }, - errMsg: null, - force: false - }; - - if (settings) { - $.extend(config, settings); - } - - if ($(this).data('jquery.shorten') && !config.force) { - return false; - } - $(this).data('jquery.shorten', true); - - $(document).off("click", '.morelink'); - - $(document).on({ - click: function() { - - var $this = $(this); - if ($this.hasClass('less')) { - $this.removeClass('less'); - $this.html(config.moreText); - $this.parent().prev().animate({'height':'0'+'%'}, 0, function () { $this.parent().prev().prev().show(); }).hide(0, function() { - config.onLess(); - }); - - } else { - $this.addClass('less'); - $this.html(config.lessText); - $this.parent().prev().animate({'height':'100'+'%'}, 0, function () { $this.parent().prev().prev().hide(); }).show(0, function() { - config.onMore(); - }); - } - return false; - } - }, '.morelink'); - - return this.each(function() { - var $this = $(this); - - var content = $this.html(); - var contentlen = $this.text().length; - if (contentlen > config.showChars + config.minHideChars) { - var c = content.substr(0, config.showChars); - if (c.indexOf('<') >= 0) // If there's HTML don't want to cut it - { - var inTag = false; // I'm in a tag? - var bag = ''; // Put the characters to be shown here - var countChars = 0; // Current bag size - var openTags = []; // Stack for opened tags, so I can close them later - var tagName = null; - - for (var i = 0, r = 0; r <= config.showChars; i++) { - if (content[i] === '<' && !inTag) { - inTag = true; - - // This could be "tag" or "/tag" - tagName = content.substring(i + 1, content.indexOf('>', i)); - - // If its a closing tag - if (tagName[0] === '/') { - - - if (tagName !== ('/' + openTags[0])) { - config.errMsg = 'ERROR en HTML: the top of the stack should be the tag that closes'; - } else { - openTags.shift(); // Pops the last tag from the open tag stack (the tag is closed in the retult HTML!) - } - - } else { - // There are some nasty tags that don't have a close tag like <br/> - if (tagName.toLowerCase() !== 'br') { - openTags.unshift(tagName); // Add to start the name of the tag that opens - } - } - } - if (inTag && content[i] === '>') { - inTag = false; - } - - if (inTag) { bag += content.charAt(i); } // Add tag name chars to the result - else { - r++; - if (countChars <= config.showChars) { - bag += content.charAt(i); // Fix to ie 7 not allowing you to reference string characters using the [] - countChars++; - } else // Now I have the characters needed - { - if (openTags.length > 0) // I have unclosed tags - { - //console.log('They were open tags'); - //console.log(openTags); - for (var j = 0; j < openTags.length; j++) { - //console.log('Cierro tag ' + openTags[j]); - bag += '</' + openTags[j] + '>'; // Close all tags that were opened - - // You could shift the tag from the stack to check if you end with an empty stack, that means you have closed all open tags - } - break; - } - } - } - } - c = $('<div/>').html(bag + '<span class="ellip">' + config.ellipsesText + '</span>').html(); - }else{ - c+=config.ellipsesText; - } - - var html = '<div class="shortcontent">' + c + - '</div><div class="allcontent">' + content + - '</div><span><a href="javascript://nop/" class="morelink">' + config.moreText + '</a></span>'; - - $this.html(html); - $this.find(".allcontent").hide(); // Hide all text - $('.shortcontent p:last', $this).css('margin-bottom', 0); //Remove bottom margin on last paragraph as it's likely shortened - } - }); - }; - } - - function finalizePage() { - // resize all charts - without starting the background thread - // this has to be done while NETDATA is paused - // if we ommit this, the affix menu will be wrong, since all - // the Dom elements are initially zero-sized - NETDATA.parseDom(); - - // ------------------------------------------------------------------------ - - NETDATA.globalPanAndZoom.callback = null; - NETDATA.globalChartUnderlay.callback = null; - - if(urlOptions.pan_and_zoom === true && NETDATA.options.targets.length > 0) - NETDATA.globalPanAndZoom.setMaster(NETDATA.options.targets[0], urlOptions.after, urlOptions.before); - - // callback for us to track PanAndZoom operations - NETDATA.globalPanAndZoom.callback = urlOptions.netdataPanAndZoomCallback; - NETDATA.globalChartUnderlay.callback = urlOptions.netdataHighlightCallback; - - // ------------------------------------------------------------------------ - - // let it run (update the charts) - NETDATA.unpause(); - - runOnceOnDashboardWithjQuery(); - $(".shorten").shorten(); - enableTooltipsAndPopovers(); - - if(isdemo()) { - // do not to give errors on netdata demo servers for 60 seconds - NETDATA.options.current.retries_on_data_failures = 60; - - if(urlOptions.nowelcome !== true) { - setTimeout(function() { - $('#welcomeModal').modal(); - }, 1000); - } - - // google analytics when this is used for the home page of the demo sites - // this does not run on user's installations - setTimeout(function() { - (function(i,s,o,g,r,a,m){i['GoogleAnalyticsObject']=r;i[r]=i[r]||function(){ - (i[r].q=i[r].q||[]).push(arguments)},i[r].l=1*new Date();a=s.createElement(o), - m=s.getElementsByTagName(o)[0];a.async=1;a.src=g;m.parentNode.insertBefore(a,m) - })(window,document,'script','https://www.google-analytics.com/analytics.js','ga'); - - ga('create', 'UA-64295674-3', 'auto'); - ga('send', 'pageview'); - }, 2000); - } - else notifyForUpdate(); - - if(urlOptions.show_alarms === true) - setTimeout(function() { $('#alarmsModal').modal('show'); }, 1000); - - NETDATA.onresizeCallback = function() { - Ps.update(document.getElementById('sidebar')); - Ps.update(document.getElementById('myNetdataDropdownUL')); - }; - NETDATA.onresizeCallback(); - - if(netdataSnapshotData !== null) { - NETDATA.globalPanAndZoom.setMaster(NETDATA.options.targets[0], netdataSnapshotData.after_ms, netdataSnapshotData.before_ms); - } - - // var netdataEnded = performance.now(); - // console.log('start up time: ' + (netdataEnded - netdataStarted).toString() + ' ms'); - } - - function resetDashboardOptions() { - var help = NETDATA.options.current.show_help; - - NETDATA.resetOptions(); - if(setTheme('slate')) - netdataReload(); - - if(help !== NETDATA.options.current.show_help) - netdataReload(); - } - - // callback to add the dashboard info to the - // parallel javascript downloader in netdata - var netdataPrepCallback = function() { - NETDATA.requiredCSS.push({ - url: NETDATA.serverStatic + 'css/bootstrap-toggle-2.2.2.min.css', - isAlreadyLoaded: function() { return false; } - }); - - NETDATA.requiredJs.push({ - url: NETDATA.serverStatic + 'lib/bootstrap-toggle-2.2.2.min.js', - isAlreadyLoaded: function() { return false; } - }); - - NETDATA.requiredJs.push({ - url: NETDATA.serverStatic + 'dashboard_info.js?v20181019-1', - async: false, - isAlreadyLoaded: function() { return false; } - }); - - if(isdemo()) { - document.getElementById('masthead').style.display = 'block'; - } - else { - if(urlOptions.update_always === true) - NETDATA.setOption('stop_updates_when_focus_is_lost', !urlOptions.update_always); - } - }; - - var selected_server_timezone = function(timezone, status) { - //console.log('called with timezone: ' + timezone + ", status: " + ((typeof status === 'undefined')?'undefined':status).toString()); - - // clear the error - document.getElementById('timezone_error_message').innerHTML = ''; - - if (typeof status === 'undefined') { - // the user selected a timezone from the menu - - NETDATA.setOption('user_set_server_timezone', timezone); - - if (NETDATA.dateTime.init(timezone) === false) { - NETDATA.dateTime.init(); - - if(!$('#local_timezone').prop('checked')) - $('#local_timezone').bootstrapToggle('on'); - - document.getElementById('timezone_error_message').innerHTML = 'Ooops! That timezone was not accepted by your browser. Please open a github issue to help us fix it.'; - NETDATA.setOption('user_set_server_timezone', NETDATA.options.server_timezone); - } - else { - if($('#local_timezone').prop('checked')) - $('#local_timezone').bootstrapToggle('off'); - } - } - else if (status === true) { - // the user wants the browser default timezone to be activated - - NETDATA.dateTime.init(); - } - else { - // the user wants the server default timezone to be activated - //console.log('found ' + NETDATA.options.current.user_set_server_timezone); - - if (NETDATA.options.current.user_set_server_timezone === 'default') - NETDATA.options.current.user_set_server_timezone = NETDATA.options.server_timezone; - - timezone = NETDATA.options.current.user_set_server_timezone; - - if (NETDATA.dateTime.init(timezone) === false) { - NETDATA.dateTime.init(); - - if(!$('#local_timezone').prop('checked')) - $('#local_timezone').bootstrapToggle('on'); - - document.getElementById('timezone_error_message').innerHTML = 'Sorry. The timezone "' + timezone.toString() + '" is not accepted by your browser. Please select one from the list.'; - NETDATA.setOption('user_set_server_timezone', NETDATA.options.server_timezone); - } - } - - document.getElementById('current_timezone').innerText = (NETDATA.options.current.timezone === 'default')?'unset, using browser default':NETDATA.options.current.timezone; - return false; - }; - - // our entry point - // var netdataStarted = performance.now(); - - var netdataCallback = initializeDynamicDashboard; - </script> + <script src="main.js?v=2"></script> </head> <body data-spy="scroll" data-target="#sidebar" data-offset="100"> @@ -4543,8 +59,17 @@ netdata<br/><div style="font-size: 3vh;">Real-time performance monitoring, done right!</div> </div> <script type="text/javascript"> - // change the loadOverlay colors ASAP to match the theme - document.getElementById('loadOverlay').style = (urlOptions.theme === 'slate')?"background-color:#272b30; color: #373b40;":"background-color:#fff; color: #ddd;"; + // Change the loadOverlay colors ASAP to match the theme. + let theme; + const hash = document.location.hash; + if (hash.includes('theme=slate')) { + theme = 'slate'; + } else if (hash.includes('theme=white')) { + theme = 'white'; + } else { + theme = localStorage.getItem('netdataTheme') || 'slate'; + } + document.getElementById('loadOverlay').style = theme == 'slate' ? "background-color: #272b30; color: #373b40;" : "background-color: #fff; color: #ddd;"; </script> <nav class="navbar navbar-default navbar-fixed-top" role="banner"> <div class="container"> @@ -4552,20 +77,8 @@ <ul class="nav navbar-nav"> <li class="dropdown" id="myNetdataDropdownParent" title="your other netdata servers" data-toggle="tooltip" data-placement="right"> <a href="#" class="dropdown-toggle" data-toggle="dropdown">my-netdata <strong class="caret"></strong></a> - <ul class="dropdown-menu scrollable-menu inpagemenu multi-column columns-2" role="menu" id="myNetdataDropdownUL"> - <div class="row"> - <div class="col-sm-6" style="width: 85%; padding-right: 0;"> - <ul id="mynetdata_servers" class="multi-column-dropdown"> - <li><a href="#" onclick="return false;" style="color: #999;">loading...</a></li> - </ul> - </div> - <div class="col-sm-3 hidden-xs" style="width: 15%; padding-left: 0;"> - <ul id="mynetdata_actions1" class="multi-column-dropdown"> - <li style="color: #999;"> </li> - </ul> - </div> - </div> - </ul> + <div id="my-netdata-dropdown-content" class="dropdown-menu scrollable-menu inpagemenu"> + </div> </li> </ul> </nav> @@ -4646,56 +159,15 @@ <div class="row"> <div class="col-md-10" role="main"> <div class="p"> - <big><a href="https://github.com/netdata/netdata/wiki" target="_blank">netdata</a></big><br/> + <big><a href="https://github.com/netdata/netdata/wiki" target="_blank">Netdata</a></big> + <br /><br /> + <i class="fas fa-copyright"></i> Copyright 2018, <a href="mailto:info@netdata.cloud">Netdata, Inc</a>.<br/> <i class="fas fa-copyright"></i> Copyright 2016-2018, <a href="mailto:costa@tsaousis.gr">Costa Tsaousis</a>.<br/> - Released under <a href="http://www.gnu.org/licenses/gpl-3.0.en.html" target="_blank">GPL v3 or later</a>.<br/> </div> <div class="p"> - <small> - <a href="https://github.com/netdata/netdata/wiki" target="_blank">netdata</a> uses the following third party tools on this dashboard: - - <i class="fas fa-circle"></i> The excellent <a href="http://dygraphs.com/" target="_blank">Dygraphs.com</a> web chart library, - <i class="fas fa-copyright"></i> Copyright 2009, Dan Vanderkam, <a href="http://dygraphs.com/legal.html" target="_blank">MIT License</a> - - <i class="fas fa-circle"></i> <a href="https://rendro.github.io/easy-pie-chart/" target="_blank">Easy Pie Chart</a> web chart library, - <i class="fas fa-copyright"></i> Copyright 2013, Robert Fleischmann, <a href="https://github.com/rendro/easy-pie-chart/blob/master/LICENSE" target="_blank">MIT License</a> - - <i class="fas fa-circle"></i> <a href="http://bernii.github.io/gauge.js/" target="_blank">Gauge.js</a> web chart library, - <i class="fas fa-copyright"></i> Copyright, Bernard Kobos, <a href="http://bernii.github.io/gauge.js/" target="_blank">MIT License</a> - - <i class="fas fa-circle"></i> <a href="https://github.com/benkeen/d3pie" target="_blank">d3pie</a> web chart library, - <i class="fas fa-copyright"></i> Copyright 2014-2015 Benjamin Keen, <a href="https://github.com/benkeen/d3pie/blob/master/LICENSE" target="_blank">MIT License</a> - - <i class="fas fa-circle"></i> <a href="http://d3js.org/" target="_blank">D3</a> web graphics library, - <i class="fas fa-copyright"></i> Copyright 2015 Mike Bostock, <a href="http://opensource.org/licenses/BSD-3-Clause" target="_blank">BSD License</a> - - <i class="fas fa-circle"></i> <a href="https://jquery.org/" target="_blank">jQuery</a>, - <i class="fas fa-copyright"></i> Copyright 2015, jQuery Foundation, <a href="https://jquery.org/license/" target="_blank">MIT License</a> - - <i class="fas fa-circle"></i> <a href="http://getbootstrap.com/getting-started/" target="_blank">Bootstrap</a>, - <i class="fas fa-copyright"></i> Copyright 2015, Twitter, <a href="http://getbootstrap.com/getting-started/#license-faqs" target="_blank">MIT License</a> - - <i class="fas fa-circle"></i> <a href="http://www.bootstraptoggle.com/" target="_blank">Bootstrap Toggle</a>, - <i class="fas fa-copyright"></i> Copyright 2011-2014 Min Hur, The New York Times Company, <a href="https://github.com/minhur/bootstrap-toggle/blob/master/LICENSE" target="_blank">MIT License</a> - - <i class="fas fa-circle"></i> <a href="http://seiyria.com/bootstrap-slider/" target="_blank">Bootstrap-slider</a>, - <i class="fas fa-copyright"></i> Copyright 2017 Kyle Kemp, Rohit Kalkur, and contributors, <a href="https://github.com/seiyria/bootstrap-slider/blob/master/LICENSE.md" target="_blank">MIT License</a> - - <i class="fas fa-circle"></i> <a href="https://github.com/noraesae/perfect-scrollbar" target="_blank">perfect-scrollbar</a>, - <i class="fas fa-copyright"></i> Copyright 2016, Hyunje Alex Jun and other contributors, <a href="https://github.com/noraesae/perfect-scrollbar/blob/master/LICENSE" target="_blank">MIT License</a> - - <i class="fas fa-circle"></i> <a href="https://fortawesome.github.io/Font-Awesome/" target="_blank">FontAwesome</a>, - <i class="fas fa-copyright"></i> Created by Dave Gandy, Font: <a href="http://scripts.sil.org/OFL" target="_blank">SIL OFL 1.1 License</a>, CSS: <a href="http://opensource.org/licenses/mit-license.html" target="_blank">MIT License</a> - - <i class="fas fa-circle"></i> <a href="http://www.iconsdb.com/soylent-red-icons/seo-performance-icon.html" target="_blank">IconsDB.com Icons</a>, Icons provided as CC0 1.0 Universal (CC0 1.0) Public Domain Dedication. - - <i class="fas fa-circle"></i> <a href="http://bootstrap-table.wenzhixin.net.cn/" target="_blank">bootstrap-table</a>, - <i class="fas fa-copyright"></i> Copyright 2012-2016 Zhixin Wen, <a href="https://github.com/wenzhixin/bootstrap-table/blob/master/LICENSE" target="_blank">MIT License</a> - - <i class="fas fa-circle"></i> <a href="https://github.com/hhurz/tableExport.jquery.plugin" target="_blank">tableExport.jquery.plugin</a>, - <i class="fas fa-copyright"></i> Copyright 2015,2016 hhurz, <a href="http://rawgit.com/hhurz/tableExport.jquery.plugin/master/tableExport.js" target="_blank">MIT License</a> - - </small> + Released under <a href="http://www.gnu.org/licenses/gpl-3.0.en.html" target="_blank">GPL v3 or later</a>. + Netdata uses <a href="https://github.com/netdata/netdata/blob/master/REDISTRIBUTED.md" target="_blank">third party tools</a>. + <br /><br /> </div> </div> </div> @@ -4946,7 +418,7 @@ <div class="p"> <b><a href="https://github.com/netdata/netdata/wiki" target="_blank">netdata</a></b> is free, open-source software. If you decide to use it, - <strong><a href="https://github.com/netdata/netdata/wiki/a-github-star-is-important" target="_blank">it is important to give netdata a star at GitHub</a></strong>. + <strong><a href="https://github.com/netdata/netdata/tree/master/doc/a-github-star-is-important.md" target="_blank">it is important to give netdata a star at GitHub</a></strong>. </div> <div class="p"> Enjoy real-time performance monitoring! @@ -5786,6 +1258,6 @@ </div> </div> <div id="hiddenDownloadLinks" style="display: none;" hidden></div> - <script type="text/javascript" src="dashboard.js?v20181013-2"></script> + <script type="text/javascript" src="dashboard.js?v20181114-1"></script> </body> </html> diff --git a/web/gui/main.css b/web/gui/main.css new file mode 100644 index 000000000..3e2c4bfc3 --- /dev/null +++ b/web/gui/main.css @@ -0,0 +1,613 @@ +/* force the vertical window scrollbar */ +html { + overflow-y: scroll; +} + +/* prevent body from hiding under the navbar */ +body { + padding-top: 50px; +} + +.loadOverlay { + position: absolute; + top: 0px; + left: 0px; + width: 100%; + height: 100%; + z-index: 2000; + font-size: 10vh; + font-family: sans-serif; + padding: 40vh 0 40vh 0; + font-weight: bold; + text-align: center; +} + +.navbar-highlight { + display: none; + position: fixed; + margin-top: 5px; + height: 26px; + width: 100%; + text-align: center; + overflow: hidden; + z-index: 30; + pointer-events: none !important; +} + +.navbar-highlight-content { + position: relative; + display: inline-block; + margin: 0 auto; + height: 26px; + min-width: 500px; + background-color: rgba(0, 0, 0, 0.7); + padding-top: 2px; + padding-bottom: 2px; + padding-left: 15px; + padding-right: 15px; + border-radius: 10px; + color: lightgrey; + pointer-events: auto !important; +} + +.navbar-highlight-bar { + cursor: pointer; +} + +.navbar-highlight-button-right { + cursor: pointer; + padding-left: 10px; +} + +.modal-wide .modal-dialog { + width: 80%; +} + +/* fix # anchors scrolling under the navbar + https://github.com/twbs/bootstrap/issues/1768#issuecomment-46519033 + */ +h1 { + position: relative; + z-index: -1; +} + +h2 { + position: relative; + z-index: -2; +} + +h1:before, h2:before { + display: block; + content: " "; + margin-top: -70px; + height: 70px; + visibility: hidden; +} + +.p { + display: block; + margin-top: 15px; +} + +.option-row, +.option-control { + vertical-align: top; + padding: 10px; + padding-top: 30px; + padding-left: 30px; +} + +.option-info { + padding: 10px; +} + +.dashboard-submenu-info { + display: block; + margin-top: 10px; +} + +.dashboard-context-info { + display: block; + margin-top: 10px; +} + +#masthead h1 { + /*font-size: 30px;*/ + line-height: 1; + padding-top: 30px; +} + +#masthead .well { + margin-top: 4%; +} + +/* fix the navbar shifting when a modal is open */ +/* https://github.com/twbs/bootstrap/issues/14040#issuecomment-159891033 */ +body.modal-open { + width: 100% !important; + padding-right: 0 !important; + /* overflow-y: scroll !important; */ + /* position: fixed !important;*/ + overflow: visible; +} + +/* make accordion use the whole header bar for expand/collapse */ +.panel-title a { + display: block; + padding: 10px 15px; + margin: -10px -15px; +} + +/* + * Side navigation + * + * Scrollspy and affixed enhanced navigation to highlight sections and secondary + * sections of docs content. + */ + +.affix { + position: static; + top: 70px !important; + /*width: 220px;*/ +} + +/* +.affix-top { + width: 220px; +} +*/ + +.dashboard-sidebar { + max-height: calc(100% - 70px) !important; + overflow-y: auto; + /*width: 220px !important;*/ +} + +/* By default it's not affixed in mobile views, so undo that */ +.dashboard-sidebar.affix { + position: static; +} + +@media (min-width: 768px) { + .dashboard-sidebar { + padding-left: 20px; + } +} + +/* First level of nav */ +.dashboard-sidenav { + margin-top: 20px; + margin-bottom: 20px; +} + +/* All levels of nav */ +.dashboard-sidebar .nav > li > a { + display: block; + padding: 4px 20px; + font-size: 13px; + font-weight: 500; + color: #767676; +} + +.dashboard-sidebar .nav > li > a > .svg-inline--fa { + width: 20px; + text-align: center; +} + +.dashboard-sidebar .nav > li > a:hover, +.dashboard-sidebar .nav > li > a:focus { + padding-left: 19px; + color: #563d7c; + text-decoration: none; + background-color: transparent; + border-left: 1px solid #563d7c; +} + +.dashboard-sidebar .nav > .active > a, +.dashboard-sidebar .nav > .active:hover > a, +.dashboard-sidebar .nav > .active:focus > a { + padding-left: 18px; + font-weight: bold; + color: #563d7c; + background-color: transparent; + border-left: 2px solid #563d7c; +} + +/* Nav: second level (shown on .active) */ +.dashboard-sidebar .nav .nav { + display: none; /* Hide by default, but at >768px, show it */ + padding-bottom: 10px; +} + +.dashboard-sidebar .nav .nav > li > a { + padding-top: 1px; + padding-bottom: 1px; + padding-left: 30px; + font-size: 12px; + font-weight: normal; +} + +.dashboard-sidebar .nav .nav > li > a:hover, +.dashboard-sidebar .nav .nav > li > a:focus { + padding-left: 29px; +} + +.dashboard-sidebar .nav .nav > .active > a, +.dashboard-sidebar .nav .nav > .active:hover > a, +.dashboard-sidebar .nav .nav > .active:focus > a { + padding-left: 28px; + font-weight: 500; +} + +.dropdown-menu { + min-width: 200px; +} + +.dropdown-menu.columns-2 { + margin: 0; + padding: 0; + width: 400px; +} + +.dropdown-menu li a { + padding: 5px 15px; + font-weight: 300; +} + +.dropdown-menu.multi-column { + overflow-x: hidden; +} + +.multi-column-dropdown { + list-style: none; + padding: 0; +} + +.multi-column-dropdown li a { + display: inline-block; + clear: both; + line-height: 1.428571429; + white-space: normal; +} + +.multi-column-dropdown li a:hover { + text-decoration: none; + color: #f5f5f5; + background-color: #262626; +} + +.scrollable-menu { + height: auto; + max-height: 80vh; + overflow-x: hidden; +} + +.scrollable-menu-50 { + height: auto; + max-height: 50vh; + overflow-x: hidden; +} + +/* Back to top (hidden on mobile) */ +.back-to-top, +.dashboard-theme-toggle { + display: none; + padding: 4px 10px; + margin-top: 10px; + margin-left: 10px; + font-size: 12px; + font-weight: 500; + color: #999; +} + +.back-to-top:hover, +.dashboard-theme-toggle:hover { + color: #563d7c; + text-decoration: none; +} + +.dashboard-theme-toggle { + margin-top: 0; +} + +.container { + width: calc(100% - 20px) !important; +} + +.charts-body { + display: inline-block; + width: 100%; +} + +.sidebar-body { + position: absolute; + display: none; +} + +.dashboard-section-container { + display: block; + width: 100%; + page-break-before: auto; + page-break-after: auto; + page-break-inside: auto; +} + +.dashboard-print-row { + display: block; + width: 100%; + page-break-before: auto; + page-break-after: auto; + page-break-inside: avoid; +} + +.netdata-chartblock-container { + display: inline-block; +} + +/* https://github.com/seiyria/bootstrap-slider/issues/746 */ +.tooltip { + -webkit-user-select: none; + -moz-user-select: none; + -ms-user-select: none; + user-select: none; +} + +@media print { + body { + overflow: visible !important; + -webkit-print-color-adjust: exact; + page-break-inside: auto; + page-break-before: auto; + page-break-after: auto; + } + + .dashboard-section { + page-break-inside: auto; + page-break-before: auto; + page-break-after: auto; + } + + .dashboard-subsection { + page-break-before: avoid; + page-break-after: auto; + page-break-inside: auto; + } + + .charts-body { + padding-left: 0%; + padding-right: 0%; + display: block; + page-break-inside: auto; + page-break-before: auto; + page-break-after: auto; + } + + .back-to-top, + .dashboard-theme-toggle { + display: block; + } +} + +@media (min-width: 768px) { + .charts-body { + padding-left: 0%; + padding-right: 0%; + } + + .back-to-top, + .dashboard-theme-toggle { + display: block; + } +} + +/* Show and affix the side nav when space allows it */ +@media (min-width: 992px) { + .container { + padding-left: 0% !important; + } + + .charts-body { + width: calc(100% - 213px) !important; + padding-left: 1% !important; + padding-right: 0% !important; + } + + .sidebar-body { + display: inline-block !important; + width: 213px !important; + } + + .dashboard-sidebar .nav > .active > ul { + display: block; + } + + /* Widen the fixed sidebar */ + .dashboard-sidebar.affix, + .dashboard-sidebar.affix-top, + .dashboard-sidebar.affix-bottom { + width: 213px !important; + } + + .dashboard-sidebar.affix { + position: fixed; /* Undo the static from mobile first approach */ + top: 20px; + } + + .dashboard-sidebar.affix-bottom { + position: absolute; /* Undo the static from mobile first approach */ + } + + .dashboard-sidebar.affix-bottom .dashboard-sidenav, + .dashboard-sidebar.affix .dashboard-sidenav { + margin-top: 0; + margin-bottom: 0; + } +} + +@media (min-width: 1200px) { + .container { + padding-left: 2% !important; + } + + .charts-body { + width: calc(100% - 233px) !important; + padding-left: 1% !important; + padding-right: 1% !important; + } + + .sidebar-body { + display: inline-block !important; + width: 233px !important; + } + + /* Widen the fixed sidebar again */ + .dashboard-sidebar.affix, + .dashboard-sidebar.affix-top, + .dashboard-sidebar.affix-bottom { + width: 233px !important; + } +} + +@media (min-width: 1360px) { + .container { + padding-left: 3% !important; + } + + .charts-body { + width: calc(100% - 263px) !important; + padding-left: 1% !important; + padding-right: 2% !important; + } + + .sidebar-body { + display: inline-block !important; + width: 263px !important; + } + + /* Widen the fixed sidebar again */ + .dashboard-sidebar.affix, + .dashboard-sidebar.affix-top, + .dashboard-sidebar.affix-bottom { + width: 263px !important; + } +} + +.action-button { + position: relative; + display: inline-block; + color: gray; + cursor: pointer; + margin: 0 auto; + width: 30px; + height: 30px; + font-size: 25px; +} + +.ripple { + position: relative; + /*overflow: hidden;*/ + transform: translate3d(0, 0, 0) +} + +.ripple:after { + content: ""; + display: block; + position: absolute; + width: 100%; + height: 100%; + top: 0; + left: 0; + pointer-events: none; + background-image: radial-gradient(circle, #000 10%, transparent 10.01%); + background-repeat: no-repeat; + background-position: 50%; + transform: scale(18, 18); /* the size of the ripple */ + opacity: 0; + transition: transform .5s, opacity 1s +} + +.ripple:active:after { + transform: scale(0, 0); + opacity: .2; + transition: 0s +} + +/* --- */ + +#my-netdata-dropdown-content a:hover { + color: #fff; +} + +#my-netdata-dropdown-content .info-item { + height: 32px; + line-height: 32px; + padding-left: 14px; +} + +#my-netdata-dropdown-content .agent-item { + display: flex; + align-items: center; + min-height: 32px; + font-weight: 300; +} + +#my-netdata-dropdown-content .agent-item:hover { + background-color: #262626; +} + +#my-netdata-dropdown-content .agent-item a:hover { + text-decoration: none; +} + +#my-netdata-dropdown-content .agent-item > :first-child { + width: 40px; + text-align: center; +} + +#my-netdata-dropdown-content .agent-item > :last-child { + width: 40px; + text-align: center; +} + +#my-netdata-dropdown-content .agent-item :nth-child(2) { + min-width: 420px; + line-height: 14px; +} + +.agent-item--separated { + border-top: 1px solid #333; +} + +.agent-item--alternate a { + color: #999; +} + +#my-netdata-dropdown-content .agent-alternate-urls.collapsed { + display: none; +} + +#my-netdata-dropdown-content hr { + display: block; + margin-top: 5px; + margin-bottom: 0; + border-top: 1px solid #333; + height: 4px; +} + +/* white theme overrides */ + +#my-netdata-dropdown-content.theme-white hr { + border-top: 1px solid #ddd; +} + +#my-netdata-dropdown-content.theme-white .agent-item:hover { + background-color: #e6e6e6; +} + +#my-netdata-dropdown-content.theme-white a { + color: #555; +} + +#my-netdata-dropdown-content.theme-white a:hover { + color: #000; +} diff --git a/web/gui/main.js b/web/gui/main.js new file mode 100644 index 000000000..a04f406bd --- /dev/null +++ b/web/gui/main.js @@ -0,0 +1,4343 @@ +// Main JavaScript file for the Netdata GUI. + +// netdata snapshot data +var netdataSnapshotData = null; + +// enable alarms checking and notifications +var netdataShowAlarms = true; + +// enable registry updates +var netdataRegistry = true; + +// forward definition only - not used here +var netdataServer = undefined; +var netdataServerStatic = undefined; +var netdataCheckXSS = undefined; + +// control the welcome modal and analytics +var this_is_demo = null; + +function escapeUserInputHTML(s) { + return s.toString() + .replace(/&/g, '&') + .replace(/</g, '<') + .replace(/>/g, '>') + .replace(/"/g, '"') + .replace(/#/g, '#') + .replace(/'/g, ''') + .replace(/\(/g, '(') + .replace(/\)/g, ')') + .replace(/\//g, '/'); +} + +function verifyURL(s) { + if (typeof (s) === 'string' && (s.startsWith('http://') || s.startsWith('https://'))) { + return s + .replace(/'/g, '%22') + .replace(/"/g, '%27') + .replace(/\)/g, '%28') + .replace(/\(/g, '%29'); + } + + console.log('invalid URL detected:'); + console.log(s); + return 'javascript:alert("invalid url");'; +} + +// -------------------------------------------------------------------- +// urlOptions + +var urlOptions = { + hash: '#', + theme: null, + help: null, + mode: 'live', // 'live', 'print' + update_always: false, + pan_and_zoom: false, + server: null, + after: 0, + before: 0, + highlight: false, + highlight_after: 0, + highlight_before: 0, + nowelcome: false, + show_alarms: false, + chart: null, + family: null, + alarm: null, + alarm_unique_id: 0, + alarm_id: 0, + alarm_event_id: 0, + + hasProperty: function (property) { + // console.log('checking property ' + property + ' of type ' + typeof(this[property])); + return typeof this[property] !== 'undefined'; + }, + + genHash: function (forReload) { + var hash = urlOptions.hash; + + if (urlOptions.pan_and_zoom === true) { + hash += ';after=' + urlOptions.after.toString() + + ';before=' + urlOptions.before.toString(); + } + + if (urlOptions.highlight === true) { + hash += ';highlight_after=' + urlOptions.highlight_after.toString() + + ';highlight_before=' + urlOptions.highlight_before.toString(); + } + + if (urlOptions.theme !== null) { + hash += ';theme=' + urlOptions.theme.toString(); + } + + if (urlOptions.help !== null) { + hash += ';help=' + urlOptions.help.toString(); + } + + if (urlOptions.update_always === true) { + hash += ';update_always=true'; + } + + if (forReload === true && urlOptions.server !== null) { + hash += ';server=' + urlOptions.server.toString(); + } + + if (urlOptions.mode !== 'live') { + hash += ';mode=' + urlOptions.mode; + } + + return hash; + }, + + parseHash: function () { + var variables = document.location.hash.split(';'); + var len = variables.length; + while (len--) { + if (len !== 0) { + var p = variables[len].split('='); + if (urlOptions.hasProperty(p[0]) && typeof p[1] !== 'undefined') { + urlOptions[p[0]] = decodeURIComponent(p[1]); + } + } else { + if (variables[len].length > 0) { + urlOptions.hash = variables[len]; + } + } + } + + var booleans = ['nowelcome', 'show_alarms', 'update_always']; + len = booleans.length; + while (len--) { + if (urlOptions[booleans[len]] === 'true' || urlOptions[booleans[len]] === true || urlOptions[booleans[len]] === '1' || urlOptions[booleans[len]] === 1) { + urlOptions[booleans[len]] = true; + } else { + urlOptions[booleans[len]] = false; + } + } + + var numeric = ['after', 'before', 'highlight_after', 'highlight_before']; + len = numeric.length; + while (len--) { + if (typeof urlOptions[numeric[len]] === 'string') { + try { + urlOptions[numeric[len]] = parseInt(urlOptions[numeric[len]]); + } + catch (e) { + console.log('failed to parse URL hash parameter ' + numeric[len]); + urlOptions[numeric[len]] = 0; + } + } + } + + if (urlOptions.server !== null && urlOptions.server !== '') { + netdataServerStatic = document.location.origin.toString() + document.location.pathname.toString(); + netdataServer = urlOptions.server; + netdataCheckXSS = true; + } else { + urlOptions.server = null; + } + + if (urlOptions.before > 0 && urlOptions.after > 0) { + urlOptions.pan_and_zoom = true; + urlOptions.nowelcome = true; + } else { + urlOptions.pan_and_zoom = false; + } + + if (urlOptions.highlight_before > 0 && urlOptions.highlight_after > 0) { + urlOptions.highlight = true; + } else { + urlOptions.highlight = false; + } + + switch (urlOptions.mode) { + case 'print': + urlOptions.theme = 'white'; + urlOptions.welcome = false; + urlOptions.help = false; + urlOptions.show_alarms = false; + + if (urlOptions.pan_and_zoom === false) { + urlOptions.pan_and_zoom = true; + urlOptions.before = Date.now(); + urlOptions.after = urlOptions.before - 600000; + } + + netdataShowAlarms = false; + netdataRegistry = false; + this_is_demo = false; + break; + + case 'live': + default: + urlOptions.mode = 'live'; + break; + } + + // console.log(urlOptions); + }, + + hashUpdate: function () { + history.replaceState(null, '', urlOptions.genHash(true)); + }, + + netdataPanAndZoomCallback: function (status, after, before) { + //console.log(1); + //console.log(new Error().stack); + + if (netdataSnapshotData === null) { + urlOptions.pan_and_zoom = status; + urlOptions.after = after; + urlOptions.before = before; + urlOptions.hashUpdate(); + } + }, + + netdataHighlightCallback: function (status, after, before) { + //console.log(2); + //console.log(new Error().stack); + + if (status === true && (after === null || before === null || after <= 0 || before <= 0 || after >= before)) { + status = false; + after = 0; + before = 0; + } + + if (netdataSnapshotData === null) { + urlOptions.highlight = status; + } else { + urlOptions.highlight = false; + } + + urlOptions.highlight_after = Math.round(after); + urlOptions.highlight_before = Math.round(before); + urlOptions.hashUpdate(); + + var show_eye = NETDATA.globalChartUnderlay.hasViewport(); + + if (status === true && after > 0 && before > 0 && after < before) { + var d1 = NETDATA.dateTime.localeDateString(after); + var d2 = NETDATA.dateTime.localeDateString(before); + if (d1 === d2) { + d2 = ''; + } + document.getElementById('navbar-highlight-content').innerHTML = + ((show_eye === true) ? '<span class="navbar-highlight-bar highlight-tooltip" onclick="urlOptions.showHighlight();" title="restore the highlighted view" data-toggle="tooltip" data-placement="bottom">' : '<span>').toString() + + 'highlighted time-frame' + + ' <b>' + d1 + ' <code>' + NETDATA.dateTime.localeTimeString(after) + '</code></b> to ' + + ' <b>' + d2 + ' <code>' + NETDATA.dateTime.localeTimeString(before) + '</code></b>, ' + + 'duration <b>' + NETDATA.seconds4human(Math.round((before - after) / 1000)) + '</b>' + + '</span>' + + '<span class="navbar-highlight-button-right highlight-tooltip" onclick="urlOptions.clearHighlight();" title="clear the highlighted time-frame" data-toggle="tooltip" data-placement="bottom"><i class="fas fa-times"></i></span>'; + + $('.navbar-highlight').show(); + + $('.highlight-tooltip').tooltip({ + html: true, + delay: {show: 500, hide: 0}, + container: 'body' + }); + } else { + $('.navbar-highlight').hide(); + } + }, + + clearHighlight: function () { + NETDATA.globalChartUnderlay.clear(); + + if (NETDATA.globalPanAndZoom.isActive() === true) { + NETDATA.globalPanAndZoom.clearMaster(); + } + }, + + showHighlight: function () { + NETDATA.globalChartUnderlay.focus(); + } +}; + +urlOptions.parseHash(); + +// -------------------------------------------------------------------- +// check options that should be processed before loading netdata.js + +var localStorageTested = -1; + +function localStorageTest() { + if (localStorageTested !== -1) { + return localStorageTested; + } + + if (typeof Storage !== "undefined" && typeof localStorage === 'object') { + var test = 'test'; + try { + localStorage.setItem(test, test); + localStorage.removeItem(test); + localStorageTested = true; + } + catch (e) { + console.log(e); + localStorageTested = false; + } + } else { + localStorageTested = false; + } + + return localStorageTested; +} + +function loadLocalStorage(name) { + var ret = null; + + try { + if (localStorageTest() === true) { + ret = localStorage.getItem(name); + } else { + console.log('localStorage is not available'); + } + } + catch (error) { + console.log(error); + return null; + } + + if (typeof ret === 'undefined' || ret === null) { + return null; + } + + // console.log('loaded: ' + name.toString() + ' = ' + ret.toString()); + + return ret; +} + +function saveLocalStorage(name, value) { + // console.log('saving: ' + name.toString() + ' = ' + value.toString()); + try { + if (localStorageTest() === true) { + localStorage.setItem(name, value.toString()); + return true; + } + } + catch (error) { + console.log(error); + } + + return false; +} + +function getTheme(def) { + if (urlOptions.mode === 'print') { + return 'white'; + } + + var ret = loadLocalStorage('netdataTheme'); + if (typeof ret === 'undefined' || ret === null || ret === 'undefined') { + return def; + } else { + return ret; + } +} + +function setTheme(theme) { + if (urlOptions.mode === 'print') { + return false; + } + + if (theme === netdataTheme) { + return false; + } + return saveLocalStorage('netdataTheme', theme); +} + +var netdataTheme = getTheme('slate'); +var netdataShowHelp = true; + +if (urlOptions.theme !== null) { + setTheme(urlOptions.theme); + netdataTheme = urlOptions.theme; +} else { + urlOptions.theme = netdataTheme; +} + +if (urlOptions.help !== null) { + saveLocalStorage('options.show_help', urlOptions.help); + netdataShowHelp = urlOptions.help; +} else { + urlOptions.help = loadLocalStorage('options.show_help'); +} + +// -------------------------------------------------------------------- +// natural sorting +// http://www.davekoelle.com/files/alphanum.js - LGPL + +function naturalSortChunkify(t) { + var tz = []; + var x = 0, y = -1, n = 0, i, j; + + while (i = (j = t.charAt(x++)).charCodeAt(0)) { + var m = (i >= 48 && i <= 57); + if (m !== n) { + tz[++y] = ""; + n = m; + } + tz[y] += j; + } + + return tz; +} + +function naturalSortCompare(a, b) { + var aa = naturalSortChunkify(a.toLowerCase()); + var bb = naturalSortChunkify(b.toLowerCase()); + + for (var x = 0; aa[x] && bb[x]; x++) { + if (aa[x] !== bb[x]) { + var c = Number(aa[x]), d = Number(bb[x]); + if (c.toString() === aa[x] && d.toString() === bb[x]) { + return c - d; + } else { + return (aa[x] > bb[x]) ? 1 : -1; + } + } + } + + return aa.length - bb.length; +} + +// -------------------------------------------------------------------- +// saving files to client + +function saveTextToClient(data, filename) { + var blob = new Blob([data], { + type: 'application/octet-stream' + }); + + var url = URL.createObjectURL(blob); + var link = document.createElement('a'); + link.setAttribute('href', url); + link.setAttribute('download', filename); + + var el = document.getElementById('hiddenDownloadLinks'); + el.innerHTML = ''; + el.appendChild(link); + + setTimeout(function () { + el.removeChild(link); + URL.revokeObjectURL(url); + }, 60); + + link.click(); +} + +function saveObjectToClient(data, filename) { + saveTextToClient(JSON.stringify(data), filename); +} + +// -------------------------------------------------------------------- +// registry call back to render my-netdata menu + +function toggleExpandIcon(svgEl) { + if (svgEl.getAttribute('data-icon') === 'caret-down') { + svgEl.setAttribute('data-icon', 'caret-up'); + } else { + svgEl.setAttribute('data-icon', 'caret-down'); + } +} + +function toggleAgentItem(e, guid) { + e.stopPropagation(); + e.preventDefault(); + + toggleExpandIcon(e.currentTarget.children[0]); + + const el = document.querySelector(`.agent-alternate-urls.agent-${guid}`); + if (el) { + el.classList.toggle('collapsed'); + } +} + +// TODO: consider renaming to `truncateString` + +/// Enforces a maximum string length while retaining the prefix and the postfix of +/// the string. +function clipString(str, maxLength) { + if (str.length <= maxLength) { + return str; + } + + const spanLength = Math.floor((maxLength - 3) / 2); + return `${str.substring(0, spanLength)}...${str.substring(str.length - spanLength)}`; +} + +// When you stream metrics from netdata to netdata, the recieving netdata now +// has multiple host databases. It's own, and multiple mirrored. Mirrored databases +// can be accessed with <http://localhost:19999/host/NAME/> +function renderStreamedHosts(options) { + let html = `<div class="info-item">Databases streamed to this agent</div>`; + + var base = document.location.origin.toString() + document.location.pathname.toString(); + if (base.endsWith("/host/" + options.hostname + "/")) { + base = base.substring(0, base.length - ("/host/" + options.hostname + "/").toString().length); + } + + if (base.endsWith("/")) { + base = base.substring(0, base.length - 1); + } + + var master = options.hosts[0].hostname; + var sorted = options.hosts.sort(function (a, b) { + if (a.hostname === master) { + return -1; + } + return naturalSortCompare(a.hostname, b.hostname); + }); + + for (const s of sorted) { + let url, icon; + const hostname = s.hostname; + + if (hostname === master) { + url = `base${'/'}`; + icon = 'home'; + } else { + url = `${base}/host/${hostname}/`; + icon = 'window-restore'; + } + + html += ( + `<div class="agent-item"> + <a class="registry_link" href="${url}#" onClick="return gotoHostedModalHandler('${url}');"> + <i class="fas fa-${icon}" style="color: #999;"></i> + </a> + <a class="registry_link" href="${url}#" onClick="return gotoHostedModalHandler('${url}');">${hostname}</a> + <div></div> + </div>` + ) + } + + return html; +} + +function renderMachines(machinesArray) { + let html = `<div class="info-item">My netdata agents</div>`; + + if (machinesArray === null) { + let ret = loadLocalStorage("registryCallback"); + if (ret) { + machinesArray = JSON.parse(ret); + console.log("failed to contact the registry - loaded registry data from browser local storage"); + } + } + + let found = false; + + if (machinesArray) { + saveLocalStorage("registryCallback", JSON.stringify(machinesArray)); + + var machines = machinesArray.sort(function (a, b) { + return naturalSortCompare(a.name, b.name); + }); + + for (const machine of machines) { + found = true; + + const alternateUrlItems = ( + `<div class="agent-alternate-urls agent-${machine.guid} collapsed"> + ${machine.alternate_urls.reduce( + (str, url) => str + ( + `<div class="agent-item agent-item--alternate"> + <div></div> + <a href="${url}" title="${url}">${clipString(url, 64)}</a> + <a href="#" onclick="deleteRegistryModalHandler('${machine.guid}', '${machine.name}', '${url}'); return false;"> + <i class="fas fa-trash" style="color: #777;"></i> + </a> + </div>` + ), + '' + )} + </div>` + ) + + html += ( + `<div class="agent-item agent-${machine.guid}"> + <i class="fas fa-chart-bar" color: #fff"></i> + <span> + <a class="registry_link" href="${machine.url}#" onClick="return gotoServerModalHandler('${machine.guid}');">${machine.name}</a> + </span> + <a href="#" onClick="toggleAgentItem(event, '${machine.guid}');"> + <i class="fas fa-caret-down" style="color: #999"></i> + </a> + </div> + ${alternateUrlItems}` + ) + } + } + + if (!found) { + if (machines) { + html += ( + `<div class="info-item"> + <a href="https://github.com/netdata/netdata/tree/master/registry#netdata-registry" target="_blank">Your netdata server list is empty</a> + </div>` + ) + } else { + html += ( + `<div class="info-item"> + <a href="https://github.com/netdata/netdata/tree/master/registry#netdata-registry" target="_blank">Failed to contact the registry</a> + </div>` + ) + } + + html += `<hr />`; + html += `<div class="info-item">Demo netdata agents</div>`; + + const demoServers = [ + {url: "//london.netdata.rocks/default.html", title: "UK - London (DigitalOcean.com)"}, + {url: "//newyork.netdata.rocks/default.html", title: "US - New York (DigitalOcean.com)"}, + {url: "//sanfrancisco.netdata.rocks/default.html", title: "US - San Francisco (DigitalOcean.com)"}, + {url: "//atlanta.netdata.rocks/default.html", title: "US - Atlanta (CDN77.com)"}, + {url: "//frankfurt.netdata.rocks/default.html", title: "Germany - Frankfurt (DigitalOcean.com)"}, + {url: "//toronto.netdata.rocks/default.html", title: "Canada - Toronto (DigitalOcean.com)"}, + {url: "//singapore.netdata.rocks/default.html", title: "Japan - Singapore (DigitalOcean.com)"}, + {url: "//bangalore.netdata.rocks/default.html", title: "India - Bangalore (DigitalOcean.com)"}, + + ] + + for (const server of demoServers) { + html += ( + `<div class="agent-item"> + <i class="fas fa-chart-bar" color: #fff"></i> + <a href="${server.url}">${server.title}</a> + <div></div> + </div> + ` + ); + } + } + + return html; +} + +// Populates the my-netdata menu. +function netdataRegistryCallback(machinesArray) { + let html = ''; + + if (options.hosts.length > 1) { + html += renderStreamedHosts(options) + `<hr />`; + } + + html += renderMachines(machinesArray); + + html += ( + `<hr /> + <div class="agent-item"> + <i class="fas fa-cog""></i> + <a href="#" onclick="switchRegistryModalHandler(); return false;">Switch Identity</a> + <div></div> + </div> + <div class="agent-item"> + <i class="fas fa-question-circle""></i> + <a href="https://github.com/netdata/netdata/tree/master/registry#netdata-registry" target="_blank">What is this?</a> + <div></div> + </div>` + ) + + const el = document.getElementById('my-netdata-dropdown-content') + el.classList.add(`theme-${netdataTheme}`); + el.innerHTML = html; + + gotoServerInit(); +}; + +function isdemo() { + if (this_is_demo !== null) { + return this_is_demo; + } + this_is_demo = false; + + try { + if (typeof document.location.hostname === 'string') { + if (document.location.hostname.endsWith('.my-netdata.io') || + document.location.hostname.endsWith('.mynetdata.io') || + document.location.hostname.endsWith('.netdata.rocks') || + document.location.hostname.endsWith('.netdata.ai') || + document.location.hostname.endsWith('.netdata.live') || + document.location.hostname.endsWith('.firehol.org') || + document.location.hostname.endsWith('.netdata.online') || + document.location.hostname.endsWith('.netdata.cloud')) { + this_is_demo = true; + } + } + } + catch (error) { + } + return this_is_demo; +} + +function netdataURL(url, forReload) { + if (typeof url === 'undefined') + // url = document.location.toString(); + { + url = ''; + } + + if (url.indexOf('#') !== -1) { + url = url.substring(0, url.indexOf('#')); + } + + var hash = urlOptions.genHash(forReload); + + // console.log('netdataURL: ' + url + hash); + + return url + hash; +} + +function netdataReload(url) { + document.location = verifyURL(netdataURL(url, true)); + + // since we play with hash + // this is needed to reload the page + location.reload(); +} + +function gotoHostedModalHandler(url) { + document.location = verifyURL(url + urlOptions.genHash()); + return false; +} + +var gotoServerValidateRemaining = 0; +var gotoServerMiddleClick = false; +var gotoServerStop = false; + +function gotoServerValidateUrl(id, guid, url) { + var penalty = 0; + var error = 'failed'; + + if (document.location.toString().startsWith('http://') && url.toString().startsWith('https://')) + // we penalize https only if the current url is http + // to allow the user walk through all its servers. + { + penalty = 500; + } else if (document.location.toString().startsWith('https://') && url.toString().startsWith('http://')) { + error = 'can\'t check'; + } + + var finalURL = netdataURL(url); + + setTimeout(function () { + document.getElementById('gotoServerList').innerHTML += '<tr><td style="padding-left: 20px;"><a href="' + verifyURL(finalURL) + '" target="_blank">' + escapeUserInputHTML(url) + '</a></td><td style="padding-left: 30px;"><code id="' + guid + '-' + id + '-status">checking...</code></td></tr>'; + + NETDATA.registry.hello(url, function (data) { + if (typeof data !== 'undefined' && data !== null && typeof data.machine_guid === 'string' && data.machine_guid === guid) { + // console.log('OK ' + id + ' URL: ' + url); + document.getElementById(guid + '-' + id + '-status').innerHTML = "OK"; + + if (!gotoServerStop) { + gotoServerStop = true; + + if (gotoServerMiddleClick) { + window.open(verifyURL(finalURL), '_blank'); + gotoServerMiddleClick = false; + document.getElementById('gotoServerResponse').innerHTML = '<b>Opening new window to ' + NETDATA.registry.machines[guid].name + '<br/><a href="' + verifyURL(finalURL) + '">' + escapeUserInputHTML(url) + '</a></b><br/>(check your pop-up blocker if it fails)'; + } else { + document.getElementById('gotoServerResponse').innerHTML += 'found it! It is at:<br/><small>' + escapeUserInputHTML(url) + '</small>'; + document.location = verifyURL(finalURL); + } + } + } else { + if (typeof data !== 'undefined' && data !== null && typeof data.machine_guid === 'string' && data.machine_guid !== guid) { + error = 'wrong machine'; + } + + document.getElementById(guid + '-' + id + '-status').innerHTML = error; + gotoServerValidateRemaining--; + if (gotoServerValidateRemaining <= 0) { + gotoServerMiddleClick = false; + document.getElementById('gotoServerResponse').innerHTML = '<b>Sorry! I cannot find any operational URL for this server</b>'; + } + } + }); + }, (id * 50) + penalty); +} + +function gotoServerModalHandler(guid) { + // console.log('goto server: ' + guid); + + gotoServerStop = false; + var checked = {}; + var len = NETDATA.registry.machines[guid].alternate_urls.length; + var count = 0; + + document.getElementById('gotoServerResponse').innerHTML = ''; + document.getElementById('gotoServerList').innerHTML = ''; + document.getElementById('gotoServerName').innerHTML = NETDATA.registry.machines[guid].name; + $('#gotoServerModal').modal('show'); + + gotoServerValidateRemaining = len; + while (len--) { + var url = NETDATA.registry.machines[guid].alternate_urls[len]; + checked[url] = true; + gotoServerValidateUrl(count++, guid, url); + } + + setTimeout(function () { + if (gotoServerStop === false) { + document.getElementById('gotoServerResponse').innerHTML = '<b>Added all the known URLs for this machine.</b>'; + NETDATA.registry.search(guid, function (data) { + // console.log(data); + len = data.urls.length; + while (len--) { + var url = data.urls[len][1]; + // console.log(url); + if (typeof checked[url] === 'undefined') { + gotoServerValidateRemaining++; + checked[url] = true; + gotoServerValidateUrl(count++, guid, url); + } + } + }); + } + }, 2000); + return false; +} + +function gotoServerInit() { + $(".registry_link").on('click', function (e) { + if (e.which === 2) { + e.preventDefault(); + gotoServerMiddleClick = true; + } else { + gotoServerMiddleClick = false; + } + + return true; + }); +} + +function switchRegistryModalHandler() { + document.getElementById('switchRegistryPersonGUID').value = NETDATA.registry.person_guid; + document.getElementById('switchRegistryURL').innerHTML = NETDATA.registry.server; + document.getElementById('switchRegistryResponse').innerHTML = ''; + $('#switchRegistryModal').modal('show'); +} + +function notifyForSwitchRegistry() { + var n = document.getElementById('switchRegistryPersonGUID').value; + + if (n !== '' && n.length === 36) { + NETDATA.registry.switch(n, function (result) { + if (result !== null) { + $('#switchRegistryModal').modal('hide'); + NETDATA.registry.init(); + } else { + document.getElementById('switchRegistryResponse').innerHTML = "<b>Sorry! The registry rejected your request.</b>"; + } + }); + } else { + document.getElementById('switchRegistryResponse').innerHTML = "<b>The ID you have entered is not a GUID.</b>"; + } +} + +var deleteRegistryUrl = null; + +function deleteRegistryModalHandler(guid, name, url) { + void (guid); + + deleteRegistryUrl = url; + document.getElementById('deleteRegistryServerName').innerHTML = name; + document.getElementById('deleteRegistryServerName2').innerHTML = name; + document.getElementById('deleteRegistryServerURL').innerHTML = url; + document.getElementById('deleteRegistryResponse').innerHTML = ''; + $('#deleteRegistryModal').modal('show'); +} + +function notifyForDeleteRegistry() { + if (deleteRegistryUrl) { + NETDATA.registry.delete(deleteRegistryUrl, function (result) { + if (result !== null) { + deleteRegistryUrl = null; + $('#deleteRegistryModal').modal('hide'); + NETDATA.registry.init(); + } else { + document.getElementById('deleteRegistryResponse').innerHTML = "<b>Sorry! this command was rejected by the registry server.</b>"; + } + }); + } +} + +var options = { + menus: {}, + submenu_names: {}, + data: null, + hostname: 'netdata_server', // will be overwritten by the netdata server + version: 'unknown', + hosts: [], + + duration: 0, // the default duration of the charts + update_every: 1, + + chartsPerRow: 0, + // chartsMinWidth: 1450, + chartsHeight: 180, +}; + +function chartsPerRow(total) { + void (total); + + if (options.chartsPerRow === 0) { + return 1; + //var width = Math.floor(total / options.chartsMinWidth); + //if(width === 0) width = 1; + //return width; + } else { + return options.chartsPerRow; + } +} + +function prioritySort(a, b) { + if (a.priority < b.priority) { + return -1; + } + if (a.priority > b.priority) { + return 1; + } + return naturalSortCompare(a.name, b.name); +} + +function sortObjectByPriority(object) { + var idx = {}; + var sorted = []; + + for (var i in object) { + if (!object.hasOwnProperty(i)) { + continue; + } + + if (typeof idx[i] === 'undefined') { + idx[i] = object[i]; + sorted.push(i); + } + } + + sorted.sort(function (a, b) { + if (idx[a].priority < idx[b].priority) { + return -1; + } + if (idx[a].priority > idx[b].priority) { + return 1; + } + return naturalSortCompare(a, b); + }); + + return sorted; +} + +// ---------------------------------------------------------------------------- +// scroll to a section, without changing the browser history + +function scrollToId(hash) { + if (hash && hash !== '' && document.getElementById(hash) !== null) { + var offset = $('#' + hash).offset(); + if (typeof offset !== 'undefined') { + //console.log('scrolling to ' + hash + ' at ' + offset.top.toString()); + $('html, body').animate({scrollTop: offset.top - 30}, 0); + } + } + + // we must return false to prevent the default action + return false; +} + +// ---------------------------------------------------------------------------- + +// user editable information +var customDashboard = { + menu: {}, + submenu: {}, + context: {} +}; + +// netdata standard information +var netdataDashboard = { + sparklines_registry: {}, + os: 'unknown', + + menu: {}, + submenu: {}, + context: {}, + + // generate a sparkline + // used in the documentation + sparkline: function (prefix, chart, dimension, units, suffix) { + if (options.data === null || typeof options.data.charts === 'undefined') { + return ''; + } + + if (typeof options.data.charts[chart] === 'undefined') { + return ''; + } + + if (typeof options.data.charts[chart].dimensions === 'undefined') { + return ''; + } + + if (typeof options.data.charts[chart].dimensions[dimension] === 'undefined') { + return ''; + } + + var key = chart + '.' + dimension; + + if (typeof units === 'undefined') { + units = ''; + } + + if (typeof this.sparklines_registry[key] === 'undefined') { + this.sparklines_registry[key] = {count: 1}; + } else { + this.sparklines_registry[key].count++; + } + + key = key + '.' + this.sparklines_registry[key].count; + + return prefix + '<div class="netdata-container" data-netdata="' + chart + '" data-after="-120" data-width="25%" data-height="15px" data-chart-library="dygraph" data-dygraph-theme="sparkline" data-dimensions="' + dimension + '" data-show-value-of-' + dimension + '-at="' + key + '"></div> (<span id="' + key + '" style="display: inline-block; min-width: 50px; text-align: right;">X</span>' + units + ')' + suffix; + }, + + gaugeChart: function (title, width, dimensions, colors) { + if (typeof colors === 'undefined') { + colors = ''; + } + + if (typeof dimensions === 'undefined') { + dimensions = ''; + } + + return '<div class="netdata-container" data-netdata="CHART_UNIQUE_ID"' + + ' data-dimensions="' + dimensions + '"' + + ' data-chart-library="gauge"' + + ' data-gauge-adjust="width"' + + ' data-title="' + title + '"' + + ' data-width="' + width + '"' + + ' data-before="0"' + + ' data-after="-CHART_DURATION"' + + ' data-points="CHART_DURATION"' + + ' data-colors="' + colors + '"' + + ' role="application"></div>'; + }, + + anyAttribute: function (obj, attr, key, def) { + if (typeof (obj[key]) !== 'undefined') { + var x = obj[key][attr]; + + if (typeof (x) === 'undefined') { + return def; + } + + if (typeof (x) === 'function') { + return x(netdataDashboard.os); + } + + return x; + } + + return def; + }, + + menuTitle: function (chart) { + if (typeof chart.menu_pattern !== 'undefined') { + return (this.anyAttribute(this.menu, 'title', chart.menu_pattern, chart.menu_pattern).toString() + + ' ' + chart.type.slice(-(chart.type.length - chart.menu_pattern.length - 1)).toString()).replace(/_/g, ' '); + } + + return (this.anyAttribute(this.menu, 'title', chart.menu, chart.menu)).toString().replace(/_/g, ' '); + }, + + menuIcon: function (chart) { + if (typeof chart.menu_pattern !== 'undefined') { + return this.anyAttribute(this.menu, 'icon', chart.menu_pattern, '<i class="fas fa-puzzle-piece"></i>').toString(); + } + + return this.anyAttribute(this.menu, 'icon', chart.menu, '<i class="fas fa-puzzle-piece"></i>'); + }, + + menuInfo: function (chart) { + if (typeof chart.menu_pattern !== 'undefined') { + return this.anyAttribute(this.menu, 'info', chart.menu_pattern, null); + } + + return this.anyAttribute(this.menu, 'info', chart.menu, null); + }, + + menuHeight: function (chart) { + if (typeof chart.menu_pattern !== 'undefined') { + return this.anyAttribute(this.menu, 'height', chart.menu_pattern, 1.0); + } + + return this.anyAttribute(this.menu, 'height', chart.menu, 1.0); + }, + + submenuTitle: function (menu, submenu) { + var key = menu + '.' + submenu; + // console.log(key); + var title = this.anyAttribute(this.submenu, 'title', key, submenu).toString().replace(/_/g, ' '); + if (title.length > 28) { + var a = title.substring(0, 13); + var b = title.substring(title.length - 12, title.length); + return a + '...' + b; + } + return title; + }, + + submenuInfo: function (menu, submenu) { + var key = menu + '.' + submenu; + return this.anyAttribute(this.submenu, 'info', key, null); + }, + + submenuHeight: function (menu, submenu, relative) { + var key = menu + '.' + submenu; + return this.anyAttribute(this.submenu, 'height', key, 1.0) * relative; + }, + + contextInfo: function (id) { + var x = this.anyAttribute(this.context, 'info', id, null); + + if (x !== null) { + return '<div class="shorten dashboard-context-info netdata-chart-alignment" role="document">' + x + '</div>'; + } else { + return ''; + } + }, + + contextValueRange: function (id) { + if (typeof this.context[id] !== 'undefined' && typeof this.context[id].valueRange !== 'undefined') { + return this.context[id].valueRange; + } else { + return '[null, null]'; + } + }, + + contextHeight: function (id, def) { + if (typeof this.context[id] !== 'undefined' && typeof this.context[id].height !== 'undefined') { + return def * this.context[id].height; + } else { + return def; + } + }, + + contextDecimalDigits: function (id, def) { + if (typeof this.context[id] !== 'undefined' && typeof this.context[id].decimalDigits !== 'undefined') { + return this.context[id].decimalDigits; + } else { + return def; + } + } +}; + +// ---------------------------------------------------------------------------- + +// enrich the data structure returned by netdata +// to reflect our menu system and content +// TODO: this is a shame - we should fix charts naming (issue #807) +function enrichChartData(chart) { + var parts = chart.type.split('_'); + var tmp = parts[0]; + + switch (tmp) { + case 'ap': + case 'net': + case 'disk': + case 'statsd': + chart.menu = tmp; + break; + + case 'apache': + chart.menu = chart.type; + if (parts.length > 2 && parts[1] === 'cache') { + chart.menu_pattern = tmp + '_' + parts[1]; + } else if (parts.length > 1) { + chart.menu_pattern = tmp; + } + break; + + case 'bind': + chart.menu = chart.type; + if (parts.length > 2 && parts[1] === 'rndc') { + chart.menu_pattern = tmp + '_' + parts[1]; + } else if (parts.length > 1) { + chart.menu_pattern = tmp; + } + break; + + case 'cgroup': + chart.menu = chart.type; + if (chart.id.match(/.*[\._\/-:]qemu[\._\/-:]*/) || chart.id.match(/.*[\._\/-:]kvm[\._\/-:]*/)) { + chart.menu_pattern = 'cgqemu'; + } else { + chart.menu_pattern = 'cgroup'; + } + break; + + case 'go': + chart.menu = chart.type; + if (parts.length > 2 && parts[1] === 'expvar') { + chart.menu_pattern = tmp + '_' + parts[1]; + } else if (parts.length > 1) { + chart.menu_pattern = tmp; + } + break; + + case 'isc': + chart.menu = chart.type; + if (parts.length > 2 && parts[1] === 'dhcpd') { + chart.menu_pattern = tmp + '_' + parts[1]; + } else if (parts.length > 1) { + chart.menu_pattern = tmp; + } + break; + + case 'ovpn': + chart.menu = chart.type; + if (parts.length > 3 && parts[1] === 'status' && parts[2] === 'log') { + chart.menu_pattern = tmp + '_' + parts[1]; + } else if (parts.length > 1) { + chart.menu_pattern = tmp; + } + break; + + case 'smartd': + case 'web': + chart.menu = chart.type; + if (parts.length > 2 && parts[1] === 'log') { + chart.menu_pattern = tmp + '_' + parts[1]; + } else if (parts.length > 1) { + chart.menu_pattern = tmp; + } + break; + + case 'tc': + chart.menu = tmp; + + // find a name for this device from fireqos info + // we strip '_(in|out)' or '(in|out)_' + if (chart.context === 'tc.qos' && (typeof options.submenu_names[chart.family] === 'undefined' || options.submenu_names[chart.family] === chart.family)) { + var n = chart.name.split('.')[1]; + if (n.endsWith('_in')) { + options.submenu_names[chart.family] = n.slice(0, n.lastIndexOf('_in')); + } else if (n.endsWith('_out')) { + options.submenu_names[chart.family] = n.slice(0, n.lastIndexOf('_out')); + } else if (n.startsWith('in_')) { + options.submenu_names[chart.family] = n.slice(3, n.length); + } else if (n.startsWith('out_')) { + options.submenu_names[chart.family] = n.slice(4, n.length); + } else { + options.submenu_names[chart.family] = n; + } + } + + // increase the priority of IFB devices + // to have inbound appear before outbound + if (chart.id.match(/.*-ifb$/)) { + chart.priority--; + } + + break; + + default: + chart.menu = chart.type; + if (parts.length > 1) { + chart.menu_pattern = tmp; + } + break; + } + + chart.submenu = chart.family; +} + +// ---------------------------------------------------------------------------- + +function headMain(os, charts, duration) { + void (os); + + if (urlOptions.mode === 'print') { + return ''; + } + + var head = ''; + + if (typeof charts['system.swap'] !== 'undefined') { + head += '<div class="netdata-container" style="margin-right: 10px;" data-netdata="system.swap"' + + ' data-dimensions="used"' + + ' data-append-options="percentage"' + + ' data-chart-library="easypiechart"' + + ' data-title="Used Swap"' + + ' data-units="%"' + + ' data-easypiechart-max-value="100"' + + ' data-width="9%"' + + ' data-before="0"' + + ' data-after="-' + duration.toString() + '"' + + ' data-points="' + duration.toString() + '"' + + ' data-colors="#DD4400"' + + ' role="application"></div>'; + } + + if (typeof charts['system.io'] !== 'undefined') { + head += '<div class="netdata-container" style="margin-right: 10px;" data-netdata="system.io"' + + ' data-dimensions="in"' + + ' data-chart-library="easypiechart"' + + ' data-title="Disk Read"' + + ' data-width="11%"' + + ' data-before="0"' + + ' data-after="-' + duration.toString() + '"' + + ' data-points="' + duration.toString() + '"' + + ' data-common-units="system.io.mainhead"' + + ' role="application"></div>'; + + head += '<div class="netdata-container" style="margin-right: 10px;" data-netdata="system.io"' + + ' data-dimensions="out"' + + ' data-chart-library="easypiechart"' + + ' data-title="Disk Write"' + + ' data-width="11%"' + + ' data-before="0"' + + ' data-after="-' + duration.toString() + '"' + + ' data-points="' + duration.toString() + '"' + + ' data-common-units="system.io.mainhead"' + + ' role="application"></div>'; + } + else if (typeof charts['system.pgpgio'] !== 'undefined') { + head += '<div class="netdata-container" style="margin-right: 10px;" data-netdata="system.pgpgio"' + + ' data-dimensions="in"' + + ' data-chart-library="easypiechart"' + + ' data-title="Disk Read"' + + ' data-width="11%"' + + ' data-before="0"' + + ' data-after="-' + duration.toString() + '"' + + ' data-points="' + duration.toString() + '"' + + ' data-common-units="system.pgpgio.mainhead"' + + ' role="application"></div>'; + + head += '<div class="netdata-container" style="margin-right: 10px;" data-netdata="system.pgpgio"' + + ' data-dimensions="out"' + + ' data-chart-library="easypiechart"' + + ' data-title="Disk Write"' + + ' data-width="11%"' + + ' data-before="0"' + + ' data-after="-' + duration.toString() + '"' + + ' data-points="' + duration.toString() + '"' + + ' data-common-units="system.pgpgio.mainhead"' + + ' role="application"></div>'; + } + + if (typeof charts['system.cpu'] !== 'undefined') { + head += '<div class="netdata-container" style="margin-right: 10px;" data-netdata="system.cpu"' + + ' data-chart-library="gauge"' + + ' data-title="CPU"' + + ' data-units="%"' + + ' data-gauge-max-value="100"' + + ' data-width="20%"' + + ' data-after="-' + duration.toString() + '"' + + ' data-points="' + duration.toString() + '"' + + ' data-colors="' + NETDATA.colors[12] + '"' + + ' role="application"></div>'; + } + + if (typeof charts['system.net'] !== 'undefined') { + head += '<div class="netdata-container" style="margin-right: 10px;" data-netdata="system.net"' + + ' data-dimensions="received"' + + ' data-chart-library="easypiechart"' + + ' data-title="Net Inbound"' + + ' data-width="11%"' + + ' data-before="0"' + + ' data-after="-' + duration.toString() + '"' + + ' data-points="' + duration.toString() + '"' + + ' data-common-units="system.net.mainhead"' + + ' role="application"></div>'; + + head += '<div class="netdata-container" style="margin-right: 10px;" data-netdata="system.net"' + + ' data-dimensions="sent"' + + ' data-chart-library="easypiechart"' + + ' data-title="Net Outbound"' + + ' data-width="11%"' + + ' data-before="0"' + + ' data-after="-' + duration.toString() + '"' + + ' data-points="' + duration.toString() + '"' + + ' data-common-units="system.net.mainhead"' + + ' role="application"></div>'; + } + else if (typeof charts['system.ip'] !== 'undefined') { + head += '<div class="netdata-container" style="margin-right: 10px;" data-netdata="system.ip"' + + ' data-dimensions="received"' + + ' data-chart-library="easypiechart"' + + ' data-title="IP Inbound"' + + ' data-width="11%"' + + ' data-before="0"' + + ' data-after="-' + duration.toString() + '"' + + ' data-points="' + duration.toString() + '"' + + ' data-common-units="system.ip.mainhead"' + + ' role="application"></div>'; + + head += '<div class="netdata-container" style="margin-right: 10px;" data-netdata="system.ip"' + + ' data-dimensions="sent"' + + ' data-chart-library="easypiechart"' + + ' data-title="IP Outbound"' + + ' data-width="11%"' + + ' data-before="0"' + + ' data-after="-' + duration.toString() + '"' + + ' data-points="' + duration.toString() + '"' + + ' data-common-units="system.ip.mainhead"' + + ' role="application"></div>'; + } + else if (typeof charts['system.ipv4'] !== 'undefined') { + head += '<div class="netdata-container" style="margin-right: 10px;" data-netdata="system.ipv4"' + + ' data-dimensions="received"' + + ' data-chart-library="easypiechart"' + + ' data-title="IPv4 Inbound"' + + ' data-width="11%"' + + ' data-before="0"' + + ' data-after="-' + duration.toString() + '"' + + ' data-points="' + duration.toString() + '"' + + ' data-common-units="system.ipv4.mainhead"' + + ' role="application"></div>'; + + head += '<div class="netdata-container" style="margin-right: 10px;" data-netdata="system.ipv4"' + + ' data-dimensions="sent"' + + ' data-chart-library="easypiechart"' + + ' data-title="IPv4 Outbound"' + + ' data-width="11%"' + + ' data-before="0"' + + ' data-after="-' + duration.toString() + '"' + + ' data-points="' + duration.toString() + '"' + + ' data-common-units="system.ipv4.mainhead"' + + ' role="application"></div>'; + } + else if (typeof charts['system.ipv6'] !== 'undefined') { + head += '<div class="netdata-container" style="margin-right: 10px;" data-netdata="system.ipv6"' + + ' data-dimensions="received"' + + ' data-chart-library="easypiechart"' + + ' data-title="IPv6 Inbound"' + + ' data-units="kbps"' + + ' data-width="11%"' + + ' data-before="0"' + + ' data-after="-' + duration.toString() + '"' + + ' data-points="' + duration.toString() + '"' + + ' data-common-units="system.ipv6.mainhead"' + + ' role="application"></div>'; + + head += '<div class="netdata-container" style="margin-right: 10px;" data-netdata="system.ipv6"' + + ' data-dimensions="sent"' + + ' data-chart-library="easypiechart"' + + ' data-title="IPv6 Outbound"' + + ' data-units="kbps"' + + ' data-width="11%"' + + ' data-before="0"' + + ' data-after="-' + duration.toString() + '"' + + ' data-points="' + duration.toString() + '"' + + ' data-common-units="system.ipv6.mainhead"' + + ' role="application"></div>'; + } + + if (typeof charts['system.ram'] !== 'undefined') { + head += '<div class="netdata-container" style="margin-right: 10px;" data-netdata="system.ram"' + + ' data-dimensions="used|buffers|active|wired"' // active and wired are FreeBSD stats + + ' data-append-options="percentage"' + + ' data-chart-library="easypiechart"' + + ' data-title="Used RAM"' + + ' data-units="%"' + + ' data-easypiechart-max-value="100"' + + ' data-width="9%"' + + ' data-after="-' + duration.toString() + '"' + + ' data-points="' + duration.toString() + '"' + + ' data-colors="' + NETDATA.colors[7] + '"' + + ' role="application"></div>'; + } + + return head; +} + +function generateHeadCharts(type, chart, duration) { + if (urlOptions.mode === 'print') { + return ''; + } + + var head = ''; + var hcharts = netdataDashboard.anyAttribute(netdataDashboard.context, type, chart.context, []); + if (hcharts.length > 0) { + var hi = 0, hlen = hcharts.length; + while (hi < hlen) { + if (typeof hcharts[hi] === 'function') { + head += hcharts[hi](netdataDashboard.os, chart.id).replace(/CHART_DURATION/g, duration.toString()).replace(/CHART_UNIQUE_ID/g, chart.id); + } else { + head += hcharts[hi].replace(/CHART_DURATION/g, duration.toString()).replace(/CHART_UNIQUE_ID/g, chart.id); + } + hi++; + } + } + return head; +} + +function renderPage(menus, data) { + var div = document.getElementById('charts_div'); + var pcent_width = Math.floor(100 / chartsPerRow($(div).width())); + + // find the proper duration for per-second updates + var duration = Math.round(($(div).width() * pcent_width / 100 * data.update_every / 3) / 60) * 60; + options.duration = duration; + options.update_every = data.update_every; + + var html = ''; + var sidebar = '<ul class="nav dashboard-sidenav" data-spy="affix" id="sidebar_ul">'; + var mainhead = headMain(netdataDashboard.os, data.charts, duration); + + // sort the menus + var main = sortObjectByPriority(menus); + var i = 0, len = main.length; + while (i < len) { + var menu = main[i++]; + + // generate an entry at the main menu + + var menuid = NETDATA.name2id('menu_' + menu); + sidebar += '<li class=""><a href="#' + menuid + '" onClick="return scrollToId(\'' + menuid + '\');">' + menus[menu].icon + ' ' + menus[menu].title + '</a><ul class="nav">'; + html += '<div role="section" class="dashboard-section"><div role="sectionhead"><h1 id="' + menuid + '" role="heading">' + menus[menu].icon + ' ' + menus[menu].title + '</h1></div><div role="section" class="dashboard-subsection">'; + + if (menus[menu].info !== null) { + html += menus[menu].info; + } + + // console.log(' >> ' + menu + ' (' + menus[menu].priority + '): ' + menus[menu].title); + + var shtml = ''; + var mhead = '<div class="netdata-chart-row">' + mainhead; + mainhead = ''; + + // sort the submenus of this menu + var sub = sortObjectByPriority(menus[menu].submenus); + var si = 0, slen = sub.length; + while (si < slen) { + var submenu = sub[si++]; + + // generate an entry at the submenu + var submenuid = NETDATA.name2id('menu_' + menu + '_submenu_' + submenu); + sidebar += '<li class><a href="#' + submenuid + '" onClick="return scrollToId(\'' + submenuid + '\');">' + menus[menu].submenus[submenu].title + '</a></li>'; + shtml += '<div role="section" class="dashboard-section-container" id="' + submenuid + '"><h2 id="' + submenuid + '" class="netdata-chart-alignment" role="heading">' + menus[menu].submenus[submenu].title + '</h2>'; + + if (menus[menu].submenus[submenu].info !== null) { + shtml += '<div class="dashboard-submenu-info netdata-chart-alignment" role="document">' + menus[menu].submenus[submenu].info + '</div>'; + } + + var head = '<div class="netdata-chart-row">'; + var chtml = ''; + + // console.log(' \------- ' + submenu + ' (' + menus[menu].submenus[submenu].priority + '): ' + menus[menu].submenus[submenu].title); + + // sort the charts in this submenu of this menu + menus[menu].submenus[submenu].charts.sort(prioritySort); + var ci = 0, clen = menus[menu].submenus[submenu].charts.length; + while (ci < clen) { + var chart = menus[menu].submenus[submenu].charts[ci++]; + + // generate the submenu heading charts + mhead += generateHeadCharts('mainheads', chart, duration); + head += generateHeadCharts('heads', chart, duration); + + function chartCommonMin(family, context, units) { + var x = netdataDashboard.anyAttribute(netdataDashboard.context, 'commonMin', context, undefined); + if (typeof x !== 'undefined') { + return ' data-common-min="' + family + '/' + context + '/' + units + '"'; + } else { + return ''; + } + } + + function chartCommonMax(family, context, units) { + var x = netdataDashboard.anyAttribute(netdataDashboard.context, 'commonMax', context, undefined); + if (typeof x !== 'undefined') { + return ' data-common-max="' + family + '/' + context + '/' + units + '"'; + } else { + return ''; + } + } + + // generate the chart + if (urlOptions.mode === 'print') { + chtml += '<div role="row" class="dashboard-print-row">'; + } + + chtml += '<div class="netdata-chartblock-container" style="width: ' + pcent_width.toString() + '%;">' + netdataDashboard.contextInfo(chart.context) + '<div class="netdata-container" id="chart_' + NETDATA.name2id(chart.id) + '" data-netdata="' + chart.id + '"' + + ' data-width="100%"' + + ' data-height="' + netdataDashboard.contextHeight(chart.context, options.chartsHeight).toString() + 'px"' + + ' data-dygraph-valuerange="' + netdataDashboard.contextValueRange(chart.context) + '"' + + ' data-before="0"' + + ' data-after="-' + duration.toString() + '"' + + ' data-id="' + NETDATA.name2id(options.hostname + '/' + chart.id) + '"' + + ' data-colors="' + netdataDashboard.anyAttribute(netdataDashboard.context, 'colors', chart.context, '') + '"' + + ' data-decimal-digits="' + netdataDashboard.contextDecimalDigits(chart.context, -1) + '"' + + chartCommonMin(chart.family, chart.context, chart.units) + + chartCommonMax(chart.family, chart.context, chart.units) + + ' role="application"></div></div>'; + + if (urlOptions.mode === 'print') { + chtml += '</div>'; + } + + // console.log(' \------- ' + chart.id + ' (' + chart.priority + '): ' + chart.context + ' height: ' + menus[menu].submenus[submenu].height); + } + + head += '</div>'; + shtml += head + chtml + '</div>'; + } + + mhead += '</div>'; + sidebar += '</ul></li>'; + html += mhead + shtml + '</div></div><hr role="separator"/>'; + } + + sidebar += '<li class="" style="padding-top:15px;"><a href="https://github.com/netdata/netdata/blob/master/doc/Add-more-charts-to-netdata.md#add-more-charts-to-netdata" target="_blank"><i class="fas fa-plus"></i> add more charts</a></li>'; + sidebar += '<li class=""><a href="https://github.com/netdata/netdata/tree/master/health#Health-monitoring" target="_blank"><i class="fas fa-plus"></i> add more alarms</a></li>'; + sidebar += '<li class="" style="margin:20px;color:#666;"><small>netdata on <b>' + data.hostname.toString() + '</b>, collects every ' + ((data.update_every === 1) ? 'second' : data.update_every.toString() + ' seconds') + ' <b>' + data.dimensions_count.toLocaleString() + '</b> metrics, presented as <b>' + data.charts_count.toLocaleString() + '</b> charts and monitored by <b>' + data.alarms_count.toLocaleString() + '</b> alarms, using ' + Math.round(data.rrd_memory_bytes / 1024 / 1024).toLocaleString() + ' MB of memory for ' + NETDATA.seconds4human(data.update_every * data.history, {space: ' '}) + ' of real-time history.<br/> <br/><b>netdata</b><br/>v' + data.version.toString() + '</small></li>'; + sidebar += '</ul>'; + div.innerHTML = html; + document.getElementById('sidebar').innerHTML = sidebar; + + if (urlOptions.highlight === true) { + NETDATA.globalChartUnderlay.init(null + , urlOptions.highlight_after + , urlOptions.highlight_before + , (urlOptions.after > 0) ? urlOptions.after : null + , (urlOptions.before > 0) ? urlOptions.before : null + ); + } else { + NETDATA.globalChartUnderlay.clear(); + } + + if (urlOptions.mode === 'print') { + printPage(); + } else { + finalizePage(); + } +} + +function renderChartsAndMenu(data) { + options.menus = {}; + options.submenu_names = {}; + + var menus = options.menus; + var charts = data.charts; + var m, menu_key; + + for (var c in charts) { + if (!charts.hasOwnProperty(c)) { + continue; + } + + var chart = charts[c]; + enrichChartData(chart); + m = chart.menu; + + // create the menu + if (typeof menus[m] === 'undefined') { + menus[m] = { + menu_pattern: chart.menu_pattern, + priority: chart.priority, + submenus: {}, + title: netdataDashboard.menuTitle(chart), + icon: netdataDashboard.menuIcon(chart), + info: netdataDashboard.menuInfo(chart), + height: netdataDashboard.menuHeight(chart) * options.chartsHeight + }; + } else { + if (typeof (menus[m].menu_pattern) === 'undefined') { + menus[m].menu_pattern = chart.menu_pattern; + } + + if (chart.priority < menus[m].priority) { + menus[m].priority = chart.priority; + } + } + + menu_key = (typeof (menus[m].menu_pattern) !== 'undefined') ? menus[m].menu_pattern : m; + + // create the submenu + if (typeof menus[m].submenus[chart.submenu] === 'undefined') { + menus[m].submenus[chart.submenu] = { + priority: chart.priority, + charts: [], + title: null, + info: netdataDashboard.submenuInfo(menu_key, chart.submenu), + height: netdataDashboard.submenuHeight(menu_key, chart.submenu, menus[m].height) + }; + } else { + if (chart.priority < menus[m].submenus[chart.submenu].priority) { + menus[m].submenus[chart.submenu].priority = chart.priority; + } + } + + // index the chart in the menu/submenu + menus[m].submenus[chart.submenu].charts.push(chart); + } + + // propagate the descriptive subname given to QoS + // to all the other submenus with the same name + for (m in menus) { + if (!menus.hasOwnProperty(m)) { + continue; + } + + for (var s in menus[m].submenus) { + if (!menus[m].submenus.hasOwnProperty(s)) { + continue; + } + + // set the family using a name + if (typeof options.submenu_names[s] !== 'undefined') { + menus[m].submenus[s].title = s + ' (' + options.submenu_names[s] + ')'; + } else { + menu_key = (typeof (menus[m].menu_pattern) !== 'undefined') ? menus[m].menu_pattern : m; + menus[m].submenus[s].title = netdataDashboard.submenuTitle(menu_key, s); + } + } + } + + renderPage(menus, data); +} + +// ---------------------------------------------------------------------------- + +function loadJs(url, callback) { + $.ajax({ + url: url, + cache: true, + dataType: "script", + xhrFields: {withCredentials: true} // required for the cookie + }) + .fail(function () { + alert('Cannot load required JS library: ' + url); + }) + .always(function () { + if (typeof callback === 'function') { + callback(); + } + }) +} + +var clipboardLoaded = false; + +function loadClipboard(callback) { + if (clipboardLoaded === false) { + clipboardLoaded = true; + loadJs('lib/clipboard-polyfill-be05dad.js', callback); + } else { + callback(); + } +} + +var bootstrapTableLoaded = false; + +function loadBootstrapTable(callback) { + if (bootstrapTableLoaded === false) { + bootstrapTableLoaded = true; + loadJs('lib/bootstrap-table-1.11.0.min.js', function () { + loadJs('lib/bootstrap-table-export-1.11.0.min.js', function () { + loadJs('lib/tableExport-1.6.0.min.js', callback); + }) + }); + } else { + callback(); + } +} + +var bootstrapSliderLoaded = false; + +function loadBootstrapSlider(callback) { + if (bootstrapSliderLoaded === false) { + bootstrapSliderLoaded = true; + loadJs('lib/bootstrap-slider-10.0.0.min.js', function () { + NETDATA._loadCSS('css/bootstrap-slider-10.0.0.min.css'); + callback(); + }); + } else { + callback(); + } +} + +var lzStringLoaded = false; + +function loadLzString(callback) { + if (lzStringLoaded === false) { + lzStringLoaded = true; + loadJs('lib/lz-string-1.4.4.min.js', callback); + } else { + callback(); + } +} + +var pakoLoaded = false; + +function loadPako(callback) { + if (pakoLoaded === false) { + pakoLoaded = true; + loadJs('lib/pako-1.0.6.min.js', callback); + } else { + callback(); + } +} + +// ---------------------------------------------------------------------------- + +function clipboardCopy(text) { + clipboard.writeText(text); +} + +function clipboardCopyBadgeEmbed(url) { + clipboard.writeText('<embed src="' + url + '" type="image/svg+xml" height="20"/>'); +} + +// ---------------------------------------------------------------------------- + +function alarmsUpdateModal() { + var active = '<h3>Raised Alarms</h3><table class="table">'; + var all = '<h3>All Running Alarms</h3><div class="panel-group" id="alarms_all_accordion" role="tablist" aria-multiselectable="true">'; + var footer = '<hr/><a href="https://github.com/netdata/netdata/tree/master/web/api/badges#netdata-badges" target="_blank">netdata badges</a> refresh automatically. Their color indicates the state of the alarm: <span style="color: #e05d44"><b> red </b></span> is critical, <span style="color:#fe7d37"><b> orange </b></span> is warning, <span style="color: #4c1"><b> bright green </b></span> is ok, <span style="color: #9f9f9f"><b> light grey </b></span> is undefined (i.e. no data or no status), <span style="color: #000"><b> black </b></span> is not initialized. You can copy and paste their URLs to embed them in any web page.<br/>netdata can send notifications for these alarms. Check <a href="https://github.com/netdata/netdata/blob/master/health/notifications/health_alarm_notify.conf">this configuration file</a> for more information.'; + + loadClipboard(function () { + }); + + NETDATA.alarms.get('all', function (data) { + options.alarm_families = []; + + alarmsCallback(data); + + if (data === null) { + document.getElementById('alarms_active').innerHTML = + document.getElementById('alarms_all').innerHTML = + document.getElementById('alarms_log').innerHTML = + 'failed to load alarm data!'; + return; + } + + function alarmid4human(id) { + if (id === 0) { + return '-'; + } + + return id.toString(); + } + + function timestamp4human(timestamp, space) { + if (timestamp === 0) { + return '-'; + } + + if (typeof space === 'undefined') { + space = ' '; + } + + var t = new Date(timestamp * 1000); + var now = new Date(); + + if (t.toDateString() === now.toDateString()) { + return t.toLocaleTimeString(); + } + + return t.toLocaleDateString() + space + t.toLocaleTimeString(); + } + + function alarm_lookup_explain(alarm, chart) { + var dimensions = ' of all values '; + + if (chart.dimensions.length > 1) { + dimensions = ' of the sum of all dimensions '; + } + + if (typeof alarm.lookup_dimensions !== 'undefined') { + var d = alarm.lookup_dimensions.replace(/|/g, ','); + var x = d.split(','); + if (x.length > 1) { + dimensions = 'of the sum of dimensions <code>' + alarm.lookup_dimensions + '</code> '; + } else { + dimensions = 'of all values of dimension <code>' + alarm.lookup_dimensions + '</code> '; + } + } + + return '<code>' + alarm.lookup_method + '</code> ' + + dimensions + ', of chart <code>' + alarm.chart + '</code>' + + ', starting <code>' + NETDATA.seconds4human(alarm.lookup_after + alarm.lookup_before, {space: ' '}) + '</code> and up to <code>' + NETDATA.seconds4human(alarm.lookup_before, {space: ' '}) + '</code>' + + ((alarm.lookup_options) ? (', with options <code>' + alarm.lookup_options.replace(/ /g, ', ') + '</code>') : '') + + '.'; + } + + function alarm_to_html(alarm, full) { + var chart = options.data.charts[alarm.chart]; + if (typeof (chart) === 'undefined') { + chart = options.data.charts_by_name[alarm.chart]; + if (typeof (chart) === 'undefined') { + // this means the charts loaded are incomplete + // probably netdata was restarted and more alarms + // are now available. + console.log('Cannot find chart ' + alarm.chart + ', you probably need to refresh the page.'); + return ''; + } + } + + var has_alarm = (typeof alarm.warn !== 'undefined' || typeof alarm.crit !== 'undefined'); + var badge_url = NETDATA.alarms.server + '/api/v1/badge.svg?chart=' + alarm.chart + '&alarm=' + alarm.name + '&refresh=auto'; + + var action_buttons = '<br/> <br/>role: <b>' + alarm.recipient + '</b><br/> <br/>' + + '<div class="action-button ripple" title="click to scroll the dashboard to the chart of this alarm" data-toggle="tooltip" data-placement="bottom" onClick="scrollToChartAfterHidingModal(\'' + alarm.chart + '\'); $(\'#alarmsModal\').modal(\'hide\'); return false;"><i class="fab fa-periscope"></i></div>' + + '<div class="action-button ripple" title="click to copy to the clipboard the URL of this badge" data-toggle="tooltip" data-placement="bottom" onClick="clipboardCopy(\'' + badge_url + '\'); return false;"><i class="far fa-copy"></i></div>' + + '<div class="action-button ripple" title="click to copy to the clipboard an auto-refreshing <code>embed</code> html element for this badge" data-toggle="tooltip" data-placement="bottom" onClick="clipboardCopyBadgeEmbed(\'' + badge_url + '\'); return false;"><i class="fas fa-copy"></i></div>'; + + var html = '<tr><td class="text-center" style="vertical-align:middle" width="40%"><b>' + alarm.chart + '</b><br/> <br/><embed src="' + badge_url + '" type="image/svg+xml" height="20"/><br/> <br/><span style="font-size: 18px">' + alarm.info + '</span>' + action_buttons + '</td>' + + '<td><table class="table">' + + ((typeof alarm.warn !== 'undefined') ? ('<tr><td width="10%" style="text-align:right">warning when</td><td><span style="font-family: monospace; color:#fe7d37; font-weight: bold;">' + alarm.warn + '</span></td></tr>') : '') + + ((typeof alarm.crit !== 'undefined') ? ('<tr><td width="10%" style="text-align:right">critical when</td><td><span style="font-family: monospace; color: #e05d44; font-weight: bold;">' + alarm.crit + '</span></td></tr>') : ''); + + if (full === true) { + var units = chart.units; + if (units === '%') { + units = '%'; + } + + html += ((typeof alarm.lookup_after !== 'undefined') ? ('<tr><td width="10%" style="text-align:right">db lookup</td><td>' + alarm_lookup_explain(alarm, chart) + '</td></tr>') : '') + + ((typeof alarm.calc !== 'undefined') ? ('<tr><td width="10%" style="text-align:right">calculation</td><td><span style="font-family: monospace;">' + alarm.calc + '</span></td></tr>') : '') + + ((chart.green !== null) ? ('<tr><td width="10%" style="text-align:right">green threshold</td><td><code>' + chart.green + ' ' + units + '</code></td></tr>') : '') + + ((chart.red !== null) ? ('<tr><td width="10%" style="text-align:right">red threshold</td><td><code>' + chart.red + ' ' + units + '</code></td></tr>') : ''); + } + + var delay = ''; + if ((alarm.delay_up_duration > 0 || alarm.delay_down_duration > 0) && alarm.delay_multiplier !== 0 && alarm.delay_max_duration > 0) { + if (alarm.delay_up_duration === alarm.delay_down_duration) { + delay += '<small><br/>hysteresis ' + NETDATA.seconds4human(alarm.delay_up_duration, { + space: ' ', + negative_suffix: '' + }); + } else { + delay = '<small><br/>hysteresis '; + if (alarm.delay_up_duration > 0) { + delay += 'on escalation <code>' + NETDATA.seconds4human(alarm.delay_up_duration, { + space: ' ', + negative_suffix: '' + }) + '</code>, '; + } + if (alarm.delay_down_duration > 0) { + delay += 'on recovery <code>' + NETDATA.seconds4human(alarm.delay_down_duration, { + space: ' ', + negative_suffix: '' + }) + '</code>, '; + } + } + if (alarm.delay_multiplier !== 1.0) { + delay += 'multiplied by <code>' + alarm.delay_multiplier.toString() + '</code>'; + delay += ', up to <code>' + NETDATA.seconds4human(alarm.delay_max_duration, { + space: ' ', + negative_suffix: '' + }) + '</code>'; + } + delay += '</small>'; + } + + html += '<tr><td width="10%" style="text-align:right">check every</td><td>' + NETDATA.seconds4human(alarm.update_every, { + space: ' ', + negative_suffix: '' + }) + '</td></tr>' + + ((has_alarm === true) ? ('<tr><td width="10%" style="text-align:right">execute</td><td><span style="font-family: monospace;">' + alarm.exec + '</span>' + delay + '</td></tr>') : '') + + '<tr><td width="10%" style="text-align:right">source</td><td><span style="font-family: monospace;">' + alarm.source + '</span></td></tr>' + + '</table></td></tr>'; + + return html; + } + + function alarm_family_show(id) { + var html = '<table class="table">'; + var family = options.alarm_families[id]; + var len = family.arr.length; + while (len--) { + var alarm = family.arr[len]; + html += alarm_to_html(alarm, true); + } + html += '</table>'; + + $('#alarm_all_' + id.toString()).html(html); + enableTooltipsAndPopovers(); + } + + // find the proper family of each alarm + var x, family, alarm; + var count_active = 0; + var count_all = 0; + var families = {}; + var families_sort = []; + for (x in data.alarms) { + if (!data.alarms.hasOwnProperty(x)) { + continue; + } + + alarm = data.alarms[x]; + family = alarm.family; + + // find the chart + var chart = options.data.charts[alarm.chart]; + if (typeof chart === 'undefined') { + chart = options.data.charts_by_name[alarm.chart]; + } + + // not found - this should never happen! + if (typeof chart === 'undefined') { + console.log('WARNING: alarm ' + x + ' is linked to chart ' + alarm.chart + ', which is not found in the list of chart got from the server.'); + chart = {priority: 9999999}; + } + else if (typeof chart.menu !== 'undefined' && typeof chart.submenu !== 'undefined') + // the family based on the chart + { + family = chart.menu + ' - ' + chart.submenu; + } + + if (typeof families[family] === 'undefined') { + families[family] = { + name: family, + arr: [], + priority: chart.priority + }; + + families_sort.push(families[family]); + } + + if (chart.priority < families[family].priority) { + families[family].priority = chart.priority; + } + + families[family].arr.unshift(alarm); + } + + // sort the families, like the dashboard menu does + var families_sorted = families_sort.sort(function (a, b) { + if (a.priority < b.priority) { + return -1; + } + if (a.priority > b.priority) { + return 1; + } + return naturalSortCompare(a.name, b.name); + }); + + var i = 0; + var fc = 0; + var len = families_sorted.length; + while (len--) { + family = families_sorted[i++].name; + var active_family_added = false; + var expanded = 'true'; + var collapsed = ''; + var cin = 'in'; + + if (fc !== 0) { + all += "</table></div></div></div>"; + expanded = 'false'; + collapsed = 'class="collapsed"'; + cin = ''; + } + + all += '<div class="panel panel-default"><div class="panel-heading" role="tab" id="alarm_all_heading_' + fc.toString() + '"><h4 class="panel-title"><a ' + collapsed + ' role="button" data-toggle="collapse" data-parent="#alarms_all_accordion" href="#alarm_all_' + fc.toString() + '" aria-expanded="' + expanded + '" aria-controls="alarm_all_' + fc.toString() + '">' + family.toString() + '</a></h4></div><div id="alarm_all_' + fc.toString() + '" class="panel-collapse collapse ' + cin + '" role="tabpanel" aria-labelledby="alarm_all_heading_' + fc.toString() + '" data-alarm-id="' + fc.toString() + '"><div class="panel-body" id="alarm_all_body_' + fc.toString() + '">'; + + options.alarm_families[fc] = families[family]; + + fc++; + + var arr = families[family].arr; + var c = arr.length; + while (c--) { + alarm = arr[c]; + if (alarm.status === 'WARNING' || alarm.status === 'CRITICAL') { + if (!active_family_added) { + active_family_added = true; + active += '<tr><th class="text-center" colspan="2"><h4>' + family + '</h4></th></tr>'; + } + count_active++; + active += alarm_to_html(alarm, true); + } + + count_all++; + } + } + active += "</table>"; + if (families_sorted.length > 0) { + all += "</div></div></div>"; + } + all += "</div>"; + + if (!count_active) { + active += '<div style="width:100%; height: 100px; text-align: center;"><span style="font-size: 50px;"><i class="fas fa-thumbs-up"></i></span><br/>Everything is normal. No raised alarms.</div>'; + } else { + active += footer; + } + + if (!count_all) { + all += "<h4>No alarms are running in this system.</h4>"; + } else { + all += footer; + } + + document.getElementById('alarms_active').innerHTML = active; + document.getElementById('alarms_all').innerHTML = all; + enableTooltipsAndPopovers(); + + if (families_sorted.length > 0) { + alarm_family_show(0); + } + + // register bootstrap events + var $accordion = $('#alarms_all_accordion'); + $accordion.on('show.bs.collapse', function (d) { + var target = $(d.target); + var id = $(target).data('alarm-id'); + alarm_family_show(id); + }); + $accordion.on('hidden.bs.collapse', function (d) { + var target = $(d.target); + var id = $(target).data('alarm-id'); + $('#alarm_all_' + id.toString()).html(''); + }); + + document.getElementById('alarms_log').innerHTML = '<h3>Alarm Log</h3><table id="alarms_log_table"></table>'; + + loadBootstrapTable(function () { + $('#alarms_log_table').bootstrapTable({ + url: NETDATA.alarms.server + '/api/v1/alarm_log?all', + cache: false, + pagination: true, + pageSize: 10, + showPaginationSwitch: false, + search: true, + searchTimeOut: 300, + searchAlign: 'left', + showColumns: true, + showExport: true, + exportDataType: 'basic', + exportOptions: { + fileName: 'netdata_alarm_log' + }, + rowStyle: function (row, index) { + void (index); + + switch (row.status) { + case 'CRITICAL': + return {classes: 'danger'}; + break; + case 'WARNING': + return {classes: 'warning'}; + break; + case 'UNDEFINED': + return {classes: 'info'}; + break; + case 'CLEAR': + return {classes: 'success'}; + break; + } + return {}; + }, + showFooter: false, + showHeader: true, + showRefresh: true, + showToggle: false, + sortable: true, + silentSort: false, + columns: [ + { + field: 'when', + title: 'Event Date', + valign: 'middle', + titleTooltip: 'The date and time the even took place', + formatter: function (value, row, index) { + void (row); + void (index); + return timestamp4human(value, ' '); + }, + align: 'center', + switchable: false, + sortable: true + }, + { + field: 'hostname', + title: 'Host', + valign: 'middle', + titleTooltip: 'The host that generated this event', + align: 'center', + visible: false, + sortable: true + }, + { + field: 'unique_id', + title: 'Unique ID', + titleTooltip: 'The host unique ID for this event', + formatter: function (value, row, index) { + void (row); + void (index); + return alarmid4human(value); + }, + align: 'center', + valign: 'middle', + visible: false, + sortable: true + }, + { + field: 'alarm_id', + title: 'Alarm ID', + titleTooltip: 'The ID of the alarm that generated this event', + formatter: function (value, row, index) { + void (row); + void (index); + return alarmid4human(value); + }, + align: 'center', + valign: 'middle', + visible: false, + sortable: true + }, + { + field: 'alarm_event_id', + title: 'Alarm Event ID', + titleTooltip: 'The incremental ID of this event for the given alarm', + formatter: function (value, row, index) { + void (row); + void (index); + return alarmid4human(value); + }, + align: 'center', + valign: 'middle', + visible: false, + sortable: true + }, + { + field: 'chart', + title: 'Chart', + titleTooltip: 'The chart the alarm is attached to', + align: 'center', + valign: 'middle', + switchable: false, + sortable: true + }, + { + field: 'family', + title: 'Family', + titleTooltip: 'The family of the chart the alarm is attached to', + align: 'center', + valign: 'middle', + visible: false, + sortable: true + }, + { + field: 'name', + title: 'Alarm', + titleTooltip: 'The alarm name that generated this event', + formatter: function (value, row, index) { + void (row); + void (index); + return value.toString().replace(/_/g, ' '); + }, + align: 'center', + valign: 'middle', + switchable: false, + sortable: true + }, + { + field: 'value_string', + title: 'Friendly Value', + titleTooltip: 'The value of the alarm, that triggered this event', + align: 'right', + valign: 'middle', + sortable: true + }, + { + field: 'old_value_string', + title: 'Friendly Old Value', + titleTooltip: 'The value of the alarm, just before this event', + align: 'right', + valign: 'middle', + visible: false, + sortable: true + }, + { + field: 'old_value', + title: 'Old Value', + titleTooltip: 'The value of the alarm, just before this event', + formatter: function (value, row, index) { + void (row); + void (index); + return ((value !== null) ? Math.round(value * 100) / 100 : 'NaN').toString(); + }, + align: 'center', + valign: 'middle', + visible: false, + sortable: true + }, + { + field: 'value', + title: 'Value', + titleTooltip: 'The value of the alarm, that triggered this event', + formatter: function (value, row, index) { + void (row); + void (index); + return ((value !== null) ? Math.round(value * 100) / 100 : 'NaN').toString(); + }, + align: 'right', + valign: 'middle', + visible: false, + sortable: true + }, + { + field: 'units', + title: 'Units', + titleTooltip: 'The units of the value of the alarm', + align: 'left', + valign: 'middle', + visible: false, + sortable: true + }, + { + field: 'old_status', + title: 'Old Status', + titleTooltip: 'The status of the alarm, just before this event', + align: 'center', + valign: 'middle', + visible: false, + sortable: true + }, + { + field: 'status', + title: 'Status', + titleTooltip: 'The status of the alarm, that was set due to this event', + align: 'center', + valign: 'middle', + switchable: false, + sortable: true + }, + { + field: 'duration', + title: 'Last Duration', + titleTooltip: 'The duration the alarm was at its previous state, just before this event', + formatter: function (value, row, index) { + void (row); + void (index); + return NETDATA.seconds4human(value, {negative_suffix: '', space: ' ', now: 'no time'}); + }, + align: 'center', + valign: 'middle', + visible: false, + sortable: true + }, + { + field: 'non_clear_duration', + title: 'Raised Duration', + titleTooltip: 'The duration the alarm was raised, just before this event', + formatter: function (value, row, index) { + void (row); + void (index); + return NETDATA.seconds4human(value, {negative_suffix: '', space: ' ', now: 'no time'}); + }, + align: 'center', + valign: 'middle', + visible: false, + sortable: true + }, + { + field: 'recipient', + title: 'Recipient', + titleTooltip: 'The recipient of this event', + align: 'center', + valign: 'middle', + visible: false, + sortable: true + }, + { + field: 'processed', + title: 'Processed Status', + titleTooltip: 'True when this event is processed', + formatter: function (value, row, index) { + void (row); + void (index); + + if (value === true) { + return 'DONE'; + } else { + return 'PENDING'; + } + }, + align: 'center', + valign: 'middle', + visible: false, + sortable: true + }, + { + field: 'updated', + title: 'Updated Status', + titleTooltip: 'True when this event has been updated by another event', + formatter: function (value, row, index) { + void (row); + void (index); + + if (value === true) { + return 'UPDATED'; + } else { + return 'CURRENT'; + } + }, + align: 'center', + valign: 'middle', + visible: false, + sortable: true + }, + { + field: 'updated_by_id', + title: 'Updated By ID', + titleTooltip: 'The unique ID of the event that obsoleted this one', + formatter: function (value, row, index) { + void (row); + void (index); + return alarmid4human(value); + }, + align: 'center', + valign: 'middle', + visible: false, + sortable: true + }, + { + field: 'updates_id', + title: 'Updates ID', + titleTooltip: 'The unique ID of the event obsoleted because of this event', + formatter: function (value, row, index) { + void (row); + void (index); + return alarmid4human(value); + }, + align: 'center', + valign: 'middle', + visible: false, + sortable: true + }, + { + field: 'exec', + title: 'Script', + titleTooltip: 'The script to handle the event notification', + align: 'center', + valign: 'middle', + visible: false, + sortable: true + }, + { + field: 'exec_run', + title: 'Script Run At', + titleTooltip: 'The date and time the script has been ran', + formatter: function (value, row, index) { + void (row); + void (index); + return timestamp4human(value, ' '); + }, + align: 'center', + valign: 'middle', + visible: false, + sortable: true + }, + { + field: 'exec_code', + title: 'Script Return Value', + titleTooltip: 'The return code of the script', + formatter: function (value, row, index) { + void (row); + void (index); + + if (value === 0) { + return 'OK (returned 0)'; + } else { + return 'FAILED (with code ' + value.toString() + ')'; + } + }, + align: 'center', + valign: 'middle', + visible: false, + sortable: true + }, + { + field: 'delay', + title: 'Script Delay', + titleTooltip: 'The hysteresis of the notification', + formatter: function (value, row, index) { + void (row); + void (index); + + return NETDATA.seconds4human(value, {negative_suffix: '', space: ' ', now: 'no time'}); + }, + align: 'center', + valign: 'middle', + visible: false, + sortable: true + }, + { + field: 'delay_up_to_timestamp', + title: 'Script Delay Run At', + titleTooltip: 'The date and time the script should be run, after hysteresis', + formatter: function (value, row, index) { + void (row); + void (index); + return timestamp4human(value, ' '); + }, + align: 'center', + valign: 'middle', + visible: false, + sortable: true + }, + { + field: 'info', + title: 'Description', + titleTooltip: 'A short description of the alarm', + align: 'center', + valign: 'middle', + visible: false, + sortable: true + }, + { + field: 'source', + title: 'Alarm Source', + titleTooltip: 'The source of configuration of the alarm', + align: 'center', + valign: 'middle', + visible: false, + sortable: true + } + ] + }); + // console.log($('#alarms_log_table').bootstrapTable('getOptions')); + }); + }); +} + +function alarmsCallback(data) { + var count = 0, x; + for (x in data.alarms) { + if (!data.alarms.hasOwnProperty(x)) { + continue; + } + + var alarm = data.alarms[x]; + if (alarm.status === 'WARNING' || alarm.status === 'CRITICAL') { + count++; + } + } + + if (count > 0) { + document.getElementById('alarms_count_badge').innerHTML = count.toString(); + } else { + document.getElementById('alarms_count_badge').innerHTML = ''; + } +} + +function initializeDynamicDashboardWithData(data) { + if (data !== null) { + options.hostname = data.hostname; + options.data = data; + options.version = data.version; + netdataDashboard.os = data.os; + + if (typeof data.hosts !== 'undefined') { + options.hosts = data.hosts; + } + + // update the dashboard hostname + document.getElementById('hostname').innerHTML = options.hostname + ((netdataSnapshotData !== null) ? ' (snap)' : '').toString(); + document.getElementById('hostname').href = NETDATA.serverDefault; + document.getElementById('netdataVersion').innerHTML = options.version; + + if (netdataSnapshotData !== null) { + $('#alarmsButton').hide(); + $('#updateButton').hide(); + // $('#loadButton').hide(); + $('#saveButton').hide(); + $('#printButton').hide(); + } + + // update the dashboard title + document.title = options.hostname + ' netdata dashboard'; + + // close the splash screen + $("#loadOverlay").css("display", "none"); + + // create a chart_by_name index + data.charts_by_name = {}; + var charts = data.charts; + var x; + for (x in charts) { + if (!charts.hasOwnProperty(x)) { + continue; + } + + var chart = charts[x]; + data.charts_by_name[chart.name] = chart; + } + + // render all charts + renderChartsAndMenu(data); + } +} + +// an object to keep initilization configuration +// needed due to the async nature of the XSS modal +var initializeConfig = { + url: null, + custom_info: true, +}; + +function loadCustomDashboardInfo(url, callback) { + loadJs(url, function () { + $.extend(true, netdataDashboard, customDashboard); + callback(); + }); +} + +function initializeChartsAndCustomInfo() { + NETDATA.alarms.callback = alarmsCallback; + + // download all the charts the server knows + NETDATA.chartRegistry.downloadAll(initializeConfig.url, function (data) { + if (data !== null) { + if (initializeConfig.custom_info === true && typeof data.custom_info !== 'undefined' && data.custom_info !== "" && netdataSnapshotData === null) { + //console.log('loading custom dashboard decorations from server ' + initializeConfig.url); + loadCustomDashboardInfo(NETDATA.serverDefault + data.custom_info, function () { + initializeDynamicDashboardWithData(data); + }); + } else { + //console.log('not loading custom dashboard decorations from server ' + initializeConfig.url); + initializeDynamicDashboardWithData(data); + } + } + }); +} + +function xssModalDisableXss() { + //console.log('disabling xss checks'); + NETDATA.xss.enabled = false; + NETDATA.xss.enabled_for_data = false; + initializeConfig.custom_info = true; + initializeChartsAndCustomInfo(); + return false; +} + +function xssModalKeepXss() { + //console.log('keeping xss checks'); + NETDATA.xss.enabled = true; + NETDATA.xss.enabled_for_data = true; + initializeConfig.custom_info = false; + initializeChartsAndCustomInfo(); + return false; +} + +function initializeDynamicDashboard(netdata_url) { + if (typeof netdata_url === 'undefined' || netdata_url === null) { + netdata_url = NETDATA.serverDefault; + } + + initializeConfig.url = netdata_url; + + // initialize clickable alarms + NETDATA.alarms.chart_div_offset = -50; + NETDATA.alarms.chart_div_id_prefix = 'chart_'; + NETDATA.alarms.chart_div_animation_duration = 0; + + NETDATA.pause(function () { + if (typeof netdataCheckXSS !== 'undefined' && netdataCheckXSS === true) { + //$("#loadOverlay").css("display","none"); + document.getElementById('netdataXssModalServer').innerText = initializeConfig.url; + $('#xssModal').modal('show'); + } else { + initializeChartsAndCustomInfo(); + } + }); +} + +// ---------------------------------------------------------------------------- + +function versionLog(msg) { + document.getElementById('versionCheckLog').innerHTML = msg; +} + +function getNetdataCommitIdFromVersion() { + var s = options.version.split('-'); + + if (s.length !== 3) { + return null; + } + if (s[2][0] === 'g') { + var v = s[2].split('_')[0].substring(1, 8); + if (v.length === 7) { + versionLog('Installed git commit id of netdata is ' + v); + document.getElementById('netdataCommitId').innerHTML = v; + return v; + } + } + return null; +} + +function getNetdataCommitId(force, callback) { + versionLog('Downloading installed git commit id from netdata...'); + + $.ajax({ + url: 'version.txt', + async: true, + cache: false, + xhrFields: {withCredentials: true} // required for the cookie + }) + .done(function (data) { + data = data.replace(/(\r\n|\n|\r| |\t)/gm, ""); + + var c = getNetdataCommitIdFromVersion(); + if (c !== null && data.length === 40 && data.substring(0, 7) !== c) { + versionLog('Installed files commit id and internal netdata git commit id do not match'); + data = c; + } + + if (data.length >= 7) { + versionLog('Installed git commit id of netdata is ' + data); + document.getElementById('netdataCommitId').innerHTML = data.substring(0, 7); + callback(data); + } + }) + .fail(function () { + versionLog('Failed to download installed git commit id from netdata!'); + + if (force === true) { + var c = getNetdataCommitIdFromVersion(); + if (c === null) { + versionLog('Cannot find the git commit id of netdata.'); + } + callback(c); + } else { + callback(null); + } + }); +} + +function getGithubLatestCommit(callback) { + versionLog('Downloading latest git commit id info from github...'); + + $.ajax({ + url: 'https://api.github.com/repos/netdata/netdata/commits', + async: true, + cache: false + }) + .done(function (data) { + versionLog('Latest git commit id from github is ' + data[0].sha); + callback(data[0].sha); + }) + .fail(function () { + versionLog('Failed to download installed git commit id from github!'); + callback(null); + }); +} + +function checkForUpdate(force, callback) { + getNetdataCommitId(force, function (sha1) { + if (sha1 === null) { + callback(null, null); + } + + getGithubLatestCommit(function (sha2) { + callback(sha1, sha2); + }); + }); + + return null; +} + +function notifyForUpdate(force) { + versionLog('<p>checking for updates...</p>'); + + var now = Date.now(); + + if (typeof force === 'undefined' || force !== true) { + var last = loadLocalStorage('last_update_check'); + + if (typeof last === 'string') { + last = parseInt(last); + } else { + last = 0; + } + + if (now - last < 3600000 * 8) { + // no need to check it - too soon + return; + } + } + + checkForUpdate(force, function (sha1, sha2) { + var save = false; + + if (sha1 === null) { + save = false; + versionLog('<p><big>Failed to get your netdata git commit id!</big></p><p>You can always get the latest netdata from <a href="https://github.com/netdata/netdata" target="_blank">its github page</a>.</p>'); + } else if (sha2 === null) { + save = false; + versionLog('<p><big>Failed to get the latest git commit id from github.</big></p><p>You can always get the latest netdata from <a href="https://github.com/netdata/netdata" target="_blank">its github page</a>.</p>'); + } else if (sha1 === sha2) { + save = true; + versionLog('<p><big>You already have the latest netdata!</big></p><p>No update yet?<br/>Probably, we need some motivation to keep going on!</p><p>If you haven\'t already, <a href="https://github.com/netdata/netdata" target="_blank">give netdata a <b><i class="fas fa-star"></i></b> at its github page</a>.</p>'); + } else { + save = true; + var compare = 'https://github.com/netdata/netdata/compare/' + sha1.toString() + '...' + sha2.toString(); + + versionLog('<p><big><strong>New version of netdata available!</strong></big></p><p>Latest commit: <b><code>' + sha2.substring(0, 7).toString() + '</code></b></p><p><a href="' + compare + '" target="_blank">Click here for the changes log</a> since your installed version, and<br/><a href="https://github.com/netdata/netdata/tree/master/installer/UPDATE.md" target="_blank">click here for directions on updating</a> your netdata installation.</p><p>We suggest to review the changes log for new features you may be interested, or important bug fixes you may need.<br/>Keeping your netdata updated, is generally a good idea.</p>'); + + document.getElementById('update_badge').innerHTML = '!'; + } + + if (save) { + saveLocalStorage('last_update_check', now.toString()); + } + }); +} + +// ---------------------------------------------------------------------------- +// printing dashboards + +function showPageFooter() { + document.getElementById('footer').style.display = 'block'; +} + +function printPreflight() { + var url = document.location.origin.toString() + document.location.pathname.toString() + document.location.search.toString() + urlOptions.genHash() + ';mode=print'; + var width = 990; + var height = screen.height * 90 / 100; + //console.log(url); + //console.log(document.location); + window.open(url, '', 'width=' + width.toString() + ',height=' + height.toString() + ',menubar=no,toolbar=no,personalbar=no,location=no,resizable=no,scrollbars=yes,status=no,chrome=yes,centerscreen=yes,attention=yes,dialog=yes'); + $('#printPreflightModal').modal('hide'); +} + +function printPage() { + var print_is_rendering = true; + + $('#printModal').on('hide.bs.modal', function (e) { + if (print_is_rendering === true) { + e.preventDefault(); + return false; + } + + return true; + }); + + $('#printModal').on('show.bs.modal', function () { + var print_options = { + stop_updates_when_focus_is_lost: false, + update_only_visible: false, + sync_selection: false, + eliminate_zero_dimensions: false, + pan_and_zoom_data_padding: false, + show_help: false, + legend_toolbox: false, + resize_charts: false, + pixels_per_point: 1 + }; + + var x; + for (x in print_options) { + if (print_options.hasOwnProperty(x)) { + NETDATA.options.current[x] = print_options[x]; + } + } + + NETDATA.parseDom(); + showPageFooter(); + + NETDATA.globalSelectionSync.stop(); + NETDATA.globalPanAndZoom.setMaster(NETDATA.options.targets[0], urlOptions.after, urlOptions.before); + // NETDATA.onresize(); + + var el = document.getElementById('printModalProgressBar'); + var eltxt = document.getElementById('printModalProgressBarText'); + + function update_chart(idx) { + var state = NETDATA.options.targets[--idx]; + + var pcent = (NETDATA.options.targets.length - idx) * 100 / NETDATA.options.targets.length; + $(el).css('width', pcent + '%').attr('aria-valuenow', pcent); + eltxt.innerText = Math.round(pcent).toString() + '%, ' + state.id; + + setTimeout(function () { + state.updateChart(function () { + NETDATA.options.targets[idx].resizeForPrint(); + + if (idx > 0) { + update_chart(idx); + } else { + print_is_rendering = false; + $('#printModal').modal('hide'); + window.print(); + window.close(); + } + }) + }, 0); + } + + print_is_rendering = true; + update_chart(NETDATA.options.targets.length); + }); + + $('#printModal').modal('show'); +} + +// -------------------------------------------------------------------- + +function jsonStringifyFn(obj) { + return JSON.stringify(obj, function (key, value) { + return (typeof value === 'function') ? value.toString() : value; + }); +} + +function jsonParseFn(str) { + return JSON.parse(str, function (key, value) { + if (typeof value != 'string') { + return value; + } + return (value.substring(0, 8) == 'function') ? eval('(' + value + ')') : value; + }); +} + +// -------------------------------------------------------------------- + +var snapshotOptions = { + bytes_per_chart: 2048, + compressionDefault: 'pako.deflate.base64', + + compressions: { + 'none': { + bytes_per_point_memory: 5.2, + bytes_per_point_disk: 5.6, + + compress: function (s) { + return s; + }, + + compressed_length: function (s) { + return s.length; + }, + + uncompress: function (s) { + return s; + } + }, + + 'pako.deflate.base64': { + bytes_per_point_memory: 1.8, + bytes_per_point_disk: 1.9, + + compress: function (s) { + return btoa(pako.deflate(s, {to: 'string'})); + }, + + compressed_length: function (s) { + return s.length; + }, + + uncompress: function (s) { + return pako.inflate(atob(s), {to: 'string'}); + } + }, + + 'pako.deflate': { + bytes_per_point_memory: 1.4, + bytes_per_point_disk: 3.2, + + compress: function (s) { + return pako.deflate(s, {to: 'string'}); + }, + + compressed_length: function (s) { + return s.length; + }, + + uncompress: function (s) { + return pako.inflate(s, {to: 'string'}); + } + }, + + 'lzstring.utf16': { + bytes_per_point_memory: 1.7, + bytes_per_point_disk: 2.6, + + compress: function (s) { + return LZString.compressToUTF16(s); + }, + + compressed_length: function (s) { + return s.length * 2; + }, + + uncompress: function (s) { + return LZString.decompressFromUTF16(s); + } + }, + + 'lzstring.base64': { + bytes_per_point_memory: 2.1, + bytes_per_point_disk: 2.3, + + compress: function (s) { + return LZString.compressToBase64(s); + }, + + compressed_length: function (s) { + return s.length; + }, + + uncompress: function (s) { + return LZString.decompressFromBase64(s); + } + }, + + 'lzstring.uri': { + bytes_per_point_memory: 2.1, + bytes_per_point_disk: 2.3, + + compress: function (s) { + return LZString.compressToEncodedURIComponent(s); + }, + + compressed_length: function (s) { + return s.length; + }, + + uncompress: function (s) { + return LZString.decompressFromEncodedURIComponent(s); + } + } + } +}; + +// -------------------------------------------------------------------- +// loading snapshots + +function loadSnapshotModalLog(priority, msg) { + document.getElementById('loadSnapshotStatus').className = "alert alert-" + priority; + document.getElementById('loadSnapshotStatus').innerHTML = msg; +} + +var tmpSnapshotData = null; + +function loadSnapshot() { + $('#loadSnapshotImport').addClass('disabled'); + + if (tmpSnapshotData === null) { + loadSnapshotPreflightEmpty(); + loadSnapshotModalLog('danger', 'no data have been loaded'); + return; + } + + loadPako(function () { + loadLzString(function () { + loadSnapshotModalLog('info', 'Please wait, activating snapshot...'); + $('#loadSnapshotModal').modal('hide'); + + netdataShowAlarms = false; + netdataRegistry = false; + netdataServer = tmpSnapshotData.server; + NETDATA.serverDefault = netdataServer; + + document.getElementById('charts_div').innerHTML = ''; + document.getElementById('sidebar').innerHTML = ''; + NETDATA.globalReset(); + + if (typeof tmpSnapshotData.hash !== 'undefined') { + urlOptions.hash = tmpSnapshotData.hash; + } else { + urlOptions.hash = '#'; + } + + if (typeof tmpSnapshotData.info !== 'undefined') { + var info = jsonParseFn(tmpSnapshotData.info); + if (typeof info.menu !== 'undefined') { + netdataDashboard.menu = info.menu; + } + + if (typeof info.submenu !== 'undefined') { + netdataDashboard.submenu = info.submenu; + } + + if (typeof info.context !== 'undefined') { + netdataDashboard.context = info.context; + } + } + + if (typeof tmpSnapshotData.compression !== 'string') { + tmpSnapshotData.compression = 'none'; + } + + if (typeof snapshotOptions.compressions[tmpSnapshotData.compression] === 'undefined') { + alert('unknown compression method: ' + tmpSnapshotData.compression); + tmpSnapshotData.compression = 'none'; + } + + tmpSnapshotData.uncompress = snapshotOptions.compressions[tmpSnapshotData.compression].uncompress; + netdataSnapshotData = tmpSnapshotData; + + urlOptions.after = tmpSnapshotData.after_ms; + urlOptions.before = tmpSnapshotData.before_ms; + + if (typeof tmpSnapshotData.highlight_after_ms !== 'undefined' + && tmpSnapshotData.highlight_after_ms !== null + && tmpSnapshotData.highlight_after_ms > 0 + && typeof tmpSnapshotData.highlight_before_ms !== 'undefined' + && tmpSnapshotData.highlight_before_ms !== null + && tmpSnapshotData.highlight_before_ms > 0 + ) { + urlOptions.highlight_after = tmpSnapshotData.highlight_after_ms; + urlOptions.highlight_before = tmpSnapshotData.highlight_before_ms; + urlOptions.highlight = true; + } else { + urlOptions.highlight_after = 0; + urlOptions.highlight_before = 0; + urlOptions.highlight = false; + } + + netdataCheckXSS = false; // disable the modal - this does not affect XSS checks, since dashboard.js is already loaded + NETDATA.xss.enabled = true; // we should not do any remote requests, but if we do, check them + NETDATA.xss.enabled_for_data = true; // check also snapshot data - that have been excluded from the initial check, due to compression + loadSnapshotPreflightEmpty(); + initializeDynamicDashboard(); + }); + }); +}; + +function loadSnapshotPreflightFile(file) { + var filename = NETDATA.xss.string(file.name); + var fr = new FileReader(); + fr.onload = function (e) { + document.getElementById('loadSnapshotFilename').innerHTML = filename; + var result = null; + try { + result = NETDATA.xss.checkAlways('snapshot', JSON.parse(e.target.result), /^(snapshot\.info|snapshot\.data)$/); + + //console.log(result); + var date_after = new Date(result.after_ms); + var date_before = new Date(result.before_ms); + + if (typeof result.charts_ok === 'undefined') { + result.charts_ok = 'unknown'; + } + + if (typeof result.charts_failed === 'undefined') { + result.charts_failed = 0; + } + + if (typeof result.compression === 'undefined') { + result.compression = 'none'; + } + + if (typeof result.data_size === 'undefined') { + result.data_size = 0; + } + + document.getElementById('loadSnapshotFilename').innerHTML = '<code>' + filename + '</code>'; + document.getElementById('loadSnapshotHostname').innerHTML = '<b>' + result.hostname + '</b>, netdata version: <b>' + result.netdata_version.toString() + '</b>'; + document.getElementById('loadSnapshotURL').innerHTML = result.url; + document.getElementById('loadSnapshotCharts').innerHTML = result.charts.charts_count.toString() + ' charts, ' + result.charts.dimensions_count.toString() + ' dimensions, ' + result.data_points.toString() + ' points per dimension, ' + Math.round(result.duration_ms / result.data_points).toString() + ' ms per point'; + document.getElementById('loadSnapshotInfo').innerHTML = 'version: <b>' + result.snapshot_version.toString() + '</b>, includes <b>' + result.charts_ok.toString() + '</b> unique chart data queries ' + ((result.charts_failed > 0) ? ('<b>' + result.charts_failed.toString() + '</b> failed') : '').toString() + ', compressed with <code>' + result.compression.toString() + '</code>, data size ' + (Math.round(result.data_size * 100 / 1024 / 1024) / 100).toString() + ' MB'; + document.getElementById('loadSnapshotTimeRange').innerHTML = '<b>' + NETDATA.dateTime.localeDateString(date_after) + ' ' + NETDATA.dateTime.localeTimeString(date_after) + '</b> to <b>' + NETDATA.dateTime.localeDateString(date_before) + ' ' + NETDATA.dateTime.localeTimeString(date_before) + '</b>'; + document.getElementById('loadSnapshotComments').innerHTML = ((result.comments) ? result.comments : '').toString(); + loadSnapshotModalLog('success', 'File loaded, click <b>Import</b> to render it!'); + $('#loadSnapshotImport').removeClass('disabled'); + + tmpSnapshotData = result; + } + catch (e) { + console.log(e); + document.getElementById('loadSnapshotStatus').className = "alert alert-danger"; + document.getElementById('loadSnapshotStatus').innerHTML = "Failed to parse this file!"; + $('#loadSnapshotImport').addClass('disabled'); + } + } + + //console.log(file); + fr.readAsText(file); +}; + +function loadSnapshotPreflightEmpty() { + document.getElementById('loadSnapshotFilename').innerHTML = ''; + document.getElementById('loadSnapshotHostname').innerHTML = ''; + document.getElementById('loadSnapshotURL').innerHTML = ''; + document.getElementById('loadSnapshotCharts').innerHTML = ''; + document.getElementById('loadSnapshotInfo').innerHTML = ''; + document.getElementById('loadSnapshotTimeRange').innerHTML = ''; + document.getElementById('loadSnapshotComments').innerHTML = ''; + loadSnapshotModalLog('success', 'Browse for a snapshot file (or drag it and drop it here), then click <b>Import</b> to render it.'); + $('#loadSnapshotImport').addClass('disabled'); +}; + +var loadSnapshotDragAndDropInitialized = false; + +function loadSnapshotDragAndDropSetup() { + if (loadSnapshotDragAndDropInitialized === false) { + loadSnapshotDragAndDropInitialized = true; + $('#loadSnapshotDragAndDrop') + .on('drag dragstart dragend dragover dragenter dragleave drop', function (e) { + e.preventDefault(); + e.stopPropagation(); + }) + .on('drop', function (e) { + if (e.originalEvent.dataTransfer.files.length) { + loadSnapshotPreflightFile(e.originalEvent.dataTransfer.files.item(0)); + } else { + loadSnapshotPreflightEmpty(); + loadSnapshotModalLog('danger', 'No file selected'); + } + }); + } +}; + +function loadSnapshotPreflight() { + var files = document.getElementById('loadSnapshotSelectFiles').files; + if (files.length <= 0) { + loadSnapshotPreflightEmpty(); + loadSnapshotModalLog('danger', 'No file selected'); + return; + } + + loadSnapshotModalLog('info', 'Loading file...'); + + loadSnapshotPreflightFile(files.item(0)); +} + +// -------------------------------------------------------------------- +// saving snapshots + +var saveSnapshotStop = false; + +function saveSnapshotCancel() { + saveSnapshotStop = true; +} + +var saveSnapshotModalInitialized = false; + +function saveSnapshotModalSetup() { + if (saveSnapshotModalInitialized === false) { + saveSnapshotModalInitialized = true; + $('#saveSnapshotModal') + .on('hide.bs.modal', saveSnapshotCancel) + .on('show.bs.modal', saveSnapshotModalInit) + .on('shown.bs.modal', function () { + $('#saveSnapshotResolutionSlider').find(".slider-handle:first").attr("tabindex", 1); + document.getElementById('saveSnapshotComments').focus(); + }); + } +}; + +function saveSnapshotModalLog(priority, msg) { + document.getElementById('saveSnapshotStatus').className = "alert alert-" + priority; + document.getElementById('saveSnapshotStatus').innerHTML = msg; +} + +function saveSnapshotModalShowExpectedSize() { + var points = Math.round(saveSnapshotViewDuration / saveSnapshotSelectedSecondsPerPoint); + var priority = 'info'; + var msg = 'A moderate snapshot.'; + + var sizemb = Math.round( + (options.data.charts_count * snapshotOptions.bytes_per_chart + + options.data.dimensions_count * points * snapshotOptions.compressions[saveSnapshotCompression].bytes_per_point_disk) + * 10 / 1024 / 1024) / 10; + + var memmb = Math.round( + (options.data.charts_count * snapshotOptions.bytes_per_chart + + options.data.dimensions_count * points * snapshotOptions.compressions[saveSnapshotCompression].bytes_per_point_memory) + * 10 / 1024 / 1024) / 10; + + if (sizemb < 10) { + priority = 'success'; + msg = 'A nice small snapshot!'; + } + if (sizemb > 50) { + priority = 'warning'; + msg = 'Will stress your browser...'; + } + if (sizemb > 100) { + priority = 'danger'; + msg = 'Hm... good luck...'; + } + + saveSnapshotModalLog(priority, 'The snapshot will have ' + points.toString() + ' points per dimension. Expected size on disk ' + sizemb + ' MB, at browser memory ' + memmb + ' MB.<br/>' + msg); +} + +var saveSnapshotCompression = snapshotOptions.compressionDefault; + +function saveSnapshotSetCompression(name) { + saveSnapshotCompression = name; + document.getElementById('saveSnapshotCompressionName').innerHTML = saveSnapshotCompression; + saveSnapshotModalShowExpectedSize(); +} + +var saveSnapshotSlider = null; +var saveSnapshotSelectedSecondsPerPoint = 1; +var saveSnapshotViewDuration = 1; + +function saveSnapshotModalInit() { + $('#saveSnapshotModalProgressSection').hide(); + $('#saveSnapshotResolutionRadio').show(); + saveSnapshotModalLog('info', 'Select resolution and click <b>Save</b>'); + $('#saveSnapshotExport').removeClass('disabled'); + + loadBootstrapSlider(function () { + saveSnapshotViewDuration = options.duration; + var start_ms = Math.round(Date.now() - saveSnapshotViewDuration * 1000); + + if (NETDATA.globalPanAndZoom.isActive() === true) { + saveSnapshotViewDuration = Math.round((NETDATA.globalPanAndZoom.force_before_ms - NETDATA.globalPanAndZoom.force_after_ms) / 1000); + start_ms = NETDATA.globalPanAndZoom.force_after_ms; + } + + var start_date = new Date(start_ms); + var yyyymmddhhssmm = start_date.getFullYear() + NETDATA.zeropad(start_date.getMonth() + 1) + NETDATA.zeropad(start_date.getDate()) + '-' + NETDATA.zeropad(start_date.getHours()) + NETDATA.zeropad(start_date.getMinutes()) + NETDATA.zeropad(start_date.getSeconds()); + + document.getElementById('saveSnapshotFilename').value = 'netdata-' + options.hostname.toString() + '-' + yyyymmddhhssmm.toString() + '-' + saveSnapshotViewDuration.toString() + '.snapshot'; + saveSnapshotSetCompression(saveSnapshotCompression); + + var min = options.update_every; + var max = Math.round(saveSnapshotViewDuration / 100); + + if (NETDATA.globalPanAndZoom.isActive() === false) { + max = Math.round(saveSnapshotViewDuration / 50); + } + + var view = Math.round(saveSnapshotViewDuration / Math.round($(document.getElementById('charts_div')).width() / 2)); + + // console.log('view duration: ' + saveSnapshotViewDuration + ', min: ' + min + ', max: ' + max + ', view: ' + view); + + if (max < 10) { + max = 10; + } + if (max < min) { + max = min; + } + if (view < min) { + view = min; + } + if (view > max) { + view = max; + } + + if (saveSnapshotSlider !== null) { + saveSnapshotSlider.destroy(); + } + + saveSnapshotSlider = new Slider('#saveSnapshotResolutionSlider', { + ticks: [min, view, max], + min: min, + max: max, + step: options.update_every, + value: view, + scale: (max > 100) ? 'logarithmic' : 'linear', + tooltip: 'always', + formatter: function (value) { + if (value < 1) { + value = 1; + } + + if (value < options.data.update_every) { + value = options.data.update_every; + } + + saveSnapshotSelectedSecondsPerPoint = value; + saveSnapshotModalShowExpectedSize(); + + var seconds = ' seconds '; + if (value === 1) { + seconds = ' second '; + } + + return value + seconds + 'per point' + ((value === options.data.update_every) ? ', server default' : '').toString(); + } + }); + }); +} + +function saveSnapshot() { + loadPako(function () { + loadLzString(function () { + saveSnapshotStop = false; + $('#saveSnapshotModalProgressSection').show(); + $('#saveSnapshotResolutionRadio').hide(); + $('#saveSnapshotExport').addClass('disabled'); + + var filename = document.getElementById('saveSnapshotFilename').value; + // console.log(filename); + saveSnapshotModalLog('info', 'Generating snapshot as <code>' + filename.toString() + '</code>'); + + var save_options = { + stop_updates_when_focus_is_lost: false, + update_only_visible: false, + sync_selection: false, + eliminate_zero_dimensions: true, + pan_and_zoom_data_padding: false, + show_help: false, + legend_toolbox: false, + resize_charts: false, + pixels_per_point: 1 + }; + var backedup_options = {}; + + var x; + for (x in save_options) { + if (save_options.hasOwnProperty(x)) { + backedup_options[x] = NETDATA.options.current[x]; + NETDATA.options.current[x] = save_options[x]; + } + } + + var el = document.getElementById('saveSnapshotModalProgressBar'); + var eltxt = document.getElementById('saveSnapshotModalProgressBarText'); + + options.data.charts_by_name = null; + + var saveData = { + hostname: options.hostname, + server: NETDATA.serverDefault, + netdata_version: options.data.version, + snapshot_version: 1, + after_ms: Date.now() - options.duration * 1000, + before_ms: Date.now(), + highlight_after_ms: urlOptions.highlight_after, + highlight_before_ms: urlOptions.highlight_before, + duration_ms: options.duration * 1000, + update_every_ms: options.update_every * 1000, + data_points: 0, + url: ((urlOptions.server !== null) ? urlOptions.server : document.location.origin.toString() + document.location.pathname.toString() + document.location.search.toString()).toString(), + comments: document.getElementById('saveSnapshotComments').value.toString(), + hash: urlOptions.hash, + charts: options.data, + info: jsonStringifyFn({ + menu: netdataDashboard.menu, + submenu: netdataDashboard.submenu, + context: netdataDashboard.context + }), + charts_ok: 0, + charts_failed: 0, + compression: saveSnapshotCompression, + data_size: 0, + data: {} + }; + + if (typeof snapshotOptions.compressions[saveData.compression] === 'undefined') { + alert('unknown compression method: ' + saveData.compression); + saveData.compression = 'none'; + } + + var compress = snapshotOptions.compressions[saveData.compression].compress; + var compressed_length = snapshotOptions.compressions[saveData.compression].compressed_length; + + function pack_api1_v1_chart_data(state) { + if (state.library_name === null || state.data === null) { + return; + } + + var data = state.data; + state.data = null; + data.state = null; + var str = JSON.stringify(data); + + if (typeof str === 'string') { + var cstr = compress(str); + saveData.data[state.chartDataUniqueID()] = cstr; + return compressed_length(cstr); + } else { + return 0; + } + } + + var clearPanAndZoom = false; + if (NETDATA.globalPanAndZoom.isActive() === false) { + NETDATA.globalPanAndZoom.setMaster(NETDATA.options.targets[0], saveData.after_ms, saveData.before_ms); + clearPanAndZoom = true; + } + + saveData.after_ms = NETDATA.globalPanAndZoom.force_after_ms; + saveData.before_ms = NETDATA.globalPanAndZoom.force_before_ms; + saveData.duration_ms = saveData.before_ms - saveData.after_ms; + saveData.data_points = Math.round((saveData.before_ms - saveData.after_ms) / (saveSnapshotSelectedSecondsPerPoint * 1000)); + saveSnapshotModalLog('info', 'Generating snapshot with ' + saveData.data_points.toString() + ' data points per dimension...'); + + var charts_count = 0; + var charts_ok = 0; + var charts_failed = 0; + + function saveSnapshotRestore() { + $('#saveSnapshotModal').modal('hide'); + + // restore the options + var x; + for (x in backedup_options) { + if (backedup_options.hasOwnProperty(x)) { + NETDATA.options.current[x] = backedup_options[x]; + } + } + + $(el).css('width', '0%').attr('aria-valuenow', 0); + eltxt.innerText = '0%'; + + if (clearPanAndZoom) { + NETDATA.globalPanAndZoom.clearMaster(); + } + + NETDATA.options.force_data_points = 0; + NETDATA.options.fake_chart_rendering = false; + NETDATA.onscroll_updater_enabled = true; + NETDATA.onresize(); + NETDATA.unpause(); + + $('#saveSnapshotExport').removeClass('disabled'); + } + + NETDATA.globalSelectionSync.stop(); + NETDATA.options.force_data_points = saveData.data_points; + NETDATA.options.fake_chart_rendering = true; + NETDATA.onscroll_updater_enabled = false; + NETDATA.abortAllRefreshes(); + + var size = 0; + var info = ' Resolution: <b>' + saveSnapshotSelectedSecondsPerPoint.toString() + ((saveSnapshotSelectedSecondsPerPoint === 1) ? ' second ' : ' seconds ').toString() + 'per point</b>.'; + + function update_chart(idx) { + if (saveSnapshotStop === true) { + saveSnapshotModalLog('info', 'Cancelled!'); + saveSnapshotRestore(); + return; + } + + var state = NETDATA.options.targets[--idx]; + + var pcent = (NETDATA.options.targets.length - idx) * 100 / NETDATA.options.targets.length; + $(el).css('width', pcent + '%').attr('aria-valuenow', pcent); + eltxt.innerText = Math.round(pcent).toString() + '%, ' + state.id; + + setTimeout(function () { + charts_count++; + state.isVisible(true); + state.current.force_after_ms = saveData.after_ms; + state.current.force_before_ms = saveData.before_ms; + + state.updateChart(function (status, reason) { + state.current.force_after_ms = null; + state.current.force_before_ms = null; + + if (status === true) { + charts_ok++; + // state.log('ok'); + size += pack_api1_v1_chart_data(state); + } else { + charts_failed++; + state.log('failed to be updated: ' + reason); + } + + saveSnapshotModalLog((charts_failed) ? 'danger' : 'info', 'Generated snapshot data size <b>' + (Math.round(size * 100 / 1024 / 1024) / 100).toString() + ' MB</b>. ' + ((charts_failed) ? (charts_failed.toString() + ' charts have failed to be downloaded') : '').toString() + info); + + if (idx > 0) { + update_chart(idx); + } else { + saveData.charts_ok = charts_ok; + saveData.charts_failed = charts_failed; + saveData.data_size = size; + // console.log(saveData.compression + ': ' + (size / (options.data.dimensions_count * Math.round(saveSnapshotViewDuration / saveSnapshotSelectedSecondsPerPoint))).toString()); + + // save it + // console.log(saveData); + saveObjectToClient(saveData, filename); + + if (charts_failed > 0) { + alert(charts_failed.toString() + ' failed to be downloaded'); + } + + saveSnapshotRestore(); + saveData = null; + } + }) + }, 0); + } + + update_chart(NETDATA.options.targets.length); + }); + }); +} + +// -------------------------------------------------------------------- +// activate netdata on the page + +function dashboardSettingsSetup() { + var update_options_modal = function () { + // console.log('update_options_modal'); + + var sync_option = function (option) { + var self = $('#' + option); + + if (self.prop('checked') !== NETDATA.getOption(option)) { + // console.log('switching ' + option.toString()); + self.bootstrapToggle(NETDATA.getOption(option) ? 'on' : 'off'); + } + }; + + var theme_sync_option = function (option) { + var self = $('#' + option); + + self.bootstrapToggle(netdataTheme === 'slate' ? 'on' : 'off'); + }; + var units_sync_option = function (option) { + var self = $('#' + option); + + if (self.prop('checked') !== (NETDATA.getOption('units') === 'auto')) { + self.bootstrapToggle(NETDATA.getOption('units') === 'auto' ? 'on' : 'off'); + } + + if (self.prop('checked') === true) { + $('#settingsLocaleTempRow').show(); + $('#settingsLocaleTimeRow').show(); + } else { + $('#settingsLocaleTempRow').hide(); + $('#settingsLocaleTimeRow').hide(); + } + }; + var temp_sync_option = function (option) { + var self = $('#' + option); + + if (self.prop('checked') !== (NETDATA.getOption('temperature') === 'celsius')) { + self.bootstrapToggle(NETDATA.getOption('temperature') === 'celsius' ? 'on' : 'off'); + } + }; + var timezone_sync_option = function (option) { + var self = $('#' + option); + + document.getElementById('browser_timezone').innerText = NETDATA.options.browser_timezone; + document.getElementById('server_timezone').innerText = NETDATA.options.server_timezone; + document.getElementById('current_timezone').innerText = (NETDATA.options.current.timezone === 'default') ? 'unset, using browser default' : NETDATA.options.current.timezone; + + if (self.prop('checked') === NETDATA.dateTime.using_timezone) { + self.bootstrapToggle(NETDATA.dateTime.using_timezone ? 'off' : 'on'); + } + }; + + sync_option('eliminate_zero_dimensions'); + sync_option('destroy_on_hide'); + sync_option('async_on_scroll'); + sync_option('parallel_refresher'); + sync_option('concurrent_refreshes'); + sync_option('sync_selection'); + sync_option('sync_pan_and_zoom'); + sync_option('stop_updates_when_focus_is_lost'); + sync_option('smooth_plot'); + sync_option('pan_and_zoom_data_padding'); + sync_option('show_help'); + sync_option('seconds_as_time'); + theme_sync_option('netdata_theme_control'); + units_sync_option('units_conversion'); + temp_sync_option('units_temp'); + timezone_sync_option('local_timezone'); + + if (NETDATA.getOption('parallel_refresher') === false) { + $('#concurrent_refreshes_row').hide(); + } else { + $('#concurrent_refreshes_row').show(); + } + }; + NETDATA.setOption('setOptionCallback', update_options_modal); + + // handle options changes + $('#eliminate_zero_dimensions').change(function () { + NETDATA.setOption('eliminate_zero_dimensions', $(this).prop('checked')); + }); + $('#destroy_on_hide').change(function () { + NETDATA.setOption('destroy_on_hide', $(this).prop('checked')); + }); + $('#async_on_scroll').change(function () { + NETDATA.setOption('async_on_scroll', $(this).prop('checked')); + }); + $('#parallel_refresher').change(function () { + NETDATA.setOption('parallel_refresher', $(this).prop('checked')); + }); + $('#concurrent_refreshes').change(function () { + NETDATA.setOption('concurrent_refreshes', $(this).prop('checked')); + }); + $('#sync_selection').change(function () { + NETDATA.setOption('sync_selection', $(this).prop('checked')); + }); + $('#sync_pan_and_zoom').change(function () { + NETDATA.setOption('sync_pan_and_zoom', $(this).prop('checked')); + }); + $('#stop_updates_when_focus_is_lost').change(function () { + urlOptions.update_always = !$(this).prop('checked'); + urlOptions.hashUpdate(); + + NETDATA.setOption('stop_updates_when_focus_is_lost', !urlOptions.update_always); + }); + $('#smooth_plot').change(function () { + NETDATA.setOption('smooth_plot', $(this).prop('checked')); + }); + $('#pan_and_zoom_data_padding').change(function () { + NETDATA.setOption('pan_and_zoom_data_padding', $(this).prop('checked')); + }); + $('#seconds_as_time').change(function () { + NETDATA.setOption('seconds_as_time', $(this).prop('checked')); + }); + $('#local_timezone').change(function () { + if ($(this).prop('checked')) { + selected_server_timezone('default', true); + } else { + selected_server_timezone('default', false); + } + }); + + $('#units_conversion').change(function () { + NETDATA.setOption('units', $(this).prop('checked') ? 'auto' : 'original'); + }); + $('#units_temp').change(function () { + NETDATA.setOption('temperature', $(this).prop('checked') ? 'celsius' : 'fahrenheit'); + }); + + $('#show_help').change(function () { + urlOptions.help = $(this).prop('checked'); + urlOptions.hashUpdate(); + + NETDATA.setOption('show_help', urlOptions.help); + netdataReload(); + }); + + // this has to be the last + // it reloads the page + $('#netdata_theme_control').change(function () { + urlOptions.theme = $(this).prop('checked') ? 'slate' : 'white'; + urlOptions.hashUpdate(); + + if (setTheme(urlOptions.theme)) { + netdataReload(); + } + }); +} + +function scrollDashboardTo() { + if (netdataSnapshotData !== null && typeof netdataSnapshotData.hash !== 'undefined') { + //console.log(netdataSnapshotData.hash); + scrollToId(netdataSnapshotData.hash.replace('#', '')); + } else { + // check if we have to jump to a specific section + scrollToId(urlOptions.hash.replace('#', '')); + + if (urlOptions.chart !== null) { + NETDATA.alarms.scrollToChart(urlOptions.chart); + //urlOptions.hash = '#' + NETDATA.name2id('menu_' + charts[c].menu + '_submenu_' + charts[c].submenu); + //urlOptions.hash = '#chart_' + NETDATA.name2id(urlOptions.chart); + //console.log('hash = ' + urlOptions.hash); + } + } +} + +var modalHiddenCallback = null; + +function scrollToChartAfterHidingModal(chart) { + modalHiddenCallback = function () { + NETDATA.alarms.scrollToChart(chart); + }; +} + +// ---------------------------------------------------------------------------- + +function enableTooltipsAndPopovers() { + $('[data-toggle="tooltip"]').tooltip({ + animated: 'fade', + trigger: 'hover', + html: true, + delay: {show: 500, hide: 0}, + container: 'body' + }); + $('[data-toggle="popover"]').popover(); +} + +// ---------------------------------------------------------------------------- + +var runOnceOnDashboardLastRun = 0; + +function runOnceOnDashboardWithjQuery() { + if (runOnceOnDashboardLastRun !== 0) { + scrollDashboardTo(); + + // restore the scrollspy at the proper position + $(document.body).scrollspy('refresh'); + $(document.body).scrollspy('process'); + + return; + } + + runOnceOnDashboardLastRun = Date.now(); + + // ------------------------------------------------------------------------ + // bootstrap modals + + // prevent bootstrap modals from scrolling the page + // maintains the current scroll position + // https://stackoverflow.com/a/34754029/4525767 + + var scrollPos = 0; + var modal_depth = 0; // how many modals are currently open + var modal_shown = false; // set to true, if a modal is shown + var netdata_paused_on_modal = false; // set to true, if the modal paused netdata + var scrollspyOffset = $(window).height() / 3; // will be updated below - the offset of scrollspy to select an item + + $('.modal') + .on('show.bs.modal', function () { + if (modal_depth === 0) { + scrollPos = window.scrollY; + + $('body').css({ + overflow: 'hidden', + position: 'fixed', + top: -scrollPos + }); + + modal_shown = true; + + if (NETDATA.options.pauseCallback === null) { + NETDATA.pause(function () { + }); + netdata_paused_on_modal = true; + } else { + netdata_paused_on_modal = false; + } + } + + modal_depth++; + //console.log(urlOptions.after); + + }) + .on('hide.bs.modal', function () { + + modal_depth--; + + if (modal_depth <= 0) { + modal_depth = 0; + + $('body') + .css({ + overflow: '', + position: '', + top: '' + }); + + // scroll to the position we had open before the modal + $('html, body') + .animate({scrollTop: scrollPos}, 0); + + // unpause netdata, if we paused it + if (netdata_paused_on_modal === true) { + NETDATA.unpause(); + netdata_paused_on_modal = false; + } + + // restore the scrollspy at the proper position + $(document.body).scrollspy('process'); + } + //console.log(urlOptions.after); + }) + .on('hidden.bs.modal', function () { + if (modal_depth === 0) { + modal_shown = false; + } + + if (typeof modalHiddenCallback === 'function') { + modalHiddenCallback(); + } + + modalHiddenCallback = null; + //console.log(urlOptions.after); + }); + + // ------------------------------------------------------------------------ + // sidebar / affix + + $('#sidebar') + .affix({ + offset: { + top: (isdemo()) ? 150 : 0, + bottom: 0 + } + }) + .on('affixed.bs.affix', function () { + // fix scrolling of very long affix lists + // http://stackoverflow.com/questions/21691585/bootstrap-3-1-0-affix-too-long + + $(this).removeAttr('style'); + }) + .on('affix-top.bs.affix', function () { + // fix bootstrap affix click bug + // https://stackoverflow.com/a/37847981/4525767 + + if (modal_shown) { + return false; + } + }) + .on('activate.bs.scrollspy', function (e) { + // change the URL based on the current position of the screen + + if (modal_shown === false) { + var el = $(e.target); + var hash = el.find('a').attr('href'); + if (typeof hash === 'string' && hash.substring(0, 1) === '#' && urlOptions.hash.startsWith(hash + '_submenu_') === false) { + urlOptions.hash = hash; + urlOptions.hashUpdate(); + } + } + }); + + Ps.initialize(document.getElementById('sidebar'), { + wheelSpeed: 0.5, + wheelPropagation: true, + swipePropagation: true, + minScrollbarLength: null, + maxScrollbarLength: null, + useBothWheelAxes: false, + suppressScrollX: true, + suppressScrollY: false, + scrollXMarginOffset: 0, + scrollYMarginOffset: 0, + theme: 'default' + }); + + // ------------------------------------------------------------------------ + // scrollspy + + if (scrollspyOffset > 250) { + scrollspyOffset = 250; + } + if (scrollspyOffset < 75) { + scrollspyOffset = 75; + } + document.body.setAttribute('data-offset', scrollspyOffset); + + // scroll the dashboard, before activating the scrollspy, so that our + // hash will not be updated before we got the chance to scroll to it + scrollDashboardTo(); + + $(document.body).scrollspy({ + target: '#sidebar', + offset: scrollspyOffset // controls the diff of the <hX> element to the top, to select it + }); + + // ------------------------------------------------------------------------ + // my-netdata menu + + Ps.initialize(document.getElementById('my-netdata-dropdown-content'), { + wheelSpeed: 1, + wheelPropagation: false, + swipePropagation: false, + minScrollbarLength: null, + maxScrollbarLength: null, + useBothWheelAxes: false, + suppressScrollX: true, + suppressScrollY: false, + scrollXMarginOffset: 0, + scrollYMarginOffset: 0, + theme: 'default' + }); + + $('#myNetdataDropdownParent') + .on('show.bs.dropdown', function () { + var hash = urlOptions.genHash(); + $('.registry_link').each(function (idx) { + this.setAttribute('href', this.getAttribute("href").replace(/#.*$/, hash)); + }); + + NETDATA.pause(function () { + }); + }) + .on('shown.bs.dropdown', function () { + Ps.update(document.getElementById('my-netdata-dropdown-content')); + }) + .on('hidden.bs.dropdown', function () { + NETDATA.unpause(); + }); + + $('#deleteRegistryModal') + .on('hidden.bs.modal', function () { + deleteRegistryGuid = null; + }); + + // ------------------------------------------------------------------------ + // update modal + + $('#updateModal') + .on('show.bs.modal', function () { + versionLog('checking, please wait...'); + }) + .on('shown.bs.modal', function () { + notifyForUpdate(true); + }); + + // ------------------------------------------------------------------------ + // alarms modal + + $('#alarmsModal') + .on('shown.bs.modal', function () { + alarmsUpdateModal(); + }) + .on('hidden.bs.modal', function () { + document.getElementById('alarms_active').innerHTML = + document.getElementById('alarms_all').innerHTML = + document.getElementById('alarms_log').innerHTML = + 'loading...'; + }); + + // ------------------------------------------------------------------------ + + dashboardSettingsSetup(); + loadSnapshotDragAndDropSetup(); + saveSnapshotModalSetup(); + showPageFooter(); + + // ------------------------------------------------------------------------ + // https://github.com/viralpatel/jquery.shorten/blob/master/src/jquery.shorten.js + + $.fn.shorten = function (settings) { + "use strict"; + + var config = { + showChars: 750, + minHideChars: 10, + ellipsesText: "...", + moreText: '<i class="fas fa-expand"></i> show more information', + lessText: '<i class="fas fa-compress"></i> show less information', + onLess: function () { + NETDATA.onscroll(); + }, + onMore: function () { + NETDATA.onscroll(); + }, + errMsg: null, + force: false + }; + + if (settings) { + $.extend(config, settings); + } + + if ($(this).data('jquery.shorten') && !config.force) { + return false; + } + $(this).data('jquery.shorten', true); + + $(document).off("click", '.morelink'); + + $(document).on({ + click: function () { + + var $this = $(this); + if ($this.hasClass('less')) { + $this.removeClass('less'); + $this.html(config.moreText); + $this.parent().prev().animate({'height': '0' + '%'}, 0, function () { + $this.parent().prev().prev().show(); + }).hide(0, function () { + config.onLess(); + }); + } else { + $this.addClass('less'); + $this.html(config.lessText); + $this.parent().prev().animate({'height': '100' + '%'}, 0, function () { + $this.parent().prev().prev().hide(); + }).show(0, function () { + config.onMore(); + }); + } + return false; + } + }, '.morelink'); + + return this.each(function () { + var $this = $(this); + + var content = $this.html(); + var contentlen = $this.text().length; + if (contentlen > config.showChars + config.minHideChars) { + var c = content.substr(0, config.showChars); + if (c.indexOf('<') >= 0) // If there's HTML don't want to cut it + { + var inTag = false; // I'm in a tag? + var bag = ''; // Put the characters to be shown here + var countChars = 0; // Current bag size + var openTags = []; // Stack for opened tags, so I can close them later + var tagName = null; + + for (var i = 0, r = 0; r <= config.showChars; i++) { + if (content[i] === '<' && !inTag) { + inTag = true; + + // This could be "tag" or "/tag" + tagName = content.substring(i + 1, content.indexOf('>', i)); + + // If its a closing tag + if (tagName[0] === '/') { + + if (tagName !== ('/' + openTags[0])) { + config.errMsg = 'ERROR en HTML: the top of the stack should be the tag that closes'; + } else { + openTags.shift(); // Pops the last tag from the open tag stack (the tag is closed in the retult HTML!) + } + + } else { + // There are some nasty tags that don't have a close tag like <br/> + if (tagName.toLowerCase() !== 'br') { + openTags.unshift(tagName); // Add to start the name of the tag that opens + } + } + } + + if (inTag && content[i] === '>') { + inTag = false; + } + + if (inTag) { + bag += content.charAt(i); + } else { + // Add tag name chars to the result + r++; + if (countChars <= config.showChars) { + bag += content.charAt(i); // Fix to ie 7 not allowing you to reference string characters using the [] + countChars++; + } else { + // Now I have the characters needed + if (openTags.length > 0) { + // I have unclosed tags + + //console.log('They were open tags'); + //console.log(openTags); + for (var j = 0; j < openTags.length; j++) { + //console.log('Cierro tag ' + openTags[j]); + bag += '</' + openTags[j] + '>'; // Close all tags that were opened + + // You could shift the tag from the stack to check if you end with an empty stack, that means you have closed all open tags + } + break; + } + } + } + } + c = $('<div/>').html(bag + '<span class="ellip">' + config.ellipsesText + '</span>').html(); + } else { + c += config.ellipsesText; + } + + var html = '<div class="shortcontent">' + c + + '</div><div class="allcontent">' + content + + '</div><span><a href="javascript://nop/" class="morelink">' + config.moreText + '</a></span>'; + + $this.html(html); + $this.find(".allcontent").hide(); // Hide all text + $('.shortcontent p:last', $this).css('margin-bottom', 0); //Remove bottom margin on last paragraph as it's likely shortened + } + }); + }; +} + +function finalizePage() { + // resize all charts - without starting the background thread + // this has to be done while NETDATA is paused + // if we ommit this, the affix menu will be wrong, since all + // the Dom elements are initially zero-sized + NETDATA.parseDom(); + + // ------------------------------------------------------------------------ + + NETDATA.globalPanAndZoom.callback = null; + NETDATA.globalChartUnderlay.callback = null; + + if (urlOptions.pan_and_zoom === true && NETDATA.options.targets.length > 0) { + NETDATA.globalPanAndZoom.setMaster(NETDATA.options.targets[0], urlOptions.after, urlOptions.before); + } + + // callback for us to track PanAndZoom operations + NETDATA.globalPanAndZoom.callback = urlOptions.netdataPanAndZoomCallback; + NETDATA.globalChartUnderlay.callback = urlOptions.netdataHighlightCallback; + + // ------------------------------------------------------------------------ + + // let it run (update the charts) + NETDATA.unpause(); + + runOnceOnDashboardWithjQuery(); + $(".shorten").shorten(); + enableTooltipsAndPopovers(); + + if (isdemo()) { + // do not to give errors on netdata demo servers for 60 seconds + NETDATA.options.current.retries_on_data_failures = 60; + + if (urlOptions.nowelcome !== true) { + setTimeout(function () { + $('#welcomeModal').modal(); + }, 1000); + } + + // google analytics when this is used for the home page of the demo sites + // this does not run on user's installations + setTimeout(function () { + (function (i, s, o, g, r, a, m) { + i['GoogleAnalyticsObject'] = r; + i[r] = i[r] || function () { + (i[r].q = i[r].q || []).push(arguments) + }, i[r].l = 1 * new Date(); + a = s.createElement(o), + m = s.getElementsByTagName(o)[0]; + a.async = 1; + a.src = g; + m.parentNode.insertBefore(a, m) + })(window, document, 'script', 'https://www.google-analytics.com/analytics.js', 'ga'); + + ga('create', 'UA-64295674-3', 'auto'); + ga('send', 'pageview'); + }, 2000); + } else { + notifyForUpdate(); + } + + if (urlOptions.show_alarms === true) { + setTimeout(function () { + $('#alarmsModal').modal('show'); + }, 1000); + } + + NETDATA.onresizeCallback = function () { + Ps.update(document.getElementById('sidebar')); + Ps.update(document.getElementById('my-netdata-dropdown-content')); + }; + NETDATA.onresizeCallback(); + + if (netdataSnapshotData !== null) { + NETDATA.globalPanAndZoom.setMaster(NETDATA.options.targets[0], netdataSnapshotData.after_ms, netdataSnapshotData.before_ms); + } + + // var netdataEnded = performance.now(); + // console.log('start up time: ' + (netdataEnded - netdataStarted).toString() + ' ms'); +} + +function resetDashboardOptions() { + var help = NETDATA.options.current.show_help; + + NETDATA.resetOptions(); + if (setTheme('slate')) { + netdataReload(); + } + + if (help !== NETDATA.options.current.show_help) { + netdataReload(); + } +} + +// callback to add the dashboard info to the +// parallel javascript downloader in netdata +var netdataPrepCallback = function () { + NETDATA.requiredCSS.push({ + url: NETDATA.serverStatic + 'css/bootstrap-toggle-2.2.2.min.css', + isAlreadyLoaded: function () { + return false; + } + }); + + NETDATA.requiredJs.push({ + url: NETDATA.serverStatic + 'lib/bootstrap-toggle-2.2.2.min.js', + isAlreadyLoaded: function () { + return false; + } + }); + + NETDATA.requiredJs.push({ + url: NETDATA.serverStatic + 'dashboard_info.js?v20181019-1', + async: false, + isAlreadyLoaded: function () { + return false; + } + }); + + if (isdemo()) { + document.getElementById('masthead').style.display = 'block'; + } else { + if (urlOptions.update_always === true) { + NETDATA.setOption('stop_updates_when_focus_is_lost', !urlOptions.update_always); + } + } +}; + +var selected_server_timezone = function (timezone, status) { + //console.log('called with timezone: ' + timezone + ", status: " + ((typeof status === 'undefined')?'undefined':status).toString()); + + // clear the error + document.getElementById('timezone_error_message').innerHTML = ''; + + if (typeof status === 'undefined') { + // the user selected a timezone from the menu + + NETDATA.setOption('user_set_server_timezone', timezone); + + if (NETDATA.dateTime.init(timezone) === false) { + NETDATA.dateTime.init(); + + if (!$('#local_timezone').prop('checked')) { + $('#local_timezone').bootstrapToggle('on'); + } + + document.getElementById('timezone_error_message').innerHTML = 'Ooops! That timezone was not accepted by your browser. Please open a github issue to help us fix it.'; + NETDATA.setOption('user_set_server_timezone', NETDATA.options.server_timezone); + } else { + if ($('#local_timezone').prop('checked')) { + $('#local_timezone').bootstrapToggle('off'); + } + } + } else if (status === true) { + // the user wants the browser default timezone to be activated + + NETDATA.dateTime.init(); + } else { + // the user wants the server default timezone to be activated + //console.log('found ' + NETDATA.options.current.user_set_server_timezone); + + if (NETDATA.options.current.user_set_server_timezone === 'default') { + NETDATA.options.current.user_set_server_timezone = NETDATA.options.server_timezone; + } + + timezone = NETDATA.options.current.user_set_server_timezone; + + if (NETDATA.dateTime.init(timezone) === false) { + NETDATA.dateTime.init(); + + if (!$('#local_timezone').prop('checked')) { + $('#local_timezone').bootstrapToggle('on'); + } + + document.getElementById('timezone_error_message').innerHTML = 'Sorry. The timezone "' + timezone.toString() + '" is not accepted by your browser. Please select one from the list.'; + NETDATA.setOption('user_set_server_timezone', NETDATA.options.server_timezone); + } + } + + document.getElementById('current_timezone').innerText = (NETDATA.options.current.timezone === 'default') ? 'unset, using browser default' : NETDATA.options.current.timezone; + return false; +}; + +// our entry point +// var netdataStarted = performance.now(); + +var netdataCallback = initializeDynamicDashboard; diff --git a/web/gui/registry.html b/web/gui/registry.html deleted file mode 100644 index 3be7952e2..000000000 --- a/web/gui/registry.html +++ /dev/null @@ -1,203 +0,0 @@ -<!DOCTYPE html> -<!-- SPDX-License-Identifier: GPL-3.0-or-later --> -<html lang="en"> -<head> - <title>NetData Registry Dashboard</title> - <meta name="application-name" content="netdata"> - - <meta http-equiv="Content-Type" content="text/html; charset=utf-8" /> - <meta charset="utf-8"> - <meta http-equiv="X-UA-Compatible" content="IE=edge,chrome=1"> - <meta name="viewport" content="width=device-width, initial-scale=1"> - <meta name="apple-mobile-web-app-capable" content="yes"> - <meta name="apple-mobile-web-app-status-bar-style" content="black-translucent"> - - <meta property="og:locale" content="en_US" /> - <meta property="og:image" content="https://cloud.githubusercontent.com/assets/2662304/22945737/e98cd0c6-f2fd-11e6-96f1-5501934b0955.png"/> - <meta property="og:url" content="http://my-netdata.io/"/> - <meta property="og:type" content="website"/> - <meta property="og:site_name" content="netdata"/> - <meta property="og:title" content="netdata - real-time performance monitoring, done right!"/> - <meta property="og:description" content="Stunning real-time dashboards, blazingly fast and extremely interactive. Zero configuration, zero dependencies, zero maintenance." /> - - <style> - .registry-container { - margin-left: 50px; - max-width: 400px; - min-width: 200px; - border: 1px solid #555; - max-height: 80vh; - height: auto; - overflow-x: hidden; - /* background-color: #3a3f44; */ - text-align: center; - } - .registry-server-container { - width: 100%; - height: auto; - overflow-x: hidden; - font-size: 10px; - padding-left: 10px; - padding-right: 10px; - } - .registry-server-container:hover { - color: #f5f5f5; - background-color: #262626; - } - .registry-server-name { - display: block; - text-decoration: none !important; - clear: both; - font-size: 16px; - font-weight: bold; - white-space: normal; - padding-top: 10px; - } - </style> -</head> -<script> -// this section has to appear before loading dashboard.js - -// Select a theme. -// uncomment on of the two themes: - -// var netdataTheme = 'default'; // this is white -var netdataTheme = 'slate'; // this is dark - - -// Set the default netdata server. -// on charts without a 'data-host', this one will be used. -// the default is the server that dashboard.js is downloaded from. - -// var netdataServer = 'http://my.server:19999/'; - -function registryGotoServer(guid) { - console.log('goto server: ' + guid); -} - -function registryAddServer(u) { - return '<div id="registry_server_' + u.guid + '" class="registry-server-container" onClick="registryGotoServer(\'' + u.guid + '\'); return false;">' - + '<div class="registry-server-name">' + u.name + '</div>' - + '<div data-netdata="system.cpu"' - + ' data-host="' + u.url + '"' - + ' data-chart-library="sparkline"' - + ' data-sparkline-chartrangemin="0"' - + ' data-sparkline-chartrangemax="100"' - + ' data-sparkline-chartrangeclip="true"' - + ' data-sparkline-disabletooltips="true"' - + ' data-sparkline-disableinteraction="true"' - + ' data-sparkline-disablehighlight="true"' - + ' data-sparkline-linecolor="#444"' - + ' data-sparkline-spotcolor="disable"' - + ' data-sparkline-minspotcolor="disable"' - + ' data-sparkline-maxspotcolor="disable"' - + ' data-width="100%"' - + ' data-height="20px"' - + ' data-after="-200"' - + '></div>' - + '</div>'; -} - -var netdataRegistryCallback = function(machines_array) { - var el = ''; - var a1 = ''; - var found = 0; - - if(machines_array) { - function name_comparator_desc(a, b) { - if (a.name > b.name) return -1; - if (a.name < b.name) return 1; - return 0; - } - - var machines = machines_array.sort(name_comparator_desc); - var len = machines.length; - while(len--) { - var u = machines[len]; - - //var status = "enabled"; - found++; - - //if(u.guid === NETDATA.registry.machine_guid) - // status = "disabled"; - - el += registryAddServer(u); - a1 += '<li id="registry_action_' + u.guid + '"><a href="#" onclick="deleteRegistryModalHandler(\'' + u.guid + '\',\'' + u.name + '\',\'' + u.url + '\'); return false;"><i class="fa fa-trash-o" aria-hidden="true" style="color: #999;"></i></a></li>'; - } - } - - if(!found) { - if(machines) - el += '<li><a href="https://github.com/netdata/netdata/wiki/mynetdata-menu-item" style="color: #666;" target="_blank">your netdata server list is empty...</a></li>'; - else - el += '<li><a href="https://github.com/netdata/netdata/wiki/mynetdata-menu-item" style="color: #666;" target="_blank">failed to contact the registry...</a></li>'; - - a1 += '<li><a href="#"> </a></li>'; - - el += '<li role="separator" class="divider"></li>' + - '<li><a href="//london.netdata.rocks/default.html">EU - London (DigitalOcean.com)</a></li>' + - '<li><a href="//atlanta.netdata.rocks/default.html">US - Atlanta (CDN77.com)</a></li>' + - '<li><a href="//athens.netdata.rocks/default.html">EU - Athens</a></li>'; - a1 += '<li role="separator" class="divider"></li>' + - '<li><a href="#"> </a></li>' + - '<li><a href="#"> </a></li>'+ - '<li><a href="#"> </a></li>'; - } - - el += '<li role="separator" class="divider"></li>'; - a1 += '<li role="separator" class="divider"></li>'; - - el += '<li><a href="https://github.com/netdata/netdata/wiki/mynetdata-menu-item" style="color: #999;" target="_blank">What is this?</a></li>'; - a1 += '<li><a href="#" style="color: #999;" onclick="switchRegistryModalHandler(); return false;"><i class="fa fa-cog" aria-hidden="true" style="color: #999;"></i></a></li>'; - - document.getElementById('mynetdata_servers').innerHTML = el; - //document.getElementById('mynetdata_servers2').innerHTML = el; - //document.getElementById('mynetdata_actions1').innerHTML = a1; - NETDATA.updatedDom(); -}; -</script> - -<!-- - Load dashboard.js - - to host this HTML file on your web server, - you have to load dashboard.js from the netdata server. - - So, pick one the two below - If you pick the first, set the server name/IP. - - The second assumes you host this file on /usr/share/netdata/web - and that you have chown it to be owned by netdata:netdata ---> -<!-- <script type="text/javascript" src="http://my.server:19999/dashboard.js"></script> --> -<script type="text/javascript" src="dashboard.js?v20170724-7"></script> - -<script> -// Set options for TV operation -// This has to be done, after dashboard.js is loaded - -// destroy charts not shown (lowers memory on the browser) -NETDATA.options.current.destroy_on_hide = true; - -// set this to false, to always show all dimensions -NETDATA.options.current.eliminate_zero_dimensions = true; - -// lower the pressure on this browser -NETDATA.options.current.concurrent_refreshes = true; - -// if the tv browser is too slow (a pi?) -// set this to false -NETDATA.options.current.parallel_refresher = true; - -// always update the charts, even if focus is lost -// NETDATA.options.current.stop_updates_when_focus_is_lost = false; -</script> -<body> - -<div id="mynetdata_servers" class="registry-container" onscroll="NETDATA.onscroll();"> - - Loading.... - -</div> <!-- registry-container --> -</body> -</html> diff --git a/web/gui/src/dashboard.js/alarms.js b/web/gui/src/dashboard.js/alarms.js new file mode 100644 index 000000000..82477671a --- /dev/null +++ b/web/gui/src/dashboard.js/alarms.js @@ -0,0 +1,422 @@ + +// Registry of netdata hosts + +NETDATA.alarms = { + onclick: null, // the callback to handle the click - it will be called with the alarm log entry + chart_div_offset: -50, // give that space above the chart when scrolling to it + chart_div_id_prefix: 'chart_', // the chart DIV IDs have this prefix (they should be NETDATA.name2id(chart.id)) + chart_div_animation_duration: 0,// the duration of the animation while scrolling to a chart + + ms_penalty: 0, // the time penalty of the next alarm + ms_between_notifications: 500, // firefox moves the alarms off-screen (above, outside the top of the screen) + // if alarms are shown faster than: one per 500ms + + update_every: 10000, // the time in ms between alarm checks + + notifications: false, // when true, the browser supports notifications (may not be granted though) + last_notification_id: 0, // the id of the last alarm_log we have raised an alarm for + first_notification_id: 0, // the id of the first alarm_log entry for this session + // this is used to prevent CLEAR notifications for past events + // notifications_shown: [], + + server: null, // the server to connect to for fetching alarms + current: null, // the list of raised alarms - updated in the background + + // a callback function to call every time the list of raised alarms is refreshed + callback: (typeof netdataAlarmsActiveCallback === 'function') ? netdataAlarmsActiveCallback : null, + + // a callback function to call every time a notification is shown + // the return value is used to decide if the notification will be shown + notificationCallback: (typeof netdataAlarmsNotifCallback === 'function') ? netdataAlarmsNotifCallback : null, + + recipients: null, // the list (array) of recipients to show alarms for, or null + + recipientMatches: function (to_string, wanted_array) { + if (typeof wanted_array === 'undefined' || wanted_array === null || Array.isArray(wanted_array) === false) { + return true; + } + + let r = ' ' + to_string.toString() + ' '; + let len = wanted_array.length; + while (len--) { + if (r.indexOf(' ' + wanted_array[len] + ' ') >= 0) { + return true; + } + } + + return false; + }, + + activeForRecipients: function () { + let active = {}; + let data = NETDATA.alarms.current; + + if (typeof data === 'undefined' || data === null) { + return active; + } + + for (let x in data.alarms) { + if (!data.alarms.hasOwnProperty(x)) { + continue; + } + + let alarm = data.alarms[x]; + if ((alarm.status === 'WARNING' || alarm.status === 'CRITICAL') && NETDATA.alarms.recipientMatches(alarm.recipient, NETDATA.alarms.recipients)) { + active[x] = alarm; + } + } + + return active; + }, + + notify: function (entry) { + // console.log('alarm ' + entry.unique_id); + + if (entry.updated) { + // console.log('alarm ' + entry.unique_id + ' has been updated by another alarm'); + return; + } + + let value_string = entry.value_string; + + if (NETDATA.alarms.current !== null) { + // get the current value_string + let t = NETDATA.alarms.current.alarms[entry.chart + '.' + entry.name]; + if (typeof t !== 'undefined' && entry.status === t.status && typeof t.value_string !== 'undefined') { + value_string = t.value_string; + } + } + + let name = entry.name.replace(/_/g, ' '); + let status = entry.status.toLowerCase(); + let title = name + ' = ' + value_string.toString(); + let tag = entry.alarm_id; + let icon = 'images/banner-icon-144x144.png'; + let interaction = false; + let data = entry; + let show = true; + + // console.log('alarm ' + entry.unique_id + ' ' + entry.chart + '.' + entry.name + ' is ' + entry.status); + + switch (entry.status) { + case 'REMOVED': + show = false; + break; + + case 'UNDEFINED': + return; + + case 'UNINITIALIZED': + return; + + case 'CLEAR': + if (entry.unique_id < NETDATA.alarms.first_notification_id) { + // console.log('alarm ' + entry.unique_id + ' is not current'); + return; + } + if (entry.old_status === 'UNINITIALIZED' || entry.old_status === 'UNDEFINED') { + // console.log('alarm' + entry.unique_id + ' switch to CLEAR from ' + entry.old_status); + return; + } + if (entry.no_clear_notification) { + // console.log('alarm' + entry.unique_id + ' is CLEAR but has no_clear_notification flag'); + return; + } + title = name + ' back to normal (' + value_string.toString() + ')'; + icon = 'images/check-mark-2-128-green.png'; + interaction = false; + break; + + case 'WARNING': + if (entry.old_status === 'CRITICAL') { + status = 'demoted to ' + entry.status.toLowerCase(); + } + + icon = 'images/alert-128-orange.png'; + interaction = false; + break; + + case 'CRITICAL': + if (entry.old_status === 'WARNING') { + status = 'escalated to ' + entry.status.toLowerCase(); + } + + icon = 'images/alert-128-red.png'; + interaction = true; + break; + + default: + console.log('invalid alarm status ' + entry.status); + return; + } + + // filter recipients + if (show) { + show = NETDATA.alarms.recipientMatches(entry.recipient, NETDATA.alarms.recipients); + } + + /* + // cleanup old notifications with the same alarm_id as this one + // it does not seem to work on any web browser - so notifications cannot be removed + + let len = NETDATA.alarms.notifications_shown.length; + while (len--) { + let n = NETDATA.alarms.notifications_shown[len]; + if (n.data.alarm_id === entry.alarm_id) { + console.log('removing old alarm ' + n.data.unique_id); + + // close the notification + n.close.bind(n); + + // remove it from the array + NETDATA.alarms.notifications_shown.splice(len, 1); + len = NETDATA.alarms.notifications_shown.length; + } + } + */ + + if (show) { + if (typeof NETDATA.alarms.notificationCallback === 'function') { + show = NETDATA.alarms.notificationCallback(entry); + } + + if (show) { + setTimeout(function () { + // show this notification + // console.log('new notification: ' + title); + let n = new Notification(title, { + body: entry.hostname + ' - ' + entry.chart + ' (' + entry.family + ') - ' + status + ': ' + entry.info, + tag: tag, + requireInteraction: interaction, + icon: NETDATA.serverStatic + icon, + data: data + }); + + n.onclick = function (event) { + event.preventDefault(); + NETDATA.alarms.onclick(event.target.data); + }; + + // console.log(n); + // NETDATA.alarms.notifications_shown.push(n); + // console.log(entry); + }, NETDATA.alarms.ms_penalty); + + NETDATA.alarms.ms_penalty += NETDATA.alarms.ms_between_notifications; + } + } + }, + + scrollToChart: function (chart_id) { + if (typeof chart_id === 'string') { + let offset = $('#' + NETDATA.alarms.chart_div_id_prefix + NETDATA.name2id(chart_id)).offset(); + if (typeof offset !== 'undefined') { + $('html, body').animate({scrollTop: offset.top + NETDATA.alarms.chart_div_offset}, NETDATA.alarms.chart_div_animation_duration); + return true; + } + } + return false; + }, + + scrollToAlarm: function (alarm) { + if (typeof alarm === 'object') { + let ret = NETDATA.alarms.scrollToChart(alarm.chart); + + if (ret && NETDATA.options.page_is_visible === false) { + window.focus(); + } + // alert('netdata dashboard will now scroll to chart: ' + alarm.chart + '\n\nThis alarm opened to bring the browser window in front of the screen. Click on the dashboard to prevent it from appearing again.'); + } + + }, + + notifyAll: function () { + // console.log('FETCHING ALARM LOG'); + NETDATA.alarms.get_log(NETDATA.alarms.last_notification_id, function (data) { + // console.log('ALARM LOG FETCHED'); + + if (data === null || typeof data !== 'object') { + console.log('invalid alarms log response'); + return; + } + + if (data.length === 0) { + console.log('received empty alarm log'); + return; + } + + // console.log('received alarm log of ' + data.length + ' entries, from ' + data[data.length - 1].unique_id.toString() + ' to ' + data[0].unique_id.toString()); + + data.sort(function (a, b) { + if (a.unique_id > b.unique_id) { + return -1; + } + if (a.unique_id < b.unique_id) { + return 1; + } + return 0; + }); + + NETDATA.alarms.ms_penalty = 0; + + let len = data.length; + while (len--) { + if (data[len].unique_id > NETDATA.alarms.last_notification_id) { + NETDATA.alarms.notify(data[len]); + } + //else + // console.log('ignoring alarm (older) with id ' + data[len].unique_id.toString()); + } + + NETDATA.alarms.last_notification_id = data[0].unique_id; + + if (typeof netdataAlarmsRemember === 'undefined' || netdataAlarmsRemember) { + NETDATA.localStorageSet('last_notification_id', NETDATA.alarms.last_notification_id, null); + } + // console.log('last notification id = ' + NETDATA.alarms.last_notification_id); + }) + }, + + check_notifications: function () { + // returns true if we should fire 1+ notifications + + if (NETDATA.alarms.notifications !== true) { + // console.log('web notifications are not available'); + return false; + } + + if (Notification.permission !== 'granted') { + // console.log('web notifications are not granted'); + return false; + } + + if (typeof NETDATA.alarms.current !== 'undefined' && typeof NETDATA.alarms.current.alarms === 'object') { + // console.log('can do alarms: old id = ' + NETDATA.alarms.last_notification_id + ' new id = ' + NETDATA.alarms.current.latest_alarm_log_unique_id); + + if (NETDATA.alarms.current.latest_alarm_log_unique_id > NETDATA.alarms.last_notification_id) { + // console.log('new alarms detected'); + return true; + } + //else console.log('no new alarms'); + } + // else console.log('cannot process alarms'); + + return false; + }, + + get: function (what, callback) { + $.ajax({ + url: NETDATA.alarms.server + '/api/v1/alarms?' + what.toString(), + async: true, + cache: false, + headers: { + 'Cache-Control': 'no-cache, no-store', + 'Pragma': 'no-cache' + }, + xhrFields: {withCredentials: true} // required for the cookie + }) + .done(function (data) { + data = NETDATA.xss.checkOptional('/api/v1/alarms', data /*, '.*\.(calc|calc_parsed|warn|warn_parsed|crit|crit_parsed)$' */); + + if (NETDATA.alarms.first_notification_id === 0 && typeof data.latest_alarm_log_unique_id === 'number') { + NETDATA.alarms.first_notification_id = data.latest_alarm_log_unique_id; + } + + if (typeof callback === 'function') { + return callback(data); + } + }) + .fail(function () { + NETDATA.error(415, NETDATA.alarms.server); + + if (typeof callback === 'function') { + return callback(null); + } + }); + }, + + update_forever: function () { + if (netdataShowAlarms !== true || netdataSnapshotData !== null) { + return; + } + + NETDATA.alarms.get('active', function (data) { + if (data !== null) { + NETDATA.alarms.current = data; + + if (NETDATA.alarms.check_notifications()) { + NETDATA.alarms.notifyAll(); + } + + if (typeof NETDATA.alarms.callback === 'function') { + NETDATA.alarms.callback(data); + } + + // Health monitoring is disabled on this netdata + if (data.status === false) { + return; + } + } + + setTimeout(NETDATA.alarms.update_forever, NETDATA.alarms.update_every); + }); + }, + + get_log: function (last_id, callback) { + // console.log('fetching all log after ' + last_id.toString()); + $.ajax({ + url: NETDATA.alarms.server + '/api/v1/alarm_log?after=' + last_id.toString(), + async: true, + cache: false, + headers: { + 'Cache-Control': 'no-cache, no-store', + 'Pragma': 'no-cache' + }, + xhrFields: {withCredentials: true} // required for the cookie + }) + .done(function (data) { + data = NETDATA.xss.checkOptional('/api/v1/alarm_log', data); + + if (typeof callback === 'function') { + return callback(data); + } + }) + .fail(function () { + NETDATA.error(416, NETDATA.alarms.server); + + if (typeof callback === 'function') { + return callback(null); + } + }); + }, + + init: function () { + NETDATA.alarms.server = NETDATA.fixHost(NETDATA.serverDefault); + + if (typeof netdataAlarmsRemember === 'undefined' || netdataAlarmsRemember) { + NETDATA.alarms.last_notification_id = + NETDATA.localStorageGet('last_notification_id', NETDATA.alarms.last_notification_id, null); + } + + if (NETDATA.alarms.onclick === null) { + NETDATA.alarms.onclick = NETDATA.alarms.scrollToAlarm; + } + + if (typeof netdataAlarmsRecipients !== 'undefined' && Array.isArray(netdataAlarmsRecipients)) { + NETDATA.alarms.recipients = netdataAlarmsRecipients; + } + + if (netdataShowAlarms) { + NETDATA.alarms.update_forever(); + + if ('Notification' in window) { + // console.log('notifications available'); + NETDATA.alarms.notifications = true; + + if (Notification.permission === 'default') { + Notification.requestPermission(); + } + } + } + } +}; diff --git a/web/gui/src/dashboard.js/boot.js b/web/gui/src/dashboard.js/boot.js new file mode 100644 index 000000000..c448213b3 --- /dev/null +++ b/web/gui/src/dashboard.js/boot.js @@ -0,0 +1,142 @@ + +// Load required JS libraries and CSS + +NETDATA.requiredJs = [ + { + url: NETDATA.serverStatic + 'lib/bootstrap-3.3.7.min.js', + async: false, + isAlreadyLoaded: function () { + // check if bootstrap is loaded + if (typeof $().emulateTransitionEnd === 'function') { + return true; + } else { + return typeof netdataNoBootstrap !== 'undefined' && netdataNoBootstrap; + } + } + }, + { + url: NETDATA.serverStatic + 'lib/fontawesome-all-5.0.1.min.js', + async: true, + isAlreadyLoaded: function () { + return typeof netdataNoFontAwesome !== 'undefined' && netdataNoFontAwesome; + } + }, + { + url: NETDATA.serverStatic + 'lib/perfect-scrollbar-0.6.15.min.js', + isAlreadyLoaded: function () { + return false; + } + } +]; + +NETDATA.requiredCSS = [ + { + url: NETDATA.themes.current.bootstrap_css, + isAlreadyLoaded: function () { + return typeof netdataNoBootstrap !== 'undefined' && netdataNoBootstrap; + } + }, + { + url: NETDATA.themes.current.dashboard_css, + isAlreadyLoaded: function () { + return false; + } + } +]; + +NETDATA.loadedRequiredJs = 0; +NETDATA.loadRequiredJs = function (index, callback) { + if (index >= NETDATA.requiredJs.length) { + if (typeof callback === 'function') { + return callback(); + } + return; + } + + if (NETDATA.requiredJs[index].isAlreadyLoaded()) { + NETDATA.loadedRequiredJs++; + NETDATA.loadRequiredJs(++index, callback); + return; + } + + if (NETDATA.options.debug.main_loop) { + console.log('loading ' + NETDATA.requiredJs[index].url); + } + + let async = true; + if (typeof NETDATA.requiredJs[index].async !== 'undefined' && NETDATA.requiredJs[index].async === false) { + async = false; + } + + $.ajax({ + url: NETDATA.requiredJs[index].url, + cache: true, + dataType: "script", + xhrFields: {withCredentials: true} // required for the cookie + }) + .done(function () { + if (NETDATA.options.debug.main_loop) { + console.log('loaded ' + NETDATA.requiredJs[index].url); + } + }) + .fail(function () { + alert('Cannot load required JS library: ' + NETDATA.requiredJs[index].url); + }) + .always(function () { + NETDATA.loadedRequiredJs++; + + // if (async === false) + if (!async) { + NETDATA.loadRequiredJs(++index, callback); + } + }); + + // if (async === true) + if (async) { + NETDATA.loadRequiredJs(++index, callback); + } +}; + +NETDATA.loadRequiredCSS = function (index) { + if (index >= NETDATA.requiredCSS.length) { + return; + } + + if (NETDATA.requiredCSS[index].isAlreadyLoaded()) { + NETDATA.loadRequiredCSS(++index); + return; + } + + if (NETDATA.options.debug.main_loop) { + console.log('loading ' + NETDATA.requiredCSS[index].url); + } + + NETDATA._loadCSS(NETDATA.requiredCSS[index].url); + NETDATA.loadRequiredCSS(++index); +}; + +// Boot it! + +if (typeof netdataPrepCallback === 'function') { + netdataPrepCallback(); +} + +NETDATA.errorReset(); +NETDATA.loadRequiredCSS(0); + +NETDATA._loadjQuery(function () { + NETDATA.loadRequiredJs(0, function () { + if (typeof $().emulateTransitionEnd !== 'function') { + // bootstrap is not available + NETDATA.options.current.show_help = false; + } + + if (typeof netdataDontStart === 'undefined' || !netdataDontStart) { + if (NETDATA.options.debug.main_loop) { + console.log('starting chart refresh thread'); + } + + NETDATA.start(); + } + }); +}); diff --git a/web/gui/src/dashboard.js/chart-registry.js b/web/gui/src/dashboard.js/chart-registry.js new file mode 100644 index 000000000..542f4e016 --- /dev/null +++ b/web/gui/src/dashboard.js/chart-registry.js @@ -0,0 +1,94 @@ + +// *** src/dashboard.js/chart-registry.js + +// Chart Registry + +// When multiple charts need the same chart, we avoid downloading it +// multiple times (and having it in browser memory multiple time) +// by using this registry. + +// Every time we download a chart definition, we save it here with .add() +// Then we try to get it back with .get(). If that fails, we download it. + +NETDATA.fixHost = function (host) { + while (host.slice(-1) === '/') { + host = host.substring(0, host.length - 1); + } + + return host; +}; + +NETDATA.chartRegistry = { + charts: {}, + + globalReset: function () { + this.charts = {}; + }, + + add: function (host, id, data) { + if (typeof this.charts[host] === 'undefined') { + this.charts[host] = {}; + } + + //console.log('added ' + host + '/' + id); + this.charts[host][id] = data; + }, + + get: function (host, id) { + if (typeof this.charts[host] === 'undefined') { + return null; + } + + if (typeof this.charts[host][id] === 'undefined') { + return null; + } + + //console.log('cached ' + host + '/' + id); + return this.charts[host][id]; + }, + + downloadAll: function (host, callback) { + host = NETDATA.fixHost(host); + + let self = this; + + function got_data(h, data, callback) { + if (data !== null) { + self.charts[h] = data.charts; + + // update the server timezone in our options + if (typeof data.timezone === 'string') { + NETDATA.options.server_timezone = data.timezone; + } + } else { + NETDATA.error(406, h + '/api/v1/charts'); + } + + if (typeof callback === 'function') { + callback(data); + } + } + + if (netdataSnapshotData !== null) { + got_data(host, netdataSnapshotData.charts, callback); + } else { + $.ajax({ + url: host + '/api/v1/charts', + async: true, + cache: false, + xhrFields: {withCredentials: true} // required for the cookie + }) + .done(function (data) { + data = NETDATA.xss.checkOptional('/api/v1/charts', data); + got_data(host, data, callback); + }) + .fail(function () { + NETDATA.error(405, host + '/api/v1/charts'); + + if (typeof callback === 'function') { + callback(null); + } + }); + } + } +}; diff --git a/web/gui/src/dashboard.js/charting.js b/web/gui/src/dashboard.js/charting.js new file mode 100644 index 000000000..e2e44b715 --- /dev/null +++ b/web/gui/src/dashboard.js/charting.js @@ -0,0 +1,450 @@ + +// Charts Libraries Registration + +NETDATA.chartLibraries = { + "dygraph": { + initialize: NETDATA.dygraphInitialize, + create: NETDATA.dygraphChartCreate, + update: NETDATA.dygraphChartUpdate, + resize: function (state) { + if (typeof state.tmp.dygraph_instance !== 'undefined' && typeof state.tmp.dygraph_instance.resize === 'function') { + state.tmp.dygraph_instance.resize(); + } + }, + setSelection: NETDATA.dygraphSetSelection, + clearSelection: NETDATA.dygraphClearSelection, + toolboxPanAndZoom: NETDATA.dygraphToolboxPanAndZoom, + initialized: false, + enabled: true, + xssRegexIgnore: new RegExp('^/api/v1/data\.result.data$'), + format: function (state) { + void(state); + return 'json'; + }, + options: function (state) { + return 'ms' + '%7C' + 'flip' + (this.isLogScale(state) ? ('%7C' + 'abs') : '').toString(); + }, + legend: function (state) { + return (this.isSparkline(state) === false && NETDATA.dataAttributeBoolean(state.element, 'legend', true) === true) ? 'right-side' : null; + }, + autoresize: function (state) { + void(state); + return true; + }, + max_updates_to_recreate: function (state) { + void(state); + return 5000; + }, + track_colors: function (state) { + void(state); + return true; + }, + pixels_per_point: function (state) { + return (this.isSparkline(state) === false) ? 3 : 2; + }, + isSparkline: function (state) { + if (typeof state.tmp.dygraph_sparkline === 'undefined') { + state.tmp.dygraph_sparkline = (this.theme(state) === 'sparkline'); + } + return state.tmp.dygraph_sparkline; + }, + isLogScale: function (state) { + if (typeof state.tmp.dygraph_logscale === 'undefined') { + state.tmp.dygraph_logscale = (this.theme(state) === 'logscale'); + } + return state.tmp.dygraph_logscale; + }, + theme: function (state) { + if (typeof state.tmp.dygraph_theme === 'undefined') { + state.tmp.dygraph_theme = NETDATA.dataAttribute(state.element, 'dygraph-theme', 'default'); + } + return state.tmp.dygraph_theme; + }, + container_class: function (state) { + if (this.legend(state) !== null) { + return 'netdata-container-with-legend'; + } + return 'netdata-container'; + } + }, + "sparkline": { + initialize: NETDATA.sparklineInitialize, + create: NETDATA.sparklineChartCreate, + update: NETDATA.sparklineChartUpdate, + resize: null, + setSelection: undefined, // function(state, t) { void(state); return true; }, + clearSelection: undefined, // function(state) { void(state); return true; }, + toolboxPanAndZoom: null, + initialized: false, + enabled: true, + xssRegexIgnore: new RegExp('^/api/v1/data\.result$'), + format: function (state) { + void(state); + return 'array'; + }, + options: function (state) { + void(state); + return 'flip' + '%7C' + 'abs'; + }, + legend: function (state) { + void(state); + return null; + }, + autoresize: function (state) { + void(state); + return false; + }, + max_updates_to_recreate: function (state) { + void(state); + return 5000; + }, + track_colors: function (state) { + void(state); + return false; + }, + pixels_per_point: function (state) { + void(state); + return 3; + }, + container_class: function (state) { + void(state); + return 'netdata-container'; + } + }, + "peity": { + initialize: NETDATA.peityInitialize, + create: NETDATA.peityChartCreate, + update: NETDATA.peityChartUpdate, + resize: null, + setSelection: undefined, // function(state, t) { void(state); return true; }, + clearSelection: undefined, // function(state) { void(state); return true; }, + toolboxPanAndZoom: null, + initialized: false, + enabled: true, + xssRegexIgnore: new RegExp('^/api/v1/data\.result$'), + format: function (state) { + void(state); + return 'ssvcomma'; + }, + options: function (state) { + void(state); + return 'null2zero' + '%7C' + 'flip' + '%7C' + 'abs'; + }, + legend: function (state) { + void(state); + return null; + }, + autoresize: function (state) { + void(state); + return false; + }, + max_updates_to_recreate: function (state) { + void(state); + return 5000; + }, + track_colors: function (state) { + void(state); + return false; + }, + pixels_per_point: function (state) { + void(state); + return 3; + }, + container_class: function (state) { + void(state); + return 'netdata-container'; + } + }, + // "morris": { + // initialize: NETDATA.morrisInitialize, + // create: NETDATA.morrisChartCreate, + // update: NETDATA.morrisChartUpdate, + // resize: null, + // setSelection: undefined, // function(state, t) { void(state); return true; }, + // clearSelection: undefined, // function(state) { void(state); return true; }, + // toolboxPanAndZoom: null, + // initialized: false, + // enabled: true, + // xssRegexIgnore: new RegExp('^/api/v1/data\.result.data$'), + // format: function(state) { void(state); return 'json'; }, + // options: function(state) { void(state); return 'objectrows' + '%7C' + 'ms'; }, + // legend: function(state) { void(state); return null; }, + // autoresize: function(state) { void(state); return false; }, + // max_updates_to_recreate: function(state) { void(state); return 50; }, + // track_colors: function(state) { void(state); return false; }, + // pixels_per_point: function(state) { void(state); return 15; }, + // container_class: function(state) { void(state); return 'netdata-container'; } + // }, + "google": { + initialize: NETDATA.googleInitialize, + create: NETDATA.googleChartCreate, + update: NETDATA.googleChartUpdate, + resize: null, + setSelection: undefined, //function(state, t) { void(state); return true; }, + clearSelection: undefined, //function(state) { void(state); return true; }, + toolboxPanAndZoom: null, + initialized: false, + enabled: true, + xssRegexIgnore: new RegExp('^/api/v1/data\.result.rows$'), + format: function (state) { + void(state); + return 'datatable'; + }, + options: function (state) { + void(state); + return ''; + }, + legend: function (state) { + void(state); + return null; + }, + autoresize: function (state) { + void(state); + return false; + }, + max_updates_to_recreate: function (state) { + void(state); + return 300; + }, + track_colors: function (state) { + void(state); + return false; + }, + pixels_per_point: function (state) { + void(state); + return 4; + }, + container_class: function (state) { + void(state); + return 'netdata-container'; + } + }, + // "raphael": { + // initialize: NETDATA.raphaelInitialize, + // create: NETDATA.raphaelChartCreate, + // update: NETDATA.raphaelChartUpdate, + // resize: null, + // setSelection: undefined, // function(state, t) { void(state); return true; }, + // clearSelection: undefined, // function(state) { void(state); return true; }, + // toolboxPanAndZoom: null, + // initialized: false, + // enabled: true, + // xssRegexIgnore: new RegExp('^/api/v1/data\.result.data$'), + // format: function(state) { void(state); return 'json'; }, + // options: function(state) { void(state); return ''; }, + // legend: function(state) { void(state); return null; }, + // autoresize: function(state) { void(state); return false; }, + // max_updates_to_recreate: function(state) { void(state); return 5000; }, + // track_colors: function(state) { void(state); return false; }, + // pixels_per_point: function(state) { void(state); return 3; }, + // container_class: function(state) { void(state); return 'netdata-container'; } + // }, + // "c3": { + // initialize: NETDATA.c3Initialize, + // create: NETDATA.c3ChartCreate, + // update: NETDATA.c3ChartUpdate, + // resize: null, + // setSelection: undefined, // function(state, t) { void(state); return true; }, + // clearSelection: undefined, // function(state) { void(state); return true; }, + // toolboxPanAndZoom: null, + // initialized: false, + // enabled: true, + // xssRegexIgnore: new RegExp('^/api/v1/data\.result$'), + // format: function(state) { void(state); return 'csvjsonarray'; }, + // options: function(state) { void(state); return 'milliseconds'; }, + // legend: function(state) { void(state); return null; }, + // autoresize: function(state) { void(state); return false; }, + // max_updates_to_recreate: function(state) { void(state); return 5000; }, + // track_colors: function(state) { void(state); return false; }, + // pixels_per_point: function(state) { void(state); return 15; }, + // container_class: function(state) { void(state); return 'netdata-container'; } + // }, + "d3pie": { + initialize: NETDATA.d3pieInitialize, + create: NETDATA.d3pieChartCreate, + update: NETDATA.d3pieChartUpdate, + resize: null, + setSelection: NETDATA.d3pieSetSelection, + clearSelection: NETDATA.d3pieClearSelection, + toolboxPanAndZoom: null, + initialized: false, + enabled: true, + xssRegexIgnore: new RegExp('^/api/v1/data\.result.data$'), + format: function (state) { + void(state); + return 'json'; + }, + options: function (state) { + void(state); + return 'objectrows' + '%7C' + 'ms'; + }, + legend: function (state) { + void(state); + return null; + }, + autoresize: function (state) { + void(state); + return false; + }, + max_updates_to_recreate: function (state) { + void(state); + return 5000; + }, + track_colors: function (state) { + void(state); + return false; + }, + pixels_per_point: function (state) { + void(state); + return 15; + }, + container_class: function (state) { + void(state); + return 'netdata-container'; + } + }, + "d3": { + initialize: NETDATA.d3Initialize, + create: NETDATA.d3ChartCreate, + update: NETDATA.d3ChartUpdate, + resize: null, + setSelection: undefined, // function(state, t) { void(state); return true; }, + clearSelection: undefined, // function(state) { void(state); return true; }, + toolboxPanAndZoom: null, + initialized: false, + enabled: true, + xssRegexIgnore: new RegExp('^/api/v1/data\.result.data$'), + format: function (state) { + void(state); + return 'json'; + }, + options: function (state) { + void(state); + return ''; + }, + legend: function (state) { + void(state); + return null; + }, + autoresize: function (state) { + void(state); + return false; + }, + max_updates_to_recreate: function (state) { + void(state); + return 5000; + }, + track_colors: function (state) { + void(state); + return false; + }, + pixels_per_point: function (state) { + void(state); + return 3; + }, + container_class: function (state) { + void(state); + return 'netdata-container'; + } + }, + "easypiechart": { + initialize: NETDATA.easypiechartInitialize, + create: NETDATA.easypiechartChartCreate, + update: NETDATA.easypiechartChartUpdate, + resize: null, + setSelection: NETDATA.easypiechartSetSelection, + clearSelection: NETDATA.easypiechartClearSelection, + toolboxPanAndZoom: null, + initialized: false, + enabled: true, + xssRegexIgnore: new RegExp('^/api/v1/data\.result$'), + format: function (state) { + void(state); + return 'array'; + }, + options: function (state) { + void(state); + return 'absolute'; + }, + legend: function (state) { + void(state); + return null; + }, + autoresize: function (state) { + void(state); + return false; + }, + max_updates_to_recreate: function (state) { + void(state); + return 5000; + }, + track_colors: function (state) { + void(state); + return true; + }, + pixels_per_point: function (state) { + void(state); + return 3; + }, + aspect_ratio: 100, + container_class: function (state) { + void(state); + return 'netdata-container-easypiechart'; + } + }, + "gauge": { + initialize: NETDATA.gaugeInitialize, + create: NETDATA.gaugeChartCreate, + update: NETDATA.gaugeChartUpdate, + resize: null, + setSelection: NETDATA.gaugeSetSelection, + clearSelection: NETDATA.gaugeClearSelection, + toolboxPanAndZoom: null, + initialized: false, + enabled: true, + xssRegexIgnore: new RegExp('^/api/v1/data\.result$'), + format: function (state) { + void(state); + return 'array'; + }, + options: function (state) { + void(state); + return 'absolute'; + }, + legend: function (state) { + void(state); + return null; + }, + autoresize: function (state) { + void(state); + return false; + }, + max_updates_to_recreate: function (state) { + void(state); + return 5000; + }, + track_colors: function (state) { + void(state); + return true; + }, + pixels_per_point: function (state) { + void(state); + return 3; + }, + aspect_ratio: 60, + container_class: function (state) { + void(state); + return 'netdata-container-gauge'; + } + } +}; + +NETDATA.registerChartLibrary = function (library, url) { + if (NETDATA.options.debug.libraries) { + console.log("registering chart library: " + library); + } + + NETDATA.chartLibraries[library].url = url; + NETDATA.chartLibraries[library].initialized = true; + NETDATA.chartLibraries[library].enabled = true; +}; diff --git a/web/gui/src/dashboard.js/charting/d3.js b/web/gui/src/dashboard.js/charting/d3.js new file mode 100644 index 000000000..6528208cf --- /dev/null +++ b/web/gui/src/dashboard.js/charting/d3.js @@ -0,0 +1,43 @@ + +// ---------------------------------------------------------------------------------------------------------------- +// D3 + +NETDATA.d3Initialize = function(callback) { + if (typeof netdataStopD3 === 'undefined' || !netdataStopD3) { + $.ajax({ + url: NETDATA.d3_js, + cache: true, + dataType: "script", + xhrFields: { withCredentials: true } // required for the cookie + }) + .done(function() { + NETDATA.registerChartLibrary('d3', NETDATA.d3_js); + }) + .fail(function() { + NETDATA.chartLibraries.d3.enabled = false; + NETDATA.error(100, NETDATA.d3_js); + }) + .always(function() { + if (typeof callback === "function") + return callback(); + }); + } else { + NETDATA.chartLibraries.d3.enabled = false; + if (typeof callback === "function") + return callback(); + } +}; + +NETDATA.d3ChartUpdate = function(state, data) { + void(state); + void(data); + + return false; +}; + +NETDATA.d3ChartCreate = function(state, data) { + void(state); + void(data); + + return false; +}; diff --git a/web/gui/src/dashboard.js/charting/d3pie.js b/web/gui/src/dashboard.js/charting/d3pie.js new file mode 100644 index 000000000..27cff8542 --- /dev/null +++ b/web/gui/src/dashboard.js/charting/d3pie.js @@ -0,0 +1,341 @@ + +// d3pie + +NETDATA.d3pieInitialize = function (callback) { + if (typeof netdataNoD3pie === 'undefined' || !netdataNoD3pie) { + + // d3pie requires D3 + if (!NETDATA.chartLibraries.d3.initialized) { + if (NETDATA.chartLibraries.d3.enabled) { + NETDATA.d3Initialize(function () { + NETDATA.d3pieInitialize(callback); + }); + } else { + NETDATA.chartLibraries.d3pie.enabled = false; + if (typeof callback === "function") { + return callback(); + } + } + } else { + $.ajax({ + url: NETDATA.d3pie_js, + cache: true, + dataType: "script", + xhrFields: {withCredentials: true} // required for the cookie + }) + .done(function () { + NETDATA.registerChartLibrary('d3pie', NETDATA.d3pie_js); + }) + .fail(function () { + NETDATA.chartLibraries.d3pie.enabled = false; + NETDATA.error(100, NETDATA.d3pie_js); + }) + .always(function () { + if (typeof callback === "function") { + return callback(); + } + }); + } + } else { + NETDATA.chartLibraries.d3pie.enabled = false; + if (typeof callback === "function") { + return callback(); + } + } +}; + +NETDATA.d3pieSetContent = function (state, data, index) { + state.legendFormatValueDecimalsFromMinMax( + data.min, + data.max + ); + + let content = []; + let colors = state.chartColors(); + let len = data.result.labels.length; + for (let i = 1; i < len; i++) { + let label = data.result.labels[i]; + let value = data.result.data[index][label]; + let color = colors[i - 1]; + + if (value !== null && value > 0) { + content.push({ + label: label, + value: value, + color: color + }); + } + } + + if (content.length === 0) { + content.push({ + label: 'no data', + value: 100, + color: '#666666' + }); + } + + state.tmp.d3pie_last_slot = index; + return content; +}; + +NETDATA.d3pieDateRange = function (state, data, index) { + let dt = Math.round((data.before - data.after + 1) / data.points); + let dt_str = NETDATA.seconds4human(dt); + + let before = data.result.data[index].time; + let after = before - (dt * 1000); + + let d1 = NETDATA.dateTime.localeDateString(after); + let t1 = NETDATA.dateTime.localeTimeString(after); + let d2 = NETDATA.dateTime.localeDateString(before); + let t2 = NETDATA.dateTime.localeTimeString(before); + + if (d1 === d2) { + return d1 + ' ' + t1 + ' to ' + t2 + ', ' + dt_str; + } + + return d1 + ' ' + t1 + ' to ' + d2 + ' ' + t2 + ', ' + dt_str; +}; + +NETDATA.d3pieSetSelection = function (state, t) { + if (state.timeIsVisible(t) !== true) { + return NETDATA.d3pieClearSelection(state, true); + } + + let slot = state.calculateRowForTime(t); + slot = state.data.result.data.length - slot - 1; + + if (slot < 0 || slot >= state.data.result.length) { + return NETDATA.d3pieClearSelection(state, true); + } + + if (state.tmp.d3pie_last_slot === slot) { + // we already show this slot, don't do anything + return true; + } + + if (state.tmp.d3pie_timer === undefined) { + state.tmp.d3pie_timer = NETDATA.timeout.set(function () { + state.tmp.d3pie_timer = undefined; + NETDATA.d3pieChange(state, NETDATA.d3pieSetContent(state, state.data, slot), NETDATA.d3pieDateRange(state, state.data, slot)); + }, 0); + } + + return true; +}; + +NETDATA.d3pieClearSelection = function (state, force) { + if (typeof state.tmp.d3pie_timer !== 'undefined') { + NETDATA.timeout.clear(state.tmp.d3pie_timer); + state.tmp.d3pie_timer = undefined; + } + + if (state.isAutoRefreshable() && state.data !== null && force !== true) { + NETDATA.d3pieChartUpdate(state, state.data); + } else { + if (state.tmp.d3pie_last_slot !== -1) { + state.tmp.d3pie_last_slot = -1; + NETDATA.d3pieChange(state, [{label: 'no data', value: 1, color: '#666666'}], 'no data available'); + } + } + + return true; +}; + +NETDATA.d3pieChange = function (state, content, footer) { + if (state.d3pie_forced_subtitle === null) { + //state.d3pie_instance.updateProp("header.subtitle.text", state.units_current); + state.d3pie_instance.options.header.subtitle.text = state.units_current; + } + + if (state.d3pie_forced_footer === null) { + //state.d3pie_instance.updateProp("footer.text", footer); + state.d3pie_instance.options.footer.text = footer; + } + + //state.d3pie_instance.updateProp("data.content", content); + state.d3pie_instance.options.data.content = content; + state.d3pie_instance.destroy(); + state.d3pie_instance.recreate(); + return true; +}; + +NETDATA.d3pieChartUpdate = function (state, data) { + return NETDATA.d3pieChange(state, NETDATA.d3pieSetContent(state, data, 0), NETDATA.d3pieDateRange(state, data, 0)); +}; + +NETDATA.d3pieChartCreate = function (state, data) { + + state.element_chart.id = 'd3pie-' + state.uuid; + // console.log('id = ' + state.element_chart.id); + + let content = NETDATA.d3pieSetContent(state, data, 0); + + state.d3pie_forced_title = NETDATA.dataAttribute(state.element, 'd3pie-title', null); + state.d3pie_forced_subtitle = NETDATA.dataAttribute(state.element, 'd3pie-subtitle', null); + state.d3pie_forced_footer = NETDATA.dataAttribute(state.element, 'd3pie-footer', null); + + state.d3pie_options = { + header: { + title: { + text: (state.d3pie_forced_title !== null) ? state.d3pie_forced_title : state.title, + color: NETDATA.dataAttribute(state.element, 'd3pie-title-color', NETDATA.themes.current.d3pie.title), + fontSize: NETDATA.dataAttribute(state.element, 'd3pie-title-fontsize', 12), + fontWeight: NETDATA.dataAttribute(state.element, 'd3pie-title-fontweight', "bold"), + font: NETDATA.dataAttribute(state.element, 'd3pie-title-font', "arial") + }, + subtitle: { + text: (state.d3pie_forced_subtitle !== null) ? state.d3pie_forced_subtitle : state.units_current, + color: NETDATA.dataAttribute(state.element, 'd3pie-subtitle-color', NETDATA.themes.current.d3pie.subtitle), + fontSize: NETDATA.dataAttribute(state.element, 'd3pie-subtitle-fontsize', 10), + fontWeight: NETDATA.dataAttribute(state.element, 'd3pie-subtitle-fontweight', "normal"), + font: NETDATA.dataAttribute(state.element, 'd3pie-subtitle-font', "arial") + }, + titleSubtitlePadding: 1 + }, + footer: { + text: (state.d3pie_forced_footer !== null) ? state.d3pie_forced_footer : NETDATA.d3pieDateRange(state, data, 0), + color: NETDATA.dataAttribute(state.element, 'd3pie-footer-color', NETDATA.themes.current.d3pie.footer), + fontSize: NETDATA.dataAttribute(state.element, 'd3pie-footer-fontsize', 9), + fontWeight: NETDATA.dataAttribute(state.element, 'd3pie-footer-fontweight', "bold"), + font: NETDATA.dataAttribute(state.element, 'd3pie-footer-font', "arial"), + location: NETDATA.dataAttribute(state.element, 'd3pie-footer-location', "bottom-center") // bottom-left, bottom-center, bottom-right + }, + size: { + canvasHeight: state.chartHeight(), + canvasWidth: state.chartWidth(), + pieInnerRadius: NETDATA.dataAttribute(state.element, 'd3pie-pieinnerradius', "45%"), + pieOuterRadius: NETDATA.dataAttribute(state.element, 'd3pie-pieouterradius', "80%") + }, + data: { + // none, random, value-asc, value-desc, label-asc, label-desc + sortOrder: NETDATA.dataAttribute(state.element, 'd3pie-sortorder', "value-desc"), + smallSegmentGrouping: { + enabled: NETDATA.dataAttributeBoolean(state.element, "d3pie-smallsegmentgrouping-enabled", false), + value: NETDATA.dataAttribute(state.element, 'd3pie-smallsegmentgrouping-value', 1), + // percentage, value + valueType: NETDATA.dataAttribute(state.element, 'd3pie-smallsegmentgrouping-valuetype', "percentage"), + label: NETDATA.dataAttribute(state.element, 'd3pie-smallsegmentgrouping-label', "other"), + color: NETDATA.dataAttribute(state.element, 'd3pie-smallsegmentgrouping-color', NETDATA.themes.current.d3pie.other) + }, + + // REQUIRED! This is where you enter your pie data; it needs to be an array of objects + // of this form: { label: "label", value: 1.5, color: "#000000" } - color is optional + content: content + }, + labels: { + outer: { + // label, value, percentage, label-value1, label-value2, label-percentage1, label-percentage2 + format: NETDATA.dataAttribute(state.element, 'd3pie-labels-outer-format', "label-value1"), + hideWhenLessThanPercentage: NETDATA.dataAttribute(state.element, 'd3pie-labels-outer-hidewhenlessthanpercentage', null), + pieDistance: NETDATA.dataAttribute(state.element, 'd3pie-labels-outer-piedistance', 15) + }, + inner: { + // label, value, percentage, label-value1, label-value2, label-percentage1, label-percentage2 + format: NETDATA.dataAttribute(state.element, 'd3pie-labels-inner-format', "percentage"), + hideWhenLessThanPercentage: NETDATA.dataAttribute(state.element, 'd3pie-labels-inner-hidewhenlessthanpercentage', 2) + }, + mainLabel: { + color: NETDATA.dataAttribute(state.element, 'd3pie-labels-mainLabel-color', NETDATA.themes.current.d3pie.mainlabel), // or 'segment' for dynamic color + font: NETDATA.dataAttribute(state.element, 'd3pie-labels-mainLabel-font', "arial"), + fontSize: NETDATA.dataAttribute(state.element, 'd3pie-labels-mainLabel-fontsize', 10), + fontWeight: NETDATA.dataAttribute(state.element, 'd3pie-labels-mainLabel-fontweight', "normal") + }, + percentage: { + color: NETDATA.dataAttribute(state.element, 'd3pie-labels-percentage-color', NETDATA.themes.current.d3pie.percentage), + font: NETDATA.dataAttribute(state.element, 'd3pie-labels-percentage-font', "arial"), + fontSize: NETDATA.dataAttribute(state.element, 'd3pie-labels-percentage-fontsize', 10), + fontWeight: NETDATA.dataAttribute(state.element, 'd3pie-labels-percentage-fontweight', "bold"), + decimalPlaces: 0 + }, + value: { + color: NETDATA.dataAttribute(state.element, 'd3pie-labels-value-color', NETDATA.themes.current.d3pie.value), + font: NETDATA.dataAttribute(state.element, 'd3pie-labels-value-font', "arial"), + fontSize: NETDATA.dataAttribute(state.element, 'd3pie-labels-value-fontsize', 10), + fontWeight: NETDATA.dataAttribute(state.element, 'd3pie-labels-value-fontweight', "bold") + }, + lines: { + enabled: NETDATA.dataAttributeBoolean(state.element, 'd3pie-labels-lines-enabled', true), + style: NETDATA.dataAttribute(state.element, 'd3pie-labels-lines-style', "curved"), + color: NETDATA.dataAttribute(state.element, 'd3pie-labels-lines-color', "segment") // "segment" or a hex color + }, + truncation: { + enabled: NETDATA.dataAttributeBoolean(state.element, 'd3pie-labels-truncation-enabled', false), + truncateLength: NETDATA.dataAttribute(state.element, 'd3pie-labels-truncation-truncatelength', 30) + }, + formatter: function (context) { + // console.log(context); + if (context.part === 'value') { + return state.legendFormatValue(context.value); + } + if (context.part === 'percentage') { + return context.label + '%'; + } + + return context.label; + } + }, + effects: { + load: { + effect: "none", // none / default + speed: 0 // commented in the d3pie code to speed it up + }, + pullOutSegmentOnClick: { + effect: "bounce", // none / linear / bounce / elastic / back + speed: 400, + size: 5 + }, + highlightSegmentOnMouseover: true, + highlightLuminosity: -0.2 + }, + tooltips: { + enabled: false, + type: "placeholder", // caption|placeholder + string: "", + placeholderParser: null, // function + styles: { + fadeInSpeed: 250, + backgroundColor: NETDATA.themes.current.d3pie.tooltip_bg, + backgroundOpacity: 0.5, + color: NETDATA.themes.current.d3pie.tooltip_fg, + borderRadius: 2, + font: "arial", + fontSize: 12, + padding: 4 + } + }, + misc: { + colors: { + background: 'transparent', // transparent or color # + // segments: state.chartColors(), + segmentStroke: NETDATA.dataAttribute(state.element, 'd3pie-misc-colors-segmentstroke', NETDATA.themes.current.d3pie.segment_stroke) + }, + gradient: { + enabled: NETDATA.dataAttributeBoolean(state.element, 'd3pie-misc-gradient-enabled', false), + percentage: NETDATA.dataAttribute(state.element, 'd3pie-misc-colors-percentage', 95), + color: NETDATA.dataAttribute(state.element, 'd3pie-misc-gradient-color', NETDATA.themes.current.d3pie.gradient_color) + }, + canvasPadding: { + top: 5, + right: 5, + bottom: 5, + left: 5 + }, + pieCenterOffset: { + x: 0, + y: 0 + }, + cssPrefix: NETDATA.dataAttribute(state.element, 'd3pie-cssprefix', null) + }, + callbacks: { + onload: null, + onMouseoverSegment: null, + onMouseoutSegment: null, + onClickSegment: null + } + }; + + state.d3pie_instance = new d3pie(state.element_chart, state.d3pie_options); + return true; +}; diff --git a/web/gui/src/dashboard.js/charting/dygraph.js b/web/gui/src/dashboard.js/charting/dygraph.js new file mode 100644 index 000000000..62cb466fc --- /dev/null +++ b/web/gui/src/dashboard.js/charting/dygraph.js @@ -0,0 +1,973 @@ +// dygraph + +NETDATA.dygraph = { + smooth: false +}; + +NETDATA.dygraphToolboxPanAndZoom = function (state, after, before) { + if (after < state.netdata_first) { + after = state.netdata_first; + } + + if (before > state.netdata_last) { + before = state.netdata_last; + } + + state.setMode('zoom'); + NETDATA.globalSelectionSync.stop(); + NETDATA.globalSelectionSync.delay(); + state.tmp.dygraph_user_action = true; + state.tmp.dygraph_force_zoom = true; + // state.log('toolboxPanAndZoom'); + state.updateChartPanOrZoom(after, before); + NETDATA.globalPanAndZoom.setMaster(state, after, before); +}; + +NETDATA.dygraphSetSelection = function (state, t) { + if (typeof state.tmp.dygraph_instance !== 'undefined') { + let r = state.calculateRowForTime(t); + if (r !== -1) { + state.tmp.dygraph_instance.setSelection(r); + return true; + } else { + state.tmp.dygraph_instance.clearSelection(); + state.legendShowUndefined(); + } + } + + return false; +}; + +NETDATA.dygraphClearSelection = function (state) { + if (typeof state.tmp.dygraph_instance !== 'undefined') { + state.tmp.dygraph_instance.clearSelection(); + } + return true; +}; + +NETDATA.dygraphSmoothInitialize = function (callback) { + $.ajax({ + url: NETDATA.dygraph_smooth_js, + cache: true, + dataType: "script", + xhrFields: {withCredentials: true} // required for the cookie + }) + .done(function () { + NETDATA.dygraph.smooth = true; + smoothPlotter.smoothing = 0.3; + }) + .fail(function () { + NETDATA.dygraph.smooth = false; + }) + .always(function () { + if (typeof callback === "function") { + return callback(); + } + }); +}; + +NETDATA.dygraphInitialize = function (callback) { + if (typeof netdataNoDygraphs === 'undefined' || !netdataNoDygraphs) { + $.ajax({ + url: NETDATA.dygraph_js, + cache: true, + dataType: "script", + xhrFields: {withCredentials: true} // required for the cookie + }) + .done(function () { + NETDATA.registerChartLibrary('dygraph', NETDATA.dygraph_js); + }) + .fail(function () { + NETDATA.chartLibraries.dygraph.enabled = false; + NETDATA.error(100, NETDATA.dygraph_js); + }) + .always(function () { + if (NETDATA.chartLibraries.dygraph.enabled && NETDATA.options.current.smooth_plot) { + NETDATA.dygraphSmoothInitialize(callback); + } else if (typeof callback === "function") { + return callback(); + } + }); + } else { + NETDATA.chartLibraries.dygraph.enabled = false; + if (typeof callback === "function") { + return callback(); + } + } +}; + +NETDATA.dygraphChartUpdate = function (state, data) { + let dygraph = state.tmp.dygraph_instance; + + if (typeof dygraph === 'undefined') { + return NETDATA.dygraphChartCreate(state, data); + } + + // when the chart is not visible, and hidden + // if there is a window resize, dygraph detects + // its element size as 0x0. + // this will make it re-appear properly + + if (state.tm.last_unhidden > state.tmp.dygraph_last_rendered) { + dygraph.resize(); + } + + let options = { + file: data.result.data, + colors: state.chartColors(), + labels: data.result.labels, + //labelsDivWidth: state.chartWidth() - 70, + includeZero: state.tmp.dygraph_include_zero, + visibility: state.dimensions_visibility.selected2BooleanArray(state.data.dimension_names) + }; + + if (state.tmp.dygraph_chart_type === 'stacked') { + if (options.includeZero && state.dimensions_visibility.countSelected() < options.visibility.length) { + options.includeZero = 0; + } + } + + if (!NETDATA.chartLibraries.dygraph.isSparkline(state)) { + options.ylabel = state.units_current; // (state.units_desired === 'auto')?"":state.units_current; + } + + if (state.tmp.dygraph_force_zoom) { + if (NETDATA.options.debug.dygraph || state.debug) { + state.log('dygraphChartUpdate() forced zoom update'); + } + + options.dateWindow = (state.requested_padding !== null) ? [state.view_after, state.view_before] : null; + //options.isZoomedIgnoreProgrammaticZoom = true; + state.tmp.dygraph_force_zoom = false; + } else if (state.current.name !== 'auto') { + if (NETDATA.options.debug.dygraph || state.debug) { + state.log('dygraphChartUpdate() loose update'); + } + } else { + if (NETDATA.options.debug.dygraph || state.debug) { + state.log('dygraphChartUpdate() strict update'); + } + + options.dateWindow = (state.requested_padding !== null) ? [state.view_after, state.view_before] : null; + //options.isZoomedIgnoreProgrammaticZoom = true; + } + + options.valueRange = state.tmp.dygraph_options.valueRange; + + let oldMax = null, oldMin = null; + if (state.tmp.__commonMin !== null) { + state.data.min = state.tmp.dygraph_instance.axes_[0].extremeRange[0]; + oldMin = options.valueRange[0] = NETDATA.commonMin.get(state); + } + if (state.tmp.__commonMax !== null) { + state.data.max = state.tmp.dygraph_instance.axes_[0].extremeRange[1]; + oldMax = options.valueRange[1] = NETDATA.commonMax.get(state); + } + + if (state.tmp.dygraph_smooth_eligible) { + if ((NETDATA.options.current.smooth_plot && state.tmp.dygraph_options.plotter !== smoothPlotter) + || (NETDATA.options.current.smooth_plot === false && state.tmp.dygraph_options.plotter === smoothPlotter)) { + NETDATA.dygraphChartCreate(state, data); + return; + } + } + + if (netdataSnapshotData !== null && NETDATA.globalPanAndZoom.isActive() && NETDATA.globalPanAndZoom.isMaster(state) === false) { + // pan and zoom on snapshots + options.dateWindow = [NETDATA.globalPanAndZoom.force_after_ms, NETDATA.globalPanAndZoom.force_before_ms]; + //options.isZoomedIgnoreProgrammaticZoom = true; + } + + if (NETDATA.chartLibraries.dygraph.isLogScale(state)) { + if (Array.isArray(options.valueRange) && options.valueRange[0] <= 0) { + options.valueRange[0] = null; + } + } + + dygraph.updateOptions(options); + + let redraw = false; + if (oldMin !== null && oldMin > state.tmp.dygraph_instance.axes_[0].extremeRange[0]) { + state.data.min = state.tmp.dygraph_instance.axes_[0].extremeRange[0]; + options.valueRange[0] = NETDATA.commonMin.get(state); + redraw = true; + } + if (oldMax !== null && oldMax < state.tmp.dygraph_instance.axes_[0].extremeRange[1]) { + state.data.max = state.tmp.dygraph_instance.axes_[0].extremeRange[1]; + options.valueRange[1] = NETDATA.commonMax.get(state); + redraw = true; + } + + if (redraw) { + // state.log('forcing redraw to adapt to common- min/max'); + dygraph.updateOptions(options); + } + + state.tmp.dygraph_last_rendered = Date.now(); + return true; +}; + +NETDATA.dygraphChartCreate = function (state, data) { + if (NETDATA.options.debug.dygraph || state.debug) { + state.log('dygraphChartCreate()'); + } + + state.tmp.dygraph_chart_type = NETDATA.dataAttribute(state.element, 'dygraph-type', state.chart.chart_type); + if (state.tmp.dygraph_chart_type === 'stacked' && data.dimensions === 1) { + state.tmp.dygraph_chart_type = 'area'; + } + if (state.tmp.dygraph_chart_type === 'stacked' && NETDATA.chartLibraries.dygraph.isLogScale(state)) { + state.tmp.dygraph_chart_type = 'area'; + } + + let highlightCircleSize = NETDATA.chartLibraries.dygraph.isSparkline(state) ? 3 : 4; + + let smooth = NETDATA.dygraph.smooth + ? (NETDATA.dataAttributeBoolean(state.element, 'dygraph-smooth', (state.tmp.dygraph_chart_type === 'line' && NETDATA.chartLibraries.dygraph.isSparkline(state) === false))) + : false; + + state.tmp.dygraph_include_zero = NETDATA.dataAttribute(state.element, 'dygraph-includezero', (state.tmp.dygraph_chart_type === 'stacked')); + let drawAxis = NETDATA.dataAttributeBoolean(state.element, 'dygraph-drawaxis', true); + + state.tmp.dygraph_options = { + colors: NETDATA.dataAttribute(state.element, 'dygraph-colors', state.chartColors()), + + // leave a few pixels empty on the right of the chart + rightGap: NETDATA.dataAttribute(state.element, 'dygraph-rightgap', 5), + showRangeSelector: NETDATA.dataAttributeBoolean(state.element, 'dygraph-showrangeselector', false), + showRoller: NETDATA.dataAttributeBoolean(state.element, 'dygraph-showroller', false), + title: NETDATA.dataAttribute(state.element, 'dygraph-title', state.title), + titleHeight: NETDATA.dataAttribute(state.element, 'dygraph-titleheight', 19), + legend: NETDATA.dataAttribute(state.element, 'dygraph-legend', 'always'), // we need this to get selection events + labels: data.result.labels, + labelsDiv: NETDATA.dataAttribute(state.element, 'dygraph-labelsdiv', state.element_legend_childs.hidden), + //labelsDivStyles: NETDATA.dataAttribute(state.element, 'dygraph-labelsdivstyles', { 'fontSize':'1px' }), + //labelsDivWidth: NETDATA.dataAttribute(state.element, 'dygraph-labelsdivwidth', state.chartWidth() - 70), + labelsSeparateLines: NETDATA.dataAttributeBoolean(state.element, 'dygraph-labelsseparatelines', true), + labelsShowZeroValues: NETDATA.chartLibraries.dygraph.isLogScale(state) ? false : NETDATA.dataAttributeBoolean(state.element, 'dygraph-labelsshowzerovalues', true), + labelsKMB: false, + labelsKMG2: false, + showLabelsOnHighlight: NETDATA.dataAttributeBoolean(state.element, 'dygraph-showlabelsonhighlight', true), + hideOverlayOnMouseOut: NETDATA.dataAttributeBoolean(state.element, 'dygraph-hideoverlayonmouseout', true), + includeZero: state.tmp.dygraph_include_zero, + xRangePad: NETDATA.dataAttribute(state.element, 'dygraph-xrangepad', 0), + yRangePad: NETDATA.dataAttribute(state.element, 'dygraph-yrangepad', 1), + valueRange: NETDATA.dataAttribute(state.element, 'dygraph-valuerange', [null, null]), + ylabel: state.units_current, // (state.units_desired === 'auto')?"":state.units_current, + yLabelWidth: NETDATA.dataAttribute(state.element, 'dygraph-ylabelwidth', 12), + + // the function to plot the chart + plotter: null, + + // The width of the lines connecting data points. + // This can be used to increase the contrast or some graphs. + strokeWidth: NETDATA.dataAttribute(state.element, 'dygraph-strokewidth', ((state.tmp.dygraph_chart_type === 'stacked') ? 0.1 : ((smooth === true) ? 1.5 : 0.7))), + strokePattern: NETDATA.dataAttribute(state.element, 'dygraph-strokepattern', undefined), + + // The size of the dot to draw on each point in pixels (see drawPoints). + // A dot is always drawn when a point is "isolated", + // i.e. there is a missing point on either side of it. + // This also controls the size of those dots. + drawPoints: NETDATA.dataAttributeBoolean(state.element, 'dygraph-drawpoints', false), + + // Draw points at the edges of gaps in the data. + // This improves visibility of small data segments or other data irregularities. + drawGapEdgePoints: NETDATA.dataAttributeBoolean(state.element, 'dygraph-drawgapedgepoints', true), + connectSeparatedPoints: NETDATA.chartLibraries.dygraph.isLogScale(state) ? false : NETDATA.dataAttributeBoolean(state.element, 'dygraph-connectseparatedpoints', false), + pointSize: NETDATA.dataAttribute(state.element, 'dygraph-pointsize', 1), + + // enabling this makes the chart with little square lines + stepPlot: NETDATA.dataAttributeBoolean(state.element, 'dygraph-stepplot', false), + + // Draw a border around graph lines to make crossing lines more easily + // distinguishable. Useful for graphs with many lines. + strokeBorderColor: NETDATA.dataAttribute(state.element, 'dygraph-strokebordercolor', NETDATA.themes.current.background), + strokeBorderWidth: NETDATA.dataAttribute(state.element, 'dygraph-strokeborderwidth', (state.tmp.dygraph_chart_type === 'stacked') ? 0.0 : 0.0), + fillGraph: NETDATA.dataAttribute(state.element, 'dygraph-fillgraph', (state.tmp.dygraph_chart_type === 'area' || state.tmp.dygraph_chart_type === 'stacked')), + fillAlpha: NETDATA.dataAttribute(state.element, 'dygraph-fillalpha', + ((state.tmp.dygraph_chart_type === 'stacked') + ? NETDATA.options.current.color_fill_opacity_stacked + : NETDATA.options.current.color_fill_opacity_area) + ), + stackedGraph: NETDATA.dataAttribute(state.element, 'dygraph-stackedgraph', (state.tmp.dygraph_chart_type === 'stacked')), + stackedGraphNaNFill: NETDATA.dataAttribute(state.element, 'dygraph-stackedgraphnanfill', 'none'), + drawAxis: drawAxis, + axisLabelFontSize: NETDATA.dataAttribute(state.element, 'dygraph-axislabelfontsize', 10), + axisLineColor: NETDATA.dataAttribute(state.element, 'dygraph-axislinecolor', NETDATA.themes.current.axis), + axisLineWidth: NETDATA.dataAttribute(state.element, 'dygraph-axislinewidth', 1.0), + drawGrid: NETDATA.dataAttributeBoolean(state.element, 'dygraph-drawgrid', true), + gridLinePattern: NETDATA.dataAttribute(state.element, 'dygraph-gridlinepattern', null), + gridLineWidth: NETDATA.dataAttribute(state.element, 'dygraph-gridlinewidth', 1.0), + gridLineColor: NETDATA.dataAttribute(state.element, 'dygraph-gridlinecolor', NETDATA.themes.current.grid), + maxNumberWidth: NETDATA.dataAttribute(state.element, 'dygraph-maxnumberwidth', 8), + sigFigs: NETDATA.dataAttribute(state.element, 'dygraph-sigfigs', null), + digitsAfterDecimal: NETDATA.dataAttribute(state.element, 'dygraph-digitsafterdecimal', 2), + valueFormatter: NETDATA.dataAttribute(state.element, 'dygraph-valueformatter', undefined), + highlightCircleSize: NETDATA.dataAttribute(state.element, 'dygraph-highlightcirclesize', highlightCircleSize), + highlightSeriesOpts: NETDATA.dataAttribute(state.element, 'dygraph-highlightseriesopts', null), // TOO SLOW: { strokeWidth: 1.5 }, + highlightSeriesBackgroundAlpha: NETDATA.dataAttribute(state.element, 'dygraph-highlightseriesbackgroundalpha', null), // TOO SLOW: (state.tmp.dygraph_chart_type === 'stacked')?0.7:0.5, + pointClickCallback: NETDATA.dataAttribute(state.element, 'dygraph-pointclickcallback', undefined), + visibility: state.dimensions_visibility.selected2BooleanArray(state.data.dimension_names), + logscale: NETDATA.chartLibraries.dygraph.isLogScale(state) ? 'y' : undefined, + + axes: { + x: { + pixelsPerLabel: NETDATA.dataAttribute(state.element, 'dygraph-xpixelsperlabel', 50), + ticker: Dygraph.dateTicker, + axisLabelWidth: NETDATA.dataAttribute(state.element, 'dygraph-xaxislabelwidth', 60), + drawAxis: NETDATA.dataAttributeBoolean(state.element, 'dygraph-drawxaxis', drawAxis), + axisLabelFormatter: function (d, gran) { + void(gran); + return NETDATA.dateTime.xAxisTimeString(d); + } + }, + y: { + logscale: NETDATA.chartLibraries.dygraph.isLogScale(state) ? true : undefined, + pixelsPerLabel: NETDATA.dataAttribute(state.element, 'dygraph-ypixelsperlabel', 15), + axisLabelWidth: NETDATA.dataAttribute(state.element, 'dygraph-yaxislabelwidth', 50), + drawAxis: NETDATA.dataAttributeBoolean(state.element, 'dygraph-drawyaxis', drawAxis), + axisLabelFormatter: function (y) { + + // unfortunately, we have to call this every single time + state.legendFormatValueDecimalsFromMinMax( + this.axes_[0].extremeRange[0], + this.axes_[0].extremeRange[1] + ); + + let old_units = this.user_attrs_.ylabel; + let v = state.legendFormatValue(y); + let new_units = state.units_current; + + if (state.units_desired === 'auto' && typeof old_units !== 'undefined' && new_units !== old_units && !NETDATA.chartLibraries.dygraph.isSparkline(state)) { + // console.log(this); + // state.log('units discrepancy: old = ' + old_units + ', new = ' + new_units); + let len = this.plugins_.length; + while (len--) { + // console.log(this.plugins_[len]); + if (typeof this.plugins_[len].plugin.ylabel_div_ !== 'undefined' + && this.plugins_[len].plugin.ylabel_div_ !== null + && typeof this.plugins_[len].plugin.ylabel_div_.children !== 'undefined' + && this.plugins_[len].plugin.ylabel_div_.children !== null + && typeof this.plugins_[len].plugin.ylabel_div_.children[0].children !== 'undefined' + && this.plugins_[len].plugin.ylabel_div_.children[0].children !== null + ) { + this.plugins_[len].plugin.ylabel_div_.children[0].children[0].innerHTML = new_units; + this.user_attrs_.ylabel = new_units; + break; + } + } + + if (len < 0) { + state.log('units discrepancy, but cannot find dygraphs div to change: old = ' + old_units + ', new = ' + new_units); + } + } + + return v; + } + } + }, + legendFormatter: function (data) { + if (state.tmp.dygraph_mouse_down) { + return; + } + + let elements = state.element_legend_childs; + + // if the hidden div is not there + // we are not managing the legend + if (elements.hidden === null) { + return; + } + + if (typeof data.x !== 'undefined') { + state.legendSetDate(data.x); + let i = data.series.length; + while (i--) { + let series = data.series[i]; + if (series.isVisible) { + state.legendSetLabelValue(series.label, series.y); + } else { + state.legendSetLabelValue(series.label, null); + } + } + } + + return ''; + }, + drawCallback: function (dygraph, is_initial) { + + // the user has panned the chart and this is called to re-draw the chart + // 1. refresh this chart by adding data to it + // 2. notify all the other charts about the update they need + + // to prevent an infinite loop (feedback), we use + // state.tmp.dygraph_user_action + // - when true, this is initiated by a user + // - when false, this is feedback + + if (state.current.name !== 'auto' && state.tmp.dygraph_user_action) { + state.tmp.dygraph_user_action = false; + + let x_range = dygraph.xAxisRange(); + let after = Math.round(x_range[0]); + let before = Math.round(x_range[1]); + + if (NETDATA.options.debug.dygraph) { + state.log('dygraphDrawCallback(dygraph, ' + is_initial + '): mode ' + state.current.name + ' ' + (after / 1000).toString() + ' - ' + (before / 1000).toString()); + //console.log(state); + } + + if (before <= state.netdata_last && after >= state.netdata_first) { + // update only when we are within the data limits + state.updateChartPanOrZoom(after, before); + } + } + }, + zoomCallback: function (minDate, maxDate, yRanges) { + + // the user has selected a range on the chart + // 1. refresh this chart by adding data to it + // 2. notify all the other charts about the update they need + + void(yRanges); + + if (NETDATA.options.debug.dygraph) { + state.log('dygraphZoomCallback(): ' + state.current.name); + } + + NETDATA.globalSelectionSync.stop(); + NETDATA.globalSelectionSync.delay(); + state.setMode('zoom'); + + // refresh it to the greatest possible zoom level + state.tmp.dygraph_user_action = true; + state.tmp.dygraph_force_zoom = true; + state.updateChartPanOrZoom(minDate, maxDate); + }, + highlightCallback: function (event, x, points, row, seriesName) { + void(seriesName); + + state.pauseChart(); + + // there is a bug in dygraph when the chart is zoomed enough + // the time it thinks is selected is wrong + // here we calculate the time t based on the row number selected + // which is ok + // let t = state.data_after + row * state.data_update_every; + // console.log('row = ' + row + ', x = ' + x + ', t = ' + t + ' ' + ((t === x)?'SAME':(Math.abs(x-t)<=state.data_update_every)?'SIMILAR':'DIFFERENT') + ', rows in db: ' + state.data_points + ' visible(x) = ' + state.timeIsVisible(x) + ' visible(t) = ' + state.timeIsVisible(t) + ' r(x) = ' + state.calculateRowForTime(x) + ' r(t) = ' + state.calculateRowForTime(t) + ' range: ' + state.data_after + ' - ' + state.data_before + ' real: ' + state.data.after + ' - ' + state.data.before + ' every: ' + state.data_update_every); + + if (state.tmp.dygraph_mouse_down !== true) { + NETDATA.globalSelectionSync.sync(state, x); + } + + // fix legend zIndex using the internal structures of dygraph legend module + // this works, but it is a hack! + // state.tmp.dygraph_instance.plugins_[0].plugin.legend_div_.style.zIndex = 10000; + }, + unhighlightCallback: function (event) { + void(event); + + if (state.tmp.dygraph_mouse_down) { + return; + } + + if (NETDATA.options.debug.dygraph || state.debug) { + state.log('dygraphUnhighlightCallback()'); + } + + state.unpauseChart(); + NETDATA.globalSelectionSync.stop(); + }, + underlayCallback: function (canvas, area, g) { + + // the chart is about to be drawn + // this function renders global highlighted time-frame + + if (NETDATA.globalChartUnderlay.isActive()) { + let after = NETDATA.globalChartUnderlay.after; + let before = NETDATA.globalChartUnderlay.before; + + if (after < state.view_after) { + after = state.view_after; + } + + if (before > state.view_before) { + before = state.view_before; + } + + if (after < before) { + let bottom_left = g.toDomCoords(after, -20); + let top_right = g.toDomCoords(before, +20); + + let left = bottom_left[0]; + let right = top_right[0]; + + canvas.fillStyle = NETDATA.themes.current.highlight; + canvas.fillRect(left, area.y, right - left, area.h); + } + } + }, + interactionModel: { + mousedown: function (event, dygraph, context) { + if (NETDATA.options.debug.dygraph || state.debug) { + state.log('interactionModel.mousedown()'); + } + + state.tmp.dygraph_user_action = true; + + if (NETDATA.options.debug.dygraph) { + state.log('dygraphMouseDown()'); + } + + // Right-click should not initiate anything. + if (event.button && event.button === 2) { + return; + } + + NETDATA.globalSelectionSync.stop(); + NETDATA.globalSelectionSync.delay(); + + state.tmp.dygraph_mouse_down = true; + context.initializeMouseDown(event, dygraph, context); + + //console.log(event); + if (event.button && event.button === 1) { + if (event.shiftKey) { + //console.log('middle mouse button dragging (PAN)'); + + state.setMode('pan'); + // NETDATA.globalSelectionSync.delay(); + state.tmp.dygraph_highlight_after = null; + Dygraph.startPan(event, dygraph, context); + } else if (event.altKey || event.ctrlKey || event.metaKey) { + //console.log('middle mouse button highlight'); + + if (!(event.offsetX && event.offsetY)) { + event.offsetX = event.layerX - event.target.offsetLeft; + event.offsetY = event.layerY - event.target.offsetTop; + } + state.tmp.dygraph_highlight_after = dygraph.toDataXCoord(event.offsetX); + Dygraph.startZoom(event, dygraph, context); + } else { + //console.log('middle mouse button selection for zoom (ZOOM)'); + + state.setMode('zoom'); + // NETDATA.globalSelectionSync.delay(); + state.tmp.dygraph_highlight_after = null; + Dygraph.startZoom(event, dygraph, context); + } + } else { + if (event.shiftKey) { + //console.log('left mouse button selection for zoom (ZOOM)'); + + state.setMode('zoom'); + // NETDATA.globalSelectionSync.delay(); + state.tmp.dygraph_highlight_after = null; + Dygraph.startZoom(event, dygraph, context); + } else if (event.altKey || event.ctrlKey || event.metaKey) { + //console.log('left mouse button highlight'); + + if (!(event.offsetX && event.offsetY)) { + event.offsetX = event.layerX - event.target.offsetLeft; + event.offsetY = event.layerY - event.target.offsetTop; + } + state.tmp.dygraph_highlight_after = dygraph.toDataXCoord(event.offsetX); + Dygraph.startZoom(event, dygraph, context); + } else { + //console.log('left mouse button dragging (PAN)'); + + state.setMode('pan'); + // NETDATA.globalSelectionSync.delay(); + state.tmp.dygraph_highlight_after = null; + Dygraph.startPan(event, dygraph, context); + } + } + }, + mousemove: function (event, dygraph, context) { + if (NETDATA.options.debug.dygraph || state.debug) { + state.log('interactionModel.mousemove()'); + } + + if (state.tmp.dygraph_highlight_after !== null) { + //console.log('highlight selection...'); + + NETDATA.globalSelectionSync.stop(); + NETDATA.globalSelectionSync.delay(); + + state.tmp.dygraph_user_action = true; + Dygraph.moveZoom(event, dygraph, context); + event.preventDefault(); + } else if (context.isPanning) { + //console.log('panning...'); + + NETDATA.globalSelectionSync.stop(); + NETDATA.globalSelectionSync.delay(); + + state.tmp.dygraph_user_action = true; + //NETDATA.globalSelectionSync.stop(); + //NETDATA.globalSelectionSync.delay(); + state.setMode('pan'); + context.is2DPan = false; + Dygraph.movePan(event, dygraph, context); + } else if (context.isZooming) { + //console.log('zooming...'); + + NETDATA.globalSelectionSync.stop(); + NETDATA.globalSelectionSync.delay(); + + state.tmp.dygraph_user_action = true; + //NETDATA.globalSelectionSync.stop(); + //NETDATA.globalSelectionSync.delay(); + state.setMode('zoom'); + Dygraph.moveZoom(event, dygraph, context); + } + }, + mouseup: function (event, dygraph, context) { + state.tmp.dygraph_mouse_down = false; + + if (NETDATA.options.debug.dygraph || state.debug) { + state.log('interactionModel.mouseup()'); + } + + if (state.tmp.dygraph_highlight_after !== null) { + //console.log('done highlight selection'); + + NETDATA.globalSelectionSync.stop(); + NETDATA.globalSelectionSync.delay(); + + if (!(event.offsetX && event.offsetY)) { + event.offsetX = event.layerX - event.target.offsetLeft; + event.offsetY = event.layerY - event.target.offsetTop; + } + + NETDATA.globalChartUnderlay.set(state + , state.tmp.dygraph_highlight_after + , dygraph.toDataXCoord(event.offsetX) + , state.view_after + , state.view_before + ); + + state.tmp.dygraph_highlight_after = null; + + context.isZooming = false; + dygraph.clearZoomRect_(); + dygraph.drawGraph_(false); + + // refresh all the charts immediately + NETDATA.options.auto_refresher_stop_until = 0; + } else if (context.isPanning) { + //console.log('done panning'); + + NETDATA.globalSelectionSync.stop(); + NETDATA.globalSelectionSync.delay(); + + state.tmp.dygraph_user_action = true; + Dygraph.endPan(event, dygraph, context); + + // refresh all the charts immediately + NETDATA.options.auto_refresher_stop_until = 0; + } else if (context.isZooming) { + //console.log('done zomming'); + + NETDATA.globalSelectionSync.stop(); + NETDATA.globalSelectionSync.delay(); + + state.tmp.dygraph_user_action = true; + Dygraph.endZoom(event, dygraph, context); + + // refresh all the charts immediately + NETDATA.options.auto_refresher_stop_until = 0; + } + }, + click: function (event, dygraph, context) { + void(dygraph); + void(context); + + if (NETDATA.options.debug.dygraph || state.debug) { + state.log('interactionModel.click()'); + } + + event.preventDefault(); + }, + dblclick: function (event, dygraph, context) { + void(event); + void(dygraph); + void(context); + + if (NETDATA.options.debug.dygraph || state.debug) { + state.log('interactionModel.dblclick()'); + } + NETDATA.resetAllCharts(state); + }, + wheel: function (event, dygraph, context) { + void(context); + + if (NETDATA.options.debug.dygraph || state.debug) { + state.log('interactionModel.wheel()'); + } + + // Take the offset of a mouse event on the dygraph canvas and + // convert it to a pair of percentages from the bottom left. + // (Not top left, bottom is where the lower value is.) + function offsetToPercentage(g, offsetX, offsetY) { + // This is calculating the pixel offset of the leftmost date. + let xOffset = g.toDomCoords(g.xAxisRange()[0], null)[0]; + let yar0 = g.yAxisRange(0); + + // This is calculating the pixel of the highest value. (Top pixel) + let yOffset = g.toDomCoords(null, yar0[1])[1]; + + // x y w and h are relative to the corner of the drawing area, + // so that the upper corner of the drawing area is (0, 0). + let x = offsetX - xOffset; + let y = offsetY - yOffset; + + // This is computing the rightmost pixel, effectively defining the + // width. + let w = g.toDomCoords(g.xAxisRange()[1], null)[0] - xOffset; + + // This is computing the lowest pixel, effectively defining the height. + let h = g.toDomCoords(null, yar0[0])[1] - yOffset; + + // Percentage from the left. + let xPct = w === 0 ? 0 : (x / w); + // Percentage from the top. + let yPct = h === 0 ? 0 : (y / h); + + // The (1-) part below changes it from "% distance down from the top" + // to "% distance up from the bottom". + return [xPct, (1 - yPct)]; + } + + // Adjusts [x, y] toward each other by zoomInPercentage% + // Split it so the left/bottom axis gets xBias/yBias of that change and + // tight/top gets (1-xBias)/(1-yBias) of that change. + // + // If a bias is missing it splits it down the middle. + function zoomRange(g, zoomInPercentage, xBias, yBias) { + xBias = xBias || 0.5; + yBias = yBias || 0.5; + + function adjustAxis(axis, zoomInPercentage, bias) { + let delta = axis[1] - axis[0]; + let increment = delta * zoomInPercentage; + let foo = [increment * bias, increment * (1 - bias)]; + + return [axis[0] + foo[0], axis[1] - foo[1]]; + } + + let yAxes = g.yAxisRanges(); + let newYAxes = []; + for (let i = 0; i < yAxes.length; i++) { + newYAxes[i] = adjustAxis(yAxes[i], zoomInPercentage, yBias); + } + + return adjustAxis(g.xAxisRange(), zoomInPercentage, xBias); + } + + if (event.altKey || event.shiftKey) { + state.tmp.dygraph_user_action = true; + + NETDATA.globalSelectionSync.stop(); + NETDATA.globalSelectionSync.delay(); + + // http://dygraphs.com/gallery/interaction-api.js + let normal_def; + if (typeof event.wheelDelta === 'number' && !isNaN(event.wheelDelta)) + // chrome + { + normal_def = event.wheelDelta / 40; + } else + // firefox + { + normal_def = event.deltaY * -1.2; + } + + let normal = (event.detail) ? event.detail * -1 : normal_def; + let percentage = normal / 50; + + if (!(event.offsetX && event.offsetY)) { + event.offsetX = event.layerX - event.target.offsetLeft; + event.offsetY = event.layerY - event.target.offsetTop; + } + + let percentages = offsetToPercentage(dygraph, event.offsetX, event.offsetY); + let xPct = percentages[0]; + let yPct = percentages[1]; + + let new_x_range = zoomRange(dygraph, percentage, xPct, yPct); + let after = new_x_range[0]; + let before = new_x_range[1]; + + let first = state.netdata_first + state.data_update_every; + let last = state.netdata_last + state.data_update_every; + + if (before > last) { + after -= (before - last); + before = last; + } + if (after < first) { + after = first; + } + + state.setMode('zoom'); + state.updateChartPanOrZoom(after, before, function () { + dygraph.updateOptions({dateWindow: [after, before]}); + }); + + event.preventDefault(); + } + }, + touchstart: function (event, dygraph, context) { + state.tmp.dygraph_mouse_down = true; + + if (NETDATA.options.debug.dygraph || state.debug) { + state.log('interactionModel.touchstart()'); + } + + state.tmp.dygraph_user_action = true; + state.setMode('zoom'); + state.pauseChart(); + + NETDATA.globalSelectionSync.stop(); + NETDATA.globalSelectionSync.delay(); + + Dygraph.defaultInteractionModel.touchstart(event, dygraph, context); + + // we overwrite the touch directions at the end, to overwrite + // the internal default of dygraph + context.touchDirections = {x: true, y: false}; + + state.dygraph_last_touch_start = Date.now(); + state.dygraph_last_touch_move = 0; + + if (typeof event.touches[0].pageX === 'number') { + state.dygraph_last_touch_page_x = event.touches[0].pageX; + } else { + state.dygraph_last_touch_page_x = 0; + } + }, + touchmove: function (event, dygraph, context) { + if (NETDATA.options.debug.dygraph || state.debug) { + state.log('interactionModel.touchmove()'); + } + + NETDATA.globalSelectionSync.stop(); + NETDATA.globalSelectionSync.delay(); + + state.tmp.dygraph_user_action = true; + Dygraph.defaultInteractionModel.touchmove(event, dygraph, context); + + state.dygraph_last_touch_move = Date.now(); + }, + touchend: function (event, dygraph, context) { + state.tmp.dygraph_mouse_down = false; + + if (NETDATA.options.debug.dygraph || state.debug) { + state.log('interactionModel.touchend()'); + } + + NETDATA.globalSelectionSync.stop(); + NETDATA.globalSelectionSync.delay(); + + state.tmp.dygraph_user_action = true; + Dygraph.defaultInteractionModel.touchend(event, dygraph, context); + + // if it didn't move, it is a selection + if (state.dygraph_last_touch_move === 0 && state.dygraph_last_touch_page_x !== 0) { + NETDATA.globalSelectionSync.dontSyncBefore = 0; + NETDATA.globalSelectionSync.setMaster(state); + + // internal api of dygraph + let pct = (state.dygraph_last_touch_page_x - (dygraph.plotter_.area.x + state.element.getBoundingClientRect().left)) / dygraph.plotter_.area.w; + console.log('pct: ' + pct.toString()); + + let t = Math.round(state.view_after + (state.view_before - state.view_after) * pct); + if (NETDATA.dygraphSetSelection(state, t)) { + NETDATA.globalSelectionSync.sync(state, t); + } + } + + // if it was double tap within double click time, reset the charts + let now = Date.now(); + if (typeof state.dygraph_last_touch_end !== 'undefined') { + if (state.dygraph_last_touch_move === 0) { + let dt = now - state.dygraph_last_touch_end; + if (dt <= NETDATA.options.current.double_click_speed) { + NETDATA.resetAllCharts(state); + } + } + } + + // remember the timestamp of the last touch end + state.dygraph_last_touch_end = now; + + // refresh all the charts immediately + NETDATA.options.auto_refresher_stop_until = 0; + } + } + }; + + if (NETDATA.chartLibraries.dygraph.isLogScale(state)) { + if (Array.isArray(state.tmp.dygraph_options.valueRange) && state.tmp.dygraph_options.valueRange[0] <= 0) { + state.tmp.dygraph_options.valueRange[0] = null; + } + } + + if (NETDATA.chartLibraries.dygraph.isSparkline(state)) { + state.tmp.dygraph_options.drawGrid = false; + state.tmp.dygraph_options.drawAxis = false; + state.tmp.dygraph_options.title = undefined; + state.tmp.dygraph_options.ylabel = undefined; + state.tmp.dygraph_options.yLabelWidth = 0; + //state.tmp.dygraph_options.labelsDivWidth = 120; + //state.tmp.dygraph_options.labelsDivStyles.width = '120px'; + state.tmp.dygraph_options.labelsSeparateLines = true; + state.tmp.dygraph_options.rightGap = 0; + state.tmp.dygraph_options.yRangePad = 1; + state.tmp.dygraph_options.axes.x.drawAxis = false; + state.tmp.dygraph_options.axes.y.drawAxis = false; + } + + if (smooth) { + state.tmp.dygraph_smooth_eligible = true; + + if (NETDATA.options.current.smooth_plot) { + state.tmp.dygraph_options.plotter = smoothPlotter; + } + } + else { + state.tmp.dygraph_smooth_eligible = false; + } + + if (netdataSnapshotData !== null && NETDATA.globalPanAndZoom.isActive() && NETDATA.globalPanAndZoom.isMaster(state) === false) { + // pan and zoom on snapshots + state.tmp.dygraph_options.dateWindow = [NETDATA.globalPanAndZoom.force_after_ms, NETDATA.globalPanAndZoom.force_before_ms]; + //state.tmp.dygraph_options.isZoomedIgnoreProgrammaticZoom = true; + } + + state.tmp.dygraph_instance = new Dygraph(state.element_chart, + data.result.data, state.tmp.dygraph_options); + + state.tmp.dygraph_force_zoom = false; + state.tmp.dygraph_user_action = false; + state.tmp.dygraph_last_rendered = Date.now(); + state.tmp.dygraph_highlight_after = null; + + if (state.tmp.dygraph_options.valueRange[0] === null && state.tmp.dygraph_options.valueRange[1] === null) { + if (typeof state.tmp.dygraph_instance.axes_[0].extremeRange !== 'undefined') { + state.tmp.__commonMin = NETDATA.dataAttribute(state.element, 'common-min', null); + state.tmp.__commonMax = NETDATA.dataAttribute(state.element, 'common-max', null); + } else { + state.log('incompatible version of Dygraph detected'); + state.tmp.__commonMin = null; + state.tmp.__commonMax = null; + } + } else { + // if the user gave a valueRange, respect it + state.tmp.__commonMin = null; + state.tmp.__commonMax = null; + } + + return true; +}; diff --git a/web/gui/src/dashboard.js/charting/easy-pie-chart.js b/web/gui/src/dashboard.js/charting/easy-pie-chart.js new file mode 100644 index 000000000..6905a103f --- /dev/null +++ b/web/gui/src/dashboard.js/charting/easy-pie-chart.js @@ -0,0 +1,281 @@ +// ---------------------------------------------------------------------------------------------------------------- + +NETDATA.easypiechartPercentFromValueMinMax = function (state, value, min, max) { + if (typeof value !== 'number') { + value = 0; + } + if (typeof min !== 'number') { + min = 0; + } + if (typeof max !== 'number') { + max = 0; + } + + if (min > max) { + let t = min; + min = max; + max = t; + } + + if (min > value) { + min = value; + } + if (max < value) { + max = value; + } + + state.legendFormatValueDecimalsFromMinMax(min, max); + + if (state.tmp.easyPieChartMin === null && min > 0) { + min = 0; + } + if (state.tmp.easyPieChartMax === null && max < 0) { + max = 0; + } + + let pcent; + + if (min < 0 && max > 0) { + // it is both positive and negative + // zero at the top center of the chart + max = (-min > max) ? -min : max; + pcent = Math.round(value * 100 / max); + } else if (value >= 0 && min >= 0 && max >= 0) { + // clockwise + pcent = Math.round((value - min) * 100 / (max - min)); + if (pcent === 0) { + pcent = 0.1; + } + } else { + // counter clockwise + pcent = Math.round((value - max) * 100 / (max - min)); + if (pcent === 0) { + pcent = -0.1; + } + } + + return pcent; +}; + +// ---------------------------------------------------------------------------------------------------------------- +// easy-pie-chart + +NETDATA.easypiechartInitialize = function (callback) { + if (typeof netdataNoEasyPieChart === 'undefined' || !netdataNoEasyPieChart) { + $.ajax({ + url: NETDATA.easypiechart_js, + cache: true, + dataType: "script", + xhrFields: {withCredentials: true} // required for the cookie + }) + .done(function () { + NETDATA.registerChartLibrary('easypiechart', NETDATA.easypiechart_js); + }) + .fail(function () { + NETDATA.chartLibraries.easypiechart.enabled = false; + NETDATA.error(100, NETDATA.easypiechart_js); + }) + .always(function () { + if (typeof callback === "function") { + return callback(); + } + }) + } else { + NETDATA.chartLibraries.easypiechart.enabled = false; + if (typeof callback === "function") { + return callback(); + } + } +}; + +NETDATA.easypiechartClearSelection = function (state, force) { + if (typeof state.tmp.easyPieChartEvent !== 'undefined' && typeof state.tmp.easyPieChartEvent.timer !== 'undefined') { + NETDATA.timeout.clear(state.tmp.easyPieChartEvent.timer); + state.tmp.easyPieChartEvent.timer = undefined; + } + + if (state.isAutoRefreshable() && state.data !== null && force !== true) { + NETDATA.easypiechartChartUpdate(state, state.data); + } + else { + state.tmp.easyPieChartLabel.innerText = state.legendFormatValue(null); + state.tmp.easyPieChart_instance.update(0); + } + state.tmp.easyPieChart_instance.enableAnimation(); + + return true; +}; + +NETDATA.easypiechartSetSelection = function (state, t) { + if (state.timeIsVisible(t) !== true) { + return NETDATA.easypiechartClearSelection(state, true); + } + + let slot = state.calculateRowForTime(t); + if (slot < 0 || slot >= state.data.result.length) { + return NETDATA.easypiechartClearSelection(state, true); + } + + if (typeof state.tmp.easyPieChartEvent === 'undefined') { + state.tmp.easyPieChartEvent = { + timer: undefined, + value: 0, + pcent: 0 + }; + } + + let value = state.data.result[state.data.result.length - 1 - slot]; + let min = (state.tmp.easyPieChartMin === null) ? NETDATA.commonMin.get(state) : state.tmp.easyPieChartMin; + let max = (state.tmp.easyPieChartMax === null) ? NETDATA.commonMax.get(state) : state.tmp.easyPieChartMax; + let pcent = NETDATA.easypiechartPercentFromValueMinMax(state, value, min, max); + + state.tmp.easyPieChartEvent.value = value; + state.tmp.easyPieChartEvent.pcent = pcent; + state.tmp.easyPieChartLabel.innerText = state.legendFormatValue(value); + + if (state.tmp.easyPieChartEvent.timer === undefined) { + state.tmp.easyPieChart_instance.disableAnimation(); + + state.tmp.easyPieChartEvent.timer = NETDATA.timeout.set(function () { + state.tmp.easyPieChartEvent.timer = undefined; + state.tmp.easyPieChart_instance.update(state.tmp.easyPieChartEvent.pcent); + }, 0); + } + + return true; +}; + +NETDATA.easypiechartChartUpdate = function (state, data) { + let value, min, max, pcent; + + if (NETDATA.globalPanAndZoom.isActive() || state.isAutoRefreshable() === false) { + value = null; + pcent = 0; + } + else { + value = data.result[0]; + min = (state.tmp.easyPieChartMin === null) ? NETDATA.commonMin.get(state) : state.tmp.easyPieChartMin; + max = (state.tmp.easyPieChartMax === null) ? NETDATA.commonMax.get(state) : state.tmp.easyPieChartMax; + pcent = NETDATA.easypiechartPercentFromValueMinMax(state, value, min, max); + } + + state.tmp.easyPieChartLabel.innerText = state.legendFormatValue(value); + state.tmp.easyPieChart_instance.update(pcent); + return true; +}; + +NETDATA.easypiechartChartCreate = function (state, data) { + let chart = $(state.element_chart); + + let value = data.result[0]; + let min = NETDATA.dataAttribute(state.element, 'easypiechart-min-value', null); + let max = NETDATA.dataAttribute(state.element, 'easypiechart-max-value', null); + + if (min === null) { + min = NETDATA.commonMin.get(state); + state.tmp.easyPieChartMin = null; + } + else { + state.tmp.easyPieChartMin = min; + } + + if (max === null) { + max = NETDATA.commonMax.get(state); + state.tmp.easyPieChartMax = null; + } + else { + state.tmp.easyPieChartMax = max; + } + + let size = state.chartWidth(); + let stroke = Math.floor(size / 22); + if (stroke < 3) { + stroke = 2; + } + + let valuefontsize = Math.floor((size * 2 / 3) / 5); + let valuetop = Math.round((size - valuefontsize - (size / 40)) / 2); + state.tmp.easyPieChartLabel = document.createElement('span'); + state.tmp.easyPieChartLabel.className = 'easyPieChartLabel'; + state.tmp.easyPieChartLabel.innerText = state.legendFormatValue(value); + state.tmp.easyPieChartLabel.style.fontSize = valuefontsize + 'px'; + state.tmp.easyPieChartLabel.style.top = valuetop.toString() + 'px'; + state.element_chart.appendChild(state.tmp.easyPieChartLabel); + + let titlefontsize = Math.round(valuefontsize * 1.6 / 3); + let titletop = Math.round(valuetop - (titlefontsize * 2) - (size / 40)); + state.tmp.easyPieChartTitle = document.createElement('span'); + state.tmp.easyPieChartTitle.className = 'easyPieChartTitle'; + state.tmp.easyPieChartTitle.innerText = state.title; + state.tmp.easyPieChartTitle.style.fontSize = titlefontsize + 'px'; + state.tmp.easyPieChartTitle.style.lineHeight = titlefontsize + 'px'; + state.tmp.easyPieChartTitle.style.top = titletop.toString() + 'px'; + state.element_chart.appendChild(state.tmp.easyPieChartTitle); + + let unitfontsize = Math.round(titlefontsize * 0.9); + let unittop = Math.round(valuetop + (valuefontsize + unitfontsize) + (size / 40)); + state.tmp.easyPieChartUnits = document.createElement('span'); + state.tmp.easyPieChartUnits.className = 'easyPieChartUnits'; + state.tmp.easyPieChartUnits.innerText = state.units_current; + state.tmp.easyPieChartUnits.style.fontSize = unitfontsize + 'px'; + state.tmp.easyPieChartUnits.style.top = unittop.toString() + 'px'; + state.element_chart.appendChild(state.tmp.easyPieChartUnits); + + let barColor = NETDATA.dataAttribute(state.element, 'easypiechart-barcolor', undefined); + if (typeof barColor === 'undefined' || barColor === null) { + barColor = state.chartCustomColors()[0]; + } else { + // <div ... data-easypiechart-barcolor="(function(percent){return(percent < 50 ? '#5cb85c' : percent < 85 ? '#f0ad4e' : '#cb3935');})" ...></div> + let tmp = eval(barColor); + if (typeof tmp === 'function') { + barColor = tmp; + } + } + + let pcent = NETDATA.easypiechartPercentFromValueMinMax(state, value, min, max); + chart.data('data-percent', pcent); + + chart.easyPieChart({ + barColor: barColor, + trackColor: NETDATA.dataAttribute(state.element, 'easypiechart-trackcolor', NETDATA.themes.current.easypiechart_track), + scaleColor: NETDATA.dataAttribute(state.element, 'easypiechart-scalecolor', NETDATA.themes.current.easypiechart_scale), + scaleLength: NETDATA.dataAttribute(state.element, 'easypiechart-scalelength', 5), + lineCap: NETDATA.dataAttribute(state.element, 'easypiechart-linecap', 'round'), + lineWidth: NETDATA.dataAttribute(state.element, 'easypiechart-linewidth', stroke), + trackWidth: NETDATA.dataAttribute(state.element, 'easypiechart-trackwidth', undefined), + size: NETDATA.dataAttribute(state.element, 'easypiechart-size', size), + rotate: NETDATA.dataAttribute(state.element, 'easypiechart-rotate', 0), + animate: NETDATA.dataAttribute(state.element, 'easypiechart-animate', {duration: 500, enabled: true}), + easing: NETDATA.dataAttribute(state.element, 'easypiechart-easing', undefined) + }); + + // when we just re-create the chart + // do not animate the first update + let animate = true; + if (typeof state.tmp.easyPieChart_instance !== 'undefined') { + animate = false; + } + + state.tmp.easyPieChart_instance = chart.data('easyPieChart'); + if (animate === false) { + state.tmp.easyPieChart_instance.disableAnimation(); + } + state.tmp.easyPieChart_instance.update(pcent); + if (animate === false) { + state.tmp.easyPieChart_instance.enableAnimation(); + } + + state.legendSetUnitsString = function (units) { + if (typeof state.tmp.easyPieChartUnits !== 'undefined' && state.tmp.units !== units) { + state.tmp.easyPieChartUnits.innerText = units; + state.tmp.units = units; + } + }; + state.legendShowUndefined = function () { + if (typeof state.tmp.easyPieChart_instance !== 'undefined') { + NETDATA.easypiechartClearSelection(state); + } + }; + + return true; +}; diff --git a/web/gui/src/dashboard.js/charting/gauge.js b/web/gui/src/dashboard.js/charting/gauge.js new file mode 100644 index 000000000..53ed46fb4 --- /dev/null +++ b/web/gui/src/dashboard.js/charting/gauge.js @@ -0,0 +1,406 @@ +// gauge.js + +NETDATA.gaugeInitialize = function (callback) { + if (typeof netdataNoGauge === 'undefined' || !netdataNoGauge) { + $.ajax({ + url: NETDATA.gauge_js, + cache: true, + dataType: "script", + xhrFields: {withCredentials: true} // required for the cookie + }) + .done(function () { + NETDATA.registerChartLibrary('gauge', NETDATA.gauge_js); + }) + .fail(function () { + NETDATA.chartLibraries.gauge.enabled = false; + NETDATA.error(100, NETDATA.gauge_js); + }) + .always(function () { + if (typeof callback === "function") { + return callback(); + } + }) + } + else { + NETDATA.chartLibraries.gauge.enabled = false; + if (typeof callback === "function") { + return callback(); + } + } +}; + +NETDATA.gaugeAnimation = function (state, status) { + let speed = 32; + + if (typeof status === 'boolean' && status === false) { + speed = 1000000000; + } else if (typeof status === 'number') { + speed = status; + } + + // console.log('gauge speed ' + speed); + state.tmp.gauge_instance.animationSpeed = speed; + state.tmp.___gaugeOld__.speed = speed; +}; + +NETDATA.gaugeSet = function (state, value, min, max) { + if (typeof value !== 'number') { + value = 0; + } + if (typeof min !== 'number') { + min = 0; + } + if (typeof max !== 'number') { + max = 0; + } + if (value > max) { + max = value; + } + if (value < min) { + min = value; + } + if (min > max) { + let t = min; + min = max; + max = t; + } + else if (min === max) { + max = min + 1; + } + + state.legendFormatValueDecimalsFromMinMax(min, max); + + // gauge.js has an issue if the needle + // is smaller than min or larger than max + // when we set the new values + // the needle will go crazy + + // to prevent it, we always feed it + // with a percentage, so that the needle + // is always between min and max + let pcent = (value - min) * 100 / (max - min); + + // bug fix for gauge.js 1.3.1 + // if the value is the absolute min or max, the chart is broken + if (pcent < 0.001) { + pcent = 0.001; + } + if (pcent > 99.999) { + pcent = 99.999; + } + + state.tmp.gauge_instance.set(pcent); + // console.log('gauge set ' + pcent + ', value ' + value + ', min ' + min + ', max ' + max); + + state.tmp.___gaugeOld__.value = value; + state.tmp.___gaugeOld__.min = min; + state.tmp.___gaugeOld__.max = max; +}; + +NETDATA.gaugeSetLabels = function (state, value, min, max) { + if (state.tmp.___gaugeOld__.valueLabel !== value) { + state.tmp.___gaugeOld__.valueLabel = value; + state.tmp.gaugeChartLabel.innerText = state.legendFormatValue(value); + } + if (state.tmp.___gaugeOld__.minLabel !== min) { + state.tmp.___gaugeOld__.minLabel = min; + state.tmp.gaugeChartMin.innerText = state.legendFormatValue(min); + } + if (state.tmp.___gaugeOld__.maxLabel !== max) { + state.tmp.___gaugeOld__.maxLabel = max; + state.tmp.gaugeChartMax.innerText = state.legendFormatValue(max); + } +}; + +NETDATA.gaugeClearSelection = function (state, force) { + if (typeof state.tmp.gaugeEvent !== 'undefined' && typeof state.tmp.gaugeEvent.timer !== 'undefined') { + NETDATA.timeout.clear(state.tmp.gaugeEvent.timer); + state.tmp.gaugeEvent.timer = undefined; + } + + if (state.isAutoRefreshable() && state.data !== null && force !== true) { + NETDATA.gaugeChartUpdate(state, state.data); + } else { + NETDATA.gaugeAnimation(state, false); + NETDATA.gaugeSetLabels(state, null, null, null); + NETDATA.gaugeSet(state, null, null, null); + } + + NETDATA.gaugeAnimation(state, true); + return true; +}; + +NETDATA.gaugeSetSelection = function (state, t) { + if (state.timeIsVisible(t) !== true) { + return NETDATA.gaugeClearSelection(state, true); + } + + let slot = state.calculateRowForTime(t); + if (slot < 0 || slot >= state.data.result.length) { + return NETDATA.gaugeClearSelection(state, true); + } + + if (typeof state.tmp.gaugeEvent === 'undefined') { + state.tmp.gaugeEvent = { + timer: undefined, + value: 0, + min: 0, + max: 0 + }; + } + + let value = state.data.result[state.data.result.length - 1 - slot]; + let min = (state.tmp.gaugeMin === null) ? NETDATA.commonMin.get(state) : state.tmp.gaugeMin; + let max = (state.tmp.gaugeMax === null) ? NETDATA.commonMax.get(state) : state.tmp.gaugeMax; + + // make sure it is zero based + // but only if it has not been set by the user + if (state.tmp.gaugeMin === null && min > 0) { + min = 0; + } + if (state.tmp.gaugeMax === null && max < 0) { + max = 0; + } + + state.tmp.gaugeEvent.value = value; + state.tmp.gaugeEvent.min = min; + state.tmp.gaugeEvent.max = max; + NETDATA.gaugeSetLabels(state, value, min, max); + + if (state.tmp.gaugeEvent.timer === undefined) { + NETDATA.gaugeAnimation(state, false); + + state.tmp.gaugeEvent.timer = NETDATA.timeout.set(function () { + state.tmp.gaugeEvent.timer = undefined; + NETDATA.gaugeSet(state, state.tmp.gaugeEvent.value, state.tmp.gaugeEvent.min, state.tmp.gaugeEvent.max); + }, 0); + } + + return true; +}; + +NETDATA.gaugeChartUpdate = function (state, data) { + let value, min, max; + + if (NETDATA.globalPanAndZoom.isActive() || state.isAutoRefreshable() === false) { + NETDATA.gaugeSetLabels(state, null, null, null); + state.tmp.gauge_instance.set(0); + } else { + value = data.result[0]; + min = (state.tmp.gaugeMin === null) ? NETDATA.commonMin.get(state) : state.tmp.gaugeMin; + max = (state.tmp.gaugeMax === null) ? NETDATA.commonMax.get(state) : state.tmp.gaugeMax; + if (value < min) { + min = value; + } + if (value > max) { + max = value; + } + + // make sure it is zero based + // but only if it has not been set by the user + if (state.tmp.gaugeMin === null && min > 0) { + min = 0; + } + if (state.tmp.gaugeMax === null && max < 0) { + max = 0; + } + + NETDATA.gaugeSet(state, value, min, max); + NETDATA.gaugeSetLabels(state, value, min, max); + } + + return true; +}; + +NETDATA.gaugeChartCreate = function (state, data) { + // let chart = $(state.element_chart); + + let value = data.result[0]; + let min = NETDATA.dataAttribute(state.element, 'gauge-min-value', null); + let max = NETDATA.dataAttribute(state.element, 'gauge-max-value', null); + // let adjust = NETDATA.dataAttribute(state.element, 'gauge-adjust', null); + let pointerColor = NETDATA.dataAttribute(state.element, 'gauge-pointer-color', NETDATA.themes.current.gauge_pointer); + let strokeColor = NETDATA.dataAttribute(state.element, 'gauge-stroke-color', NETDATA.themes.current.gauge_stroke); + let startColor = NETDATA.dataAttribute(state.element, 'gauge-start-color', state.chartCustomColors()[0]); + let stopColor = NETDATA.dataAttribute(state.element, 'gauge-stop-color', void 0); + let generateGradient = NETDATA.dataAttribute(state.element, 'gauge-generate-gradient', false); + + if (min === null) { + min = NETDATA.commonMin.get(state); + state.tmp.gaugeMin = null; + } else { + state.tmp.gaugeMin = min; + } + + if (max === null) { + max = NETDATA.commonMax.get(state); + state.tmp.gaugeMax = null; + } else { + state.tmp.gaugeMax = max; + } + + // make sure it is zero based + // but only if it has not been set by the user + if (state.tmp.gaugeMin === null && min > 0) { + min = 0; + } + if (state.tmp.gaugeMax === null && max < 0) { + max = 0; + } + + let width = state.chartWidth(), height = state.chartHeight(); //, ratio = 1.5; + // console.log('gauge width: ' + width.toString() + ', height: ' + height.toString()); + //switch(adjust) { + // case 'width': width = height * ratio; break; + // case 'height': + // default: height = width / ratio; break; + //} + //state.element.style.width = width.toString() + 'px'; + //state.element.style.height = height.toString() + 'px'; + + let lum_d = 0.05; + + let options = { + lines: 12, // The number of lines to draw + angle: 0.14, // The span of the gauge arc + lineWidth: 0.57, // The line thickness + radiusScale: 1.0, // Relative radius + pointer: { + length: 0.85, // 0.9 The radius of the inner circle + strokeWidth: 0.045, // The rotation offset + color: pointerColor // Fill color + }, + limitMax: true, // If false, the max value of the gauge will be updated if value surpass max + limitMin: true, // If true, the min value of the gauge will be fixed unless you set it manually + colorStart: startColor, // Colors + colorStop: stopColor, // just experiment with them + strokeColor: strokeColor, // to see which ones work best for you + generateGradient: (generateGradient === true), // gmosx: + gradientType: 0, + highDpiSupport: true // High resolution support + }; + + if (generateGradient.constructor === Array) { + // example options: + // data-gauge-generate-gradient="[0, 50, 100]" + // data-gauge-gradient-percent-color-0="#FFFFFF" + // data-gauge-gradient-percent-color-50="#999900" + // data-gauge-gradient-percent-color-100="#000000" + + options.percentColors = []; + let len = generateGradient.length; + while (len--) { + let pcent = generateGradient[len]; + let color = NETDATA.dataAttribute(state.element, 'gauge-gradient-percent-color-' + pcent.toString(), false); + if (color !== false) { + let a = []; + a[0] = pcent / 100; + a[1] = color; + options.percentColors.unshift(a); + } + } + if (options.percentColors.length === 0) { + delete options.percentColors; + } + } else if (generateGradient === false && NETDATA.themes.current.gauge_gradient) { + //noinspection PointlessArithmeticExpressionJS + options.percentColors = [ + [0.0, NETDATA.colorLuminance(startColor, (lum_d * 10) - (lum_d * 0))], + [0.1, NETDATA.colorLuminance(startColor, (lum_d * 10) - (lum_d * 1))], + [0.2, NETDATA.colorLuminance(startColor, (lum_d * 10) - (lum_d * 2))], + [0.3, NETDATA.colorLuminance(startColor, (lum_d * 10) - (lum_d * 3))], + [0.4, NETDATA.colorLuminance(startColor, (lum_d * 10) - (lum_d * 4))], + [0.5, NETDATA.colorLuminance(startColor, (lum_d * 10) - (lum_d * 5))], + [0.6, NETDATA.colorLuminance(startColor, (lum_d * 10) - (lum_d * 6))], + [0.7, NETDATA.colorLuminance(startColor, (lum_d * 10) - (lum_d * 7))], + [0.8, NETDATA.colorLuminance(startColor, (lum_d * 10) - (lum_d * 8))], + [0.9, NETDATA.colorLuminance(startColor, (lum_d * 10) - (lum_d * 9))], + [1.0, NETDATA.colorLuminance(startColor, 0.0)]]; + } + + state.tmp.gauge_canvas = document.createElement('canvas'); + state.tmp.gauge_canvas.id = 'gauge-' + state.uuid + '-canvas'; + state.tmp.gauge_canvas.className = 'gaugeChart'; + state.tmp.gauge_canvas.width = width; + state.tmp.gauge_canvas.height = height; + state.element_chart.appendChild(state.tmp.gauge_canvas); + + let valuefontsize = Math.floor(height / 5); + let valuetop = Math.round((height - valuefontsize) / 3.2); + state.tmp.gaugeChartLabel = document.createElement('span'); + state.tmp.gaugeChartLabel.className = 'gaugeChartLabel'; + state.tmp.gaugeChartLabel.style.fontSize = valuefontsize + 'px'; + state.tmp.gaugeChartLabel.style.top = valuetop.toString() + 'px'; + state.element_chart.appendChild(state.tmp.gaugeChartLabel); + + let titlefontsize = Math.round(valuefontsize / 2.1); + let titletop = 0; + state.tmp.gaugeChartTitle = document.createElement('span'); + state.tmp.gaugeChartTitle.className = 'gaugeChartTitle'; + state.tmp.gaugeChartTitle.innerText = state.title; + state.tmp.gaugeChartTitle.style.fontSize = titlefontsize + 'px'; + state.tmp.gaugeChartTitle.style.lineHeight = titlefontsize + 'px'; + state.tmp.gaugeChartTitle.style.top = titletop.toString() + 'px'; + state.element_chart.appendChild(state.tmp.gaugeChartTitle); + + let unitfontsize = Math.round(titlefontsize * 0.9); + state.tmp.gaugeChartUnits = document.createElement('span'); + state.tmp.gaugeChartUnits.className = 'gaugeChartUnits'; + state.tmp.gaugeChartUnits.innerText = state.units_current; + state.tmp.gaugeChartUnits.style.fontSize = unitfontsize + 'px'; + state.element_chart.appendChild(state.tmp.gaugeChartUnits); + + state.tmp.gaugeChartMin = document.createElement('span'); + state.tmp.gaugeChartMin.className = 'gaugeChartMin'; + state.tmp.gaugeChartMin.style.fontSize = Math.round(valuefontsize * 0.75).toString() + 'px'; + state.element_chart.appendChild(state.tmp.gaugeChartMin); + + state.tmp.gaugeChartMax = document.createElement('span'); + state.tmp.gaugeChartMax.className = 'gaugeChartMax'; + state.tmp.gaugeChartMax.style.fontSize = Math.round(valuefontsize * 0.75).toString() + 'px'; + state.element_chart.appendChild(state.tmp.gaugeChartMax); + + // when we just re-create the chart + // do not animate the first update + let animate = true; + if (typeof state.tmp.gauge_instance !== 'undefined') { + animate = false; + } + + state.tmp.gauge_instance = new Gauge(state.tmp.gauge_canvas).setOptions(options); // create sexy gauge! + + state.tmp.___gaugeOld__ = { + value: value, + min: min, + max: max, + valueLabel: null, + minLabel: null, + maxLabel: null + }; + + // we will always feed a percentage + state.tmp.gauge_instance.minValue = 0; + state.tmp.gauge_instance.maxValue = 100; + + NETDATA.gaugeAnimation(state, animate); + NETDATA.gaugeSet(state, value, min, max); + NETDATA.gaugeSetLabels(state, value, min, max); + NETDATA.gaugeAnimation(state, true); + + state.legendSetUnitsString = function (units) { + if (typeof state.tmp.gaugeChartUnits !== 'undefined' && state.tmp.units !== units) { + state.tmp.gaugeChartUnits.innerText = units; + state.tmp.___gaugeOld__.valueLabel = null; + state.tmp.___gaugeOld__.minLabel = null; + state.tmp.___gaugeOld__.maxLabel = null; + state.tmp.units = units; + } + }; + state.legendShowUndefined = function () { + if (typeof state.tmp.gauge_instance !== 'undefined') { + NETDATA.gaugeClearSelection(state); + } + }; + + return true; +}; diff --git a/web/gui/src/dashboard.js/charting/google-charts.js b/web/gui/src/dashboard.js/charting/google-charts.js new file mode 100644 index 000000000..432c84a1d --- /dev/null +++ b/web/gui/src/dashboard.js/charting/google-charts.js @@ -0,0 +1,129 @@ +// google charts + +NETDATA.googleInitialize = function (callback) { + if (typeof netdataNoGoogleCharts === 'undefined' || !netdataNoGoogleCharts) { + $.ajax({ + url: NETDATA.google_js, + cache: true, + dataType: "script", + xhrFields: {withCredentials: true} // required for the cookie + }) + .done(function () { + NETDATA.registerChartLibrary('google', NETDATA.google_js); + google.load('visualization', '1.1', { + 'packages': ['corechart', 'controls'], + 'callback': callback + }); + }) + .fail(function () { + NETDATA.chartLibraries.google.enabled = false; + NETDATA.error(100, NETDATA.google_js); + if (typeof callback === "function") { + return callback(); + } + }); + } else { + NETDATA.chartLibraries.google.enabled = false; + if (typeof callback === "function") { + return callback(); + } + } +}; + +NETDATA.googleChartUpdate = function (state, data) { + let datatable = new google.visualization.DataTable(data.result); + state.google_instance.draw(datatable, state.google_options); + return true; +}; + +NETDATA.googleChartCreate = function (state, data) { + let datatable = new google.visualization.DataTable(data.result); + + state.google_options = { + colors: state.chartColors(), + + // do not set width, height - the chart resizes itself + //width: state.chartWidth(), + //height: state.chartHeight(), + lineWidth: 1, + title: state.title, + fontSize: 11, + hAxis: { + // title: "Time of Day", + // format:'HH:mm:ss', + viewWindowMode: 'maximized', + slantedText: false, + format: 'HH:mm:ss', + textStyle: { + fontSize: 9 + }, + gridlines: { + color: '#EEE' + } + }, + vAxis: { + title: state.units_current, + viewWindowMode: 'pretty', + minValue: -0.1, + maxValue: 0.1, + direction: 1, + textStyle: { + fontSize: 9 + }, + gridlines: { + color: '#EEE' + } + }, + chartArea: { + width: '65%', + height: '80%' + }, + focusTarget: 'category', + annotation: { + '1': { + style: 'line' + } + }, + pointsVisible: 0, + titlePosition: 'out', + titleTextStyle: { + fontSize: 11 + }, + tooltip: { + isHtml: false, + ignoreBounds: true, + textStyle: { + fontSize: 9 + } + }, + curveType: 'function', + areaOpacity: 0.3, + isStacked: false + }; + + switch (state.chart.chart_type) { + case "area": + state.google_options.vAxis.viewWindowMode = 'maximized'; + state.google_options.areaOpacity = NETDATA.options.current.color_fill_opacity_area; + state.google_instance = new google.visualization.AreaChart(state.element_chart); + break; + + case "stacked": + state.google_options.isStacked = true; + state.google_options.areaOpacity = NETDATA.options.current.color_fill_opacity_stacked; + state.google_options.vAxis.viewWindowMode = 'maximized'; + state.google_options.vAxis.minValue = null; + state.google_options.vAxis.maxValue = null; + state.google_instance = new google.visualization.AreaChart(state.element_chart); + break; + + default: + case "line": + state.google_options.lineWidth = 2; + state.google_instance = new google.visualization.LineChart(state.element_chart); + break; + } + + state.google_instance.draw(datatable, state.google_options); + return true; +}; diff --git a/web/gui/src/dashboard.js/charting/peity.js b/web/gui/src/dashboard.js/charting/peity.js new file mode 100644 index 000000000..012fb9c21 --- /dev/null +++ b/web/gui/src/dashboard.js/charting/peity.js @@ -0,0 +1,62 @@ + +// peity + +NETDATA.peityInitialize = function (callback) { + if (typeof netdataNoPeitys === 'undefined' || !netdataNoPeitys) { + $.ajax({ + url: NETDATA.peity_js, + cache: true, + dataType: "script", + xhrFields: {withCredentials: true} // required for the cookie + }) + .done(function () { + NETDATA.registerChartLibrary('peity', NETDATA.peity_js); + }) + .fail(function () { + NETDATA.chartLibraries.peity.enabled = false; + NETDATA.error(100, NETDATA.peity_js); + }) + .always(function () { + if (typeof callback === "function") { + return callback(); + } + }); + } else { + NETDATA.chartLibraries.peity.enabled = false; + if (typeof callback === "function") { + return callback(); + } + } +}; + +NETDATA.peityChartUpdate = function (state, data) { + state.peity_instance.innerHTML = data.result; + + if (state.peity_options.stroke !== state.chartCustomColors()[0]) { + state.peity_options.stroke = state.chartCustomColors()[0]; + if (state.chart.chart_type === 'line') { + state.peity_options.fill = NETDATA.themes.current.background; + } else { + state.peity_options.fill = NETDATA.colorLuminance(state.chartCustomColors()[0], NETDATA.chartDefaults.fill_luminance); + } + } + + $(state.peity_instance).peity('line', state.peity_options); + return true; +}; + +NETDATA.peityChartCreate = function (state, data) { + state.peity_instance = document.createElement('div'); + state.element_chart.appendChild(state.peity_instance); + + state.peity_options = { + stroke: NETDATA.themes.current.foreground, + strokeWidth: NETDATA.dataAttribute(state.element, 'peity-strokewidth', 1), + width: state.chartWidth(), + height: state.chartHeight(), + fill: NETDATA.themes.current.foreground + }; + + NETDATA.peityChartUpdate(state, data); + return true; +}; diff --git a/web/gui/src/dashboard.js/charting/sparkline.js b/web/gui/src/dashboard.js/charting/sparkline.js new file mode 100644 index 000000000..5d8a9e60f --- /dev/null +++ b/web/gui/src/dashboard.js/charting/sparkline.js @@ -0,0 +1,155 @@ +// ---------------------------------------------------------------------------------------------------------------- +// sparkline + +NETDATA.sparklineInitialize = function (callback) { + if (typeof netdataNoSparklines === 'undefined' || !netdataNoSparklines) { + $.ajax({ + url: NETDATA.sparkline_js, + cache: true, + dataType: "script", + xhrFields: {withCredentials: true} // required for the cookie + }) + .done(function () { + NETDATA.registerChartLibrary('sparkline', NETDATA.sparkline_js); + }) + .fail(function () { + NETDATA.chartLibraries.sparkline.enabled = false; + NETDATA.error(100, NETDATA.sparkline_js); + }) + .always(function () { + if (typeof callback === "function") { + return callback(); + } + }); + } else { + NETDATA.chartLibraries.sparkline.enabled = false; + if (typeof callback === "function") { + return callback(); + } + } +}; + +NETDATA.sparklineChartUpdate = function (state, data) { + state.sparkline_options.width = state.chartWidth(); + state.sparkline_options.height = state.chartHeight(); + + $(state.element_chart).sparkline(data.result, state.sparkline_options); + return true; +}; + +NETDATA.sparklineChartCreate = function (state, data) { + let type = NETDATA.dataAttribute(state.element, 'sparkline-type', 'line'); + let lineColor = NETDATA.dataAttribute(state.element, 'sparkline-linecolor', state.chartCustomColors()[0]); + let fillColor = NETDATA.dataAttribute(state.element, 'sparkline-fillcolor', ((state.chart.chart_type === 'line') ? NETDATA.themes.current.background : NETDATA.colorLuminance(lineColor, NETDATA.chartDefaults.fill_luminance))); + let chartRangeMin = NETDATA.dataAttribute(state.element, 'sparkline-chartrangemin', undefined); + let chartRangeMax = NETDATA.dataAttribute(state.element, 'sparkline-chartrangemax', undefined); + let composite = NETDATA.dataAttribute(state.element, 'sparkline-composite', undefined); + let enableTagOptions = NETDATA.dataAttribute(state.element, 'sparkline-enabletagoptions', undefined); + let tagOptionPrefix = NETDATA.dataAttribute(state.element, 'sparkline-tagoptionprefix', undefined); + let tagValuesAttribute = NETDATA.dataAttribute(state.element, 'sparkline-tagvaluesattribute', undefined); + let disableHiddenCheck = NETDATA.dataAttribute(state.element, 'sparkline-disablehiddencheck', undefined); + let defaultPixelsPerValue = NETDATA.dataAttribute(state.element, 'sparkline-defaultpixelspervalue', undefined); + let spotColor = NETDATA.dataAttribute(state.element, 'sparkline-spotcolor', undefined); + let minSpotColor = NETDATA.dataAttribute(state.element, 'sparkline-minspotcolor', undefined); + let maxSpotColor = NETDATA.dataAttribute(state.element, 'sparkline-maxspotcolor', undefined); + let spotRadius = NETDATA.dataAttribute(state.element, 'sparkline-spotradius', undefined); + let valueSpots = NETDATA.dataAttribute(state.element, 'sparkline-valuespots', undefined); + let highlightSpotColor = NETDATA.dataAttribute(state.element, 'sparkline-highlightspotcolor', undefined); + let highlightLineColor = NETDATA.dataAttribute(state.element, 'sparkline-highlightlinecolor', undefined); + let lineWidth = NETDATA.dataAttribute(state.element, 'sparkline-linewidth', undefined); + let normalRangeMin = NETDATA.dataAttribute(state.element, 'sparkline-normalrangemin', undefined); + let normalRangeMax = NETDATA.dataAttribute(state.element, 'sparkline-normalrangemax', undefined); + let drawNormalOnTop = NETDATA.dataAttribute(state.element, 'sparkline-drawnormalontop', undefined); + let xvalues = NETDATA.dataAttribute(state.element, 'sparkline-xvalues', undefined); + let chartRangeClip = NETDATA.dataAttribute(state.element, 'sparkline-chartrangeclip', undefined); + let chartRangeMinX = NETDATA.dataAttribute(state.element, 'sparkline-chartrangeminx', undefined); + let chartRangeMaxX = NETDATA.dataAttribute(state.element, 'sparkline-chartrangemaxx', undefined); + let disableInteraction = NETDATA.dataAttributeBoolean(state.element, 'sparkline-disableinteraction', false); + let disableTooltips = NETDATA.dataAttributeBoolean(state.element, 'sparkline-disabletooltips', false); + let disableHighlight = NETDATA.dataAttributeBoolean(state.element, 'sparkline-disablehighlight', false); + let highlightLighten = NETDATA.dataAttribute(state.element, 'sparkline-highlightlighten', 1.4); + let highlightColor = NETDATA.dataAttribute(state.element, 'sparkline-highlightcolor', undefined); + let tooltipContainer = NETDATA.dataAttribute(state.element, 'sparkline-tooltipcontainer', undefined); + let tooltipClassname = NETDATA.dataAttribute(state.element, 'sparkline-tooltipclassname', undefined); + let tooltipFormat = NETDATA.dataAttribute(state.element, 'sparkline-tooltipformat', undefined); + let tooltipPrefix = NETDATA.dataAttribute(state.element, 'sparkline-tooltipprefix', undefined); + let tooltipSuffix = NETDATA.dataAttribute(state.element, 'sparkline-tooltipsuffix', ' ' + state.units_current); + let tooltipSkipNull = NETDATA.dataAttributeBoolean(state.element, 'sparkline-tooltipskipnull', true); + let tooltipValueLookups = NETDATA.dataAttribute(state.element, 'sparkline-tooltipvaluelookups', undefined); + let tooltipFormatFieldlist = NETDATA.dataAttribute(state.element, 'sparkline-tooltipformatfieldlist', undefined); + let tooltipFormatFieldlistKey = NETDATA.dataAttribute(state.element, 'sparkline-tooltipformatfieldlistkey', undefined); + let numberFormatter = NETDATA.dataAttribute(state.element, 'sparkline-numberformatter', function (n) { + return n.toFixed(2); + }); + let numberDigitGroupSep = NETDATA.dataAttribute(state.element, 'sparkline-numberdigitgroupsep', undefined); + let numberDecimalMark = NETDATA.dataAttribute(state.element, 'sparkline-numberdecimalmark', undefined); + let numberDigitGroupCount = NETDATA.dataAttribute(state.element, 'sparkline-numberdigitgroupcount', undefined); + let animatedZooms = NETDATA.dataAttributeBoolean(state.element, 'sparkline-animatedzooms', false); + + if (spotColor === 'disable') { + spotColor = ''; + } + if (minSpotColor === 'disable') { + minSpotColor = ''; + } + if (maxSpotColor === 'disable') { + maxSpotColor = ''; + } + + // state.log('sparkline type ' + type + ', lineColor: ' + lineColor + ', fillColor: ' + fillColor); + + state.sparkline_options = { + type: type, + lineColor: lineColor, + fillColor: fillColor, + chartRangeMin: chartRangeMin, + chartRangeMax: chartRangeMax, + composite: composite, + enableTagOptions: enableTagOptions, + tagOptionPrefix: tagOptionPrefix, + tagValuesAttribute: tagValuesAttribute, + disableHiddenCheck: disableHiddenCheck, + defaultPixelsPerValue: defaultPixelsPerValue, + spotColor: spotColor, + minSpotColor: minSpotColor, + maxSpotColor: maxSpotColor, + spotRadius: spotRadius, + valueSpots: valueSpots, + highlightSpotColor: highlightSpotColor, + highlightLineColor: highlightLineColor, + lineWidth: lineWidth, + normalRangeMin: normalRangeMin, + normalRangeMax: normalRangeMax, + drawNormalOnTop: drawNormalOnTop, + xvalues: xvalues, + chartRangeClip: chartRangeClip, + chartRangeMinX: chartRangeMinX, + chartRangeMaxX: chartRangeMaxX, + disableInteraction: disableInteraction, + disableTooltips: disableTooltips, + disableHighlight: disableHighlight, + highlightLighten: highlightLighten, + highlightColor: highlightColor, + tooltipContainer: tooltipContainer, + tooltipClassname: tooltipClassname, + tooltipChartTitle: state.title, + tooltipFormat: tooltipFormat, + tooltipPrefix: tooltipPrefix, + tooltipSuffix: tooltipSuffix, + tooltipSkipNull: tooltipSkipNull, + tooltipValueLookups: tooltipValueLookups, + tooltipFormatFieldlist: tooltipFormatFieldlist, + tooltipFormatFieldlistKey: tooltipFormatFieldlistKey, + numberFormatter: numberFormatter, + numberDigitGroupSep: numberDigitGroupSep, + numberDecimalMark: numberDecimalMark, + numberDigitGroupCount: numberDigitGroupCount, + animatedZooms: animatedZooms, + width: state.chartWidth(), + height: state.chartHeight() + }; + + $(state.element_chart).sparkline(data.result, state.sparkline_options); + + return true; +}; diff --git a/web/gui/src/dashboard.js/colors.js b/web/gui/src/dashboard.js/colors.js new file mode 100644 index 000000000..4b98c017c --- /dev/null +++ b/web/gui/src/dashboard.js/colors.js @@ -0,0 +1,34 @@ +NETDATA.colorHex2Rgb = function (hex) { + // Expand shorthand form (e.g. "03F") to full form (e.g. "0033FF") + let shorthandRegex = /^#?([a-f\d])([a-f\d])([a-f\d])$/i; + hex = hex.replace(shorthandRegex, function (m, r, g, b) { + return r + r + g + g + b + b; + }); + + let result = /^#?([a-f\d]{2})([a-f\d]{2})([a-f\d]{2})$/i.exec(hex); + return result ? { + r: parseInt(result[1], 16), + g: parseInt(result[2], 16), + b: parseInt(result[3], 16) + } : null; +}; + +NETDATA.colorLuminance = function (hex, lum) { + // validate hex string + hex = String(hex).replace(/[^0-9a-f]/gi, ''); + if (hex.length < 6) { + hex = hex[0] + hex[0] + hex[1] + hex[1] + hex[2] + hex[2]; + } + + lum = lum || 0; + + // convert to decimal and change luminosity + let rgb = "#"; + for (let i = 0; i < 3; i++) { + let c = parseInt(hex.substr(i * 2, 2), 16); + c = Math.round(Math.min(Math.max(0, c + (c * lum)), 255)).toString(16); + rgb += ("00" + c).substr(c.length); + } + + return rgb; +}; diff --git a/web/gui/src/dashboard.js/common.js b/web/gui/src/dashboard.js/common.js new file mode 100644 index 000000000..aa9d4bac3 --- /dev/null +++ b/web/gui/src/dashboard.js/common.js @@ -0,0 +1,249 @@ + +// Compute common (joint) values over multiple charts. + + +// commonMin & commonMax + +NETDATA.commonMin = { + keys: {}, + latest: {}, + + globalReset: function () { + this.keys = {}; + this.latest = {}; + }, + + get: function (state) { + if (typeof state.tmp.__commonMin === 'undefined') { + // get the commonMin setting + state.tmp.__commonMin = NETDATA.dataAttribute(state.element, 'common-min', null); + } + + let min = state.data.min; + let name = state.tmp.__commonMin; + + if (name === null) { + // we don't need commonMin + //state.log('no need for commonMin'); + return min; + } + + let t = this.keys[name]; + if (typeof t === 'undefined') { + // add our commonMin + this.keys[name] = {}; + t = this.keys[name]; + } + + let uuid = state.uuid; + if (typeof t[uuid] !== 'undefined') { + if (t[uuid] === min) { + //state.log('commonMin ' + state.tmp.__commonMin + ' not changed: ' + this.latest[name]); + return this.latest[name]; + } else if (min < this.latest[name]) { + //state.log('commonMin ' + state.tmp.__commonMin + ' increased: ' + min); + t[uuid] = min; + this.latest[name] = min; + return min; + } + } + + // add our min + t[uuid] = min; + + // find the common min + let m = min; + // for (let i in t) { + // if (t.hasOwnProperty(i) && t[i] < m) m = t[i]; + // } + for (const ti of Object.values(t)) { + if (ti < m) { + m = ti; + } + } + + //state.log('commonMin ' + state.tmp.__commonMin + ' updated: ' + m); + this.latest[name] = m; + return m; + } +}; + +NETDATA.commonMax = { + keys: {}, + latest: {}, + + globalReset: function () { + this.keys = {}; + this.latest = {}; + }, + + get: function (state) { + if (typeof state.tmp.__commonMax === 'undefined') { + // get the commonMax setting + state.tmp.__commonMax = NETDATA.dataAttribute(state.element, 'common-max', null); + } + + let max = state.data.max; + let name = state.tmp.__commonMax; + + if (name === null) { + // we don't need commonMax + //state.log('no need for commonMax'); + return max; + } + + let t = this.keys[name]; + if (typeof t === 'undefined') { + // add our commonMax + this.keys[name] = {}; + t = this.keys[name]; + } + + let uuid = state.uuid; + if (typeof t[uuid] !== 'undefined') { + if (t[uuid] === max) { + //state.log('commonMax ' + state.tmp.__commonMax + ' not changed: ' + this.latest[name]); + return this.latest[name]; + } else if (max > this.latest[name]) { + //state.log('commonMax ' + state.tmp.__commonMax + ' increased: ' + max); + t[uuid] = max; + this.latest[name] = max; + return max; + } + } + + // add our max + t[uuid] = max; + + // find the common max + let m = max; + // for (let i in t) { + // if (t.hasOwnProperty(i) && t[i] > m) m = t[i]; + // } + for (const ti of Object.values(t)) { + if (ti > m) { + m = ti; + } + } + + //state.log('commonMax ' + state.tmp.__commonMax + ' updated: ' + m); + this.latest[name] = m; + return m; + } +}; + +NETDATA.commonColors = { + keys: {}, + + globalReset: function () { + this.keys = {}; + }, + + get: function (state, label) { + let ret = this.refill(state); + + if (typeof ret.assigned[label] === 'undefined') { + ret.assigned[label] = ret.available.shift(); + } + + return ret.assigned[label]; + }, + + refill: function (state) { + let ret, len; + + if (typeof state.tmp.__commonColors === 'undefined') { + ret = this.prepare(state); + } else { + ret = this.keys[state.tmp.__commonColors]; + if (typeof ret === 'undefined') { + ret = this.prepare(state); + } + } + + if (ret.available.length === 0) { + if (ret.copy_theme || ret.custom.length === 0) { + // copy the theme colors + len = NETDATA.themes.current.colors.length; + while (len--) { + ret.available.unshift(NETDATA.themes.current.colors[len]); + } + } + + // copy the custom colors + len = ret.custom.length; + while (len--) { + ret.available.unshift(ret.custom[len]); + } + } + + state.colors_assigned = ret.assigned; + state.colors_available = ret.available; + state.colors_custom = ret.custom; + + return ret; + }, + + __read_custom_colors: function (state, ret) { + // add the user supplied colors + let c = NETDATA.dataAttribute(state.element, 'colors', undefined); + if (typeof c === 'string' && c.length > 0) { + c = c.split(' '); + let len = c.length; + + if (len > 0 && c[len - 1] === 'ONLY') { + len--; + ret.copy_theme = false; + } + + while (len--) { + ret.custom.unshift(c[len]); + } + } + }, + + prepare: function (state) { + let has_custom_colors = false; + + if (typeof state.tmp.__commonColors === 'undefined') { + let defname = state.chart.context; + + // if this chart has data-colors="" + // we should use the chart uuid as the default key (private palette) + // (data-common-colors="NAME" will be used anyways) + let c = NETDATA.dataAttribute(state.element, 'colors', undefined); + if (typeof c === 'string' && c.length > 0) { + defname = state.uuid; + has_custom_colors = true; + } + + // get the commonColors setting + state.tmp.__commonColors = NETDATA.dataAttribute(state.element, 'common-colors', defname); + } + + let name = state.tmp.__commonColors; + let ret = this.keys[name]; + + if (typeof ret === 'undefined') { + // add our commonMax + this.keys[name] = { + assigned: {}, // name-value of dimensions and their colors + available: [], // an array of colors available to be used + custom: [], // the array of colors defined by the user + charts: {}, // the charts linked to this + copy_theme: true + }; + ret = this.keys[name]; + } + + if (typeof ret.charts[state.uuid] === 'undefined') { + ret.charts[state.uuid] = state; + + if (has_custom_colors) { + this.__read_custom_colors(state, ret); + } + } + + return ret; + } +}; diff --git a/web/gui/src/dashboard.js/compatibility.js b/web/gui/src/dashboard.js/compatibility.js new file mode 100644 index 000000000..e1ecfbdb2 --- /dev/null +++ b/web/gui/src/dashboard.js/compatibility.js @@ -0,0 +1,31 @@ +// *** src/dashboard.js/compatibility.js + +// Compatibility fixes. + +// fix IE issue with console +if (!window.console) { + window.console = { + log: function () { + } + }; +} + +// if string.endsWith is not defined, define it +if (typeof String.prototype.endsWith !== 'function') { + String.prototype.endsWith = function (s) { + if (s.length > this.length) { + return false; + } + return this.slice(-s.length) === s; + }; +} + +// if string.startsWith is not defined, define it +if (typeof String.prototype.startsWith !== 'function') { + String.prototype.startsWith = function (s) { + if (s.length > this.length) { + return false; + } + return this.slice(s.length) === s; + }; +} diff --git a/web/gui/src/dashboard.js/dependencies.js b/web/gui/src/dashboard.js/dependencies.js new file mode 100644 index 000000000..fff7818ac --- /dev/null +++ b/web/gui/src/dashboard.js/dependencies.js @@ -0,0 +1,21 @@ + +// *** src/dashboard.js/dependencies.js + +// default URLs for all the external files we need +// make them RELATIVE so that the whole thing can also be +// installed under a web server +NETDATA.jQuery = NETDATA.serverStatic + 'lib/jquery-2.2.4.min.js'; +NETDATA.peity_js = NETDATA.serverStatic + 'lib/jquery.peity-3.2.0.min.js'; +NETDATA.sparkline_js = NETDATA.serverStatic + 'lib/jquery.sparkline-2.1.2.min.js'; +NETDATA.easypiechart_js = NETDATA.serverStatic + 'lib/jquery.easypiechart-97b5824.min.js'; +NETDATA.gauge_js = NETDATA.serverStatic + 'lib/gauge-1.3.2.min.js'; +NETDATA.dygraph_js = NETDATA.serverStatic + 'lib/dygraph-c91c859.min.js'; +NETDATA.dygraph_smooth_js = NETDATA.serverStatic + 'lib/dygraph-smooth-plotter-c91c859.js'; +// NETDATA.raphael_js = NETDATA.serverStatic + 'lib/raphael-2.2.4-min.js'; +// NETDATA.c3_js = NETDATA.serverStatic + 'lib/c3-0.4.18.min.js'; +// NETDATA.c3_css = NETDATA.serverStatic + 'css/c3-0.4.18.min.css'; +NETDATA.d3pie_js = NETDATA.serverStatic + 'lib/d3pie-0.2.1-netdata-3.js'; +NETDATA.d3_js = NETDATA.serverStatic + 'lib/d3-4.12.2.min.js'; +// NETDATA.morris_js = NETDATA.serverStatic + 'lib/morris-0.5.1.min.js'; +// NETDATA.morris_css = NETDATA.serverStatic + 'css/morris-0.5.1.css'; +NETDATA.google_js = 'https://www.google.com/jsapi'; diff --git a/web/gui/src/dashboard.js/epilogue.js.inc b/web/gui/src/dashboard.js/epilogue.js.inc new file mode 100644 index 000000000..c612988cc --- /dev/null +++ b/web/gui/src/dashboard.js/epilogue.js.inc @@ -0,0 +1 @@ +})(window, document, (typeof jQuery === 'function')?jQuery:undefined); diff --git a/web/gui/src/dashboard.js/error-handling.js b/web/gui/src/dashboard.js/error-handling.js new file mode 100644 index 000000000..abc7c6187 --- /dev/null +++ b/web/gui/src/dashboard.js/error-handling.js @@ -0,0 +1,52 @@ +// Error Handling + +NETDATA.errorCodes = { + 100: {message: "Cannot load chart library", alert: true}, + 101: {message: "Cannot load jQuery", alert: true}, + 402: {message: "Chart library not found", alert: false}, + 403: {message: "Chart library not enabled/is failed", alert: false}, + 404: {message: "Chart not found", alert: false}, + 405: {message: "Cannot download charts index from server", alert: true}, + 406: {message: "Invalid charts index downloaded from server", alert: true}, + 407: {message: "Cannot HELLO netdata server", alert: false}, + 408: {message: "Netdata servers sent invalid response to HELLO", alert: false}, + 409: {message: "Cannot ACCESS netdata registry", alert: false}, + 410: {message: "Netdata registry ACCESS failed", alert: false}, + 411: {message: "Netdata registry server send invalid response to DELETE ", alert: false}, + 412: {message: "Netdata registry DELETE failed", alert: false}, + 413: {message: "Netdata registry server send invalid response to SWITCH ", alert: false}, + 414: {message: "Netdata registry SWITCH failed", alert: false}, + 415: {message: "Netdata alarms download failed", alert: false}, + 416: {message: "Netdata alarms log download failed", alert: false}, + 417: {message: "Netdata registry server send invalid response to SEARCH ", alert: false}, + 418: {message: "Netdata registry SEARCH failed", alert: false} +}; + +NETDATA.errorLast = { + code: 0, + message: "", + datetime: 0 +}; + +NETDATA.error = function (code, msg) { + NETDATA.errorLast.code = code; + NETDATA.errorLast.message = msg; + NETDATA.errorLast.datetime = Date.now(); + + console.log("ERROR " + code + ": " + NETDATA.errorCodes[code].message + ": " + msg); + + let ret = true; + if (typeof netdataErrorCallback === 'function') { + ret = netdataErrorCallback('system', code, msg); + } + + if (ret && NETDATA.errorCodes[code].alert) { + alert("ERROR " + code + ": " + NETDATA.errorCodes[code].message + ": " + msg); + } +}; + +NETDATA.errorReset = function () { + NETDATA.errorLast.code = 0; + NETDATA.errorLast.message = "You are doing fine!"; + NETDATA.errorLast.datetime = 0; +}; diff --git a/web/gui/src/dashboard.js/localstorage.js b/web/gui/src/dashboard.js/localstorage.js new file mode 100644 index 000000000..5bbf5a22d --- /dev/null +++ b/web/gui/src/dashboard.js/localstorage.js @@ -0,0 +1,173 @@ + +// local storage options + +NETDATA.localStorage = { + default: {}, + current: {}, + callback: {} // only used for resetting back to defaults +}; + +NETDATA.localStorageTested = -1; +NETDATA.localStorageTest = function () { + if (NETDATA.localStorageTested !== -1) { + return NETDATA.localStorageTested; + } + + if (typeof Storage !== "undefined" && typeof localStorage === 'object') { + let test = 'test'; + try { + localStorage.setItem(test, test); + localStorage.removeItem(test); + NETDATA.localStorageTested = true; + } catch (e) { + NETDATA.localStorageTested = false; + } + } else { + NETDATA.localStorageTested = false; + } + + return NETDATA.localStorageTested; +}; + +NETDATA.localStorageGet = function (key, def, callback) { + let ret = def; + + if (typeof NETDATA.localStorage.default[key.toString()] === 'undefined') { + NETDATA.localStorage.default[key.toString()] = def; + NETDATA.localStorage.callback[key.toString()] = callback; + } + + if (NETDATA.localStorageTest()) { + try { + // console.log('localStorage: loading "' + key.toString() + '"'); + ret = localStorage.getItem(key.toString()); + // console.log('netdata loaded: ' + key.toString() + ' = ' + ret.toString()); + if (ret === null || ret === 'undefined') { + // console.log('localStorage: cannot load it, saving "' + key.toString() + '" with value "' + JSON.stringify(def) + '"'); + localStorage.setItem(key.toString(), JSON.stringify(def)); + ret = def; + } else { + // console.log('localStorage: got "' + key.toString() + '" with value "' + ret + '"'); + ret = JSON.parse(ret); + // console.log('localStorage: loaded "' + key.toString() + '" as value ' + ret + ' of type ' + typeof(ret)); + } + } catch (error) { + console.log('localStorage: failed to read "' + key.toString() + '", using default: "' + def.toString() + '"'); + ret = def; + } + } + + if (typeof ret === 'undefined' || ret === 'undefined') { + console.log('localStorage: LOADED UNDEFINED "' + key.toString() + '" as value ' + ret + ' of type ' + typeof(ret)); + ret = def; + } + + NETDATA.localStorage.current[key.toString()] = ret; + return ret; +}; + +NETDATA.localStorageSet = function (key, value, callback) { + if (typeof value === 'undefined' || value === 'undefined') { + console.log('localStorage: ATTEMPT TO SET UNDEFINED "' + key.toString() + '" as value ' + value + ' of type ' + typeof(value)); + } + + if (typeof NETDATA.localStorage.default[key.toString()] === 'undefined') { + NETDATA.localStorage.default[key.toString()] = value; + NETDATA.localStorage.current[key.toString()] = value; + NETDATA.localStorage.callback[key.toString()] = callback; + } + + if (NETDATA.localStorageTest()) { + // console.log('localStorage: saving "' + key.toString() + '" with value "' + JSON.stringify(value) + '"'); + try { + localStorage.setItem(key.toString(), JSON.stringify(value)); + } catch (e) { + console.log('localStorage: failed to save "' + key.toString() + '" with value: "' + value.toString() + '"'); + } + } + + NETDATA.localStorage.current[key.toString()] = value; + return value; +}; + +NETDATA.localStorageGetRecursive = function (obj, prefix, callback) { + let keys = Object.keys(obj); + let len = keys.length; + while (len--) { + let i = keys[len]; + + if (typeof obj[i] === 'object') { + //console.log('object ' + prefix + '.' + i.toString()); + NETDATA.localStorageGetRecursive(obj[i], prefix + '.' + i.toString(), callback); + continue; + } + + obj[i] = NETDATA.localStorageGet(prefix + '.' + i.toString(), obj[i], callback); + } +}; + +NETDATA.setOption = function (key, value) { + if (key.toString() === 'setOptionCallback') { + if (typeof NETDATA.options.current.setOptionCallback === 'function') { + NETDATA.options.current[key.toString()] = value; + NETDATA.options.current.setOptionCallback(); + } + } else if (NETDATA.options.current[key.toString()] !== value) { + let name = 'options.' + key.toString(); + + if (typeof NETDATA.localStorage.default[name.toString()] === 'undefined') { + console.log('localStorage: setOption() on unsaved option: "' + name.toString() + '", value: ' + value); + } + + //console.log(NETDATA.localStorage); + //console.log('setOption: setting "' + key.toString() + '" to "' + value + '" of type ' + typeof(value) + ' original type ' + typeof(NETDATA.options.current[key.toString()])); + //console.log(NETDATA.options); + NETDATA.options.current[key.toString()] = NETDATA.localStorageSet(name.toString(), value, null); + + if (typeof NETDATA.options.current.setOptionCallback === 'function') { + NETDATA.options.current.setOptionCallback(); + } + } + + return true; +}; + +NETDATA.getOption = function (key) { + return NETDATA.options.current[key.toString()]; +}; + +// read settings from local storage +NETDATA.localStorageGetRecursive(NETDATA.options.current, 'options', null); + +// always start with this option enabled. +NETDATA.setOption('stop_updates_when_focus_is_lost', true); + +NETDATA.resetOptions = function () { + let keys = Object.keys(NETDATA.localStorage.default); + let len = keys.length; + + while (len--) { + let i = keys[len]; + let a = i.split('.'); + + if (a[0] === 'options') { + if (a[1] === 'setOptionCallback') { + continue; + } + if (typeof NETDATA.localStorage.default[i] === 'undefined') { + continue; + } + if (NETDATA.options.current[i] === NETDATA.localStorage.default[i]) { + continue; + } + + NETDATA.setOption(a[1], NETDATA.localStorage.default[i]); + } else if (a[0] === 'chart_heights') { + if (typeof NETDATA.localStorage.callback[i] === 'function' && typeof NETDATA.localStorage.default[i] !== 'undefined') { + NETDATA.localStorage.callback[i](NETDATA.localStorage.default[i]); + } + } + } + + NETDATA.dateTime.init(NETDATA.options.current.timezone); +}; diff --git a/web/gui/src/dashboard.js/main.js b/web/gui/src/dashboard.js/main.js new file mode 100644 index 000000000..3d8cc3b7c --- /dev/null +++ b/web/gui/src/dashboard.js/main.js @@ -0,0 +1,4273 @@ + +// *** src/dashboard.js/main.js + +if (NETDATA.options.debug.main_loop) { + console.log('welcome to NETDATA'); +} + +NETDATA.onresizeCallback = null; +NETDATA.onresize = function () { + NETDATA.options.last_page_resize = Date.now(); + NETDATA.onscroll(); + + if (typeof NETDATA.onresizeCallback === 'function') { + NETDATA.onresizeCallback(); + } +}; + +NETDATA.abortAllRefreshes = function () { + let targets = NETDATA.options.targets; + let len = targets.length; + + while (len--) { + if (targets[len].fetching_data) { + if (typeof targets[len].xhr !== 'undefined') { + targets[len].xhr.abort(); + targets[len].running = false; + targets[len].fetching_data = false; + } + } + } +}; + +NETDATA.onscrollStartDelay = function () { + NETDATA.options.last_page_scroll = Date.now(); + + NETDATA.options.on_scroll_refresher_stop_until = + NETDATA.options.last_page_scroll + + (NETDATA.options.current.async_on_scroll ? 1000 : 0); +}; + +NETDATA.onscrollEndDelay = function () { + NETDATA.options.on_scroll_refresher_stop_until = + Date.now() + + (NETDATA.options.current.async_on_scroll ? NETDATA.options.current.onscroll_worker_duration_threshold : 0); +}; + +NETDATA.onscroll_updater_timeout_id = undefined; +NETDATA.onscrollUpdater = function () { + NETDATA.globalSelectionSync.stop(); + + if (NETDATA.options.abort_ajax_on_scroll) { + NETDATA.abortAllRefreshes(); + } + + // when the user scrolls he sees that we have + // hidden all the not-visible charts + // using this little function we try to switch + // the charts back to visible quickly + + if (!NETDATA.intersectionObserver.enabled()) { + if (!NETDATA.options.current.parallel_refresher) { + let targets = NETDATA.options.targets; + let len = targets.length; + + while (len--) { + if (!targets[len].running) { + targets[len].isVisible(); + } + } + } + } + + NETDATA.onscrollEndDelay(); +}; + +NETDATA.scrollUp = false; +NETDATA.scrollY = window.scrollY; +NETDATA.onscroll = function () { + //console.log('onscroll() begin'); + + NETDATA.onscrollStartDelay(); + NETDATA.chartRefresherReschedule(); + + NETDATA.scrollUp = (window.scrollY > NETDATA.scrollY); + NETDATA.scrollY = window.scrollY; + + if (NETDATA.onscroll_updater_timeout_id) { + NETDATA.timeout.clear(NETDATA.onscroll_updater_timeout_id); + } + + NETDATA.onscroll_updater_timeout_id = NETDATA.timeout.set(NETDATA.onscrollUpdater, 0); + //console.log('onscroll() end'); +}; + +NETDATA.supportsPassiveEvents = function () { + if (NETDATA.options.passive_events === null) { + let supportsPassive = false; + try { + let opts = Object.defineProperty({}, 'passive', { + get: function () { + supportsPassive = true; + } + }); + window.addEventListener("test", null, opts); + } catch (e) { + console.log('browser does not support passive events'); + } + + NETDATA.options.passive_events = supportsPassive; + } + + // console.log('passive ' + NETDATA.options.passive_events); + return NETDATA.options.passive_events; +}; + +window.addEventListener('resize', NETDATA.onresize, NETDATA.supportsPassiveEvents() ? {passive: true} : false); +window.addEventListener('scroll', NETDATA.onscroll, NETDATA.supportsPassiveEvents() ? {passive: true} : false); +// window.onresize = NETDATA.onresize; +// window.onscroll = NETDATA.onscroll; + +// ---------------------------------------------------------------------------------------------------------------- +// Global Pan and Zoom on charts + +// Using this structure are synchronize all the charts, so that +// when you pan or zoom one, all others are automatically refreshed +// to the same timespan. + +NETDATA.globalPanAndZoom = { + seq: 0, // timestamp ms + // every time a chart is panned or zoomed + // we set the timestamp here + // then we use it as a sequence number + // to find if other charts are synchronized + // to this time-range + + master: null, // the master chart (state), to which all others + // are synchronized + + force_before_ms: null, // the timespan to sync all other charts + force_after_ms: null, + + callback: null, + + globalReset: function () { + this.clearMaster(); + this.seq = 0; + this.master = null; + this.force_after_ms = null; + this.force_before_ms = null; + this.callback = null; + }, + + delay: function () { + if (NETDATA.options.debug.globalPanAndZoom) { + console.log('globalPanAndZoom.delay()'); + } + + NETDATA.options.auto_refresher_stop_until = Date.now() + NETDATA.options.current.global_pan_sync_time; + }, + + // set a new master + setMaster: function (state, after, before) { + this.delay(); + + if (!NETDATA.options.current.sync_pan_and_zoom) { + return; + } + + if (this.master === null) { + if (NETDATA.options.debug.globalPanAndZoom) { + console.log('globalPanAndZoom.setMaster(' + state.id + ', ' + after + ', ' + before + ') SET MASTER'); + } + } else if (this.master !== state) { + if (NETDATA.options.debug.globalPanAndZoom) { + console.log('globalPanAndZoom.setMaster(' + state.id + ', ' + after + ', ' + before + ') CHANGED MASTER'); + } + + this.master.resetChart(true, true); + } + + let now = Date.now(); + this.master = state; + this.seq = now; + this.force_after_ms = after; + this.force_before_ms = before; + + if (typeof this.callback === 'function') { + this.callback(true, after, before); + } + }, + + // clear the master + clearMaster: function () { + // if (NETDATA.options.debug.globalPanAndZoom === true) + // console.log('globalPanAndZoom.clearMaster()'); + if (NETDATA.options.debug.globalPanAndZoom) { + console.log('globalPanAndZoom.clearMaster()'); + } + + if (this.master !== null) { + let st = this.master; + this.master = null; + st.resetChart(); + } + + this.master = null; + this.seq = 0; + this.force_after_ms = null; + this.force_before_ms = null; + NETDATA.options.auto_refresher_stop_until = 0; + + if (typeof this.callback === 'function') { + this.callback(false, 0, 0); + } + }, + + // is the given state the master of the global + // pan and zoom sync? + isMaster: function (state) { + return (this.master === state); + }, + + // are we currently have a global pan and zoom sync? + isActive: function () { + return (this.master !== null && this.force_before_ms !== null && this.force_after_ms !== null && this.seq !== 0); + }, + + // check if a chart, other than the master + // needs to be refreshed, due to the global pan and zoom + shouldBeAutoRefreshed: function (state) { + if (this.master === null || this.seq === 0) { + return false; + } + + //if (state.needsRecreation()) + // return true; + + return (state.tm.pan_and_zoom_seq !== this.seq); + } +}; + +// ---------------------------------------------------------------------------------------------------------------- +// global chart underlay (time-frame highlighting) + +NETDATA.globalChartUnderlay = { + callback: null, // what to call when a highlighted range is setup + after: null, // highlight after this time + before: null, // highlight before this time + view_after: null, // the charts after_ms viewport when the highlight was setup + view_before: null, // the charts before_ms viewport, when the highlight was setup + state: null, // the chart the highlight was setup + + isActive: function () { + return (this.after !== null && this.before !== null); + }, + + hasViewport: function () { + return (this.state !== null && this.view_after !== null && this.view_before !== null); + }, + + init: function (state, after, before, view_after, view_before) { + this.state = (typeof state !== 'undefined') ? state : null; + this.after = (typeof after !== 'undefined' && after !== null && after > 0) ? after : null; + this.before = (typeof before !== 'undefined' && before !== null && before > 0) ? before : null; + this.view_after = (typeof view_after !== 'undefined' && view_after !== null && view_after > 0) ? view_after : null; + this.view_before = (typeof view_before !== 'undefined' && view_before !== null && view_before > 0) ? view_before : null; + }, + + setup: function () { + if (this.isActive()) { + if (this.state === null) { + this.state = NETDATA.options.targets[0]; + } + + if (typeof this.callback === 'function') { + this.callback(true, this.after, this.before); + } + } else { + if (typeof this.callback === 'function') { + this.callback(false, 0, 0); + } + } + }, + + set: function (state, after, before, view_after, view_before) { + if (after > before) { + let t = after; + after = before; + before = t; + } + + this.init(state, after, before, view_after, view_before); + + // if (this.hasViewport() === true) + // NETDATA.globalPanAndZoom.setMaster(this.state, this.view_after, this.view_before); + if (this.hasViewport()) { + NETDATA.globalPanAndZoom.setMaster(this.state, this.view_after, this.view_before); + } + + this.setup(); + }, + + clear: function () { + this.after = null; + this.before = null; + this.state = null; + this.view_after = null; + this.view_before = null; + + if (typeof this.callback === 'function') { + this.callback(false, 0, 0); + } + }, + + focus: function () { + if (this.isActive() && this.hasViewport()) { + if (this.state === null) { + this.state = NETDATA.options.targets[0]; + } + + if (NETDATA.globalPanAndZoom.isMaster(this.state)) { + NETDATA.globalPanAndZoom.clearMaster(); + } + + NETDATA.globalPanAndZoom.setMaster(this.state, this.view_after, this.view_before, true); + } + } +}; + +// ---------------------------------------------------------------------------------------------------------------- +// dimensions selection + +// TODO +// move color assignment to dimensions, here + +let dimensionStatus = function (parent, label, name_div, value_div, color) { + this.enabled = false; + this.parent = parent; + this.label = label; + this.name_div = null; + this.value_div = null; + this.color = NETDATA.themes.current.foreground; + this.selected = (parent.unselected_count === 0); + + this.setOptions(name_div, value_div, color); +}; + +dimensionStatus.prototype.invalidate = function () { + this.name_div = null; + this.value_div = null; + this.enabled = false; +}; + +dimensionStatus.prototype.setOptions = function (name_div, value_div, color) { + this.color = color; + + if (this.name_div !== name_div) { + this.name_div = name_div; + this.name_div.title = this.label; + this.name_div.style.setProperty('color', this.color, 'important'); + if (!this.selected) { + this.name_div.className = 'netdata-legend-name not-selected'; + } else { + this.name_div.className = 'netdata-legend-name selected'; + } + } + + if (this.value_div !== value_div) { + this.value_div = value_div; + this.value_div.title = this.label; + this.value_div.style.setProperty('color', this.color, 'important'); + if (!this.selected) { + this.value_div.className = 'netdata-legend-value not-selected'; + } else { + this.value_div.className = 'netdata-legend-value selected'; + } + } + + this.enabled = true; + this.setHandler(); +}; + +dimensionStatus.prototype.setHandler = function () { + if (!this.enabled) { + return; + } + + let ds = this; + + // this.name_div.onmousedown = this.value_div.onmousedown = function(e) { + this.name_div.onclick = this.value_div.onclick = function (e) { + e.preventDefault(); + if (ds.isSelected()) { + // this is selected + if (e.shiftKey || e.ctrlKey) { + // control or shift key is pressed -> unselect this (except is none will remain selected, in which case select all) + ds.unselect(); + + if (ds.parent.countSelected() === 0) { + ds.parent.selectAll(); + } + } else { + // no key is pressed -> select only this (except if it is the only selected already, in which case select all) + if (ds.parent.countSelected() === 1) { + ds.parent.selectAll(); + } else { + ds.parent.selectNone(); + ds.select(); + } + } + } + else { + // this is not selected + if (e.shiftKey || e.ctrlKey) { + // control or shift key is pressed -> select this too + ds.select(); + } else { + // no key is pressed -> select only this + ds.parent.selectNone(); + ds.select(); + } + } + + ds.parent.state.redrawChart(); + } +}; + +dimensionStatus.prototype.select = function () { + if (!this.enabled) { + return; + } + + this.name_div.className = 'netdata-legend-name selected'; + this.value_div.className = 'netdata-legend-value selected'; + this.selected = true; +}; + +dimensionStatus.prototype.unselect = function () { + if (!this.enabled) { + return; + } + + this.name_div.className = 'netdata-legend-name not-selected'; + this.value_div.className = 'netdata-legend-value hidden'; + this.selected = false; +}; + +dimensionStatus.prototype.isSelected = function () { + // return(this.enabled === true && this.selected === true); + return this.enabled && this.selected; +}; + +// ---------------------------------------------------------------------------------------------------------------- + +let dimensionsVisibility = function (state) { + this.state = state; + this.len = 0; + this.dimensions = {}; + this.selected_count = 0; + this.unselected_count = 0; +}; + +dimensionsVisibility.prototype.dimensionAdd = function (label, name_div, value_div, color) { + if (typeof this.dimensions[label] === 'undefined') { + this.len++; + this.dimensions[label] = new dimensionStatus(this, label, name_div, value_div, color); + } else { + this.dimensions[label].setOptions(name_div, value_div, color); + } + + return this.dimensions[label]; +}; + +dimensionsVisibility.prototype.dimensionGet = function (label) { + return this.dimensions[label]; +}; + +dimensionsVisibility.prototype.invalidateAll = function () { + let keys = Object.keys(this.dimensions); + let len = keys.length; + while (len--) { + this.dimensions[keys[len]].invalidate(); + } +}; + +dimensionsVisibility.prototype.selectAll = function () { + let keys = Object.keys(this.dimensions); + let len = keys.length; + while (len--) { + this.dimensions[keys[len]].select(); + } +}; + +dimensionsVisibility.prototype.countSelected = function () { + let selected = 0; + let keys = Object.keys(this.dimensions); + let len = keys.length; + while (len--) { + if (this.dimensions[keys[len]].isSelected()) { + selected++; + } + } + + return selected; +}; + +dimensionsVisibility.prototype.selectNone = function () { + let keys = Object.keys(this.dimensions); + let len = keys.length; + while (len--) { + this.dimensions[keys[len]].unselect(); + } +}; + +dimensionsVisibility.prototype.selected2BooleanArray = function (array) { + let ret = []; + this.selected_count = 0; + this.unselected_count = 0; + + let len = array.length; + while (len--) { + let ds = this.dimensions[array[len]]; + if (typeof ds === 'undefined') { + // console.log(array[i] + ' is not found'); + ret.unshift(false); + } else if (ds.isSelected()) { + ret.unshift(true); + this.selected_count++; + } else { + ret.unshift(false); + this.unselected_count++; + } + } + + if (this.selected_count === 0 && this.unselected_count !== 0) { + this.selectAll(); + return this.selected2BooleanArray(array); + } + + return ret; +}; + +// ---------------------------------------------------------------------------------------------------------------- +// date/time conversion + +NETDATA.dateTime = { + using_timezone: false, + + // these are the old netdata functions + // we fallback to these, if the new ones fail + + localeDateStringNative: function (d) { + return d.toLocaleDateString(); + }, + + localeTimeStringNative: function (d) { + return d.toLocaleTimeString(); + }, + + xAxisTimeStringNative: function (d) { + return NETDATA.zeropad(d.getHours()) + ":" + + NETDATA.zeropad(d.getMinutes()) + ":" + + NETDATA.zeropad(d.getSeconds()); + }, + + // initialize the new date/time conversion + // functions. + // if this fails, we fallback to the above + init: function (timezone) { + //console.log('init with timezone: ' + timezone); + + // detect browser timezone + try { + NETDATA.options.browser_timezone = Intl.DateTimeFormat().resolvedOptions().timeZone; + } catch (e) { + console.log('failed to detect browser timezone: ' + e.toString()); + NETDATA.options.browser_timezone = 'cannot-detect-it'; + } + + let ret = false; + + try { + let dateOptions = { + localeMatcher: 'best fit', + formatMatcher: 'best fit', + weekday: 'short', + year: 'numeric', + month: 'short', + day: '2-digit' + }; + + let timeOptions = { + localeMatcher: 'best fit', + hour12: false, + formatMatcher: 'best fit', + hour: '2-digit', + minute: '2-digit', + second: '2-digit' + }; + + let xAxisOptions = { + localeMatcher: 'best fit', + hour12: false, + formatMatcher: 'best fit', + hour: '2-digit', + minute: '2-digit', + second: '2-digit' + }; + + if (typeof timezone === 'string' && timezone !== '' && timezone !== 'default') { + dateOptions.timeZone = timezone; + timeOptions.timeZone = timezone; + timeOptions.timeZoneName = 'short'; + xAxisOptions.timeZone = timezone; + this.using_timezone = true; + } else { + timezone = 'default'; + this.using_timezone = false; + } + + this.dateFormat = new Intl.DateTimeFormat(navigator.language, dateOptions); + this.timeFormat = new Intl.DateTimeFormat(navigator.language, timeOptions); + this.xAxisFormat = new Intl.DateTimeFormat(navigator.language, xAxisOptions); + + this.localeDateString = function (d) { + return this.dateFormat.format(d); + }; + + this.localeTimeString = function (d) { + return this.timeFormat.format(d); + }; + + this.xAxisTimeString = function (d) { + return this.xAxisFormat.format(d); + }; + + //let d = new Date(); + //let t = this.dateFormat.format(d) + ' ' + this.timeFormat.format(d) + ' ' + this.xAxisFormat.format(d); + + ret = true; + } catch (e) { + console.log('Cannot setup Date/Time formatting: ' + e.toString()); + + timezone = 'default'; + this.localeDateString = this.localeDateStringNative; + this.localeTimeString = this.localeTimeStringNative; + this.xAxisTimeString = this.xAxisTimeStringNative; + this.using_timezone = false; + + ret = false; + } + + // save it + //console.log('init setOption timezone: ' + timezone); + NETDATA.setOption('timezone', timezone); + + return ret; + } +}; +NETDATA.dateTime.init(NETDATA.options.current.timezone); + +// ---------------------------------------------------------------------------------------------------------------- +// global selection sync + +NETDATA.globalSelectionSync = { + state: null, + dontSyncBefore: 0, + last_t: 0, + slaves: [], + timeoutId: undefined, + + globalReset: function () { + this.stop(); + this.state = null; + this.dontSyncBefore = 0; + this.last_t = 0; + this.slaves = []; + this.timeoutId = undefined; + }, + + active: function () { + return (this.state !== null); + }, + + // return true if global selection sync can be enabled now + enabled: function () { + // console.log('enabled()'); + // can we globally apply selection sync? + if (!NETDATA.options.current.sync_selection) { + return false; + } + + return (this.dontSyncBefore <= Date.now()); + }, + + // set the global selection sync master + setMaster: function (state) { + if (!this.enabled()) { + this.stop(); + return; + } + + if (this.state === state) { + return; + } + + if (this.state !== null) { + this.stop(); + } + + if (NETDATA.options.debug.globalSelectionSync) { + console.log('globalSelectionSync.setMaster(' + state.id + ')'); + } + + state.selected = true; + this.state = state; + this.last_t = 0; + + // find all slaves + let targets = NETDATA.intersectionObserver.targets(); + this.slaves = []; + let len = targets.length; + while (len--) { + let st = targets[len]; + if (this.state !== st && st.globalSelectionSyncIsEligible()) { + this.slaves.push(st); + } + } + + // this.delay(100); + }, + + // stop global selection sync + stop: function () { + if (this.state !== null) { + if (NETDATA.options.debug.globalSelectionSync) { + console.log('globalSelectionSync.stop()'); + } + + let len = this.slaves.length; + while (len--) { + this.slaves[len].clearSelection(); + } + + this.state.clearSelection(); + + this.last_t = 0; + this.slaves = []; + this.state = null; + } + }, + + // delay global selection sync for some time + delay: function (ms) { + if (NETDATA.options.current.sync_selection) { + // if (NETDATA.options.debug.globalSelectionSync === true) { + if (NETDATA.options.debug.globalSelectionSync) { + console.log('globalSelectionSync.delay()'); + } + + if (typeof ms === 'number') { + this.dontSyncBefore = Date.now() + ms; + } else { + this.dontSyncBefore = Date.now() + NETDATA.options.current.sync_selection_delay; + } + } + }, + + __syncSlaves: function () { + // if (NETDATA.globalSelectionSync.enabled() === true) { + if (NETDATA.globalSelectionSync.enabled()) { + // if (NETDATA.options.debug.globalSelectionSync === true) + if (NETDATA.options.debug.globalSelectionSync) { + console.log('globalSelectionSync.__syncSlaves()'); + } + + let t = NETDATA.globalSelectionSync.last_t; + let len = NETDATA.globalSelectionSync.slaves.length; + while (len--) { + NETDATA.globalSelectionSync.slaves[len].setSelection(t); + } + + this.timeoutId = undefined; + } + }, + + // sync all the visible charts to the given time + // this is to be called from the chart libraries + sync: function (state, t) { + // if (NETDATA.options.current.sync_selection === true) { + if (NETDATA.options.current.sync_selection) { + // if (NETDATA.options.debug.globalSelectionSync === true) + if (NETDATA.options.debug.globalSelectionSync) { + console.log('globalSelectionSync.sync(' + state.id + ', ' + t.toString() + ')'); + } + + this.setMaster(state); + + if (t === this.last_t) { + return; + } + + this.last_t = t; + + if (state.foreignElementSelection !== null) { + state.foreignElementSelection.innerText = NETDATA.dateTime.localeDateString(t) + ' ' + NETDATA.dateTime.localeTimeString(t); + } + + if (this.timeoutId) { + NETDATA.timeout.clear(this.timeoutId); + } + + this.timeoutId = NETDATA.timeout.set(this.__syncSlaves, 0); + } + } +}; + +NETDATA.intersectionObserver = { + observer: null, + visible_targets: [], + + options: { + root: null, + rootMargin: "0px", + threshold: null + }, + + enabled: function () { + return this.observer !== null; + }, + + globalReset: function () { + if (this.observer !== null) { + this.visible_targets = []; + this.observer.disconnect(); + this.init(); + } + }, + + targets: function () { + if (this.enabled() && this.visible_targets.length > 0) { + return this.visible_targets; + } else { + return NETDATA.options.targets; + } + }, + + switchChartVisibility: function () { + let old = this.__visibilityRatioOld; + + if (old !== this.__visibilityRatio) { + if (old === 0 && this.__visibilityRatio > 0) { + this.unhideChart(); + } else if (old > 0 && this.__visibilityRatio === 0) { + this.hideChart(); + } + + this.__visibilityRatioOld = this.__visibilityRatio; + } + }, + + handler: function (entries, observer) { + entries.forEach(function (entry) { + let state = NETDATA.chartState(entry.target); + + let idx; + if (entry.intersectionRatio > 0) { + idx = NETDATA.intersectionObserver.visible_targets.indexOf(state); + if (idx === -1) { + if (NETDATA.scrollUp) { + NETDATA.intersectionObserver.visible_targets.push(state); + } else { + NETDATA.intersectionObserver.visible_targets.unshift(state); + } + } + else if (state.__visibilityRatio === 0) { + state.log("was not visible until now, but was already in visible_targets"); + } + } else { + idx = NETDATA.intersectionObserver.visible_targets.indexOf(state); + if (idx !== -1) { + NETDATA.intersectionObserver.visible_targets.splice(idx, 1); + } else if (state.__visibilityRatio > 0) { + state.log("was visible, but not found in visible_targets"); + } + } + + state.__visibilityRatio = entry.intersectionRatio; + + if (!NETDATA.options.current.async_on_scroll) { + if (window.requestIdleCallback) { + window.requestIdleCallback(function () { + NETDATA.intersectionObserver.switchChartVisibility.call(state); + }, {timeout: 100}); + } else { + NETDATA.intersectionObserver.switchChartVisibility.call(state); + } + } + }); + }, + + observe: function (state) { + if (this.enabled()) { + state.__visibilityRatioOld = 0; + state.__visibilityRatio = 0; + this.observer.observe(state.element); + + state.isVisible = function () { + if (!NETDATA.options.current.update_only_visible) { + return true; + } + + NETDATA.intersectionObserver.switchChartVisibility.call(this); + + return this.__visibilityRatio > 0; + } + } + }, + + init: function () { + if (typeof netdataIntersectionObserver === 'undefined' || netdataIntersectionObserver) { + try { + this.observer = new IntersectionObserver(this.handler, this.options); + } catch (e) { + console.log("IntersectionObserver is not supported on this browser"); + this.observer = null; + } + } + //else { + // console.log("IntersectionObserver is disabled"); + //} + } +}; +NETDATA.intersectionObserver.init(); + +// ---------------------------------------------------------------------------------------------------------------- +// Our state object, where all per-chart values are stored + +let chartState = function (element) { + this.element = element; + + // IMPORTANT: + // all private functions should use 'that', instead of 'this' + // Alternatively, you can use arrow functions (related issue #4514) + let that = this; + + // ============================================================================================================ + // ERROR HANDLING + + /* error() - private + * show an error instead of the chart + */ + let error = (msg) => { + let ret = true; + + if (typeof netdataErrorCallback === 'function') { + ret = netdataErrorCallback('chart', this.id, msg); + } + + if (ret) { + this.element.innerHTML = this.id + ': ' + msg; + this.enabled = false; + this.current = this.pan; + } + }; + + // console logging + this.log = function (msg) { + console.log(this.id + ' (' + this.library_name + ' ' + this.uuid + '): ' + msg); + }; + + this.debugLog = function (msg) { + if (this.debug) { + this.log(msg); + } + }; + + // ============================================================================================================ + // EARLY INITIALIZATION + + // These are variables that should exist even if the chart is never to be rendered. + // Be careful what you add here - there may be thousands of charts on the page. + + // GUID - a unique identifier for the chart + this.uuid = NETDATA.guid(); + + // string - the name of chart + this.id = NETDATA.dataAttribute(this.element, 'netdata', undefined); + if (typeof this.id === 'undefined') { + error("netdata elements need data-netdata"); + return; + } + + // string - the key for localStorage settings + this.settings_id = NETDATA.dataAttribute(this.element, 'id', null); + + // the user given dimensions of the element + this.width = NETDATA.dataAttribute(this.element, 'width', NETDATA.chartDefaults.width); + this.height = NETDATA.dataAttribute(this.element, 'height', NETDATA.chartDefaults.height); + this.height_original = this.height; + + if (this.settings_id !== null) { + this.height = NETDATA.localStorageGet('chart_heights.' + this.settings_id, this.height, function (height) { + // this is the callback that will be called + // if and when the user resets all localStorage variables + // to their defaults + + resizeChartToHeight(height); + }); + } + + // the chart library requested by the user + this.library_name = NETDATA.dataAttribute(this.element, 'chart-library', NETDATA.chartDefaults.library); + + // check the requested library is available + // we don't initialize it here - it will be initialized when + // this chart will be first used + if (typeof NETDATA.chartLibraries[this.library_name] === 'undefined') { + NETDATA.error(402, this.library_name); + error('chart library "' + this.library_name + '" is not found'); + this.enabled = false; + } else if (!NETDATA.chartLibraries[this.library_name].enabled) { + NETDATA.error(403, this.library_name); + error('chart library "' + this.library_name + '" is not enabled'); + this.enabled = false; + } else { + this.library = NETDATA.chartLibraries[this.library_name]; + } + + this.auto = { + name: 'auto', + autorefresh: true, + force_update_at: 0, // the timestamp to force the update at + force_before_ms: null, + force_after_ms: null + }; + this.pan = { + name: 'pan', + autorefresh: false, + force_update_at: 0, // the timestamp to force the update at + force_before_ms: null, + force_after_ms: null + }; + this.zoom = { + name: 'zoom', + autorefresh: false, + force_update_at: 0, // the timestamp to force the update at + force_before_ms: null, + force_after_ms: null + }; + + // this is a pointer to one of the sub-classes below + // auto, pan, zoom + this.current = this.auto; + + this.running = false; // boolean - true when the chart is being refreshed now + this.enabled = true; // boolean - is the chart enabled for refresh? + + this.force_update_every = null; // number - overwrite the visualization update frequency of the chart + + this.tmp = {}; + + this.foreignElementBefore = null; + this.foreignElementAfter = null; + this.foreignElementDuration = null; + this.foreignElementUpdateEvery = null; + this.foreignElementSelection = null; + + // ============================================================================================================ + // PRIVATE FUNCTIONS + + // reset the runtime status variables to their defaults + const runtimeInit = () => { + this.paused = false; // boolean - is the chart paused for any reason? + this.selected = false; // boolean - is the chart shown a selection? + + this.chart_created = false; // boolean - is the library.create() been called? + this.dom_created = false; // boolean - is the chart DOM been created? + this.fetching_data = false; // boolean - true while we fetch data via ajax + + this.updates_counter = 0; // numeric - the number of refreshes made so far + this.updates_since_last_unhide = 0; // numeric - the number of refreshes made since the last time the chart was unhidden + this.updates_since_last_creation = 0; // numeric - the number of refreshes made since the last time the chart was created + + this.tm = { + last_initialized: 0, // milliseconds - the timestamp it was last initialized + last_dom_created: 0, // milliseconds - the timestamp its DOM was last created + last_mode_switch: 0, // milliseconds - the timestamp it switched modes + + last_info_downloaded: 0, // milliseconds - the timestamp we downloaded the chart + last_updated: 0, // the timestamp the chart last updated with data + pan_and_zoom_seq: 0, // the sequence number of the global synchronization + // between chart. + // Used with NETDATA.globalPanAndZoom.seq + last_visible_check: 0, // the time we last checked if it is visible + last_resized: 0, // the time the chart was resized + last_hidden: 0, // the time the chart was hidden + last_unhidden: 0, // the time the chart was unhidden + last_autorefreshed: 0 // the time the chart was last refreshed + }; + + this.data = null; // the last data as downloaded from the netdata server + this.data_url = 'invalid://'; // string - the last url used to update the chart + this.data_points = 0; // number - the number of points returned from netdata + this.data_after = 0; // milliseconds - the first timestamp of the data + this.data_before = 0; // milliseconds - the last timestamp of the data + this.data_update_every = 0; // milliseconds - the frequency to update the data + + this.tmp = {}; // members that can be destroyed to save memory + }; + + // initialize all the variables that are required for the chart to be rendered + const lateInitialization = () => { + if (typeof this.host !== 'undefined') { + return; + } + + // string - the netdata server URL, without any path + this.host = NETDATA.dataAttribute(this.element, 'host', NETDATA.serverDefault); + + // make sure the host does not end with / + // all netdata API requests use absolute paths + while (this.host.slice(-1) === '/') { + this.host = this.host.substring(0, this.host.length - 1); + } + + // string - the grouping method requested by the user + this.method = NETDATA.dataAttribute(this.element, 'method', NETDATA.chartDefaults.method); + this.gtime = NETDATA.dataAttribute(this.element, 'gtime', 0); + + // the time-range requested by the user + this.after = NETDATA.dataAttribute(this.element, 'after', NETDATA.chartDefaults.after); + this.before = NETDATA.dataAttribute(this.element, 'before', NETDATA.chartDefaults.before); + + // the pixels per point requested by the user + this.pixels_per_point = NETDATA.dataAttribute(this.element, 'pixels-per-point', 1); + this.points = NETDATA.dataAttribute(this.element, 'points', null); + + // the forced update_every + this.force_update_every = NETDATA.dataAttribute(this.element, 'update-every', null); + if (typeof this.force_update_every !== 'number' || this.force_update_every <= 1) { + if (this.force_update_every !== null) { + this.log('ignoring invalid value of property data-update-every'); + } + + this.force_update_every = null; + } else { + this.force_update_every *= 1000; + } + + // the dimensions requested by the user + this.dimensions = NETDATA.encodeURIComponent(NETDATA.dataAttribute(this.element, 'dimensions', null)); + + this.title = NETDATA.dataAttribute(this.element, 'title', null); // the title of the chart + this.units = NETDATA.dataAttribute(this.element, 'units', null); // the units of the chart dimensions + this.units_desired = NETDATA.dataAttribute(this.element, 'desired-units', NETDATA.options.current.units); // the units of the chart dimensions + this.units_current = this.units; + this.units_common = NETDATA.dataAttribute(this.element, 'common-units', null); + + // additional options to pass to netdata + this.append_options = NETDATA.encodeURIComponent(NETDATA.dataAttribute(this.element, 'append-options', null)); + + // override options to pass to netdata + this.override_options = NETDATA.encodeURIComponent(NETDATA.dataAttribute(this.element, 'override-options', null)); + + this.debug = NETDATA.dataAttributeBoolean(this.element, 'debug', false); + + this.value_decimal_detail = -1; + let d = NETDATA.dataAttribute(this.element, 'decimal-digits', -1); + if (typeof d === 'number') { + this.value_decimal_detail = d; + } else if (typeof d !== 'undefined') { + this.log('ignoring decimal-digits value: ' + d.toString()); + } + + // if we need to report the rendering speed + // find the element that needs to be updated + let refresh_dt_element_name = NETDATA.dataAttribute(this.element, 'dt-element-name', null); // string - the element to print refresh_dt_ms + + if (refresh_dt_element_name !== null) { + this.refresh_dt_element = document.getElementById(refresh_dt_element_name) || null; + } + else { + this.refresh_dt_element = null; + } + + this.dimensions_visibility = new dimensionsVisibility(that); + + this.netdata_first = 0; // milliseconds - the first timestamp in netdata + this.netdata_last = 0; // milliseconds - the last timestamp in netdata + this.requested_after = null; // milliseconds - the timestamp of the request after param + this.requested_before = null; // milliseconds - the timestamp of the request before param + this.requested_padding = null; + this.view_after = 0; + this.view_before = 0; + + this.refresh_dt_ms = 0; // milliseconds - the time the last refresh took + + // how many retries we have made to load chart data from the server + this.retries_on_data_failures = 0; + + // color management + this.colors = null; + this.colors_assigned = null; + this.colors_available = null; + this.colors_custom = null; + + this.element_message = null; // the element already created by the user + this.element_chart = null; // the element with the chart + this.element_legend = null; // the element with the legend of the chart (if created by us) + this.element_legend_childs = { + content: null, + hidden: null, + title_date: null, + title_time: null, + title_units: null, + perfect_scroller: null, // the container to apply perfect scroller to + series: null + }; + + this.chart_url = null; // string - the url to download chart info + this.chart = null; // object - the chart as downloaded from the server + + const getForeignElementById = (opt) => { + let id = NETDATA.dataAttribute(this.element, opt, null); + if (id === null) { + //this.log('option "' + opt + '" is undefined'); + return null; + } + + let el = document.getElementById(id); + if (typeof el === 'undefined') { + this.log('cannot find an element with name "' + id.toString() + '"'); + return null; + } + + return el; + }; + + this.foreignElementBefore = getForeignElementById('show-before-at'); + this.foreignElementAfter = getForeignElementById('show-after-at'); + this.foreignElementDuration = getForeignElementById('show-duration-at'); + this.foreignElementUpdateEvery = getForeignElementById('show-update-every-at'); + this.foreignElementSelection = getForeignElementById('show-selection-at'); + }; + + const destroyDOM = () => { + if (!this.enabled) { + return; + } + + if (this.debug) { + this.log('destroyDOM()'); + } + + // this.element.className = 'netdata-message icon'; + // this.element.innerHTML = '<i class="fas fa-sync"></i> netdata'; + this.element.innerHTML = ''; + this.element_message = null; + this.element_legend = null; + this.element_chart = null; + this.element_legend_childs.series = null; + + this.chart_created = false; + this.dom_created = false; + + this.tm.last_resized = 0; + this.tm.last_dom_created = 0; + }; + + let createDOM = () => { + if (!this.enabled) { + return; + } + lateInitialization(); + + destroyDOM(); + + if (this.debug) { + this.log('createDOM()'); + } + + this.element_message = document.createElement('div'); + this.element_message.className = 'netdata-message icon hidden'; + this.element.appendChild(this.element_message); + + this.dom_created = true; + this.chart_created = false; + + this.tm.last_dom_created = this.tm.last_resized = Date.now(); + + showLoading(); + }; + + const initDOM = () => { + this.element.className = this.library.container_class(that); + + if (typeof(this.width) === 'string') { + this.element.style.width = this.width; + } else if (typeof(this.width) === 'number') { + this.element.style.width = this.width.toString() + 'px'; + } + + if (typeof(this.library.aspect_ratio) === 'undefined') { + if (typeof(this.height) === 'string') { + this.element.style.height = this.height; + } else if (typeof(this.height) === 'number') { + this.element.style.height = this.height.toString() + 'px'; + } + } + + if (NETDATA.chartDefaults.min_width !== null) { + this.element.style.min_width = NETDATA.chartDefaults.min_width; + } + }; + + const invisibleSearchableText = () => { + return '<span style="position:absolute; opacity: 0; width: 0px;">' + this.id + '</span>'; + }; + + /* init() private + * initialize state variables + * destroy all (possibly) created state elements + * create the basic DOM for a chart + */ + const init = (opt) => { + if (!this.enabled) { + return; + } + + runtimeInit(); + this.element.innerHTML = invisibleSearchableText(); + + this.tm.last_initialized = Date.now(); + this.setMode('auto'); + + if (opt !== 'fast') { + if (this.isVisible(true) || opt === 'force') { + createDOM(); + } + } + }; + + const maxMessageFontSize = () => { + let screenHeight = screen.height; + let el = this.element; + + // normally we want a font size, as tall as the element + let h = el.clientHeight; + + // but give it some air, 20% let's say, or 5 pixels min + let lost = Math.max(h * 0.2, 5); + h -= lost; + + // center the text, vertically + let paddingTop = (lost - 5) / 2; + + // but check the width too + // it should fit 10 characters in it + let w = el.clientWidth / 10; + if (h > w) { + paddingTop += (h - w) / 2; + h = w; + } + + // and don't make it too huge + // 5% of the screen size is good + if (h > screenHeight / 20) { + paddingTop += (h - (screenHeight / 20)) / 2; + h = screenHeight / 20; + } + + // set it + this.element_message.style.fontSize = h.toString() + 'px'; + this.element_message.style.paddingTop = paddingTop.toString() + 'px'; + }; + + const showMessageIcon = (icon) => { + this.element_message.innerHTML = icon; + maxMessageFontSize(); + $(this.element_message).removeClass('hidden'); + this.tmp.___messageHidden___ = undefined; + }; + + const hideMessage = () => { + if (typeof this.tmp.___messageHidden___ === 'undefined') { + this.tmp.___messageHidden___ = true; + $(this.element_message).addClass('hidden'); + } + }; + + const showRendering = () => { + let icon; + if (this.chart !== null) { + if (this.chart.chart_type === 'line') { + icon = NETDATA.icons.lineChart; + } else { + icon = NETDATA.icons.areaChart; + } + } + else { + icon = NETDATA.icons.noChart; + } + + showMessageIcon(icon + ' netdata' + invisibleSearchableText()); + }; + + const showLoading = () => { + if (!this.chart_created) { + showMessageIcon(NETDATA.icons.loading + ' netdata'); + return true; + } + return false; + }; + + const isHidden = () => { + return (typeof this.tmp.___chartIsHidden___ !== 'undefined'); + }; + + // hide the chart, when it is not visible - called from isVisible() + this.hideChart = function () { + // hide it, if it is not already hidden + if (isHidden()) { + return; + } + + if (this.chart_created) { + if (NETDATA.options.current.show_help) { + if (this.element_legend_childs.toolbox !== null) { + if (this.debug) { + this.log('hideChart(): hidding legend popovers'); + } + + $(this.element_legend_childs.toolbox_left).popover('hide'); + $(this.element_legend_childs.toolbox_reset).popover('hide'); + $(this.element_legend_childs.toolbox_right).popover('hide'); + $(this.element_legend_childs.toolbox_zoomin).popover('hide'); + $(this.element_legend_childs.toolbox_zoomout).popover('hide'); + } + + if (this.element_legend_childs.resize_handler !== null) { + $(this.element_legend_childs.resize_handler).popover('hide'); + } + + if (this.element_legend_childs.content !== null) { + $(this.element_legend_childs.content).popover('hide'); + } + } + + if (NETDATA.options.current.destroy_on_hide) { + if (this.debug) { + this.log('hideChart(): initializing chart'); + } + + // we should destroy it + init('force'); + } else { + if (this.debug) { + this.log('hideChart(): hiding chart'); + } + + showRendering(); + this.element_chart.style.display = 'none'; + this.element.style.willChange = 'auto'; + if (this.element_legend !== null) { + this.element_legend.style.display = 'none'; + } + if (this.element_legend_childs.toolbox !== null) { + this.element_legend_childs.toolbox.style.display = 'none'; + } + if (this.element_legend_childs.resize_handler !== null) { + this.element_legend_childs.resize_handler.style.display = 'none'; + } + + this.tm.last_hidden = Date.now(); + + // de-allocate data + // This works, but I not sure there are no corner cases somewhere + // so it is commented - if the user has memory issues he can + // set Destroy on Hide for all charts + // this.data = null; + } + } + + this.tmp.___chartIsHidden___ = true; + }; + + // unhide the chart, when it is visible - called from isVisible() + this.unhideChart = function () { + if (!isHidden()) { + return; + } + + this.tmp.___chartIsHidden___ = undefined; + this.updates_since_last_unhide = 0; + + if (!this.chart_created) { + if (this.debug) { + this.log('unhideChart(): initializing chart'); + } + + // we need to re-initialize it, to show our background + // logo in bootstrap tabs, until the chart loads + init('force'); + } else { + if (this.debug) { + this.log('unhideChart(): unhiding chart'); + } + + this.element.style.willChange = 'transform'; + this.tm.last_unhidden = Date.now(); + this.element_chart.style.display = ''; + if (this.element_legend !== null) { + this.element_legend.style.display = ''; + } + if (this.element_legend_childs.toolbox !== null) { + this.element_legend_childs.toolbox.style.display = ''; + } + if (this.element_legend_childs.resize_handler !== null) { + this.element_legend_childs.resize_handler.style.display = ''; + } + resizeChart(); + hideMessage(); + } + + if (this.__redraw_on_unhide) { + if (this.debug) { + this.log("redrawing chart on unhide"); + } + + this.__redraw_on_unhide = undefined; + this.redrawChart(); + } + }; + + const canBeRendered = (uncached_visibility) => { + if (this.debug) { + this.log('canBeRendered() called'); + } + + if (!NETDATA.options.current.update_only_visible) { + return true; + } + + let ret = ( + ( + NETDATA.options.page_is_visible || + NETDATA.options.current.stop_updates_when_focus_is_lost === false || + this.updates_since_last_unhide === 0 + ) + && isHidden() === false && this.isVisible(uncached_visibility) + ); + + if (this.debug) { + this.log('canBeRendered(): ' + ret); + } + + return ret; + }; + + // https://github.com/petkaantonov/bluebird/wiki/Optimization-killers + const callChartLibraryUpdateSafely = (data) => { + let status; + + // we should not do this here + // if we prevent rendering the chart then: + // 1. globalSelectionSync will be wrong + // 2. globalPanAndZoom will be wrong + //if (canBeRendered(true) === false) + // return false; + + if (NETDATA.options.fake_chart_rendering) { + return true; + } + + this.updates_counter++; + this.updates_since_last_unhide++; + this.updates_since_last_creation++; + + if (NETDATA.options.debug.chart_errors) { + status = this.library.update(that, data); + } else { + try { + status = this.library.update(that, data); + } catch (err) { + status = false; + } + } + + if (!status) { + error('chart failed to be updated as ' + this.library_name); + return false; + } + + return true; + }; + + // https://github.com/petkaantonov/bluebird/wiki/Optimization-killers + const callChartLibraryCreateSafely = (data) => { + let status; + + // we should not do this here + // if we prevent rendering the chart then: + // 1. globalSelectionSync will be wrong + // 2. globalPanAndZoom will be wrong + //if (canBeRendered(true) === false) + // return false; + + if (NETDATA.options.fake_chart_rendering) { + return true; + } + + this.updates_counter++; + this.updates_since_last_unhide++; + this.updates_since_last_creation++; + + if (NETDATA.options.debug.chart_errors) { + status = this.library.create(that, data); + } else { + try { + status = this.library.create(that, data); + } catch (err) { + status = false; + } + } + + if (!status) { + error('chart failed to be created as ' + this.library_name); + return false; + } + + this.chart_created = true; + this.updates_since_last_creation = 0; + return true; + }; + + // ---------------------------------------------------------------------------------------------------------------- + // Chart Resize + + // resizeChart() - private + // to be called just before the chart library to make sure that + // a properly sized dom is available + const resizeChart = () => { + if (this.tm.last_resized < NETDATA.options.last_page_resize) { + if (!this.chart_created) { + return; + } + + if (this.needsRecreation()) { + if (this.debug) { + this.log('resizeChart(): initializing chart'); + } + + init('force'); + } else if (typeof this.library.resize === 'function') { + if (this.debug) { + this.log('resizeChart(): resizing chart'); + } + + this.library.resize(that); + + if (this.element_legend_childs.perfect_scroller !== null) { + Ps.update(this.element_legend_childs.perfect_scroller); + } + + maxMessageFontSize(); + } + + this.tm.last_resized = Date.now(); + } + }; + + // this is the actual chart resize algorithm + // it will: + // - resize the entire container + // - update the internal states + // - resize the chart as the div changes height + // - update the scrollbar of the legend + const resizeChartToHeight = (h) => { + // console.log(h); + this.element.style.height = h; + + if (this.settings_id !== null) { + NETDATA.localStorageSet('chart_heights.' + this.settings_id, h); + } + + let now = Date.now(); + NETDATA.options.last_page_scroll = now; + NETDATA.options.auto_refresher_stop_until = now + NETDATA.options.current.stop_updates_while_resizing; + + // force a resize + this.tm.last_resized = 0; + resizeChart(); + }; + + this.resizeForPrint = function () { + if (typeof this.element_legend_childs !== 'undefined' && this.element_legend_childs.perfect_scroller !== null) { + let current = this.element.clientHeight; + let optimal = current + + this.element_legend_childs.perfect_scroller.scrollHeight + - this.element_legend_childs.perfect_scroller.clientHeight; + + if (optimal > current) { + // this.log('resized'); + this.element.style.height = optimal + 'px'; + this.library.resize(this); + } + } + }; + + this.resizeHandler = function (e) { + e.preventDefault(); + + if (typeof this.event_resize === 'undefined' + || this.event_resize.chart_original_w === 'undefined' + || this.event_resize.chart_original_h === 'undefined') { + this.event_resize = { + chart_original_w: this.element.clientWidth, + chart_original_h: this.element.clientHeight, + last: 0 + }; + } + + if (e.type === 'touchstart') { + this.event_resize.mouse_start_x = e.touches.item(0).pageX; + this.event_resize.mouse_start_y = e.touches.item(0).pageY; + } else { + this.event_resize.mouse_start_x = e.clientX; + this.event_resize.mouse_start_y = e.clientY; + } + + this.event_resize.chart_start_w = this.element.clientWidth; + this.event_resize.chart_start_h = this.element.clientHeight; + this.event_resize.chart_last_w = this.element.clientWidth; + this.event_resize.chart_last_h = this.element.clientHeight; + + let now = Date.now(); + if (now - this.event_resize.last <= NETDATA.options.current.double_click_speed && this.element_legend_childs.perfect_scroller !== null) { + // double click / double tap event + + // console.dir(this.element_legend_childs.content); + // console.dir(this.element_legend_childs.perfect_scroller); + + // the optimal height of the chart + // showing the entire legend + let optimal = this.event_resize.chart_last_h + + this.element_legend_childs.perfect_scroller.scrollHeight + - this.element_legend_childs.perfect_scroller.clientHeight; + + // if we are not optimal, be optimal + if (this.event_resize.chart_last_h !== optimal) { + // this.log('resize to optimal, current = ' + this.event_resize.chart_last_h.toString() + 'px, original = ' + this.event_resize.chart_original_h.toString() + 'px, optimal = ' + optimal.toString() + 'px, internal = ' + this.height_original.toString()); + resizeChartToHeight(optimal.toString() + 'px'); + } + + // else if the current height is not the original/saved height + // reset to the original/saved height + else if (this.event_resize.chart_last_h !== this.event_resize.chart_original_h) { + // this.log('resize to original, current = ' + this.event_resize.chart_last_h.toString() + 'px, original = ' + this.event_resize.chart_original_h.toString() + 'px, optimal = ' + optimal.toString() + 'px, internal = ' + this.height_original.toString()); + resizeChartToHeight(this.event_resize.chart_original_h.toString() + 'px'); + } + + // else if the current height is not the internal default height + // reset to the internal default height + else if ((this.event_resize.chart_last_h.toString() + 'px') !== this.height_original) { + // this.log('resize to internal default, current = ' + this.event_resize.chart_last_h.toString() + 'px, original = ' + this.event_resize.chart_original_h.toString() + 'px, optimal = ' + optimal.toString() + 'px, internal = ' + this.height_original.toString()); + resizeChartToHeight(this.height_original.toString()); + } + + // else if the current height is not the firstchild's clientheight + // resize to it + else if (typeof this.element_legend_childs.perfect_scroller.firstChild !== 'undefined') { + let parent_rect = this.element.getBoundingClientRect(); + let content_rect = this.element_legend_childs.perfect_scroller.firstElementChild.getBoundingClientRect(); + let wanted = content_rect.top - parent_rect.top + this.element_legend_childs.perfect_scroller.firstChild.clientHeight + 18; // 15 = toolbox + 3 space + + // console.log(parent_rect); + // console.log(content_rect); + // console.log(wanted); + + // this.log('resize to firstChild, current = ' + this.event_resize.chart_last_h.toString() + 'px, original = ' + this.event_resize.chart_original_h.toString() + 'px, optimal = ' + optimal.toString() + 'px, internal = ' + this.height_original.toString() + 'px, firstChild = ' + wanted.toString() + 'px' ); + if (this.event_resize.chart_last_h !== wanted) { + resizeChartToHeight(wanted.toString() + 'px'); + } + } + } else { + this.event_resize.last = now; + + // process movement event + document.onmousemove = + document.ontouchmove = + this.element_legend_childs.resize_handler.onmousemove = + this.element_legend_childs.resize_handler.ontouchmove = + function (e) { + let y = null; + + switch (e.type) { + case 'mousemove': + y = e.clientY; + break; + case 'touchmove': + y = e.touches.item(e.touches - 1).pageY; + break; + } + + if (y !== null) { + let newH = that.event_resize.chart_start_h + y - that.event_resize.mouse_start_y; + + if (newH >= 70 && newH !== that.event_resize.chart_last_h) { + resizeChartToHeight(newH.toString() + 'px'); + that.event_resize.chart_last_h = newH; + } + } + }; + + // process end event + document.onmouseup = + document.ontouchend = + this.element_legend_childs.resize_handler.onmouseup = + this.element_legend_childs.resize_handler.ontouchend = + function (e) { + void(e); + + // remove all the hooks + document.onmouseup = + document.onmousemove = + document.ontouchmove = + document.ontouchend = + that.element_legend_childs.resize_handler.onmousemove = + that.element_legend_childs.resize_handler.ontouchmove = + that.element_legend_childs.resize_handler.onmouseout = + that.element_legend_childs.resize_handler.onmouseup = + that.element_legend_childs.resize_handler.ontouchend = + null; + + // allow auto-refreshes + NETDATA.options.auto_refresher_stop_until = 0; + }; + } + }; + + const noDataToShow = () => { + showMessageIcon(NETDATA.icons.noData + ' empty'); + this.legendUpdateDOM(); + this.tm.last_autorefreshed = Date.now(); + // this.data_update_every = 30 * 1000; + //this.element_chart.style.display = 'none'; + //if (this.element_legend !== null) this.element_legend.style.display = 'none'; + //this.tmp.___chartIsHidden___ = true; + }; + + // ============================================================================================================ + // PUBLIC FUNCTIONS + + this.error = function (msg) { + error(msg); + }; + + this.setMode = function (m) { + if (this.current !== null && this.current.name === m) { + return; + } + + if (m === 'auto') { + this.current = this.auto; + } else if (m === 'pan') { + this.current = this.pan; + } else if (m === 'zoom') { + this.current = this.zoom; + } else { + this.current = this.auto; + } + + this.current.force_update_at = 0; + this.current.force_before_ms = null; + this.current.force_after_ms = null; + + this.tm.last_mode_switch = Date.now(); + }; + + // ---------------------------------------------------------------------------------------------------------------- + // global selection sync for slaves + + // can the chart participate to the global selection sync as a slave? + this.globalSelectionSyncIsEligible = function () { + return ( + this.enabled && + this.library !== null && + typeof this.library.setSelection === 'function' && + this.isVisible() && + this.chart_created + ); + }; + + this.setSelection = function (t) { + if (typeof this.library.setSelection === 'function') { + // this.selected = this.library.setSelection(this, t) === true; + this.selected = this.library.setSelection(this, t); + } else { + this.selected = true; + } + + if (this.selected && this.debug) { + this.log('selection set to ' + t.toString()); + } + + if (this.foreignElementSelection !== null) { + this.foreignElementSelection.innerText = NETDATA.dateTime.localeDateString(t) + ' ' + NETDATA.dateTime.localeTimeString(t); + } + + return this.selected; + }; + + this.clearSelection = function () { + if (this.selected) { + if (typeof this.library.clearSelection === 'function') { + this.selected = (this.library.clearSelection(this) !== true); + } else { + this.selected = false; + } + + if (this.selected === false && this.debug) { + this.log('selection cleared'); + } + + if (this.foreignElementSelection !== null) { + this.foreignElementSelection.innerText = ''; + } + + this.legendReset(); + } + + return this.selected; + }; + + // ---------------------------------------------------------------------------------------------------------------- + + // find if a timestamp (ms) is shown in the current chart + this.timeIsVisible = function (t) { + return (t >= this.data_after && t <= this.data_before); + }; + + this.calculateRowForTime = function (t) { + if (!this.timeIsVisible(t)) { + return -1; + } + return Math.floor((t - this.data_after) / this.data_update_every); + }; + + // ---------------------------------------------------------------------------------------------------------------- + + this.pauseChart = function () { + if (!this.paused) { + if (this.debug) { + this.log('pauseChart()'); + } + + this.paused = true; + } + }; + + this.unpauseChart = function () { + if (this.paused) { + if (this.debug) { + this.log('unpauseChart()'); + } + + this.paused = false; + } + }; + + this.resetChart = function (dontClearMaster, dontUpdate) { + if (this.debug) { + this.log('resetChart(' + dontClearMaster + ', ' + dontUpdate + ') called'); + } + + if (typeof dontClearMaster === 'undefined') { + dontClearMaster = false; + } + + if (typeof dontUpdate === 'undefined') { + dontUpdate = false; + } + + if (dontClearMaster !== true && NETDATA.globalPanAndZoom.isMaster(this)) { + if (this.debug) { + this.log('resetChart() diverting to clearMaster().'); + } + // this will call us back with master === true + NETDATA.globalPanAndZoom.clearMaster(); + return; + } + + this.clearSelection(); + + this.tm.pan_and_zoom_seq = 0; + + this.setMode('auto'); + this.current.force_update_at = 0; + this.current.force_before_ms = null; + this.current.force_after_ms = null; + this.tm.last_autorefreshed = 0; + this.paused = false; + this.selected = false; + this.enabled = true; + // this.debug = false; + + // do not update the chart here + // or the chart will flip-flop when it is the master + // of a selection sync and another chart becomes + // the new master + + if (dontUpdate !== true && this.isVisible()) { + this.updateChart(); + } + }; + + this.updateChartPanOrZoom = function (after, before, callback) { + let logme = 'updateChartPanOrZoom(' + after + ', ' + before + '): '; + let ret = true; + + NETDATA.globalPanAndZoom.delay(); + NETDATA.globalSelectionSync.delay(); + + if (this.debug) { + this.log(logme); + } + + if (before < after) { + if (this.debug) { + this.log(logme + 'flipped parameters, rejecting it.'); + } + return false; + } + + if (typeof this.fixed_min_duration === 'undefined') { + this.fixed_min_duration = Math.round((this.chartWidth() / 30) * this.chart.update_every * 1000); + } + + let min_duration = this.fixed_min_duration; + let current_duration = Math.round(this.view_before - this.view_after); + + // round the numbers + after = Math.round(after); + before = Math.round(before); + + // align them to update_every + // stretching them further away + after -= after % this.data_update_every; + before += this.data_update_every - (before % this.data_update_every); + + // the final wanted duration + let wanted_duration = before - after; + + // to allow panning, accept just a point below our minimum + if ((current_duration - this.data_update_every) < min_duration) { + min_duration = current_duration - this.data_update_every; + } + + // we do it, but we adjust to minimum size and return false + // when the wanted size is below the current and the minimum + // and we zoom + if (wanted_duration < current_duration && wanted_duration < min_duration) { + if (this.debug) { + this.log(logme + 'too small: min_duration: ' + (min_duration / 1000).toString() + ', wanted: ' + (wanted_duration / 1000).toString()); + } + + min_duration = this.fixed_min_duration; + + let dt = (min_duration - wanted_duration) / 2; + before += dt; + after -= dt; + wanted_duration = before - after; + ret = false; + } + + let tolerance = this.data_update_every * 2; + let movement = Math.abs(before - this.view_before); + + if (Math.abs(current_duration - wanted_duration) <= tolerance && movement <= tolerance && ret) { + if (this.debug) { + this.log(logme + 'REJECTING UPDATE: current/min duration: ' + (current_duration / 1000).toString() + '/' + (this.fixed_min_duration / 1000).toString() + ', wanted duration: ' + (wanted_duration / 1000).toString() + ', duration diff: ' + (Math.round(Math.abs(current_duration - wanted_duration) / 1000)).toString() + ', movement: ' + (movement / 1000).toString() + ', tolerance: ' + (tolerance / 1000).toString() + ', returning: ' + false); + } + return false; + } + + if (this.current.name === 'auto') { + this.log(logme + 'caller called me with mode: ' + this.current.name); + this.setMode('pan'); + } + + if (this.debug) { + this.log(logme + 'ACCEPTING UPDATE: current/min duration: ' + (current_duration / 1000).toString() + '/' + (this.fixed_min_duration / 1000).toString() + ', wanted duration: ' + (wanted_duration / 1000).toString() + ', duration diff: ' + (Math.round(Math.abs(current_duration - wanted_duration) / 1000)).toString() + ', movement: ' + (movement / 1000).toString() + ', tolerance: ' + (tolerance / 1000).toString() + ', returning: ' + ret); + } + + this.current.force_update_at = Date.now() + NETDATA.options.current.pan_and_zoom_delay; + this.current.force_after_ms = after; + this.current.force_before_ms = before; + NETDATA.globalPanAndZoom.setMaster(this, after, before); + + if (ret && typeof callback === 'function') { + callback(); + } + + return ret; + }; + + this.updateChartPanOrZoomAsyncTimeOutId = undefined; + this.updateChartPanOrZoomAsync = function (after, before, callback) { + NETDATA.globalPanAndZoom.delay(); + NETDATA.globalSelectionSync.delay(); + + if (!NETDATA.globalPanAndZoom.isMaster(this)) { + this.pauseChart(); + NETDATA.globalPanAndZoom.setMaster(this, after, before); + // NETDATA.globalSelectionSync.stop(); + NETDATA.globalSelectionSync.setMaster(this); + } + + if (this.updateChartPanOrZoomAsyncTimeOutId) { + NETDATA.timeout.clear(this.updateChartPanOrZoomAsyncTimeOutId); + } + + NETDATA.timeout.set(function () { + that.updateChartPanOrZoomAsyncTimeOutId = undefined; + that.updateChartPanOrZoom(after, before, callback); + }, 0); + }; + + let _unitsConversionLastUnits = undefined; + let _unitsConversionLastUnitsDesired = undefined; + let _unitsConversionLastMin = undefined; + let _unitsConversionLastMax = undefined; + let _unitsConversion = function (value) { + return value; + }; + this.unitsConversionSetup = function (min, max) { + if (this.units !== _unitsConversionLastUnits + || this.units_desired !== _unitsConversionLastUnitsDesired + || min !== _unitsConversionLastMin + || max !== _unitsConversionLastMax) { + + _unitsConversionLastUnits = this.units; + _unitsConversionLastUnitsDesired = this.units_desired; + _unitsConversionLastMin = min; + _unitsConversionLastMax = max; + + _unitsConversion = NETDATA.unitsConversion.get(this.uuid, min, max, this.units, this.units_desired, this.units_common, function (units) { + // console.log('switching units from ' + that.units.toString() + ' to ' + units.toString()); + that.units_current = units; + that.legendSetUnitsString(that.units_current); + }); + } + }; + + let _legendFormatValueChartDecimalsLastMin = undefined; + let _legendFormatValueChartDecimalsLastMax = undefined; + let _legendFormatValueChartDecimals = -1; + let _intlNumberFormat = null; + this.legendFormatValueDecimalsFromMinMax = function (min, max) { + if (min === _legendFormatValueChartDecimalsLastMin && max === _legendFormatValueChartDecimalsLastMax) { + return; + } + + this.unitsConversionSetup(min, max); + if (_unitsConversion !== null) { + min = _unitsConversion(min); + max = _unitsConversion(max); + + if (typeof min !== 'number' || typeof max !== 'number') { + return; + } + } + + _legendFormatValueChartDecimalsLastMin = min; + _legendFormatValueChartDecimalsLastMax = max; + + let old = _legendFormatValueChartDecimals; + + if (this.data !== null && this.data.min === this.data.max) + // it is a fixed number, let the visualizer decide based on the value + { + _legendFormatValueChartDecimals = -1; + } else if (this.value_decimal_detail !== -1) + // there is an override + { + _legendFormatValueChartDecimals = this.value_decimal_detail; + } else { + // ok, let's calculate the proper number of decimal points + let delta; + + if (min === max) { + delta = Math.abs(min); + } else { + delta = Math.abs(max - min); + } + + if (delta > 1000) { + _legendFormatValueChartDecimals = 0; + } else if (delta > 10) { + _legendFormatValueChartDecimals = 1; + } else if (delta > 1) { + _legendFormatValueChartDecimals = 2; + } else if (delta > 0.1) { + _legendFormatValueChartDecimals = 2; + } else if (delta > 0.01) { + _legendFormatValueChartDecimals = 4; + } else if (delta > 0.001) { + _legendFormatValueChartDecimals = 5; + } else if (delta > 0.0001) { + _legendFormatValueChartDecimals = 6; + } else { + _legendFormatValueChartDecimals = 7; + } + } + + if (_legendFormatValueChartDecimals !== old) { + if (_legendFormatValueChartDecimals < 0) { + _intlNumberFormat = null; + } else { + _intlNumberFormat = NETDATA.fastNumberFormat.get( + _legendFormatValueChartDecimals, + _legendFormatValueChartDecimals + ); + } + } + }; + + this.legendFormatValue = function (value) { + if (typeof value !== 'number') { + return '-'; + } + + value = _unitsConversion(value); + + if (typeof value !== 'number') { + return value; + } + + if (_intlNumberFormat !== null) { + return _intlNumberFormat.format(value); + } + + let dmin, dmax; + if (this.value_decimal_detail !== -1) { + dmin = dmax = this.value_decimal_detail; + } else { + dmin = 0; + let abs = (value < 0) ? -value : value; + if (abs > 1000) { + dmax = 0; + } else if (abs > 10) { + dmax = 1; + } else if (abs > 1) { + dmax = 2; + } else if (abs > 0.1) { + dmax = 2; + } else if (abs > 0.01) { + dmax = 4; + } else if (abs > 0.001) { + dmax = 5; + } else if (abs > 0.0001) { + dmax = 6; + } else { + dmax = 7; + } + } + + return NETDATA.fastNumberFormat.get(dmin, dmax).format(value); + }; + + this.legendSetLabelValue = function (label, value) { + let series = this.element_legend_childs.series[label]; + if (typeof series === 'undefined') { + return; + } + if (series.value === null && series.user === null) { + return; + } + + /* + // this slows down firefox and edge significantly + // since it requires to use innerHTML(), instead of innerText() + + // if the value has not changed, skip DOM update + //if (series.last === value) return; + + let s, r; + if (typeof value === 'number') { + let v = Math.abs(value); + s = r = this.legendFormatValue(value); + + if (typeof series.last === 'number') { + if (v > series.last) s += '<i class="fas fa-angle-up" style="width: 8px; text-align: center; overflow: hidden; vertical-align: middle;"></i>'; + else if (v < series.last) s += '<i class="fas fa-angle-down" style="width: 8px; text-align: center; overflow: hidden; vertical-align: middle;"></i>'; + else s += '<i class="fas fa-angle-left" style="width: 8px; text-align: center; overflow: hidden; vertical-align: middle;"></i>'; + } + else s += '<i class="fas fa-angle-right" style="width: 8px; text-align: center; overflow: hidden; vertical-align: middle;"></i>'; + + series.last = v; + } + else { + if (value === null) + s = r = ''; + else + s = r = value; + + series.last = value; + } + */ + + let s = this.legendFormatValue(value); + + // caching: do not update the update to show the same value again + if (s === series.last_shown_value) { + return; + } + series.last_shown_value = s; + + if (series.value !== null) { + series.value.innerText = s; + } + if (series.user !== null) { + series.user.innerText = s; + } + }; + + this.legendSetDateString = function (date) { + if (this.element_legend_childs.title_date !== null && date !== this.tmp.__last_shown_legend_date) { + this.element_legend_childs.title_date.innerText = date; + this.tmp.__last_shown_legend_date = date; + } + }; + + this.legendSetTimeString = function (time) { + if (this.element_legend_childs.title_time !== null && time !== this.tmp.__last_shown_legend_time) { + this.element_legend_childs.title_time.innerText = time; + this.tmp.__last_shown_legend_time = time; + } + }; + + this.legendSetUnitsString = function (units) { + if (this.element_legend_childs.title_units !== null && units !== this.tmp.__last_shown_legend_units) { + this.element_legend_childs.title_units.innerText = units; + this.tmp.__last_shown_legend_units = units; + } + }; + + this.legendSetDateLast = { + ms: 0, + date: undefined, + time: undefined + }; + + this.legendSetDate = function (ms) { + if (typeof ms !== 'number') { + this.legendShowUndefined(); + return; + } + + if (this.legendSetDateLast.ms !== ms) { + let d = new Date(ms); + this.legendSetDateLast.ms = ms; + this.legendSetDateLast.date = NETDATA.dateTime.localeDateString(d); + this.legendSetDateLast.time = NETDATA.dateTime.localeTimeString(d); + } + + this.legendSetDateString(this.legendSetDateLast.date); + this.legendSetTimeString(this.legendSetDateLast.time); + this.legendSetUnitsString(this.units_current) + }; + + this.legendShowUndefined = function () { + this.legendSetDateString(this.legendPluginModuleString(false)); + this.legendSetTimeString(this.chart.context.toString()); + // this.legendSetUnitsString(' '); + + if (this.data && this.element_legend_childs.series !== null) { + let labels = this.data.dimension_names; + let i = labels.length; + while (i--) { + let label = labels[i]; + + if (typeof label === 'undefined' || typeof this.element_legend_childs.series[label] === 'undefined') { + continue; + } + this.legendSetLabelValue(label, null); + } + } + }; + + this.legendShowLatestValues = function () { + if (this.chart === null) { + return; + } + if (this.selected) { + return; + } + + if (this.data === null || this.element_legend_childs.series === null) { + this.legendShowUndefined(); + return; + } + + let show_undefined = true; + if (Math.abs(this.netdata_last - this.view_before) <= this.data_update_every) { + show_undefined = false; + } + + if (show_undefined) { + this.legendShowUndefined(); + return; + } + + this.legendSetDate(this.view_before); + + let labels = this.data.dimension_names; + let i = labels.length; + while (i--) { + let label = labels[i]; + + if (typeof label === 'undefined') { + continue; + } + if (typeof this.element_legend_childs.series[label] === 'undefined') { + continue; + } + + this.legendSetLabelValue(label, this.data.view_latest_values[i]); + } + }; + + this.legendReset = function () { + this.legendShowLatestValues(); + }; + + // this should be called just ONCE per dimension per chart + this.__chartDimensionColor = function (label) { + let c = NETDATA.commonColors.get(this, label); + + // it is important to maintain a list of colors + // for this chart only, since the chart library + // uses this to assign colors to dimensions in the same + // order the dimension are given to it + this.colors.push(c); + + return c; + }; + + this.chartPrepareColorPalette = function () { + NETDATA.commonColors.refill(this); + }; + + // get the ordered list of chart colors + // this includes user defined colors + this.chartCustomColors = function () { + this.chartPrepareColorPalette(); + + let colors; + if (this.colors_custom.length) { + colors = this.colors_custom; + } else { + colors = this.colors; + } + + if (this.debug) { + this.log("chartCustomColors() returns:"); + this.log(colors); + } + + return colors; + }; + + // get the ordered list of chart ASSIGNED colors + // (this returns only the colors that have been + // assigned to dimensions, prepended with any + // custom colors defined) + this.chartColors = function () { + this.chartPrepareColorPalette(); + + if (this.debug) { + this.log("chartColors() returns:"); + this.log(this.colors); + } + + return this.colors; + }; + + this.legendPluginModuleString = function (withContext) { + let str = ' '; + let context = ''; + + if (typeof this.chart !== 'undefined') { + if (withContext && typeof this.chart.context === 'string') { + context = this.chart.context; + } + + if (typeof this.chart.plugin === 'string' && this.chart.plugin !== '') { + str = this.chart.plugin; + + if (str.endsWith(".plugin")) { + str = str.substring(0, str.length - 7); + } + + if (typeof this.chart.module === 'string' && this.chart.module !== '') { + str += ':' + this.chart.module; + } + + if (withContext && context !== '') { + str += ', ' + context; + } + } + else if (withContext && context !== '') { + str = context; + } + } + + return str; + }; + + this.legendResolutionTooltip = function () { + if (!this.chart) { + return ''; + } + + let collected = this.chart.update_every; + let viewed = (this.data) ? this.data.view_update_every : collected; + + if (collected === viewed) { + return "resolution " + NETDATA.seconds4human(collected); + } + + return "resolution " + NETDATA.seconds4human(viewed) + ", collected every " + NETDATA.seconds4human(collected); + }; + + this.legendUpdateDOM = function () { + let needed = false, dim, keys, len; + + // check that the legend DOM is up to date for the downloaded dimensions + if (typeof this.element_legend_childs.series !== 'object' || this.element_legend_childs.series === null) { + // this.log('the legend does not have any series - requesting legend update'); + needed = true; + } else if (this.data === null) { + // this.log('the chart does not have any data - requesting legend update'); + needed = true; + } else if (typeof this.element_legend_childs.series.labels_key === 'undefined') { + needed = true; + } else { + let labels = this.data.dimension_names.toString(); + if (labels !== this.element_legend_childs.series.labels_key) { + needed = true; + + if (this.debug) { + this.log('NEW LABELS: "' + labels + '" NOT EQUAL OLD LABELS: "' + this.element_legend_childs.series.labels_key + '"'); + } + } + } + + if (!needed) { + // make sure colors available + this.chartPrepareColorPalette(); + + // do we have to update the current values? + // we do this, only when the visible chart is current + if (Math.abs(this.netdata_last - this.view_before) <= this.data_update_every) { + if (this.debug) { + this.log('chart is in latest position... updating values on legend...'); + } + + //let labels = this.data.dimension_names; + //let i = labels.length; + //while (i--) + // this.legendSetLabelValue(labels[i], this.data.view_latest_values[i]); + } + return; + } + + if (this.colors === null) { + // this is the first time we update the chart + // let's assign colors to all dimensions + if (this.library.track_colors()) { + this.colors = []; + keys = Object.keys(this.chart.dimensions); + len = keys.length; + for (let i = 0; i < len; i++) { + NETDATA.commonColors.get(this, this.chart.dimensions[keys[i]].name); + } + } + } + + // we will re-generate the colors for the chart + // based on the dimensions this result has data for + this.colors = []; + + if (this.debug) { + this.log('updating Legend DOM'); + } + + // mark all dimensions as invalid + this.dimensions_visibility.invalidateAll(); + + const genLabel = function (state, parent, dim, name, count) { + let color = state.__chartDimensionColor(name); + + let user_element = null; + let user_id = NETDATA.dataAttribute(state.element, 'show-value-of-' + name.toLowerCase() + '-at', null); + if (user_id === null) { + user_id = NETDATA.dataAttribute(state.element, 'show-value-of-' + dim.toLowerCase() + '-at', null); + } + if (user_id !== null) { + user_element = document.getElementById(user_id) || null; + if (user_element === null) { + state.log('Cannot find element with id: ' + user_id); + } + } + + state.element_legend_childs.series[name] = { + name: document.createElement('span'), + value: document.createElement('span'), + user: user_element, + last: null, + last_shown_value: null + }; + + let label = state.element_legend_childs.series[name]; + + // create the dimension visibility tracking for this label + state.dimensions_visibility.dimensionAdd(name, label.name, label.value, color); + + let rgb = NETDATA.colorHex2Rgb(color); + label.name.innerHTML = '<table class="netdata-legend-name-table-' + + state.chart.chart_type + + '" style="background-color: ' + + 'rgba(' + rgb.r + ',' + rgb.g + ',' + rgb.b + ',' + NETDATA.options.current['color_fill_opacity_' + state.chart.chart_type] + ') !important' + + '"><tr class="netdata-legend-name-tr"><td class="netdata-legend-name-td"></td></tr></table>'; + + let text = document.createTextNode(' ' + name); + label.name.appendChild(text); + + if (count > 0) { + parent.appendChild(document.createElement('br')); + } + + parent.appendChild(label.name); + parent.appendChild(label.value); + }; + + let content = document.createElement('div'); + + if (this.element_chart === null) { + this.element_chart = document.createElement('div'); + this.element_chart.id = this.library_name + '-' + this.uuid + '-chart'; + this.element.appendChild(this.element_chart); + + if (this.hasLegend()) { + this.element_chart.className = 'netdata-chart-with-legend-right netdata-' + this.library_name + '-chart-with-legend-right'; + } else { + this.element_chart.className = ' netdata-chart netdata-' + this.library_name + '-chart'; + } + } + + if (this.hasLegend()) { + if (this.element_legend === null) { + this.element_legend = document.createElement('div'); + this.element_legend.className = 'netdata-chart-legend netdata-' + this.library_name + '-legend'; + this.element.appendChild(this.element_legend); + } else { + this.element_legend.innerHTML = ''; + } + + this.element_legend_childs = { + content: content, + resize_handler: null, + toolbox: null, + toolbox_left: null, + toolbox_right: null, + toolbox_reset: null, + toolbox_zoomin: null, + toolbox_zoomout: null, + toolbox_volume: null, + title_date: document.createElement('span'), + title_time: document.createElement('span'), + title_units: document.createElement('span'), + perfect_scroller: document.createElement('div'), + series: {} + }; + + if (NETDATA.options.current.legend_toolbox && this.library.toolboxPanAndZoom !== null) { + this.element_legend_childs.toolbox = document.createElement('div'); + this.element_legend_childs.toolbox_left = document.createElement('div'); + this.element_legend_childs.toolbox_right = document.createElement('div'); + this.element_legend_childs.toolbox_reset = document.createElement('div'); + this.element_legend_childs.toolbox_zoomin = document.createElement('div'); + this.element_legend_childs.toolbox_zoomout = document.createElement('div'); + this.element_legend_childs.toolbox_volume = document.createElement('div'); + + const getPanAndZoomStep = function (event) { + if (event.ctrlKey) { + return NETDATA.options.current.pan_and_zoom_factor * NETDATA.options.current.pan_and_zoom_factor_multiplier_control; + } else if (event.shiftKey) { + return NETDATA.options.current.pan_and_zoom_factor * NETDATA.options.current.pan_and_zoom_factor_multiplier_shift; + } else if (event.altKey) { + return NETDATA.options.current.pan_and_zoom_factor * NETDATA.options.current.pan_and_zoom_factor_multiplier_alt; + } else { + return NETDATA.options.current.pan_and_zoom_factor; + } + }; + + this.element_legend_childs.toolbox.className += ' netdata-legend-toolbox'; + this.element.appendChild(this.element_legend_childs.toolbox); + + this.element_legend_childs.toolbox_left.className += ' netdata-legend-toolbox-button'; + this.element_legend_childs.toolbox_left.innerHTML = NETDATA.icons.left; + this.element_legend_childs.toolbox.appendChild(this.element_legend_childs.toolbox_left); + this.element_legend_childs.toolbox_left.onclick = function (e) { + e.preventDefault(); + + let step = (that.view_before - that.view_after) * getPanAndZoomStep(e); + let before = that.view_before - step; + let after = that.view_after - step; + if (after >= that.netdata_first) { + that.library.toolboxPanAndZoom(that, after, before); + } + }; + if (NETDATA.options.current.show_help) { + $(this.element_legend_childs.toolbox_left).popover({ + container: "body", + animation: false, + html: true, + trigger: 'hover', + placement: 'bottom', + delay: { + show: NETDATA.options.current.show_help_delay_show_ms, + hide: NETDATA.options.current.show_help_delay_hide_ms + }, + title: 'Pan Left', + content: 'Pan the chart to the left. You can also <b>drag it</b> with your mouse or your finger (on touch devices).<br/><small>Help can be disabled from the settings.</small>' + }); + } + + this.element_legend_childs.toolbox_reset.className += ' netdata-legend-toolbox-button'; + this.element_legend_childs.toolbox_reset.innerHTML = NETDATA.icons.reset; + this.element_legend_childs.toolbox.appendChild(this.element_legend_childs.toolbox_reset); + this.element_legend_childs.toolbox_reset.onclick = function (e) { + e.preventDefault(); + NETDATA.resetAllCharts(that); + }; + if (NETDATA.options.current.show_help) { + $(this.element_legend_childs.toolbox_reset).popover({ + container: "body", + animation: false, + html: true, + trigger: 'hover', + placement: 'bottom', + delay: { + show: NETDATA.options.current.show_help_delay_show_ms, + hide: NETDATA.options.current.show_help_delay_hide_ms + }, + title: 'Chart Reset', + content: 'Reset all the charts to their default auto-refreshing state. You can also <b>double click</b> the chart contents with your mouse or your finger (on touch devices).<br/><small>Help can be disabled from the settings.</small>' + }); + } + + this.element_legend_childs.toolbox_right.className += ' netdata-legend-toolbox-button'; + this.element_legend_childs.toolbox_right.innerHTML = NETDATA.icons.right; + this.element_legend_childs.toolbox.appendChild(this.element_legend_childs.toolbox_right); + this.element_legend_childs.toolbox_right.onclick = function (e) { + e.preventDefault(); + let step = (that.view_before - that.view_after) * getPanAndZoomStep(e); + let before = that.view_before + step; + let after = that.view_after + step; + if (before <= that.netdata_last) { + that.library.toolboxPanAndZoom(that, after, before); + } + }; + if (NETDATA.options.current.show_help) { + $(this.element_legend_childs.toolbox_right).popover({ + container: "body", + animation: false, + html: true, + trigger: 'hover', + placement: 'bottom', + delay: { + show: NETDATA.options.current.show_help_delay_show_ms, + hide: NETDATA.options.current.show_help_delay_hide_ms + }, + title: 'Pan Right', + content: 'Pan the chart to the right. You can also <b>drag it</b> with your mouse or your finger (on touch devices).<br/><small>Help, can be disabled from the settings.</small>' + }); + } + + this.element_legend_childs.toolbox_zoomin.className += ' netdata-legend-toolbox-button'; + this.element_legend_childs.toolbox_zoomin.innerHTML = NETDATA.icons.zoomIn; + this.element_legend_childs.toolbox.appendChild(this.element_legend_childs.toolbox_zoomin); + this.element_legend_childs.toolbox_zoomin.onclick = function (e) { + e.preventDefault(); + let dt = ((that.view_before - that.view_after) * (getPanAndZoomStep(e) * 0.8) / 2); + let before = that.view_before - dt; + let after = that.view_after + dt; + that.library.toolboxPanAndZoom(that, after, before); + }; + if (NETDATA.options.current.show_help) { + $(this.element_legend_childs.toolbox_zoomin).popover({ + container: "body", + animation: false, + html: true, + trigger: 'hover', + placement: 'bottom', + delay: { + show: NETDATA.options.current.show_help_delay_show_ms, + hide: NETDATA.options.current.show_help_delay_hide_ms + }, + title: 'Chart Zoom In', + content: 'Zoom in the chart. You can also press SHIFT and select an area of the chart, or press SHIFT or ALT and use the mouse wheel or 2-finger touchpad scroll to zoom in or out.<br/><small>Help, can be disabled from the settings.</small>' + }); + } + + this.element_legend_childs.toolbox_zoomout.className += ' netdata-legend-toolbox-button'; + this.element_legend_childs.toolbox_zoomout.innerHTML = NETDATA.icons.zoomOut; + this.element_legend_childs.toolbox.appendChild(this.element_legend_childs.toolbox_zoomout); + this.element_legend_childs.toolbox_zoomout.onclick = function (e) { + e.preventDefault(); + let dt = (((that.view_before - that.view_after) / (1.0 - (getPanAndZoomStep(e) * 0.8)) - (that.view_before - that.view_after)) / 2); + let before = that.view_before + dt; + let after = that.view_after - dt; + + that.library.toolboxPanAndZoom(that, after, before); + }; + if (NETDATA.options.current.show_help) { + $(this.element_legend_childs.toolbox_zoomout).popover({ + container: "body", + animation: false, + html: true, + trigger: 'hover', + placement: 'bottom', + delay: { + show: NETDATA.options.current.show_help_delay_show_ms, + hide: NETDATA.options.current.show_help_delay_hide_ms + }, + title: 'Chart Zoom Out', + content: 'Zoom out the chart. You can also press SHIFT or ALT and use the mouse wheel, or 2-finger touchpad scroll to zoom in or out.<br/><small>Help, can be disabled from the settings.</small>' + }); + } + + //this.element_legend_childs.toolbox_volume.className += ' netdata-legend-toolbox-button'; + //this.element_legend_childs.toolbox_volume.innerHTML = '<i class="fas fa-sort-amount-down"></i>'; + //this.element_legend_childs.toolbox_volume.title = 'Visible Volume'; + //this.element_legend_childs.toolbox.appendChild(this.element_legend_childs.toolbox_volume); + //this.element_legend_childs.toolbox_volume.onclick = function(e) { + //e.preventDefault(); + //alert('clicked toolbox_volume on ' + that.id); + //} + } + + if (NETDATA.options.current.resize_charts) { + this.element_legend_childs.resize_handler = document.createElement('div'); + + this.element_legend_childs.resize_handler.className += " netdata-legend-resize-handler"; + this.element_legend_childs.resize_handler.innerHTML = NETDATA.icons.resize; + this.element.appendChild(this.element_legend_childs.resize_handler); + if (NETDATA.options.current.show_help) { + $(this.element_legend_childs.resize_handler).popover({ + container: "body", + animation: false, + html: true, + trigger: 'hover', + placement: 'bottom', + delay: { + show: NETDATA.options.current.show_help_delay_show_ms, + hide: NETDATA.options.current.show_help_delay_hide_ms + }, + title: 'Chart Resize', + content: 'Drag this point with your mouse or your finger (on touch devices), to resize the chart vertically. You can also <b>double click it</b> or <b>double tap it</b> to reset between 2 states: the default and the one that fits all the values.<br/><small>Help, can be disabled from the settings.</small>' + }); + } + + // mousedown event + this.element_legend_childs.resize_handler.onmousedown = + function (e) { + that.resizeHandler(e); + }; + + // touchstart event + this.element_legend_childs.resize_handler.addEventListener('touchstart', function (e) { + that.resizeHandler(e); + }, false); + } + + if (this.chart) { + this.element_legend_childs.title_date.title = this.legendPluginModuleString(true); + this.element_legend_childs.title_time.title = this.legendResolutionTooltip(); + } + + this.element_legend_childs.title_date.className += " netdata-legend-title-date"; + this.element_legend.appendChild(this.element_legend_childs.title_date); + this.tmp.__last_shown_legend_date = undefined; + + this.element_legend.appendChild(document.createElement('br')); + + this.element_legend_childs.title_time.className += " netdata-legend-title-time"; + this.element_legend.appendChild(this.element_legend_childs.title_time); + this.tmp.__last_shown_legend_time = undefined; + + this.element_legend.appendChild(document.createElement('br')); + + this.element_legend_childs.title_units.className += " netdata-legend-title-units"; + this.element_legend_childs.title_units.innerText = this.units_current; + this.element_legend.appendChild(this.element_legend_childs.title_units); + this.tmp.__last_shown_legend_units = undefined; + + this.element_legend.appendChild(document.createElement('br')); + + this.element_legend_childs.perfect_scroller.className = 'netdata-legend-series'; + this.element_legend.appendChild(this.element_legend_childs.perfect_scroller); + + content.className = 'netdata-legend-series-content'; + this.element_legend_childs.perfect_scroller.appendChild(content); + + this.element_legend_childs.content = content; + + if (NETDATA.options.current.show_help) { + $(content).popover({ + container: "body", + animation: false, + html: true, + trigger: 'hover', + placement: 'bottom', + title: 'Chart Legend', + delay: { + show: NETDATA.options.current.show_help_delay_show_ms, + hide: NETDATA.options.current.show_help_delay_hide_ms + }, + content: 'You can click or tap on the values or the labels to select dimensions. By pressing SHIFT or CONTROL, you can enable or disable multiple dimensions.<br/><small>Help, can be disabled from the settings.</small>' + }); + } + } else { + this.element_legend_childs = { + content: content, + resize_handler: null, + toolbox: null, + toolbox_left: null, + toolbox_right: null, + toolbox_reset: null, + toolbox_zoomin: null, + toolbox_zoomout: null, + toolbox_volume: null, + title_date: null, + title_time: null, + title_units: null, + perfect_scroller: null, + series: {} + }; + } + + if (this.data) { + this.element_legend_childs.series.labels_key = this.data.dimension_names.toString(); + if (this.debug) { + this.log('labels from data: "' + this.element_legend_childs.series.labels_key + '"'); + } + + for (let i = 0, len = this.data.dimension_names.length; i < len; i++) { + genLabel(this, content, this.data.dimension_ids[i], this.data.dimension_names[i], i); + } + } else { + let tmp = []; + keys = Object.keys(this.chart.dimensions); + for (let i = 0, len = keys.length; i < len; i++) { + dim = keys[i]; + tmp.push(this.chart.dimensions[dim].name); + genLabel(this, content, dim, this.chart.dimensions[dim].name, i); + } + this.element_legend_childs.series.labels_key = tmp.toString(); + if (this.debug) { + this.log('labels from chart: "' + this.element_legend_childs.series.labels_key + '"'); + } + } + + // create a hidden div to be used for hidding + // the original legend of the chart library + let el = document.createElement('div'); + if (this.element_legend !== null) { + this.element_legend.appendChild(el); + } + el.style.display = 'none'; + + this.element_legend_childs.hidden = document.createElement('div'); + el.appendChild(this.element_legend_childs.hidden); + + if (this.element_legend_childs.perfect_scroller !== null) { + Ps.initialize(this.element_legend_childs.perfect_scroller, { + wheelSpeed: 0.2, + wheelPropagation: true, + swipePropagation: true, + minScrollbarLength: null, + maxScrollbarLength: null, + useBothWheelAxes: false, + suppressScrollX: true, + suppressScrollY: false, + scrollXMarginOffset: 0, + scrollYMarginOffset: 0, + theme: 'default' + }); + Ps.update(this.element_legend_childs.perfect_scroller); + } + + this.legendShowLatestValues(); + }; + + this.hasLegend = function () { + if (typeof this.tmp.___hasLegendCache___ !== 'undefined') { + return this.tmp.___hasLegendCache___; + } + + let leg = false; + if (this.library && this.library.legend(this) === 'right-side') { + leg = true; + } + + this.tmp.___hasLegendCache___ = leg; + return leg; + }; + + this.legendWidth = function () { + return (this.hasLegend()) ? 140 : 0; + }; + + this.legendHeight = function () { + return $(this.element).height(); + }; + + this.chartWidth = function () { + return $(this.element).width() - this.legendWidth(); + }; + + this.chartHeight = function () { + return $(this.element).height(); + }; + + this.chartPixelsPerPoint = function () { + // force an options provided detail + let px = this.pixels_per_point; + + if (this.library && px < this.library.pixels_per_point(this)) { + px = this.library.pixels_per_point(this); + } + + if (px < NETDATA.options.current.pixels_per_point) { + px = NETDATA.options.current.pixels_per_point; + } + + return px; + }; + + this.needsRecreation = function () { + let ret = ( + this.chart_created && + this.library && + this.library.autoresize() === false && + this.tm.last_resized < NETDATA.options.last_page_resize + ); + + if (this.debug) { + this.log('needsRecreation(): ' + ret.toString() + ', chart_created = ' + this.chart_created.toString()); + } + + return ret; + }; + + this.chartDataUniqueID = function () { + return this.id + ',' + this.library_name + ',' + this.dimensions + ',' + this.chartURLOptions(); + }; + + this.chartURLOptions = function () { + let ret = ''; + + if (this.override_options !== null) { + ret = this.override_options.toString(); + } else { + ret = this.library.options(this); + } + + if (this.append_options !== null) { + ret += '%7C' + this.append_options.toString(); + } + + ret += '%7C' + 'jsonwrap'; + + if (NETDATA.options.current.eliminate_zero_dimensions) { + ret += '%7C' + 'nonzero'; + } + + return ret; + }; + + this.chartURL = function () { + let after, before, points_multiplier = 1; + if (NETDATA.globalPanAndZoom.isActive()) { + if (this.current.force_before_ms !== null && this.current.force_after_ms !== null) { + this.tm.pan_and_zoom_seq = 0; + + before = Math.round(this.current.force_before_ms / 1000); + after = Math.round(this.current.force_after_ms / 1000); + this.view_after = after * 1000; + this.view_before = before * 1000; + + if (NETDATA.options.current.pan_and_zoom_data_padding) { + this.requested_padding = Math.round((before - after) / 2); + after -= this.requested_padding; + before += this.requested_padding; + this.requested_padding *= 1000; + points_multiplier = 2; + } + + this.current.force_before_ms = null; + this.current.force_after_ms = null; + } else { + this.tm.pan_and_zoom_seq = NETDATA.globalPanAndZoom.seq; + + after = Math.round(NETDATA.globalPanAndZoom.force_after_ms / 1000); + before = Math.round(NETDATA.globalPanAndZoom.force_before_ms / 1000); + this.view_after = after * 1000; + this.view_before = before * 1000; + + this.requested_padding = null; + points_multiplier = 1; + } + } else { + this.tm.pan_and_zoom_seq = 0; + + before = this.before; + after = this.after; + this.view_after = after * 1000; + this.view_before = before * 1000; + + this.requested_padding = null; + points_multiplier = 1; + } + + this.requested_after = after * 1000; + this.requested_before = before * 1000; + + let data_points; + if (NETDATA.options.force_data_points !== 0) { + data_points = NETDATA.options.force_data_points; + this.data_points = data_points; + } else { + this.data_points = this.points || Math.round(this.chartWidth() / this.chartPixelsPerPoint()); + data_points = this.data_points * points_multiplier; + } + + // build the data URL + this.data_url = this.host + this.chart.data_url; + this.data_url += "&format=" + this.library.format(); + this.data_url += "&points=" + (data_points).toString(); + this.data_url += "&group=" + this.method; + this.data_url += ">ime=" + this.gtime; + this.data_url += "&options=" + this.chartURLOptions(); + + if (after) { + this.data_url += "&after=" + after.toString(); + } + + if (before) { + this.data_url += "&before=" + before.toString(); + } + + if (this.dimensions) { + this.data_url += "&dimensions=" + this.dimensions; + } + + if (NETDATA.options.debug.chart_data_url || this.debug) { + this.log('chartURL(): ' + this.data_url + ' WxH:' + this.chartWidth() + 'x' + this.chartHeight() + ' points: ' + data_points.toString() + ' library: ' + this.library_name); + } + }; + + this.redrawChart = function () { + if (this.data !== null) { + this.updateChartWithData(this.data); + } + }; + + this.updateChartWithData = function (data) { + if (this.debug) { + this.log('updateChartWithData() called.'); + } + + // this may force the chart to be re-created + resizeChart(); + + this.data = data; + + let started = Date.now(); + let view_update_every = data.view_update_every * 1000; + + if (this.data_update_every !== view_update_every) { + if (this.element_legend_childs.title_time) { + this.element_legend_childs.title_time.title = this.legendResolutionTooltip(); + } + } + + // if the result is JSON, find the latest update-every + this.data_update_every = view_update_every; + this.data_after = data.after * 1000; + this.data_before = data.before * 1000; + this.netdata_first = data.first_entry * 1000; + this.netdata_last = data.last_entry * 1000; + this.data_points = data.points; + + data.state = this; + + if (NETDATA.options.current.pan_and_zoom_data_padding && this.requested_padding !== null) { + if (this.view_after < this.data_after) { + // console.log('adjusting view_after from ' + this.view_after + ' to ' + this.data_after); + this.view_after = this.data_after; + } + + if (this.view_before > this.data_before) { + // console.log('adjusting view_before from ' + this.view_before + ' to ' + this.data_before); + this.view_before = this.data_before; + } + } else { + this.view_after = this.data_after; + this.view_before = this.data_before; + } + + if (this.debug) { + this.log('UPDATE No ' + this.updates_counter + ' COMPLETED'); + + if (this.current.force_after_ms) { + this.log('STATUS: forced : ' + (this.current.force_after_ms / 1000).toString() + ' - ' + (this.current.force_before_ms / 1000).toString()); + } else { + this.log('STATUS: forced : unset'); + } + + this.log('STATUS: requested : ' + (this.requested_after / 1000).toString() + ' - ' + (this.requested_before / 1000).toString()); + this.log('STATUS: downloaded: ' + (this.data_after / 1000).toString() + ' - ' + (this.data_before / 1000).toString()); + this.log('STATUS: rendered : ' + (this.view_after / 1000).toString() + ' - ' + (this.view_before / 1000).toString()); + this.log('STATUS: points : ' + (this.data_points).toString()); + } + + if (this.data_points === 0) { + noDataToShow(); + return; + } + + if (this.updates_since_last_creation >= this.library.max_updates_to_recreate()) { + if (this.debug) { + this.log('max updates of ' + this.updates_since_last_creation.toString() + ' reached. Forcing re-generation.'); + } + + init('force'); + return; + } + + // check and update the legend + this.legendUpdateDOM(); + + if (this.chart_created && typeof this.library.update === 'function') { + if (this.debug) { + this.log('updating chart...'); + } + + if (!callChartLibraryUpdateSafely(data)) { + return; + } + } else { + if (this.debug) { + this.log('creating chart...'); + } + + if (!callChartLibraryCreateSafely(data)) { + return; + } + } + + if (this.isVisible()) { + hideMessage(); + this.legendShowLatestValues(); + } else { + this.__redraw_on_unhide = true; + + if (this.debug) { + this.log("drawn while not visible"); + } + } + + if (this.selected) { + NETDATA.globalSelectionSync.stop(); + } + + // update the performance counters + let now = Date.now(); + this.tm.last_updated = now; + + // don't update last_autorefreshed if this chart is + // forced to be updated with global PanAndZoom + if (NETDATA.globalPanAndZoom.isActive()) { + this.tm.last_autorefreshed = 0; + } else { + if (NETDATA.options.current.parallel_refresher && NETDATA.options.current.concurrent_refreshes && typeof this.force_update_every !== 'number') { + this.tm.last_autorefreshed = now - (now % this.data_update_every); + } else { + this.tm.last_autorefreshed = now; + } + } + + this.refresh_dt_ms = now - started; + NETDATA.options.auto_refresher_fast_weight += this.refresh_dt_ms; + + if (this.refresh_dt_element !== null) { + this.refresh_dt_element.innerText = this.refresh_dt_ms.toString(); + } + + if (this.foreignElementBefore !== null) { + this.foreignElementBefore.innerText = NETDATA.dateTime.localeDateString(this.view_before) + ' ' + NETDATA.dateTime.localeTimeString(this.view_before); + } + + if (this.foreignElementAfter !== null) { + this.foreignElementAfter.innerText = NETDATA.dateTime.localeDateString(this.view_after) + ' ' + NETDATA.dateTime.localeTimeString(this.view_after); + } + + if (this.foreignElementDuration !== null) { + this.foreignElementDuration.innerText = NETDATA.seconds4human(Math.floor((this.view_before - this.view_after) / 1000) + 1); + } + + if (this.foreignElementUpdateEvery !== null) { + this.foreignElementUpdateEvery.innerText = NETDATA.seconds4human(Math.floor(this.data_update_every / 1000)); + } + }; + + this.getSnapshotData = function (key) { + if (this.debug) { + this.log('updating from snapshot: ' + key); + } + + if (typeof netdataSnapshotData.data[key] === 'undefined') { + this.log('snapshot does not include data for key "' + key + '"'); + return null; + } + + if (typeof netdataSnapshotData.data[key] !== 'string') { + this.log('snapshot data for key "' + key + '" is not string'); + return null; + } + + let uncompressed; + try { + uncompressed = netdataSnapshotData.uncompress(netdataSnapshotData.data[key]); + + if (uncompressed === null) { + this.log('uncompressed snapshot data for key ' + key + ' is null'); + return null; + } + + if (typeof uncompressed === 'undefined') { + this.log('uncompressed snapshot data for key ' + key + ' is undefined'); + return null; + } + } catch (e) { + this.log('decompression of snapshot data for key ' + key + ' failed'); + console.log(e); + uncompressed = null; + } + + if (typeof uncompressed !== 'string') { + this.log('uncompressed snapshot data for key ' + key + ' is not string'); + return null; + } + + let data; + try { + data = JSON.parse(uncompressed); + } catch (e) { + this.log('parsing snapshot data for key ' + key + ' failed'); + console.log(e); + data = null; + } + + return data; + }; + + this.updateChart = function (callback) { + if (this.debug) { + this.log('updateChart()'); + } + + if (this.fetching_data) { + if (this.debug) { + this.log('updateChart(): I am already updating...'); + } + + if (typeof callback === 'function') { + return callback(false, 'already running'); + } + + return; + } + + // due to late initialization of charts and libraries + // we need to check this too + if (!this.enabled) { + if (this.debug) { + this.log('updateChart(): I am not enabled'); + } + + if (typeof callback === 'function') { + return callback(false, 'not enabled'); + } + + return; + } + + if (!canBeRendered()) { + if (this.debug) { + this.log('updateChart(): cannot be rendered'); + } + + if (typeof callback === 'function') { + return callback(false, 'cannot be rendered'); + } + + return; + } + + if (that.dom_created !== true) { + if (this.debug) { + this.log('updateChart(): creating DOM'); + } + + createDOM(); + } + + if (this.chart === null) { + if (this.debug) { + this.log('updateChart(): getting chart'); + } + + return this.getChart(function () { + return that.updateChart(callback); + }); + } + + if (!this.library.initialized) { + if (this.library.enabled) { + if (this.debug) { + this.log('updateChart(): initializing chart library'); + } + + return this.library.initialize(function () { + return that.updateChart(callback); + }); + } else { + error('chart library "' + this.library_name + '" is not available.'); + + if (typeof callback === 'function') { + return callback(false, 'library not available'); + } + + return; + } + } + + this.clearSelection(); + this.chartURL(); + + NETDATA.statistics.refreshes_total++; + NETDATA.statistics.refreshes_active++; + + if (NETDATA.statistics.refreshes_active > NETDATA.statistics.refreshes_active_max) { + NETDATA.statistics.refreshes_active_max = NETDATA.statistics.refreshes_active; + } + + let ok = false; + this.fetching_data = true; + + if (netdataSnapshotData !== null) { + let key = this.chartDataUniqueID(); + let data = this.getSnapshotData(key); + if (data !== null) { + ok = true; + data = NETDATA.xss.checkData('/api/v1/data', data, this.library.xssRegexIgnore); + this.updateChartWithData(data); + } else { + ok = false; + error('cannot get data from snapshot for key: "' + key + '"'); + that.tm.last_autorefreshed = Date.now(); + } + + NETDATA.statistics.refreshes_active--; + this.fetching_data = false; + + if (typeof callback === 'function') { + callback(ok, 'snapshot'); + } + + return; + } + + if (this.debug) { + this.log('updating from ' + this.data_url); + } + + this.xhr = $.ajax({ + url: this.data_url, + cache: false, + async: true, + headers: { + 'Cache-Control': 'no-cache, no-store', + 'Pragma': 'no-cache' + }, + xhrFields: {withCredentials: true} // required for the cookie + }) + .done(function (data) { + data = NETDATA.xss.checkData('/api/v1/data', data, that.library.xssRegexIgnore); + + that.xhr = undefined; + that.retries_on_data_failures = 0; + ok = true; + + if (that.debug) { + that.log('data received. updating chart.'); + } + + that.updateChartWithData(data); + }) + .fail(function (msg) { + that.xhr = undefined; + + if (msg.statusText !== 'abort') { + that.retries_on_data_failures++; + if (that.retries_on_data_failures > NETDATA.options.current.retries_on_data_failures) { + // that.log('failed ' + that.retries_on_data_failures.toString() + ' times - giving up'); + that.retries_on_data_failures = 0; + error('data download failed for url: ' + that.data_url); + } + else { + that.tm.last_autorefreshed = Date.now(); + // that.log('failed ' + that.retries_on_data_failures.toString() + ' times, but I will retry'); + } + } + }) + .always(function () { + that.xhr = undefined; + + NETDATA.statistics.refreshes_active--; + that.fetching_data = false; + + if (typeof callback === 'function') { + return callback(ok, 'download'); + } + }); + }; + + const __isVisible = function () { + let ret = true; + + if (NETDATA.options.current.update_only_visible !== false) { + // tolerance is the number of pixels a chart can be off-screen + // to consider it as visible and refresh it as if was visible + let tolerance = 0; + + that.tm.last_visible_check = Date.now(); + + let rect = that.element.getBoundingClientRect(); + + let screenTop = window.scrollY; + let screenBottom = screenTop + window.innerHeight; + + let chartTop = rect.top + screenTop; + let chartBottom = chartTop + rect.height; + + ret = !(rect.width === 0 || rect.height === 0 || chartBottom + tolerance < screenTop || chartTop - tolerance > screenBottom); + } + + if (that.debug) { + that.log('__isVisible(): ' + ret); + } + + return ret; + }; + + this.isVisible = function (nocache) { + // this.log('last_visible_check: ' + this.tm.last_visible_check + ', last_page_scroll: ' + NETDATA.options.last_page_scroll); + + // caching - we do not evaluate the charts visibility + // if the page has not been scrolled since the last check + if ((typeof nocache !== 'undefined' && nocache) + || typeof this.tmp.___isVisible___ === 'undefined' + || this.tm.last_visible_check <= NETDATA.options.last_page_scroll) { + this.tmp.___isVisible___ = __isVisible(); + if (this.tmp.___isVisible___) { + this.unhideChart(); + } else { + this.hideChart(); + } + } + + if (this.debug) { + this.log('isVisible(' + nocache + '): ' + this.tmp.___isVisible___); + } + + return this.tmp.___isVisible___; + }; + + this.isAutoRefreshable = function () { + return (this.current.autorefresh); + }; + + this.canBeAutoRefreshed = function () { + if (!this.enabled) { + if (this.debug) { + this.log('canBeAutoRefreshed() -> not enabled'); + } + + return false; + } + + if (this.running) { + if (this.debug) { + this.log('canBeAutoRefreshed() -> already running'); + } + + return false; + } + + if (this.library === null || this.library.enabled === false) { + error('charting library "' + this.library_name + '" is not available'); + if (this.debug) { + this.log('canBeAutoRefreshed() -> chart library ' + this.library_name + ' is not available'); + } + + return false; + } + + if (!this.isVisible()) { + if (NETDATA.options.debug.visibility || this.debug) { + this.log('canBeAutoRefreshed() -> not visible'); + } + + return false; + } + + let now = Date.now(); + + if (this.current.force_update_at !== 0 && this.current.force_update_at < now) { + if (this.debug) { + this.log('canBeAutoRefreshed() -> timed force update - allowing this update'); + } + + this.current.force_update_at = 0; + return true; + } + + if (!this.isAutoRefreshable()) { + if (this.debug) { + this.log('canBeAutoRefreshed() -> not auto-refreshable'); + } + + return false; + } + + // allow the first update, even if the page is not visible + if (NETDATA.options.page_is_visible === false && this.updates_counter && this.updates_since_last_unhide) { + if (NETDATA.options.debug.focus || this.debug) { + this.log('canBeAutoRefreshed() -> not the first update, and page does not have focus'); + } + + return false; + } + + if (this.needsRecreation()) { + if (this.debug) { + this.log('canBeAutoRefreshed() -> needs re-creation.'); + } + + return true; + } + + if (NETDATA.options.auto_refresher_stop_until >= now) { + if (this.debug) { + this.log('canBeAutoRefreshed() -> stopped until is in future.'); + } + + return false; + } + + // options valid only for autoRefresh() + if (NETDATA.globalPanAndZoom.isActive()) { + if (NETDATA.globalPanAndZoom.shouldBeAutoRefreshed(this)) { + if (this.debug) { + this.log('canBeAutoRefreshed(): global panning: I need an update.'); + } + + return true; + } + else { + if (this.debug) { + this.log('canBeAutoRefreshed(): global panning: I am already up to date.'); + } + + return false; + } + } + + if (this.selected) { + if (this.debug) { + this.log('canBeAutoRefreshed(): I have a selection in place.'); + } + + return false; + } + + if (this.paused) { + if (this.debug) { + this.log('canBeAutoRefreshed(): I am paused.'); + } + + return false; + } + + let data_update_every = this.data_update_every; + if (typeof this.force_update_every === 'number') { + data_update_every = this.force_update_every; + } + + if (now - this.tm.last_autorefreshed >= data_update_every) { + if (this.debug) { + this.log('canBeAutoRefreshed(): It is time to update me. Now: ' + now.toString() + ', last_autorefreshed: ' + this.tm.last_autorefreshed + ', data_update_every: ' + data_update_every + ', delta: ' + (now - this.tm.last_autorefreshed).toString()); + } + + return true; + } + + return false; + }; + + this.autoRefresh = function (callback) { + let state = that; + + if (state.canBeAutoRefreshed() && state.running === false) { + state.running = true; + state.updateChart(function () { + state.running = false; + + if (typeof callback === 'function') { + return callback(); + } + }); + } else { + if (typeof callback === 'function') { + return callback(); + } + } + }; + + this.__defaultsFromDownloadedChart = function (chart) { + this.chart = chart; + this.chart_url = chart.url; + this.data_update_every = chart.update_every * 1000; + this.data_points = Math.round(this.chartWidth() / this.chartPixelsPerPoint()); + this.tm.last_info_downloaded = Date.now(); + + if (this.title === null) { + this.title = chart.title; + } + + if (this.units === null) { + this.units = chart.units; + this.units_current = this.units; + } + }; + + // fetch the chart description from the netdata server + this.getChart = function (callback) { + this.chart = NETDATA.chartRegistry.get(this.host, this.id); + if (this.chart) { + this.__defaultsFromDownloadedChart(this.chart); + + if (typeof callback === 'function') { + return callback(); + } + } else if (netdataSnapshotData !== null) { + // console.log(this); + // console.log(NETDATA.chartRegistry); + NETDATA.error(404, 'host: ' + this.host + ', chart: ' + this.id); + error('chart not found in snapshot'); + + if (typeof callback === 'function') { + return callback(); + } + } else { + this.chart_url = "/api/v1/chart?chart=" + this.id; + + if (this.debug) { + this.log('downloading ' + this.chart_url); + } + + $.ajax({ + url: this.host + this.chart_url, + cache: false, + async: true, + xhrFields: {withCredentials: true} // required for the cookie + }) + .done(function (chart) { + chart = NETDATA.xss.checkOptional('/api/v1/chart', chart); + + chart.url = that.chart_url; + that.__defaultsFromDownloadedChart(chart); + NETDATA.chartRegistry.add(that.host, that.id, chart); + }) + .fail(function () { + NETDATA.error(404, that.chart_url); + error('chart not found on url "' + that.chart_url + '"'); + }) + .always(function () { + if (typeof callback === 'function') { + return callback(); + } + }); + } + }; + + // ============================================================================================================ + // INITIALIZATION + + initDOM(); + init('fast'); +}; + +NETDATA.resetAllCharts = function (state) { + // first clear the global selection sync + // to make sure no chart is in selected state + NETDATA.globalSelectionSync.stop(); + + // there are 2 possibilities here + // a. state is the global Pan and Zoom master + // b. state is not the global Pan and Zoom master + + // let master = true; + // if (NETDATA.globalPanAndZoom.isMaster(state) === false) { + // master = false; + // } + const master = NETDATA.globalPanAndZoom.isMaster(state) + + // clear the global Pan and Zoom + // this will also refresh the master + // and unblock any charts currently mirroring the master + NETDATA.globalPanAndZoom.clearMaster(); + + // if we were not the master, reset our status too + // this is required because most probably the mouse + // is over this chart, blocking it from auto-refreshing + if (master === false && (state.paused || state.selected)) { + state.resetChart(); + } +}; + +// get or create a chart state, given a DOM element +NETDATA.chartState = function (element) { + let self = $(element); + + let state = self.data('netdata-state-object') || null; + if (state === null) { + state = new chartState(element); + self.data('netdata-state-object', state); + } + return state; +}; + +// ---------------------------------------------------------------------------------------------------------------- +// Library functions + +// Load a script without jquery +// This is used to load jquery - after it is loaded, we use jquery +NETDATA._loadjQuery = function (callback) { + if (typeof jQuery === 'undefined') { + if (NETDATA.options.debug.main_loop) { + console.log('loading ' + NETDATA.jQuery); + } + + let script = document.createElement('script'); + script.type = 'text/javascript'; + script.async = true; + script.src = NETDATA.jQuery; + + // script.onabort = onError; + script.onerror = function () { + NETDATA.error(101, NETDATA.jQuery); + }; + if (typeof callback === "function") { + script.onload = function () { + $ = jQuery; + return callback(); + }; + } + + let s = document.getElementsByTagName('script')[0]; + s.parentNode.insertBefore(script, s); + } + else if (typeof callback === "function") { + $ = jQuery; + return callback(); + } +}; + +NETDATA._loadCSS = function (filename) { + // don't use jQuery here + // styles are loaded before jQuery + // to eliminate showing an unstyled page to the user + + let fileref = document.createElement("link"); + fileref.setAttribute("rel", "stylesheet"); + fileref.setAttribute("type", "text/css"); + fileref.setAttribute("href", filename); + + if (typeof fileref !== 'undefined') { + document.getElementsByTagName("head")[0].appendChild(fileref); + } +}; + +// user function to signal us the DOM has been +// updated. +NETDATA.updatedDom = function () { + NETDATA.options.updated_dom = true; +}; + +NETDATA.ready = function (callback) { + NETDATA.options.pauseCallback = callback; +}; + +NETDATA.pause = function (callback) { + if (typeof callback === 'function') { + if (NETDATA.options.pause) { + return callback(); + } else { + NETDATA.options.pauseCallback = callback; + } + } +}; + +NETDATA.unpause = function () { + NETDATA.options.pauseCallback = null; + NETDATA.options.updated_dom = true; + NETDATA.options.pause = false; +}; + +// ---------------------------------------------------------------------------------------------------------------- + +// this is purely sequential charts refresher +// it is meant to be autonomous +NETDATA.chartRefresherNoParallel = function (index, callback) { + let targets = NETDATA.intersectionObserver.targets(); + + if (NETDATA.options.debug.main_loop) { + console.log('NETDATA.chartRefresherNoParallel(' + index + ')'); + } + + if (NETDATA.options.updated_dom) { + // the dom has been updated + // get the dom parts again + NETDATA.parseDom(callback); + return; + } + if (index >= targets.length) { + if (NETDATA.options.debug.main_loop) { + console.log('waiting to restart main loop...'); + } + + NETDATA.options.auto_refresher_fast_weight = 0; + callback(); + } else { + let state = targets[index]; + + if (NETDATA.options.auto_refresher_fast_weight < NETDATA.options.current.fast_render_timeframe) { + if (NETDATA.options.debug.main_loop) { + console.log('fast rendering...'); + } + + if (state.isVisible()) { + NETDATA.timeout.set(function () { + state.autoRefresh(function () { + NETDATA.chartRefresherNoParallel(++index, callback); + }); + }, 0); + } else { + NETDATA.chartRefresherNoParallel(++index, callback); + } + } else { + if (NETDATA.options.debug.main_loop) { + console.log('waiting for next refresh...'); + } + NETDATA.options.auto_refresher_fast_weight = 0; + + NETDATA.timeout.set(function () { + state.autoRefresh(function () { + NETDATA.chartRefresherNoParallel(++index, callback); + }); + }, NETDATA.options.current.idle_between_charts); + } + } +}; + +NETDATA.chartRefresherWaitTime = function () { + return NETDATA.options.current.idle_parallel_loops; +}; + +// the default refresher +NETDATA.chartRefresherLastRun = 0; +NETDATA.chartRefresherRunsAfterParseDom = 0; +NETDATA.chartRefresherTimeoutId = undefined; + +NETDATA.chartRefresherReschedule = function () { + if (NETDATA.options.current.async_on_scroll) { + if (NETDATA.chartRefresherTimeoutId) { + NETDATA.timeout.clear(NETDATA.chartRefresherTimeoutId); + } + NETDATA.chartRefresherTimeoutId = NETDATA.timeout.set(NETDATA.chartRefresher, NETDATA.options.current.onscroll_worker_duration_threshold); + //console.log('chartRefresherReschedule()'); + } +}; + +NETDATA.chartRefresher = function () { + // console.log('chartRefresher() begin ' + (Date.now() - NETDATA.chartRefresherLastRun).toString() + ' ms since last run'); + + if (NETDATA.options.page_is_visible === false + && NETDATA.options.current.stop_updates_when_focus_is_lost + && NETDATA.chartRefresherLastRun > NETDATA.options.last_page_resize + && NETDATA.chartRefresherLastRun > NETDATA.options.last_page_scroll + && NETDATA.chartRefresherRunsAfterParseDom > 10 + ) { + setTimeout( + NETDATA.chartRefresher, + NETDATA.options.current.idle_lost_focus + ); + + // console.log('chartRefresher() page without focus, will run in ' + NETDATA.options.current.idle_lost_focus.toString() + ' ms, ' + NETDATA.chartRefresherRunsAfterParseDom.toString()); + return; + } + NETDATA.chartRefresherRunsAfterParseDom++; + + let now = Date.now(); + NETDATA.chartRefresherLastRun = now; + + if (now < NETDATA.options.on_scroll_refresher_stop_until) { + NETDATA.chartRefresherTimeoutId = NETDATA.timeout.set( + NETDATA.chartRefresher, + NETDATA.chartRefresherWaitTime() + ); + + // console.log('chartRefresher() end1 will run in ' + NETDATA.chartRefresherWaitTime().toString() + ' ms'); + return; + } + + if (now < NETDATA.options.auto_refresher_stop_until) { + NETDATA.chartRefresherTimeoutId = NETDATA.timeout.set( + NETDATA.chartRefresher, + NETDATA.chartRefresherWaitTime() + ); + + // console.log('chartRefresher() end2 will run in ' + NETDATA.chartRefresherWaitTime().toString() + ' ms'); + return; + } + + if (NETDATA.options.pause) { + // console.log('auto-refresher is paused'); + NETDATA.chartRefresherTimeoutId = NETDATA.timeout.set( + NETDATA.chartRefresher, + NETDATA.chartRefresherWaitTime() + ); + + // console.log('chartRefresher() end3 will run in ' + NETDATA.chartRefresherWaitTime().toString() + ' ms'); + return; + } + + if (typeof NETDATA.options.pauseCallback === 'function') { + // console.log('auto-refresher is calling pauseCallback'); + + NETDATA.options.pause = true; + NETDATA.options.pauseCallback(); + NETDATA.chartRefresher(); + + // console.log('chartRefresher() end4 (nested)'); + return; + } + + if (!NETDATA.options.current.parallel_refresher) { + // console.log('auto-refresher is calling chartRefresherNoParallel(0)'); + NETDATA.chartRefresherNoParallel(0, function () { + NETDATA.chartRefresherTimeoutId = NETDATA.timeout.set( + NETDATA.chartRefresher, + NETDATA.options.current.idle_between_loops + ); + }); + // console.log('chartRefresher() end5 (no parallel, nested)'); + return; + } + + if (NETDATA.options.updated_dom) { + // the dom has been updated + // get the dom parts again + // console.log('auto-refresher is calling parseDom()'); + NETDATA.parseDom(NETDATA.chartRefresher); + // console.log('chartRefresher() end6 (parseDom)'); + return; + } + + if (!NETDATA.globalSelectionSync.active()) { + let parallel = []; + let targets = NETDATA.intersectionObserver.targets(); + let len = targets.length; + let state; + while (len--) { + state = targets[len]; + if (state.running || state.isVisible() === false) { + continue; + } + + if (!state.library.initialized) { + if (state.library.enabled) { + state.library.initialize(NETDATA.chartRefresher); + //console.log('chartRefresher() end6 (library init)'); + return; + } + else { + state.error('chart library "' + state.library_name + '" is not enabled.'); + } + } + + if (NETDATA.scrollUp) { + parallel.unshift(state); + } else { + parallel.push(state); + } + } + + len = parallel.length; + while (len--) { + state = parallel[len]; + // console.log('auto-refresher executing in parallel for ' + parallel.length.toString() + ' charts'); + // this will execute the jobs in parallel + + if (!state.running) { + NETDATA.timeout.set(state.autoRefresh, 0); + } + } + //else { + // console.log('auto-refresher nothing to do'); + //} + } + + // run the next refresh iteration + NETDATA.chartRefresherTimeoutId = NETDATA.timeout.set( + NETDATA.chartRefresher, + NETDATA.chartRefresherWaitTime() + ); + + //console.log('chartRefresher() completed in ' + (Date.now() - now).toString() + ' ms'); +}; + +NETDATA.parseDom = function (callback) { + //console.log('parseDom()'); + + NETDATA.options.last_page_scroll = Date.now(); + NETDATA.options.updated_dom = false; + NETDATA.chartRefresherRunsAfterParseDom = 0; + + let targets = $('div[data-netdata]'); //.filter(':visible'); + + if (NETDATA.options.debug.main_loop) { + console.log('DOM updated - there are ' + targets.length + ' charts on page.'); + } + + NETDATA.intersectionObserver.globalReset(); + NETDATA.options.targets = []; + let len = targets.length; + while (len--) { + // the initialization will take care of sizing + // and the "loading..." message + let state = NETDATA.chartState(targets[len]); + NETDATA.options.targets.push(state); + NETDATA.intersectionObserver.observe(state); + } + + if (NETDATA.globalChartUnderlay.isActive()) { + NETDATA.globalChartUnderlay.setup(); + } else { + NETDATA.globalChartUnderlay.clear(); + } + + if (typeof callback === 'function') { + return callback(); + } +}; + +// this is the main function - where everything starts +NETDATA.started = false; +NETDATA.start = function () { + // this should be called only once + + if (NETDATA.started) { + console.log('netdata is already started'); + return; + } + + NETDATA.started = true; + NETDATA.options.page_is_visible = true; + + $(window).blur(function () { + if (NETDATA.options.current.stop_updates_when_focus_is_lost) { + NETDATA.options.page_is_visible = false; + if (NETDATA.options.debug.focus) { + console.log('Lost Focus!'); + } + } + }); + + $(window).focus(function () { + if (NETDATA.options.current.stop_updates_when_focus_is_lost) { + NETDATA.options.page_is_visible = true; + if (NETDATA.options.debug.focus) { + console.log('Focus restored!'); + } + } + }); + + if (typeof document.hasFocus === 'function' && !document.hasFocus()) { + if (NETDATA.options.current.stop_updates_when_focus_is_lost) { + NETDATA.options.page_is_visible = false; + if (NETDATA.options.debug.focus) { + console.log('Document has no focus!'); + } + } + } + + // bootstrap tab switching + $('a[data-toggle="tab"]').on('shown.bs.tab', NETDATA.onscroll); + + // bootstrap modal switching + let $modal = $('.modal'); + $modal.on('hidden.bs.modal', NETDATA.onscroll); + $modal.on('shown.bs.modal', NETDATA.onscroll); + + // bootstrap collapse switching + let $collapse = $('.collapse'); + $collapse.on('hidden.bs.collapse', NETDATA.onscroll); + $collapse.on('shown.bs.collapse', NETDATA.onscroll); + + NETDATA.parseDom(NETDATA.chartRefresher); + + // Alarms initialization + setTimeout(NETDATA.alarms.init, 1000); + + // Registry initialization + setTimeout(NETDATA.registry.init, netdataRegistryAfterMs); + + if (typeof netdataCallback === 'function') { + netdataCallback(); + } +}; + +NETDATA.globalReset = function () { + NETDATA.intersectionObserver.globalReset(); + NETDATA.globalSelectionSync.globalReset(); + NETDATA.globalPanAndZoom.globalReset(); + NETDATA.chartRegistry.globalReset(); + NETDATA.commonMin.globalReset(); + NETDATA.commonMax.globalReset(); + NETDATA.commonColors.globalReset(); + NETDATA.unitsConversion.globalReset(); + NETDATA.options.targets = []; + NETDATA.parseDom(); + NETDATA.unpause(); +}; diff --git a/web/gui/src/dashboard.js/options.js b/web/gui/src/dashboard.js/options.js new file mode 100644 index 000000000..653740a8d --- /dev/null +++ b/web/gui/src/dashboard.js/options.js @@ -0,0 +1,225 @@ + +NETDATA.icons = { + left: '<i class="fas fa-backward"></i>', + reset: '<i class="fas fa-play"></i>', + right: '<i class="fas fa-forward"></i>', + zoomIn: '<i class="fas fa-plus"></i>', + zoomOut: '<i class="fas fa-minus"></i>', + resize: '<i class="fas fa-sort"></i>', + lineChart: '<i class="fas fa-chart-line"></i>', + areaChart: '<i class="fas fa-chart-area"></i>', + noChart: '<i class="fas fa-chart-area"></i>', + loading: '<i class="fas fa-sync-alt"></i>', + noData: '<i class="fas fa-exclamation-triangle"></i>' +}; + +if (typeof netdataIcons === 'object') { + // for (let icon in NETDATA.icons) { + // if (NETDATA.icons.hasOwnProperty(icon) && typeof(netdataIcons[icon]) === 'string') + // NETDATA.icons[icon] = netdataIcons[icon]; + // } + for (const icon of Object.keys(NETDATA.icons)) { + if (typeof(netdataIcons[icon]) === 'string') { + NETDATA.icons[icon] = netdataIcons[icon] + } + } +} + +if (typeof netdataSnapshotData === 'undefined') { + netdataSnapshotData = null; +} + +if (typeof netdataShowHelp === 'undefined') { + netdataShowHelp = true; +} + +if (typeof netdataShowAlarms === 'undefined') { + netdataShowAlarms = false; +} + +if (typeof netdataRegistryAfterMs !== 'number' || netdataRegistryAfterMs < 0) { + netdataRegistryAfterMs = 1500; +} + +if (typeof netdataRegistry === 'undefined') { + // backward compatibility + netdataRegistry = (typeof netdataNoRegistry !== 'undefined' && netdataNoRegistry === false); +} + +if (netdataRegistry === false && typeof netdataRegistryCallback === 'function') { + netdataRegistry = true; +} + +// ---------------------------------------------------------------------------------------------------------------- +// the defaults for all charts + +// if the user does not specify any of these, the following will be used + +NETDATA.chartDefaults = { + width: '100%', // the chart width - can be null + height: '100%', // the chart height - can be null + min_width: null, // the chart minimum width - can be null + library: 'dygraph', // the graphing library to use + method: 'average', // the grouping method + before: 0, // panning + after: -600, // panning + pixels_per_point: 1, // the detail of the chart + fill_luminance: 0.8 // luminance of colors in solid areas +}; + +// ---------------------------------------------------------------------------------------------------------------- +// global options + +NETDATA.options = { + pauseCallback: null, // a callback when we are really paused + + pause: false, // when enabled we don't auto-refresh the charts + + targets: [], // an array of all the state objects that are + // currently active (independently of their + // viewport visibility) + + updated_dom: true, // when true, the DOM has been updated with + // new elements we have to check. + + auto_refresher_fast_weight: 0, // this is the current time in ms, spent + // rendering charts continuously. + // used with .current.fast_render_timeframe + + page_is_visible: true, // when true, this page is visible + + auto_refresher_stop_until: 0, // timestamp in ms - used internally, to stop the + // auto-refresher for some time (when a chart is + // performing pan or zoom, we need to stop refreshing + // all other charts, to have the maximum speed for + // rendering the chart that is panned or zoomed). + // Used with .current.global_pan_sync_time + + on_scroll_refresher_stop_until: 0, // timestamp in ms - used to stop evaluating + // charts for some time, after a page scroll + + last_page_resize: Date.now(), // the timestamp of the last resize request + + last_page_scroll: 0, // the timestamp the last time the page was scrolled + + browser_timezone: 'unknown', // timezone detected by javascript + server_timezone: 'unknown', // timezone reported by the server + + force_data_points: 0, // force the number of points to be returned for charts + fake_chart_rendering: false, // when set to true, the dashboard will download data but will not render the charts + + passive_events: null, // true if the browser supports passive events + + // the current profile + // we may have many... + current: { + units: 'auto', // can be 'auto' or 'original' + temperature: 'celsius', // can be 'celsius' or 'fahrenheit' + seconds_as_time: true, // show seconds as DDd:HH:MM:SS ? + timezone: 'default', // the timezone to use, or 'default' + user_set_server_timezone: 'default', // as set by the user on the dashboard + + legend_toolbox: true, // show the legend toolbox on charts + resize_charts: true, // show the resize handler on charts + + pixels_per_point: isSlowDevice() ? 5 : 1, // the minimum pixels per point for all charts + // increase this to speed javascript up + // each chart library has its own limit too + // the max of this and the chart library is used + // the final is calculated every time, so a change + // here will have immediate effect on the next chart + // update + + idle_between_charts: 100, // ms - how much time to wait between chart updates + + fast_render_timeframe: 200, // ms - render continuously until this time of continuous + // rendering has been reached + // this setting is used to make it render e.g. 10 + // charts at once, sleep idle_between_charts time + // and continue for another 10 charts. + + idle_between_loops: 500, // ms - if all charts have been updated, wait this + // time before starting again. + + idle_parallel_loops: 100, // ms - the time between parallel refresher updates + + idle_lost_focus: 500, // ms - when the window does not have focus, check + // if focus has been regained, every this time + + global_pan_sync_time: 300, // ms - when you pan or zoom a chart, the background + // auto-refreshing of charts is paused for this amount + // of time + + sync_selection_delay: 400, // ms - when you pan or zoom a chart, wait this amount + // of time before setting up synchronized selections + // on hover. + + sync_selection: true, // enable or disable selection sync + + pan_and_zoom_delay: 50, // when panning or zooming, how ofter to update the chart + + sync_pan_and_zoom: true, // enable or disable pan and zoom sync + + pan_and_zoom_data_padding: true, // fetch more data for the master chart when panning or zooming + + update_only_visible: true, // enable or disable visibility management / used for printing + + parallel_refresher: !isSlowDevice(), // enable parallel refresh of charts + + concurrent_refreshes: true, // when parallel_refresher is enabled, sync also the charts + + destroy_on_hide: isSlowDevice(), // destroy charts when they are not visible + + show_help: netdataShowHelp, // when enabled the charts will show some help + show_help_delay_show_ms: 500, + show_help_delay_hide_ms: 0, + + eliminate_zero_dimensions: true, // do not show dimensions with just zeros + + stop_updates_when_focus_is_lost: true, // boolean - shall we stop auto-refreshes when document does not have user focus + stop_updates_while_resizing: 1000, // ms - time to stop auto-refreshes while resizing the charts + + double_click_speed: 500, // ms - time between clicks / taps to detect double click/tap + + smooth_plot: !isSlowDevice(), // enable smooth plot, where possible + + color_fill_opacity_line: 1.0, + color_fill_opacity_area: 0.2, + color_fill_opacity_stacked: 0.8, + + pan_and_zoom_factor: 0.25, // the increment when panning and zooming with the toolbox + pan_and_zoom_factor_multiplier_control: 2.0, + pan_and_zoom_factor_multiplier_shift: 3.0, + pan_and_zoom_factor_multiplier_alt: 4.0, + + abort_ajax_on_scroll: false, // kill pending ajax page scroll + async_on_scroll: false, // sync/async onscroll handler + onscroll_worker_duration_threshold: 30, // time in ms, for async scroll handler + + retries_on_data_failures: 3, // how many retries to make if we can't fetch chart data from the server + + setOptionCallback: function () { + } + }, + + debug: { + show_boxes: false, + main_loop: false, + focus: false, + visibility: false, + chart_data_url: false, + chart_errors: true, // remember to set it to false before merging + chart_timing: false, + chart_calls: false, + libraries: false, + dygraph: false, + globalSelectionSync: false, + globalPanAndZoom: false + } +}; + +NETDATA.statistics = { + refreshes_total: 0, + refreshes_active: 0, + refreshes_active_max: 0 +}; diff --git a/web/gui/src/dashboard.js/prologue.js.inc b/web/gui/src/dashboard.js/prologue.js.inc new file mode 100644 index 000000000..ae9201bc7 --- /dev/null +++ b/web/gui/src/dashboard.js/prologue.js.inc @@ -0,0 +1,83 @@ +// SPDX-License-Identifier: GPL-3.0-or-later + +// DO NOT EDIT: This file is automatically generated from the source files in src/ + +// ---------------------------------------------------------------------------- +// You can set the following variables before loading this script: + +// 'use strict'; + +/*global netdataNoDygraphs *//* boolean, disable dygraph charts + * (default: false) */ +/*global netdataNoSparklines *//* boolean, disable sparkline charts + * (default: false) */ +/*global netdataNoPeitys *//* boolean, disable peity charts + * (default: false) */ +/*global netdataNoGoogleCharts *//* boolean, disable google charts + * (default: false) */ +/*global netdataNoMorris *//* boolean, disable morris charts + * (default: false) */ +/*global netdataNoEasyPieChart *//* boolean, disable easypiechart charts + * (default: false) */ +/*global netdataNoGauge *//* boolean, disable gauge.js charts + * (default: false) */ +/*global netdataNoD3 *//* boolean, disable d3 charts + * (default: false) */ +/*global netdataNoC3 *//* boolean, disable c3 charts + * (default: false) */ +/*global netdataNoD3pie *//* boolean, disable d3pie charts + * (default: false) */ +/*global netdataNoBootstrap *//* boolean, disable bootstrap - disables help too + * (default: false) */ +/*global netdataNoFontAwesome *//* boolean, disable fontawesome (do not load it) + * (default: false) */ +/*global netdataIcons *//* object, overwrite netdata fontawesome icons + * (default: null) */ +/*global netdataDontStart *//* boolean, do not start the thread to process the charts + * (default: false) */ +/*global netdataErrorCallback *//* function, callback to be called when the dashboard encounters an error + * (default: null) */ +/*global netdataRegistry:true *//* boolean, use the netdata registry + * (default: false) */ +/*global netdataNoRegistry *//* boolean, included only for compatibility with existing custom dashboard + * (obsolete - do not use this any more) */ +/*global netdataRegistryCallback *//* function, callback that will be invoked with one param: the URLs from the registry + * (default: null) */ +/*global netdataShowHelp:true *//* boolean, disable charts help + * (default: true) */ +/*global netdataShowAlarms:true *//* boolean, enable alarms checks and notifications + * (default: false) */ +/*global netdataRegistryAfterMs:true *//* ms, delay registry use at started + * (default: 1500) */ +/*global netdataCallback *//* function, callback to be called when netdata is ready to start + * (default: null) + * netdata will be running while this is called + * (call NETDATA.pause to stop it) */ +/*global netdataPrepCallback *//* function, callback to be called before netdata does anything else + * (default: null) */ +/*global netdataServer *//* string, the URL of the netdata server to use + * (default: the URL the page is hosted at) */ +/*global netdataServerStatic *//* string, the URL of the netdata server to use for static files + * (default: netdataServer) */ +/*global netdataSnapshotData *//* object, a netdata snapshot loaded + * (default: null) */ +/*global netdataAlarmsRecipients *//* array, an array of alarm recipients to show notifications for + * (default: null) */ +/*global netdataAlarmsRemember *//* boolen, keep our position in the alarm log at browser local storage + * (default: true) */ +/*global netdataAlarmsActiveCallback *//* function, a hook for the alarm logs + * (default: undefined) */ +/*global netdataAlarmsNotifCallback *//* function, a hook for alarm notifications + * (default: undefined) */ +/*global netdataIntersectionObserver *//* boolean, enable or disable the use of intersection observer + * (default: true) */ +/*global netdataCheckXSS *//* boolean, enable or disable checking for XSS issues + * (default: false) */ + +// ---------------------------------------------------------------------------- +// global namespace + +const NETDATA = window.NETDATA || {}; + +(function(window, document, $, undefined) { + diff --git a/web/gui/src/dashboard.js/registry.js b/web/gui/src/dashboard.js/registry.js new file mode 100644 index 000000000..b9d91291a --- /dev/null +++ b/web/gui/src/dashboard.js/registry.js @@ -0,0 +1,272 @@ + +// Registry of netdata hosts + +NETDATA.registry = { + server: null, // the netdata registry server + person_guid: null, // the unique ID of this browser / user + machine_guid: null, // the unique ID the netdata server that served dashboard.js + hostname: 'unknown', // the hostname of the netdata server that served dashboard.js + machines: null, // the user's other URLs + machines_array: null, // the user's other URLs in an array + person_urls: null, + + parsePersonUrls: function (person_urls) { + // console.log(person_urls); + NETDATA.registry.person_urls = person_urls; + + if (person_urls) { + NETDATA.registry.machines = {}; + NETDATA.registry.machines_array = []; + + let apu = person_urls; + let i = apu.length; + while (i--) { + if (typeof NETDATA.registry.machines[apu[i][0]] === 'undefined') { + // console.log('adding: ' + apu[i][4] + ', ' + ((now - apu[i][2]) / 1000).toString()); + + let obj = { + guid: apu[i][0], + url: apu[i][1], + last_t: apu[i][2], + accesses: apu[i][3], + name: apu[i][4], + alternate_urls: [] + }; + obj.alternate_urls.push(apu[i][1]); + + NETDATA.registry.machines[apu[i][0]] = obj; + NETDATA.registry.machines_array.push(obj); + } else { + // console.log('appending: ' + apu[i][4] + ', ' + ((now - apu[i][2]) / 1000).toString()); + + let pu = NETDATA.registry.machines[apu[i][0]]; + if (pu.last_t < apu[i][2]) { + pu.url = apu[i][1]; + pu.last_t = apu[i][2]; + pu.name = apu[i][4]; + } + pu.accesses += apu[i][3]; + pu.alternate_urls.push(apu[i][1]); + } + } + } + + if (typeof netdataRegistryCallback === 'function') { + netdataRegistryCallback(NETDATA.registry.machines_array); + } + }, + + init: function () { + if (netdataRegistry !== true) { + return; + } + + NETDATA.registry.hello(NETDATA.serverDefault, function (data) { + if (data) { + NETDATA.registry.server = data.registry; + NETDATA.registry.machine_guid = data.machine_guid; + NETDATA.registry.hostname = data.hostname; + + NETDATA.registry.access(2, function (person_urls) { + NETDATA.registry.parsePersonUrls(person_urls); + + }); + } + }); + }, + + hello: function (host, callback) { + host = NETDATA.fixHost(host); + + // send HELLO to a netdata server: + // 1. verifies the server is reachable + // 2. responds with the registry URL, the machine GUID of this netdata server and its hostname + $.ajax({ + url: host + '/api/v1/registry?action=hello', + async: true, + cache: false, + headers: { + 'Cache-Control': 'no-cache, no-store', + 'Pragma': 'no-cache' + }, + xhrFields: {withCredentials: true} // required for the cookie + }) + .done(function (data) { + data = NETDATA.xss.checkOptional('/api/v1/registry?action=hello', data); + + if (typeof data.status !== 'string' || data.status !== 'ok') { + NETDATA.error(408, host + ' response: ' + JSON.stringify(data)); + data = null; + } + + if (typeof callback === 'function') { + return callback(data); + } + }) + .fail(function () { + NETDATA.error(407, host); + + if (typeof callback === 'function') { + return callback(null); + } + }); + }, + + access: function (max_redirects, callback) { + // send ACCESS to a netdata registry: + // 1. it lets it know we are accessing a netdata server (its machine GUID and its URL) + // 2. it responds with a list of netdata servers we know + // the registry identifies us using a cookie it sets the first time we access it + // the registry may respond with a redirect URL to send us to another registry + $.ajax({ + url: NETDATA.registry.server + '/api/v1/registry?action=access&machine=' + NETDATA.registry.machine_guid + '&name=' + encodeURIComponent(NETDATA.registry.hostname) + '&url=' + encodeURIComponent(NETDATA.serverDefault), // + '&visible_url=' + encodeURIComponent(document.location), + async: true, + cache: false, + headers: { + 'Cache-Control': 'no-cache, no-store', + 'Pragma': 'no-cache' + }, + xhrFields: {withCredentials: true} // required for the cookie + }) + .done(function (data) { + data = NETDATA.xss.checkAlways('/api/v1/registry?action=access', data); + + let redirect = null; + if (typeof data.registry === 'string') { + redirect = data.registry; + } + + if (typeof data.status !== 'string' || data.status !== 'ok') { + NETDATA.error(409, NETDATA.registry.server + ' responded with: ' + JSON.stringify(data)); + data = null; + } + + if (data === null) { + if (redirect !== null && max_redirects > 0) { + NETDATA.registry.server = redirect; + NETDATA.registry.access(max_redirects - 1, callback); + } + else { + if (typeof callback === 'function') { + return callback(null); + } + } + } + else { + if (typeof data.person_guid === 'string') { + NETDATA.registry.person_guid = data.person_guid; + } + + if (typeof callback === 'function') { + return callback(data.urls); + } + } + }) + .fail(function () { + NETDATA.error(410, NETDATA.registry.server); + + if (typeof callback === 'function') { + return callback(null); + } + }); + }, + + delete: function (delete_url, callback) { + // send DELETE to a netdata registry: + $.ajax({ + url: NETDATA.registry.server + '/api/v1/registry?action=delete&machine=' + NETDATA.registry.machine_guid + '&name=' + encodeURIComponent(NETDATA.registry.hostname) + '&url=' + encodeURIComponent(NETDATA.serverDefault) + '&delete_url=' + encodeURIComponent(delete_url), + async: true, + cache: false, + headers: { + 'Cache-Control': 'no-cache, no-store', + 'Pragma': 'no-cache' + }, + xhrFields: {withCredentials: true} // required for the cookie + }) + .done(function (data) { + data = NETDATA.xss.checkAlways('/api/v1/registry?action=delete', data); + + if (typeof data.status !== 'string' || data.status !== 'ok') { + NETDATA.error(411, NETDATA.registry.server + ' responded with: ' + JSON.stringify(data)); + data = null; + } + + if (typeof callback === 'function') { + return callback(data); + } + }) + .fail(function () { + NETDATA.error(412, NETDATA.registry.server); + + if (typeof callback === 'function') { + return callback(null); + } + }); + }, + + search: function (machine_guid, callback) { + // SEARCH for the URLs of a machine: + $.ajax({ + url: NETDATA.registry.server + '/api/v1/registry?action=search&machine=' + NETDATA.registry.machine_guid + '&name=' + encodeURIComponent(NETDATA.registry.hostname) + '&url=' + encodeURIComponent(NETDATA.serverDefault) + '&for=' + machine_guid, + async: true, + cache: false, + headers: { + 'Cache-Control': 'no-cache, no-store', + 'Pragma': 'no-cache' + }, + xhrFields: {withCredentials: true} // required for the cookie + }) + .done(function (data) { + data = NETDATA.xss.checkAlways('/api/v1/registry?action=search', data); + + if (typeof data.status !== 'string' || data.status !== 'ok') { + NETDATA.error(417, NETDATA.registry.server + ' responded with: ' + JSON.stringify(data)); + data = null; + } + + if (typeof callback === 'function') { + return callback(data); + } + }) + .fail(function () { + NETDATA.error(418, NETDATA.registry.server); + + if (typeof callback === 'function') { + return callback(null); + } + }); + }, + + switch: function (new_person_guid, callback) { + // impersonate + $.ajax({ + url: NETDATA.registry.server + '/api/v1/registry?action=switch&machine=' + NETDATA.registry.machine_guid + '&name=' + encodeURIComponent(NETDATA.registry.hostname) + '&url=' + encodeURIComponent(NETDATA.serverDefault) + '&to=' + new_person_guid, + async: true, + cache: false, + headers: { + 'Cache-Control': 'no-cache, no-store', + 'Pragma': 'no-cache' + }, + xhrFields: {withCredentials: true} // required for the cookie + }) + .done(function (data) { + data = NETDATA.xss.checkAlways('/api/v1/registry?action=switch', data); + + if (typeof data.status !== 'string' || data.status !== 'ok') { + NETDATA.error(413, NETDATA.registry.server + ' responded with: ' + JSON.stringify(data)); + data = null; + } + + if (typeof callback === 'function') { + return callback(data); + } + }) + .fail(function () { + NETDATA.error(414, NETDATA.registry.server); + + if (typeof callback === 'function') { + return callback(null); + } + }); + } +}; diff --git a/web/gui/src/dashboard.js/server-detection.js b/web/gui/src/dashboard.js/server-detection.js new file mode 100644 index 000000000..472ad48be --- /dev/null +++ b/web/gui/src/dashboard.js/server-detection.js @@ -0,0 +1,29 @@ + +// *** src/dashboard.js/server-detection.js + +if (typeof netdataServer !== 'undefined') { + NETDATA.serverDefault = netdataServer; +} else { + let s = NETDATA._scriptSource(); + if (s) { + NETDATA.serverDefault = s.replace(/\/dashboard.js(\?.*)?$/g, ""); + } else { + console.log('WARNING: Cannot detect the URL of the netdata server.'); + NETDATA.serverDefault = null; + } +} + +if (NETDATA.serverDefault === null) { + NETDATA.serverDefault = ''; +} else if (NETDATA.serverDefault.slice(-1) !== '/') { + NETDATA.serverDefault += '/'; +} + +if (typeof netdataServerStatic !== 'undefined' && netdataServerStatic !== null && netdataServerStatic !== '') { + NETDATA.serverStatic = netdataServerStatic; + if (NETDATA.serverStatic.slice(-1) !== '/') { + NETDATA.serverStatic += '/'; + } +} else { + NETDATA.serverStatic = NETDATA.serverDefault; +} diff --git a/web/gui/src/dashboard.js/themes.js b/web/gui/src/dashboard.js/themes.js new file mode 100644 index 000000000..a83a1dd38 --- /dev/null +++ b/web/gui/src/dashboard.js/themes.js @@ -0,0 +1,90 @@ + +NETDATA.themes = { + white: { + bootstrap_css: NETDATA.serverStatic + 'css/bootstrap-3.3.7.css', + dashboard_css: NETDATA.serverStatic + 'dashboard.css?v20180210-1', + background: '#FFFFFF', + foreground: '#000000', + grid: '#F0F0F0', + axis: '#F0F0F0', + highlight: '#F5F5F5', + colors: ['#3366CC', '#DC3912', '#109618', '#FF9900', '#990099', '#DD4477', + '#3B3EAC', '#66AA00', '#0099C6', '#B82E2E', '#AAAA11', '#5574A6', + '#994499', '#22AA99', '#6633CC', '#E67300', '#316395', '#8B0707', + '#329262', '#3B3EAC'], + easypiechart_track: '#f0f0f0', + easypiechart_scale: '#dfe0e0', + gauge_pointer: '#C0C0C0', + gauge_stroke: '#F0F0F0', + gauge_gradient: false, + d3pie: { + title: '#333333', + subtitle: '#666666', + footer: '#888888', + other: '#aaaaaa', + mainlabel: '#333333', + percentage: '#dddddd', + value: '#aaaa22', + tooltip_bg: '#000000', + tooltip_fg: '#efefef', + segment_stroke: "#ffffff", + gradient_color: '#000000' + } + }, + slate: { + bootstrap_css: NETDATA.serverStatic + 'css/bootstrap-slate-flat-3.3.7.css?v20161229-1', + dashboard_css: NETDATA.serverStatic + 'dashboard.slate.css?v20180210-1', + background: '#272b30', + foreground: '#C8C8C8', + grid: '#283236', + axis: '#283236', + highlight: '#383838', + /* colors: [ '#55bb33', '#ff2222', '#0099C6', '#faa11b', '#adbce0', '#DDDD00', + '#4178ba', '#f58122', '#a5cc39', '#f58667', '#f5ef89', '#cf93c0', + '#a5d18a', '#b8539d', '#3954a3', '#c8a9cf', '#c7de8a', '#fad20a', + '#a6a479', '#a66da8' ], + */ + colors: ['#66AA00', '#FE3912', '#3366CC', '#D66300', '#0099C6', '#DDDD00', + '#5054e6', '#EE9911', '#BB44CC', '#e45757', '#ef0aef', '#CC7700', + '#22AA99', '#109618', '#905bfd', '#f54882', '#4381bf', '#ff3737', + '#329262', '#3B3EFF'], + easypiechart_track: '#373b40', + easypiechart_scale: '#373b40', + gauge_pointer: '#474b50', + gauge_stroke: '#373b40', + gauge_gradient: false, + d3pie: { + title: '#C8C8C8', + subtitle: '#283236', + footer: '#283236', + other: '#283236', + mainlabel: '#C8C8C8', + percentage: '#dddddd', + value: '#cccc44', + tooltip_bg: '#272b30', + tooltip_fg: '#C8C8C8', + segment_stroke: "#283236", + gradient_color: '#000000' + } + } +}; + +if (typeof netdataTheme !== 'undefined' && typeof NETDATA.themes[netdataTheme] !== 'undefined') { + NETDATA.themes.current = NETDATA.themes[netdataTheme]; +} else { + NETDATA.themes.current = NETDATA.themes.white; +} + +NETDATA.colors = NETDATA.themes.current.colors; + +// these are the colors Google Charts are using +// we have them here to attempt emulate their look and feel on the other chart libraries +// http://there4.io/2012/05/02/google-chart-color-list/ +//NETDATA.colors = [ '#3366CC', '#DC3912', '#FF9900', '#109618', '#990099', '#3B3EAC', '#0099C6', +// '#DD4477', '#66AA00', '#B82E2E', '#316395', '#994499', '#22AA99', '#AAAA11', +// '#6633CC', '#E67300', '#8B0707', '#329262', '#5574A6', '#3B3EAC' ]; + +// an alternative set +// http://www.mulinblog.com/a-color-palette-optimized-for-data-visualization/ +// (blue) (red) (orange) (green) (pink) (brown) (purple) (yellow) (gray) +//NETDATA.colors = [ '#5DA5DA', '#F15854', '#FAA43A', '#60BD68', '#F17CB0', '#B2912F', '#B276B2', '#DECF3F', '#4D4D4D' ]; diff --git a/web/gui/src/dashboard.js/timeout.js b/web/gui/src/dashboard.js/timeout.js new file mode 100644 index 000000000..4adf9bb4c --- /dev/null +++ b/web/gui/src/dashboard.js/timeout.js @@ -0,0 +1,100 @@ + +// *** src/dashboard.js/timeout.js + +// TODO: Better name needed + +NETDATA.timeout = { + // by default, these are just wrappers to setTimeout() / clearTimeout() + + step: function (callback) { + return window.setTimeout(callback, 1000 / 60); + }, + + set: function (callback, delay) { + return window.setTimeout(callback, delay); + }, + + clear: function (id) { + return window.clearTimeout(id); + }, + + init: function () { + let custom = true; + + if (window.requestAnimationFrame) { + this.step = function (callback) { + return window.requestAnimationFrame(callback); + }; + + this.clear = function (handle) { + return window.cancelAnimationFrame(handle.value); + }; + // } else if (window.webkitRequestAnimationFrame) { + // this.step = function (callback) { + // return window.webkitRequestAnimationFrame(callback); + // }; + + // if (window.webkitCancelAnimationFrame) { + // this.clear = function (handle) { + // return window.webkitCancelAnimationFrame(handle.value); + // }; + // } else if (window.webkitCancelRequestAnimationFrame) { + // this.clear = function (handle) { + // return window.webkitCancelRequestAnimationFrame(handle.value); + // }; + // } + // } else if (window.mozRequestAnimationFrame) { + // this.step = function (callback) { + // return window.mozRequestAnimationFrame(callback); + // }; + + // this.clear = function (handle) { + // return window.mozCancelRequestAnimationFrame(handle.value); + // }; + // } else if (window.oRequestAnimationFrame) { + // this.step = function (callback) { + // return window.oRequestAnimationFrame(callback); + // }; + + // this.clear = function (handle) { + // return window.oCancelRequestAnimationFrame(handle.value); + // }; + // } else if (window.msRequestAnimationFrame) { + // this.step = function (callback) { + // return window.msRequestAnimationFrame(callback); + // }; + + // this.clear = function (handle) { + // return window.msCancelRequestAnimationFrame(handle.value); + // }; + } else { + custom = false; + } + + if (custom) { + // we have installed custom .step() / .clear() functions + // overwrite the .set() too + + this.set = function (callback, delay) { + let start = Date.now(), + handle = new Object(); + + const loop = () => { + let current = Date.now(), + delta = current - start; + + if (delta >= delay) { + callback.call(); + } else { + handle.value = this.step(loop); + } + } + + handle.value = this.step(loop); + return handle; + }; + } + } +}; + +NETDATA.timeout.init(); diff --git a/web/gui/src/dashboard.js/units-conversion.js b/web/gui/src/dashboard.js/units-conversion.js new file mode 100644 index 000000000..e4eba57f1 --- /dev/null +++ b/web/gui/src/dashboard.js/units-conversion.js @@ -0,0 +1,402 @@ +NETDATA.unitsConversion = { + keys: {}, // keys for data-common-units + latest: {}, // latest selected units for data-common-units + + globalReset: function () { + this.keys = {}; + this.latest = {}; + }, + + scalableUnits: { + 'packets/s': { + 'pps': 1, + 'Kpps': 1000, + 'Mpps': 1000000 + }, + 'pps': { + 'pps': 1, + 'Kpps': 1000, + 'Mpps': 1000000 + }, + 'kilobits/s': { + 'bits/s': 1 / 1000, + 'kilobits/s': 1, + 'megabits/s': 1000, + 'gigabits/s': 1000000, + 'terabits/s': 1000000000 + }, + 'kilobytes/s': { + 'bytes/s': 1 / 1024, + 'kilobytes/s': 1, + 'megabytes/s': 1024, + 'gigabytes/s': 1024 * 1024, + 'terabytes/s': 1024 * 1024 * 1024 + }, + 'KB/s': { + 'B/s': 1 / 1024, + 'KB/s': 1, + 'MB/s': 1024, + 'GB/s': 1024 * 1024, + 'TB/s': 1024 * 1024 * 1024 + }, + 'KB': { + 'B': 1 / 1024, + 'KB': 1, + 'MB': 1024, + 'GB': 1024 * 1024, + 'TB': 1024 * 1024 * 1024 + }, + 'MB': { + 'B': 1 / (1024 * 1024), + 'KB': 1 / 1024, + 'MB': 1, + 'GB': 1024, + 'TB': 1024 * 1024, + 'PB': 1024 * 1024 * 1024 + }, + 'GB': { + 'B': 1 / (1024 * 1024 * 1024), + 'KB': 1 / (1024 * 1024), + 'MB': 1 / 1024, + 'GB': 1, + 'TB': 1024, + 'PB': 1024 * 1024, + 'EB': 1024 * 1024 * 1024 + } + /* + 'milliseconds': { + 'seconds': 1000 + }, + 'seconds': { + 'milliseconds': 0.001, + 'seconds': 1, + 'minutes': 60, + 'hours': 3600, + 'days': 86400 + } + */ + }, + + convertibleUnits: { + 'Celsius': { + 'Fahrenheit': { + check: function (max) { + void(max); + return NETDATA.options.current.temperature === 'fahrenheit'; + }, + convert: function (value) { + return value * 9 / 5 + 32; + } + } + }, + 'celsius': { + 'fahrenheit': { + check: function (max) { + void(max); + return NETDATA.options.current.temperature === 'fahrenheit'; + }, + convert: function (value) { + return value * 9 / 5 + 32; + } + } + }, + 'seconds': { + 'time': { + check: function (max) { + void(max); + return NETDATA.options.current.seconds_as_time; + }, + convert: function (seconds) { + return NETDATA.unitsConversion.seconds2time(seconds); + } + } + }, + 'milliseconds': { + 'milliseconds': { + check: function (max) { + return NETDATA.options.current.seconds_as_time && max < 1000; + }, + convert: function (milliseconds) { + let tms = Math.round(milliseconds * 10); + milliseconds = Math.floor(tms / 10); + + tms -= milliseconds * 10; + + return (milliseconds).toString() + '.' + tms.toString(); + } + }, + 'seconds': { + check: function (max) { + return NETDATA.options.current.seconds_as_time && max >= 1000 && max < 60000; + }, + convert: function (milliseconds) { + milliseconds = Math.round(milliseconds); + + let seconds = Math.floor(milliseconds / 1000); + milliseconds -= seconds * 1000; + + milliseconds = Math.round(milliseconds / 10); + + return seconds.toString() + '.' + + NETDATA.zeropad(milliseconds); + } + }, + 'M:SS.ms': { + check: function (max) { + return NETDATA.options.current.seconds_as_time && max >= 60000; + }, + convert: function (milliseconds) { + milliseconds = Math.round(milliseconds); + + let minutes = Math.floor(milliseconds / 60000); + milliseconds -= minutes * 60000; + + let seconds = Math.floor(milliseconds / 1000); + milliseconds -= seconds * 1000; + + milliseconds = Math.round(milliseconds / 10); + + return minutes.toString() + ':' + + NETDATA.zeropad(seconds) + '.' + + NETDATA.zeropad(milliseconds); + } + } + } + }, + + seconds2time: function (seconds) { + seconds = Math.abs(seconds); + + let days = Math.floor(seconds / 86400); + seconds -= days * 86400; + + let hours = Math.floor(seconds / 3600); + seconds -= hours * 3600; + + let minutes = Math.floor(seconds / 60); + seconds -= minutes * 60; + + seconds = Math.round(seconds); + + let ms_txt = ''; + /* + let ms = seconds - Math.floor(seconds); + seconds -= ms; + ms = Math.round(ms * 1000); + + if (ms > 1) { + if (ms < 10) + ms_txt = '.00' + ms.toString(); + else if (ms < 100) + ms_txt = '.0' + ms.toString(); + else + ms_txt = '.' + ms.toString(); + } + */ + + return ((days > 0) ? days.toString() + 'd:' : '').toString() + + NETDATA.zeropad(hours) + ':' + + NETDATA.zeropad(minutes) + ':' + + NETDATA.zeropad(seconds) + + ms_txt; + }, + + // get a function that converts the units + // + every time units are switched call the callback + get: function (uuid, min, max, units, desired_units, common_units_name, switch_units_callback) { + // validate the parameters + if (typeof units === 'undefined') { + units = 'undefined'; + } + + // check if we support units conversion + if (typeof this.scalableUnits[units] === 'undefined' && typeof this.convertibleUnits[units] === 'undefined') { + // we can't convert these units + //console.log('DEBUG: ' + uuid.toString() + ' can\'t convert units: ' + units.toString()); + return function (value) { + return value; + }; + } + + // check if the caller wants the original units + if (typeof desired_units === 'undefined' || desired_units === null || desired_units === 'original' || desired_units === units) { + //console.log('DEBUG: ' + uuid.toString() + ' original units wanted'); + switch_units_callback(units); + return function (value) { + return value; + }; + } + + // now we know we can convert the units + // and the caller wants some kind of conversion + + let tunits = null; + let tdivider = 0; + + if (typeof this.scalableUnits[units] !== 'undefined') { + // units that can be scaled + // we decide a divider + + // console.log('NETDATA.unitsConversion.get(' + units.toString() + ', ' + desired_units.toString() + ', function()) decide divider with min = ' + min.toString() + ', max = ' + max.toString()); + + if (desired_units === 'auto') { + // the caller wants to auto-scale the units + + // find the absolute maximum value that is rendered on the chart + // based on this we decide the scale + min = Math.abs(min); + max = Math.abs(max); + if (min > max) { + max = min; + } + + // find the smallest scale that provides integers + // for (x in this.scalableUnits[units]) { + // if (this.scalableUnits[units].hasOwnProperty(x)) { + // let m = this.scalableUnits[units][x]; + // if (m <= max && m > tdivider) { + // tunits = x; + // tdivider = m; + // } + // } + // } + const sunit = this.scalableUnits[units]; + for (const x of Object.keys(sunit)) { + let m = sunit[x]; + if (m <= max && m > tdivider) { + tunits = x; + tdivider = m; + } + } + + if (tunits === null || tdivider <= 0) { + // we couldn't find one + //console.log('DEBUG: ' + uuid.toString() + ' cannot find an auto-scaling candidate for units: ' + units.toString() + ' (max: ' + max.toString() + ')'); + switch_units_callback(units); + return function (value) { + return value; + }; + } + + if (typeof common_units_name === 'string' && typeof uuid === 'string') { + // the caller wants several charts to have the same units + // data-common-units + + let common_units_key = common_units_name + '-' + units; + + // add our divider into the list of keys + let t = this.keys[common_units_key]; + if (typeof t === 'undefined') { + this.keys[common_units_key] = {}; + t = this.keys[common_units_key]; + } + t[uuid] = { + units: tunits, + divider: tdivider + }; + + // find the max divider of all charts + let common_units = t[uuid]; + for (const x in t) { + if (t.hasOwnProperty(x) && t[x].divider > common_units.divider) { + common_units = t[x]; + } + } + + // save our common_max to the latest keys + let latest = this.latest[common_units_key]; + if (typeof latest === 'undefined') { + this.latest[common_units_key] = {}; + latest = this.latest[common_units_key]; + } + latest.units = common_units.units; + latest.divider = common_units.divider; + + tunits = latest.units; + tdivider = latest.divider; + + //console.log('DEBUG: ' + uuid.toString() + ' converted units: ' + units.toString() + ' to units: ' + tunits.toString() + ' with divider ' + tdivider.toString() + ', common-units=' + common_units_name.toString() + ((t[uuid].divider !== tdivider)?' USED COMMON, mine was ' + t[uuid].units:' set common').toString()); + + // apply it to this chart + switch_units_callback(tunits); + return function (value) { + if (tdivider !== latest.divider) { + // another chart switched our common units + // we should switch them too + //console.log('DEBUG: ' + uuid + ' switching units due to a common-units change, from ' + tunits.toString() + ' to ' + latest.units.toString()); + tunits = latest.units; + tdivider = latest.divider; + switch_units_callback(tunits); + } + + return value / tdivider; + }; + } else { + // the caller did not give data-common-units + // this chart auto-scales independently of all others + //console.log('DEBUG: ' + uuid.toString() + ' converted units: ' + units.toString() + ' to units: ' + tunits.toString() + ' with divider ' + tdivider.toString() + ', autonomously'); + + switch_units_callback(tunits); + return function (value) { + return value / tdivider; + }; + } + } else { + // the caller wants specific units + + if (typeof this.scalableUnits[units][desired_units] !== 'undefined') { + // all good, set the new units + tdivider = this.scalableUnits[units][desired_units]; + // console.log('DEBUG: ' + uuid.toString() + ' converted units: ' + units.toString() + ' to units: ' + desired_units.toString() + ' with divider ' + tdivider.toString() + ', by reference'); + switch_units_callback(desired_units); + return function (value) { + return value / tdivider; + }; + } else { + // oops! switch back to original units + console.log('Units conversion from ' + units.toString() + ' to ' + desired_units.toString() + ' is not supported.'); + switch_units_callback(units); + return function (value) { + return value; + }; + } + } + } else if (typeof this.convertibleUnits[units] !== 'undefined') { + // units that can be converted + if (desired_units === 'auto') { + for (const x in this.convertibleUnits[units]) { + if (this.convertibleUnits[units].hasOwnProperty(x)) { + if (this.convertibleUnits[units][x].check(max)) { + //console.log('DEBUG: ' + uuid.toString() + ' converting ' + units.toString() + ' to: ' + x.toString()); + switch_units_callback(x); + return this.convertibleUnits[units][x].convert; + } + } + } + + // none checked ok + //console.log('DEBUG: ' + uuid.toString() + ' no conversion available for ' + units.toString() + ' to: ' + desired_units.toString()); + switch_units_callback(units); + return function (value) { + return value; + }; + } else if (typeof this.convertibleUnits[units][desired_units] !== 'undefined') { + switch_units_callback(desired_units); + return this.convertibleUnits[units][desired_units].convert; + } else { + console.log('Units conversion from ' + units.toString() + ' to ' + desired_units.toString() + ' is not supported.'); + switch_units_callback(units); + return function (value) { + return value; + }; + } + } else { + // hm... did we forget to implement the new type? + console.log(`Unmatched unit conversion method for units ${units.toString()}`); + switch_units_callback(units); + return function (value) { + return value; + }; + } + } +}; diff --git a/web/gui/src/dashboard.js/utils.js b/web/gui/src/dashboard.js/utils.js new file mode 100644 index 000000000..2d658dcc2 --- /dev/null +++ b/web/gui/src/dashboard.js/utils.js @@ -0,0 +1,432 @@ +// *** src/dashboard.js/utils.js + +NETDATA.name2id = function (s) { + return s + .replace(/ /g, '_') + .replace(/:/g, '_') + .replace(/\(/g, '_') + .replace(/\)/g, '_') + .replace(/\./g, '_') + .replace(/\//g, '_'); +}; + +NETDATA.encodeURIComponent = function (s) { + if (typeof(s) === 'string') { + return encodeURIComponent(s); + } + + return s; +}; + +/// A heuristic for detecting slow devices. +let isSlowDeviceResult = undefined; +const isSlowDevice = function () { + if (!isSlowDeviceResult) { + return isSlowDeviceResult; + } + + try { + let ua = navigator.userAgent.toLowerCase(); + + let iOS = /ipad|iphone|ipod/.test(ua) && !window.MSStream; + let android = /android/.test(ua) && !window.MSStream; + isSlowDeviceResult = (iOS || android); + } catch (e) { + isSlowDeviceResult = false; + } + + return isSlowDeviceResult; +}; + +NETDATA.guid = function () { + function s4() { + return Math.floor((1 + Math.random()) * 0x10000) + .toString(16) + .substring(1); + } + + return s4() + s4() + '-' + s4() + '-' + s4() + '-' + s4() + '-' + s4() + s4() + s4(); +}; + +NETDATA.zeropad = function (x) { + if (x > -10 && x < 10) { + return '0' + x.toString(); + } else { + return x.toString(); + } +}; + +NETDATA.seconds4human = function (seconds, options) { + let defaultOptions = { + now: 'now', + space: ' ', + negative_suffix: 'ago', + day: 'day', + days: 'days', + hour: 'hour', + hours: 'hours', + minute: 'min', + minutes: 'mins', + second: 'sec', + seconds: 'secs', + and: 'and' + }; + + if (typeof options !== 'object') { + options = defaultOptions; + } else { + for (const x in defaultOptions) { + if (typeof options[x] !== 'string') { + options[x] = defaultOptions[x]; + } + } + } + + if (typeof seconds === 'string') { + seconds = parseInt(seconds, 10); + } + + if (seconds === 0) { + return options.now; + } + + let suffix = ''; + if (seconds < 0) { + seconds = -seconds; + if (options.negative_suffix !== '') { + suffix = options.space + options.negative_suffix; + } + } + + let days = Math.floor(seconds / 86400); + seconds -= (days * 86400); + + let hours = Math.floor(seconds / 3600); + seconds -= (hours * 3600); + + let minutes = Math.floor(seconds / 60); + seconds -= (minutes * 60); + + let strings = []; + + if (days > 1) { + strings.push(days.toString() + options.space + options.days); + } else if (days === 1) { + strings.push(days.toString() + options.space + options.day); + } + + if (hours > 1) { + strings.push(hours.toString() + options.space + options.hours); + } else if (hours === 1) { + strings.push(hours.toString() + options.space + options.hour); + } + + if (minutes > 1) { + strings.push(minutes.toString() + options.space + options.minutes); + } else if (minutes === 1) { + strings.push(minutes.toString() + options.space + options.minute); + } + + if (seconds > 1) { + strings.push(Math.floor(seconds).toString() + options.space + options.seconds); + } else if (seconds === 1) { + strings.push(Math.floor(seconds).toString() + options.space + options.second); + } + + if (strings.length === 1) { + return strings.pop() + suffix; + } + + let last = strings.pop(); + return strings.join(", ") + " " + options.and + " " + last + suffix; +}; + +// ---------------------------------------------------------------------------------------------------------------- +// element data attributes + +NETDATA.dataAttribute = function (element, attribute, def) { + let key = 'data-' + attribute.toString(); + if (element.hasAttribute(key)) { + let data = element.getAttribute(key); + + if (data === 'true') { + return true; + } + if (data === 'false') { + return false; + } + if (data === 'null') { + return null; + } + + // Only convert to a number if it doesn't change the string + if (data === +data + '') { + return +data; + } + + if (/^(?:\{[\w\W]*\}|\[[\w\W]*\])$/.test(data)) { + return JSON.parse(data); + } + + return data; + } else { + return def; + } +}; + +NETDATA.dataAttributeBoolean = function (element, attribute, def) { + let value = NETDATA.dataAttribute(element, attribute, def); + + if (value === true || value === false) // gmosx: Love this :) + { + return value; + } + + if (typeof(value) === 'string') { + if (value === 'yes' || value === 'on') { + return true; + } + + if (value === '' || value === 'no' || value === 'off' || value === 'null') { + return false; + } + + return def; + } + + if (typeof(value) === 'number') { + return value !== 0; + } + + return def; +}; + +// ---------------------------------------------------------------------------------------------------------------- +// fast numbers formatting + +NETDATA.fastNumberFormat = { + formattersFixed: [], + formattersZeroBased: [], + + // this is the fastest and the preferred + getIntlNumberFormat: function (min, max) { + let key = max; + if (min === max) { + if (typeof this.formattersFixed[key] === 'undefined') { + this.formattersFixed[key] = new Intl.NumberFormat(undefined, { + // style: 'decimal', + // minimumIntegerDigits: 1, + // minimumSignificantDigits: 1, + // maximumSignificantDigits: 1, + useGrouping: true, + minimumFractionDigits: min, + maximumFractionDigits: max + }); + } + + return this.formattersFixed[key]; + } else if (min === 0) { + if (typeof this.formattersZeroBased[key] === 'undefined') { + this.formattersZeroBased[key] = new Intl.NumberFormat(undefined, { + // style: 'decimal', + // minimumIntegerDigits: 1, + // minimumSignificantDigits: 1, + // maximumSignificantDigits: 1, + useGrouping: true, + minimumFractionDigits: min, + maximumFractionDigits: max + }); + } + + return this.formattersZeroBased[key]; + } else { + // this is never used + // it is added just for completeness + return new Intl.NumberFormat(undefined, { + // style: 'decimal', + // minimumIntegerDigits: 1, + // minimumSignificantDigits: 1, + // maximumSignificantDigits: 1, + useGrouping: true, + minimumFractionDigits: min, + maximumFractionDigits: max + }); + } + }, + + // this respects locale + getLocaleString: function (min, max) { + let key = max; + if (min === max) { + if (typeof this.formattersFixed[key] === 'undefined') { + this.formattersFixed[key] = { + format: function (value) { + return value.toLocaleString(undefined, { + // style: 'decimal', + // minimumIntegerDigits: 1, + // minimumSignificantDigits: 1, + // maximumSignificantDigits: 1, + useGrouping: true, + minimumFractionDigits: min, + maximumFractionDigits: max + }); + } + }; + } + + return this.formattersFixed[key]; + } else if (min === 0) { + if (typeof this.formattersZeroBased[key] === 'undefined') { + this.formattersZeroBased[key] = { + format: function (value) { + return value.toLocaleString(undefined, { + // style: 'decimal', + // minimumIntegerDigits: 1, + // minimumSignificantDigits: 1, + // maximumSignificantDigits: 1, + useGrouping: true, + minimumFractionDigits: min, + maximumFractionDigits: max + }); + } + }; + } + + return this.formattersZeroBased[key]; + } else { + return { + format: function (value) { + return value.toLocaleString(undefined, { + // style: 'decimal', + // minimumIntegerDigits: 1, + // minimumSignificantDigits: 1, + // maximumSignificantDigits: 1, + useGrouping: true, + minimumFractionDigits: min, + maximumFractionDigits: max + }); + } + }; + } + }, + + // the fallback + getFixed: function (min, max) { + let key = max; + if (min === max) { + if (typeof this.formattersFixed[key] === 'undefined') { + this.formattersFixed[key] = { + format: function (value) { + if (value === 0) { + return "0"; + } + return value.toFixed(max); + } + }; + } + + return this.formattersFixed[key]; + } else if (min === 0) { + if (typeof this.formattersZeroBased[key] === 'undefined') { + this.formattersZeroBased[key] = { + format: function (value) { + if (value === 0) { + return "0"; + } + return value.toFixed(max); + } + }; + } + + return this.formattersZeroBased[key]; + } else { + return { + format: function (value) { + if (value === 0) { + return "0"; + } + return value.toFixed(max); + } + }; + } + }, + + testIntlNumberFormat: function () { + let value = 1.12345; + let e1 = "1.12", e2 = "1,12"; + let s = ""; + + try { + let x = new Intl.NumberFormat(undefined, { + useGrouping: true, + minimumFractionDigits: 2, + maximumFractionDigits: 2 + }); + + s = x.format(value); + } catch (e) { + s = ""; + } + + // console.log('NumberFormat: ', s); + return (s === e1 || s === e2); + }, + + testLocaleString: function () { + let value = 1.12345; + let e1 = "1.12", e2 = "1,12"; + let s = ""; + + try { + s = value.toLocaleString(undefined, { + useGrouping: true, + minimumFractionDigits: 2, + maximumFractionDigits: 2 + }); + } catch (e) { + s = ""; + } + + // console.log('localeString: ', s); + return (s === e1 || s === e2); + }, + + // on first run we decide which formatter to use + get: function (min, max) { + if (this.testIntlNumberFormat()) { + // console.log('numberformat'); + this.get = this.getIntlNumberFormat; + } else if (this.testLocaleString()) { + // console.log('localestring'); + this.get = this.getLocaleString; + } else { + // console.log('fixed'); + this.get = this.getFixed; + } + return this.get(min, max); + } +}; + +// ---------------------------------------------------------------------------------------------------------------- +// Detect the netdata server + +// http://stackoverflow.com/questions/984510/what-is-my-script-src-url +// http://stackoverflow.com/questions/6941533/get-protocol-domain-and-port-from-url +NETDATA._scriptSource = function () { + let script = null; + + if (typeof document.currentScript !== 'undefined') { + script = document.currentScript; + } else { + const all_scripts = document.getElementsByTagName('script'); + script = all_scripts[all_scripts.length - 1]; + } + + if (typeof script.getAttribute.length !== 'undefined') { + script = script.src; + } else { + script = script.getAttribute('src', -1); + } + + return script; +}; diff --git a/web/gui/src/dashboard.js/xss.js b/web/gui/src/dashboard.js/xss.js new file mode 100644 index 000000000..3f9cd1ac7 --- /dev/null +++ b/web/gui/src/dashboard.js/xss.js @@ -0,0 +1,84 @@ +// ---------------------------------------------------------------------------------------------------------------- +// XSS checks + +NETDATA.xss = { + enabled: (typeof netdataCheckXSS === 'undefined') ? false : netdataCheckXSS, + enabled_for_data: (typeof netdataCheckXSS === 'undefined') ? false : netdataCheckXSS, + + string: function (s) { + return s.toString() + .replace(/</g, '<') + .replace(/>/g, '>') + .replace(/"/g, '"') + .replace(/'/g, '''); + }, + + object: function (name, obj, ignore_regex) { + if (typeof ignore_regex !== 'undefined' && ignore_regex.test(name)) { + // console.log('XSS: ignoring "' + name + '"'); + return obj; + } + + switch (typeof(obj)) { + case 'string': + const ret = this.string(obj); + if (ret !== obj) { + console.log('XSS protection changed string ' + name + ' from "' + obj + '" to "' + ret + '"'); + } + return ret; + + case 'object': + if (obj === null) { + return obj; + } + + if (Array.isArray(obj)) { + // console.log('checking array "' + name + '"'); + + let len = obj.length; + while (len--) { + obj[len] = this.object(name + '[' + len + ']', obj[len], ignore_regex); + } + } else { + // console.log('checking object "' + name + '"'); + + for (const i in obj) { + if (obj.hasOwnProperty(i) === false) { + continue; + } + if (this.string(i) !== i) { + console.log('XSS protection removed invalid object member "' + name + '.' + i + '"'); + delete obj[i]; + } else { + obj[i] = this.object(name + '.' + i, obj[i], ignore_regex); + } + } + } + return obj; + + default: + return obj; + } + }, + + checkOptional: function (name, obj, ignore_regex) { + if (this.enabled) { + //console.log('XSS: checking optional "' + name + '"...'); + return this.object(name, obj, ignore_regex); + } + return obj; + }, + + checkAlways: function (name, obj, ignore_regex) { + //console.log('XSS: checking always "' + name + '"...'); + return this.object(name, obj, ignore_regex); + }, + + checkData: function (name, obj, ignore_regex) { + if (this.enabled_for_data) { + //console.log('XSS: checking data "' + name + '"...'); + return this.object(name, obj, ignore_regex); + } + return obj; + } +}; diff --git a/web/gui/version.txt b/web/gui/version.txt index 25011b19d..294ecdb3d 100644 --- a/web/gui/version.txt +++ b/web/gui/version.txt @@ -1 +1 @@ -2b16aab3955dea836a06f580c0e111396916d7ef +19e4b1c85e8e43788a08617af4cbacff0d8a170e diff --git a/web/server/README.md b/web/server/README.md index 8a6cad139..34ef628bc 100644 --- a/web/server/README.md +++ b/web/server/README.md @@ -1,6 +1,6 @@ -# netdata web server +# Netdata web server -netdata supports 3 implementation of its internal web server: +Netdata supports 3 implementations of its internal web server: - `static-threaded` is a web server with a fix (configured number of threads) - `single-threaded` is a simple web server running with a single thread @@ -13,10 +13,9 @@ All versions of the web servers use non-blocking I/O. All web servers respect the `keep-alive` HTTP header to serve multiple HTTP requests via the same connection. - ## Configuration -#### selecting the web server +### Selecting the web server You can select the web server implementation by editing `netdata.conf` and setting: @@ -36,35 +35,33 @@ The `static` web server supports also these settings: The default number of processor threads is `min(cpu cores, 6)`. -The `web server max sockets` setting is automatically adjusted to 50% of the max number of open files -netdata is allowed to use (via `/etc/security/limits.conf` or systemd), to allow enough file descriptors -to be available for data collection. +The `web server max sockets` setting is automatically adjusted to 50% of the max number of open files netdata is allowed to use (via `/etc/security/limits.conf` or systemd), to allow enough file descriptors to be available for data collection. -#### binding netdata to multiple ports +### Binding netdata to multiple ports -netdata can bind to multiple IPs and ports. Up to 100 sockets can be used -(you can increase it at compile time with `CFLAGS="-DMAX_LISTEN_FDS=200" ./netdata-installer.sh ...`). +Netdata can bind to multiple IPs and ports. Up to 100 sockets can be used (you can increase it at compile time with `CFLAGS="-DMAX_LISTEN_FDS=200" ./netdata-installer.sh ...`). The ports to bind are controlled via `[web].bind to`, like this: - + ``` [web] default port = 19999 bind to = 127.0.0.1 10.1.1.1:19998 hostname:19997 [::]:19996 localhost:19995 *:http unix:/tmp/netdata.sock ``` - + Using the above, netdata will bind to: - - IPv4 127.0.0.1 at port 19999 (port was used from `default port`) - - IPv4 10.1.1.1 at port 19998 - - All the IPs `hostname` resolves to (both IPv4 and IPv6 depending on the resolved IPs) at port 19997 - - All IPv6 IPs at port 19996 - - All the IPs `localhost` resolves to (both IPv4 and IPv6 depending the resolved IPs) at port 19996 - - All IPv4 and IPv6 IPs at port `http` as set in `/etc/services` - - Unix domain socket `/tmp/netdata.sock` - + +- IPv4 127.0.0.1 at port 19999 (port was used from `default port`) +- IPv4 10.1.1.1 at port 19998 +- All the IPs `hostname` resolves to (both IPv4 and IPv6 depending on the resolved IPs) at port 19997 +- All IPv6 IPs at port 19996 +- All the IPs `localhost` resolves to (both IPv4 and IPv6 depending the resolved IPs) at port 19996 +- All IPv4 and IPv6 IPs at port `http` as set in `/etc/services` +- Unix domain socket `/tmp/netdata.sock` + The option `[web].default port` is used when an entries in `[web].bind to` do not specify a port. -#### access lists +### Access lists Netdata supports access lists in `netdata.conf`: @@ -104,4 +101,3 @@ If you publish your netdata to the internet, you may want to apply some protecti 3. Don't use all your cpu cores for netdata (lower `[web].web server threads`) 4. Run netdata with a low process scheduling priority (the default is the lowest) 5. If possible, proxy netdata via a full featured web server (nginx, apache, etc) - |